Abstract
The tomato (Solanum lycopersicum L.), a widely cultivated and economically important vegetable crop, is subject to a number of biotic and abiotic stresses in nature. Several abiotic and biotic stresses have been demonstrated to elevate the concentration of cytosolic free Ca2+ ([Ca2+]i) in Arabidopsis due to the influx of calcium ions. In this study, recombinant aequorin was introduced into the tomato in order to investigate the change in [Ca2+]i when treated with exogenous Ca2+. This resulted in strong luminescence signals, which were mainly observed in the roots. Luminescence signals were also detected in the whole plant, including the leaves, when a surfactant (Silwet L-77) was added to coelenterazine. The concentration of [Ca2+]i increased with the dosage of NaCl/elf18. The luminescence signals also showed a lower increase in intensity with elf18 treatment compared to NaCl treatment. Furthermore, the [Ca2+]i responses to other abiotic or biotic stresses, such as H2O2 and Pep1, were also evaluated. It was found that this transgenic tomato expressing aequorin can effectively detect changes in [Ca2+]i levels. The transgenic tomato expressing aequorin represents an effective tool for detecting changes in [Ca2+]i and provides a solid basis for investigating the adaptation mechanisms of tomatoes to various abiotic and biotic stresses. Moreover, the aequorin-based system would be a highly valuable tool for studying the specificity and crosstalk of plant signalling networks under abiotic and biotic stresses in tomatoes.
1. Introduction
The tomato is a widely grown and economically important vegetable crop that faces a range of biotic and abiotic stresses in nature. These stresses can affect its early developmental stages and limit its productivity [1,2]. Tomatoes originated in western South America. They have been the subject of extensive breeding programmes with the aim of enhancing productivity, fruit quality, and resistance to environmental stresses. Tomatoes are a crucial component of the human diet, serving as the primary source of lycopene and other bioactive compounds such as carotenoids, polyphenols, and vitamin C. These compounds enhance the nutritional value and health benefits of tomatoes, including lowering blood pressure and reducing the risk of cancer. The strategic cultivation of tomatoes in China is of significant importance due to their adaptability, economic importance, and high demand in both local and international markets [3,4]. Numerous studies have been conducted to comprehend the molecular mechanisms underlying the tomato’s response to biotic and abiotic stresses, with the aim of improving yield and quality [5,6,7,8,9]. Calcium ions (Ca2⁺) play a pivotal role in plant response to these stresses, functioning as secondary messengers that activate downstream responses through calmodulins (CaMs), calcineurin B-like proteins (CBLs), and calcium-dependent protein kinases (CDPKs) [10,11]. This regulation of gene expression and metabolic processes enables plants to perceive and respond to environmental changes, thereby enhancing their stress tolerance.
Calcium (Ca) is a universal second messenger that senses and detects a range of abiotic and biotic stress stimuli, including temperature, salt, drought, wounding, and pathogen attacks. It mediates plant responses to these signals as well [12,13,14,15,16,17,18]. Protein sensors that preferentially bind Ca2+ transmit these changes in Ca2+ signatures. The signalling then cascades and activates the expression of downstream abiotic and biotic stress response genes [19,20].
Calcium signatures in plants are usually monitored non-invasively using genetically encoded calcium indicators fused with a protein or tag of interest [21]. These indicators can be classified into three types: fluorescence resonance energy transfer (FRET)-based probes, such as yellow cameleon YC2.1 [22,23] and the improved YC3.6 [24,25]; chemiluminescent reporters based on the aequorin photoprotein [26]; and GCaMP, a single fluorophore sensor fused to CaM and MLCK [27,28]. Aequorin, derived from the luminescent jellyfish Aequoria Victoria, has a low quantum yield but is more appropriate for measuring [Ca2+]i in cell populations or whole plants [21,29].
Recombinant aequorin was transferred to plant systems 30 years ago [30]. A luminescence recording system based on aequorin was subsequently developed to efficiently monitor Ca2+ responses to various stimuli in whole Arabidopsis seedlings [31]. However, due to the lack of a similar detection system, little information has been obtained from tomatoes. In this study, we have introduced recombinant aequorin into tomato plants as a reporter for [Ca2+]i. We aim to investigate the luminescence of transgenic tomatoes under abiotic and biotic stresses. We have selected common abiotic stressors, such as NaCl and H2O2, to represent abiotic stress factors. Additionally, we use peptide translation elongation factor Tu (elf18) and Plant Elicitor Peptide 1 (Pep1) as prototypical pathogen-associated molecular patterns (PAMPs) and damage-associated molecular patterns (DAMPs), respectively, due to their well-documented capacity to elicit robust immune responses in plants [32,33]. The aim is to effectively detect changes in [Ca2+]i and establish a robust platform to study tomato adaptation to various abiotic and biotic stresses.
2. Materials and Methods
2.1. Vector Construction and Transformation in Tomato
The expression vector used for transgenic research in tomatoes was obtained from Dr Ni. It contains the coding region of apoaequorin and is present in the pMAQ2 plasmid [30,34]. The plasmids were then transferred into Agrobacterium tumefaciens LBA4404 using the rapid freeze–thaw method. Tomato transformation was performed using the Agrobacterium-mediated method according to previously described protocols [35].
2.2. Plant Material and Growth Conditions
The seeds of tomatoes (Micro-Tom, Basel, Switzerland) were sterilized with 70% ethanol for 1 min and 4.5% NaClO for 15 min. After sterilization, the seeds were rinsed thoroughly with dH2O to remove any residual sterilization agents. Subsequently, they were planted in Petri dishes (150 mm × 15 mm) on a square plate containing 1/2 MS medium (Caisson Labs, Smithfield, UT, USA) supplemented with 1% (w/v) agar, 0.5% (w/v) MES, and 1.5% (w/v) sucrose (Sigma-Aldrich, St. Louis, MO, USA). The pH of the culture medium was approximately 5.8 at the end of the experiment. The plates were then transferred to a growth chamber (CU-36L4, Percival Scientific, Perry, IA, USA). The temperature, light intensity, and photoperiod were maintained at 25 ± 2 °C and ~120 μmol m−2 s−1, respectively, with a 16 h light and 8 h dark cycle for three days. Following germination, the seedlings were transferred to a new 1/2 MS medium and allowed to grow for nine days. Subsequently, the seedlings were sprayed with coelenterazine to reconstitute aequorin prior to stress treatments.
2.3. RNA Extraction and qPCR Analysis
The analysis was performed on the total RNA samples extracted from four different transgenic lines, including the roots, shoots, and leaves of 12-day-old tomato plants. Total RNA was extracted using the Tiangen Total RNA Kit, and 2 μg of RNA was used for cDNA synthesis with the FastKing RT Kit (Tiangen Biotech Co. Ltd., Beijing, China).
The quantitative real-time PCR (qPCR) was conducted using the Real Universal Color PreMix (Tiangen Biotech Co. Ltd., Beijing, China) and an eight-well optical PCR plate for each reaction. A 15 μL reaction was prepared by adding 7.5 µL of premix, 0.75 µL of forward primer, 0.75 µL of reverse primer, 1 µL of cDNA template, and 5 µL of ddH2O. A series of PCR cycle parameters was initiated, comprising one cycle of 30 s at 95 °C and 40 cycles of 10 s at 95 °C and 30 s at 60 °C. SlActin was employed as an internal control to ensure normalised gene expression levels. The primers used in this study are listed in Table 1. A melting curve was generated after the 40 cycles to confirm that a single amplified product was obtained. Each experiment was independently repeated three times. For statistical analysis, the standard t-test was used.

Table 1.
Primers used for transgenic tomato plants.
2.4. Aequorin Reconstitution and Luminescence Imaging
Seedlings were grown in a growth chamber (25 ± 2 °C, ~120 μmol m−2 s−1) for 12 days on 1/2 MS medium. Aequorin was reconstituted in vivo by spraying the seedlings with 2 mL of 10 µM coelenterazine (Prolume, Pinetop, AZ, USA) and then incubated for 12–15 h in the dark at 25 °C. For the surfactant treatment, 0.1% of Silwet L-77 (Sigma-Aldrich, St. Louis, MO, USA) was added to the coelenterazine solution.
Treatments and aequorin luminescence imaging were performed at a temperature of 22 °C using a ChemiPro HT system (Princeton Instruments, Trenton, NJ, USA) as previously described. Luminescence images were acquired with NaCl treatment or H2O2 treatment for 3 min. Luminescence images with elf18 and Pep1 treatments were recorded for 10min and 8 min, respectively. Finally, the luminescence images were analysed using WinView/32 (Roper) and ImageJ (1.53q). The curves were plotted using SigmaPlot 12.5 (Systat Software, Inc., San Jose, CA, USA).
2.5. Statistical Analysis
All results are presented as mean values and standard deviations derived from at least three replicates from three groups of ten plants per treatment and analysed using GraphPad Prism 10. A mean comparison was conducted using analysis of variance (ANOVA) with a post hoc Tukey–Kramer honest significant difference (HSD) test (for multiple comparisons) and Student’s t-test (p < 0.05). All experiments in this study were performed independently three times.
3. Results
3.1. Characterization of Transgenic Tomato Expressing Apoaequorin
To detect [Ca2+]i responses in tomatoes, we developed transgenic tomato plants constitutively expressing intracellular aequorin (Ca2+ indicator, pMAQ2) under the cauliflower mosaic virus (CMV) 35S promoter. Four independent transgenic lines (AQ-1, AQ-2, AQ-3, and AQ-4), homozygous for the T3 generation, were identified by qPCR (Figure 1a). AQ-1 and AQ-3, with different expression levels, were used for subsequent experiments.
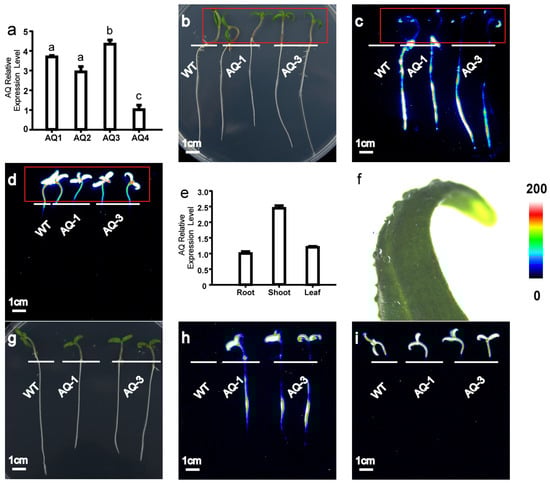
Figure 1.
Transgenic tomato harbouring Aequorin exhibited strong and diverse luminescence in tomato seedlings. (a) Expression of apoaequorin of independent lines (WT, AQ-1 to AQ-4) in transgenic tomato; (b–d) seedlings exhibited strong and diverse luminescence exclusively in roots treated with 200 mM CaCl2; (b) bright-field image; (c) pseudo-colour image of aequorin luminescence in roots; (d) pseudo-colour image of chloroplast autofluorescence. Red rectangles indicate locations of leaves, and there is no aequorin luminescence signal in leaves shown in (c). (e) Expression of apoaequorin in transgenic tomato root, shoot, and leaf by qPCR. (f) Hydrophobicity of tomato leaf wax. (g–i) Seedlings showed strong and diverse luminescence exclusively in roots and leaves treated with addition of surfactant 0.1% Silwet L-77 under 200 mM CaCl2. (g) Bright-field image; (h) pseudo-colour image of aequorin luminescence in roots; (i) pseudo-colour image of chloroplast autofluorescence. Relationship between luminescence intensity and pseudo-colour images is scaled by pseudo-colour bars. WT: wild type (Micro-Tom). Lowercase letters above bars (a) represent significant differences at p < 0.05 between respective lines.
Strong and diverse luminescence was observed in the roots of Ca2+-treated seedlings, and AQ-1, which showed the strongest luminescence, was selected for further analysis (Figure 1c). The luminescence signal based on aequorin was observed in the roots, but no signal was detected in the shoots and leaves when treated with Ca2+ (Figure 1b–d). To confirm whether apoaequorin could be expressed in the whole plant, we studied its expression in different tissues using qPCR. Our results show that apoaequorin was expressed in all of the selected tissues (Figure 1e). It is possible that the waxy cuticle of the leaves prevents the penetration of coelenterazine (Figure 1f). However, when we added a surfactant (Silwet L-77, Sigma-Aldrich, St. Louis, MO, USA) to coelenterazine, we observed luminescence signals in the whole plant (Figure 1g–i). The results indicate that the transgenic tomato expressing apoaequorin is capable of reflecting [Ca2+]i levels in both the roots and leaves.
3.2. [Ca2+]i Increase in Tomato Roots Can Be Monitored under NaCl/elf18 Treatment
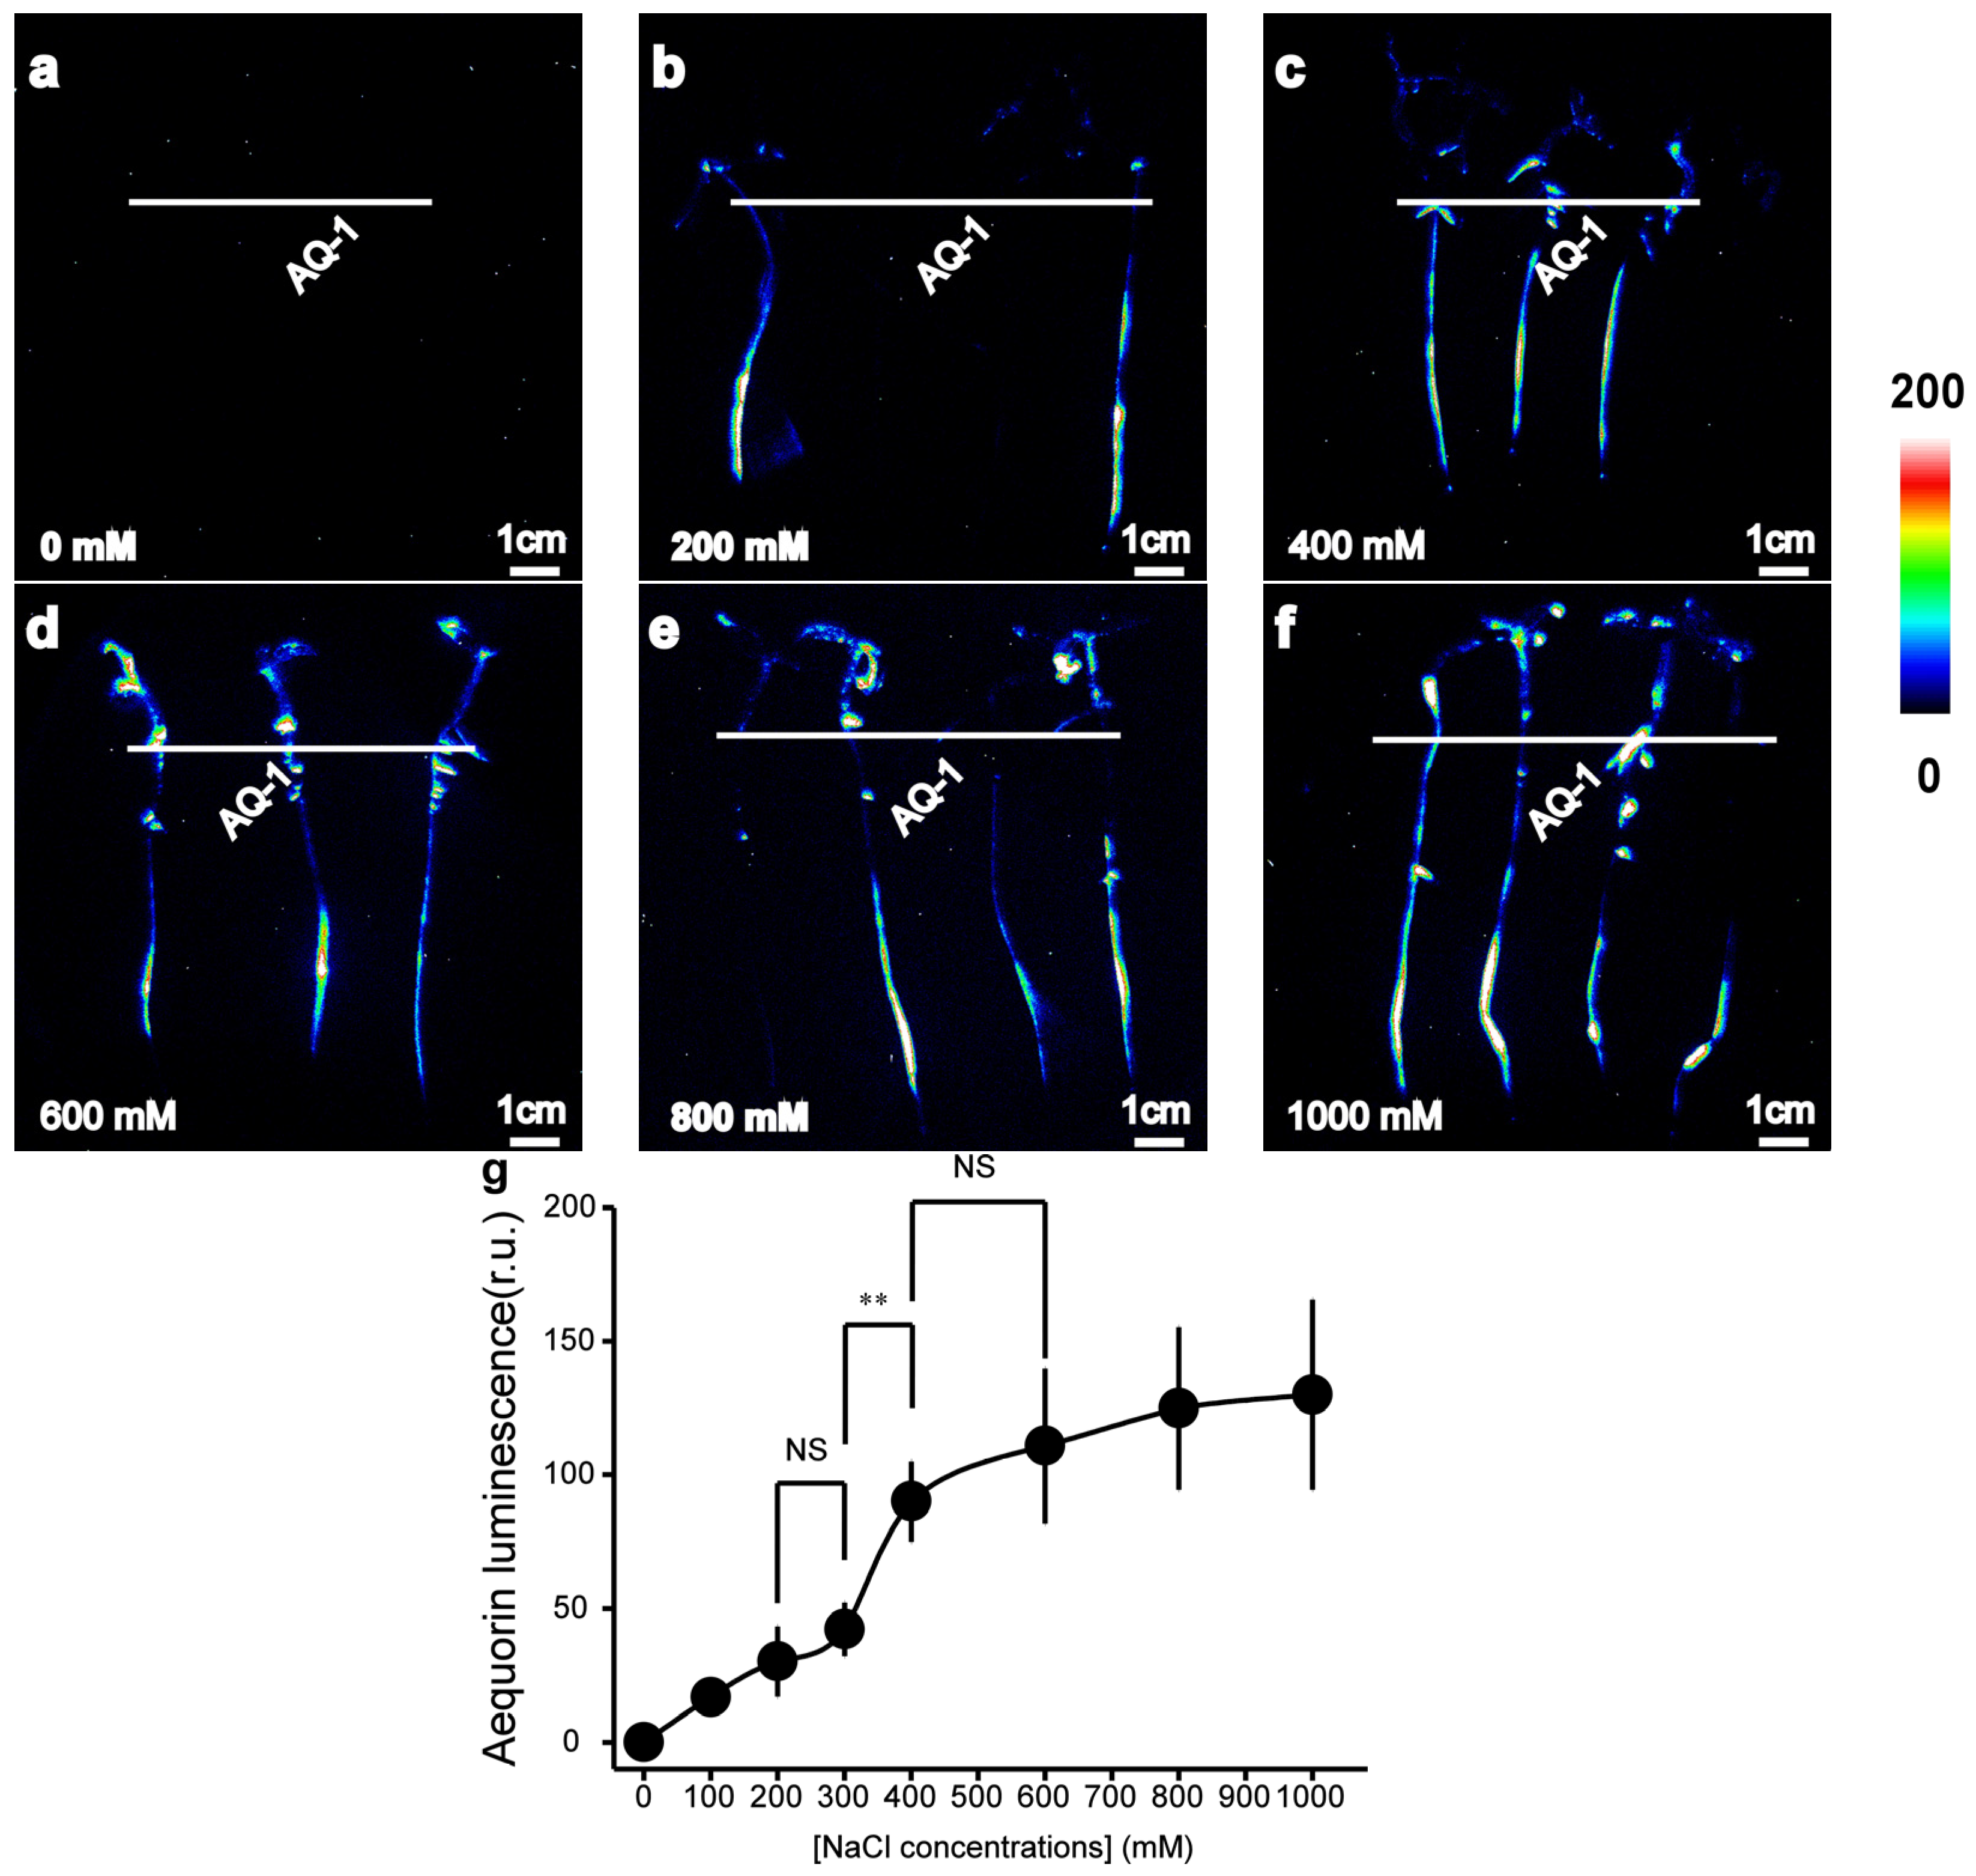
To investigate whether transgenic tomato plants expressing apoaequorin are capable of detecting [Ca2+]i changes in tomato roots in response to abiotic or biotic stresses, we measured the aequorin-based luminescence under different concentrations of NaCl/elf18 treatments. The intensity of the [Ca2+]i-dependent luminescence signals was found to be related to the strength of the applied salt stimuli (Figure 2a). NaCl treatment successfully induced a detectable increase in luminescence signals. The effect of the treatment with 400 mM NaCl was more pronounced than that of the treatment with 200 mM NaCl, and it displayed a high similarity with the treatment with 600 mM NaCl (Figure 2a). The average luminescence intensity of tomato roots in response to different concentrations of NaCl treatment was calculated. It was found that the luminescence intensity increased rapidly within the concentration range of NaCl concentrations (300 mM to 400 mM). The [Ca2+]i responses in the roots of tomato plants were not significantly affected by NaCl treatments outside this range (Figure 2b).
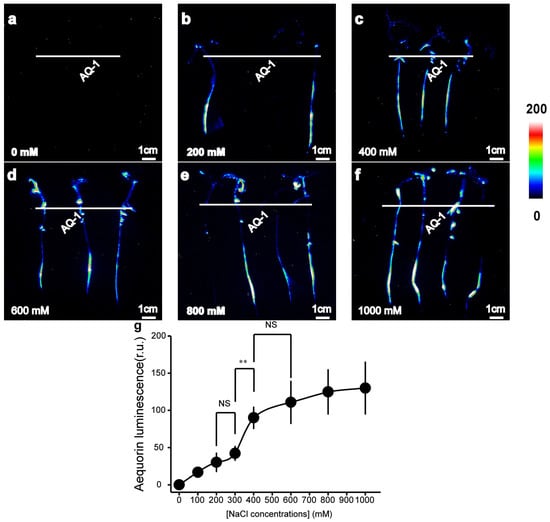
Figure 2.
Aequorin-based luminescence in roots under different NaCl treatments. (a–f) Pseudo-colour images of aequorin luminescence in roots treated with different concentrations of NaCl. The relationship between the luminescence intensity and the pseudo-colour images is scaled by a pseudo-colour bar. (g) The line chart of the luminescence signal intensity in tomato roots under NaCl treatments. The data from independent experiments are shown (mean ± SD; n = 15; ** p < 0.01; NS, not significant p > 0.05).
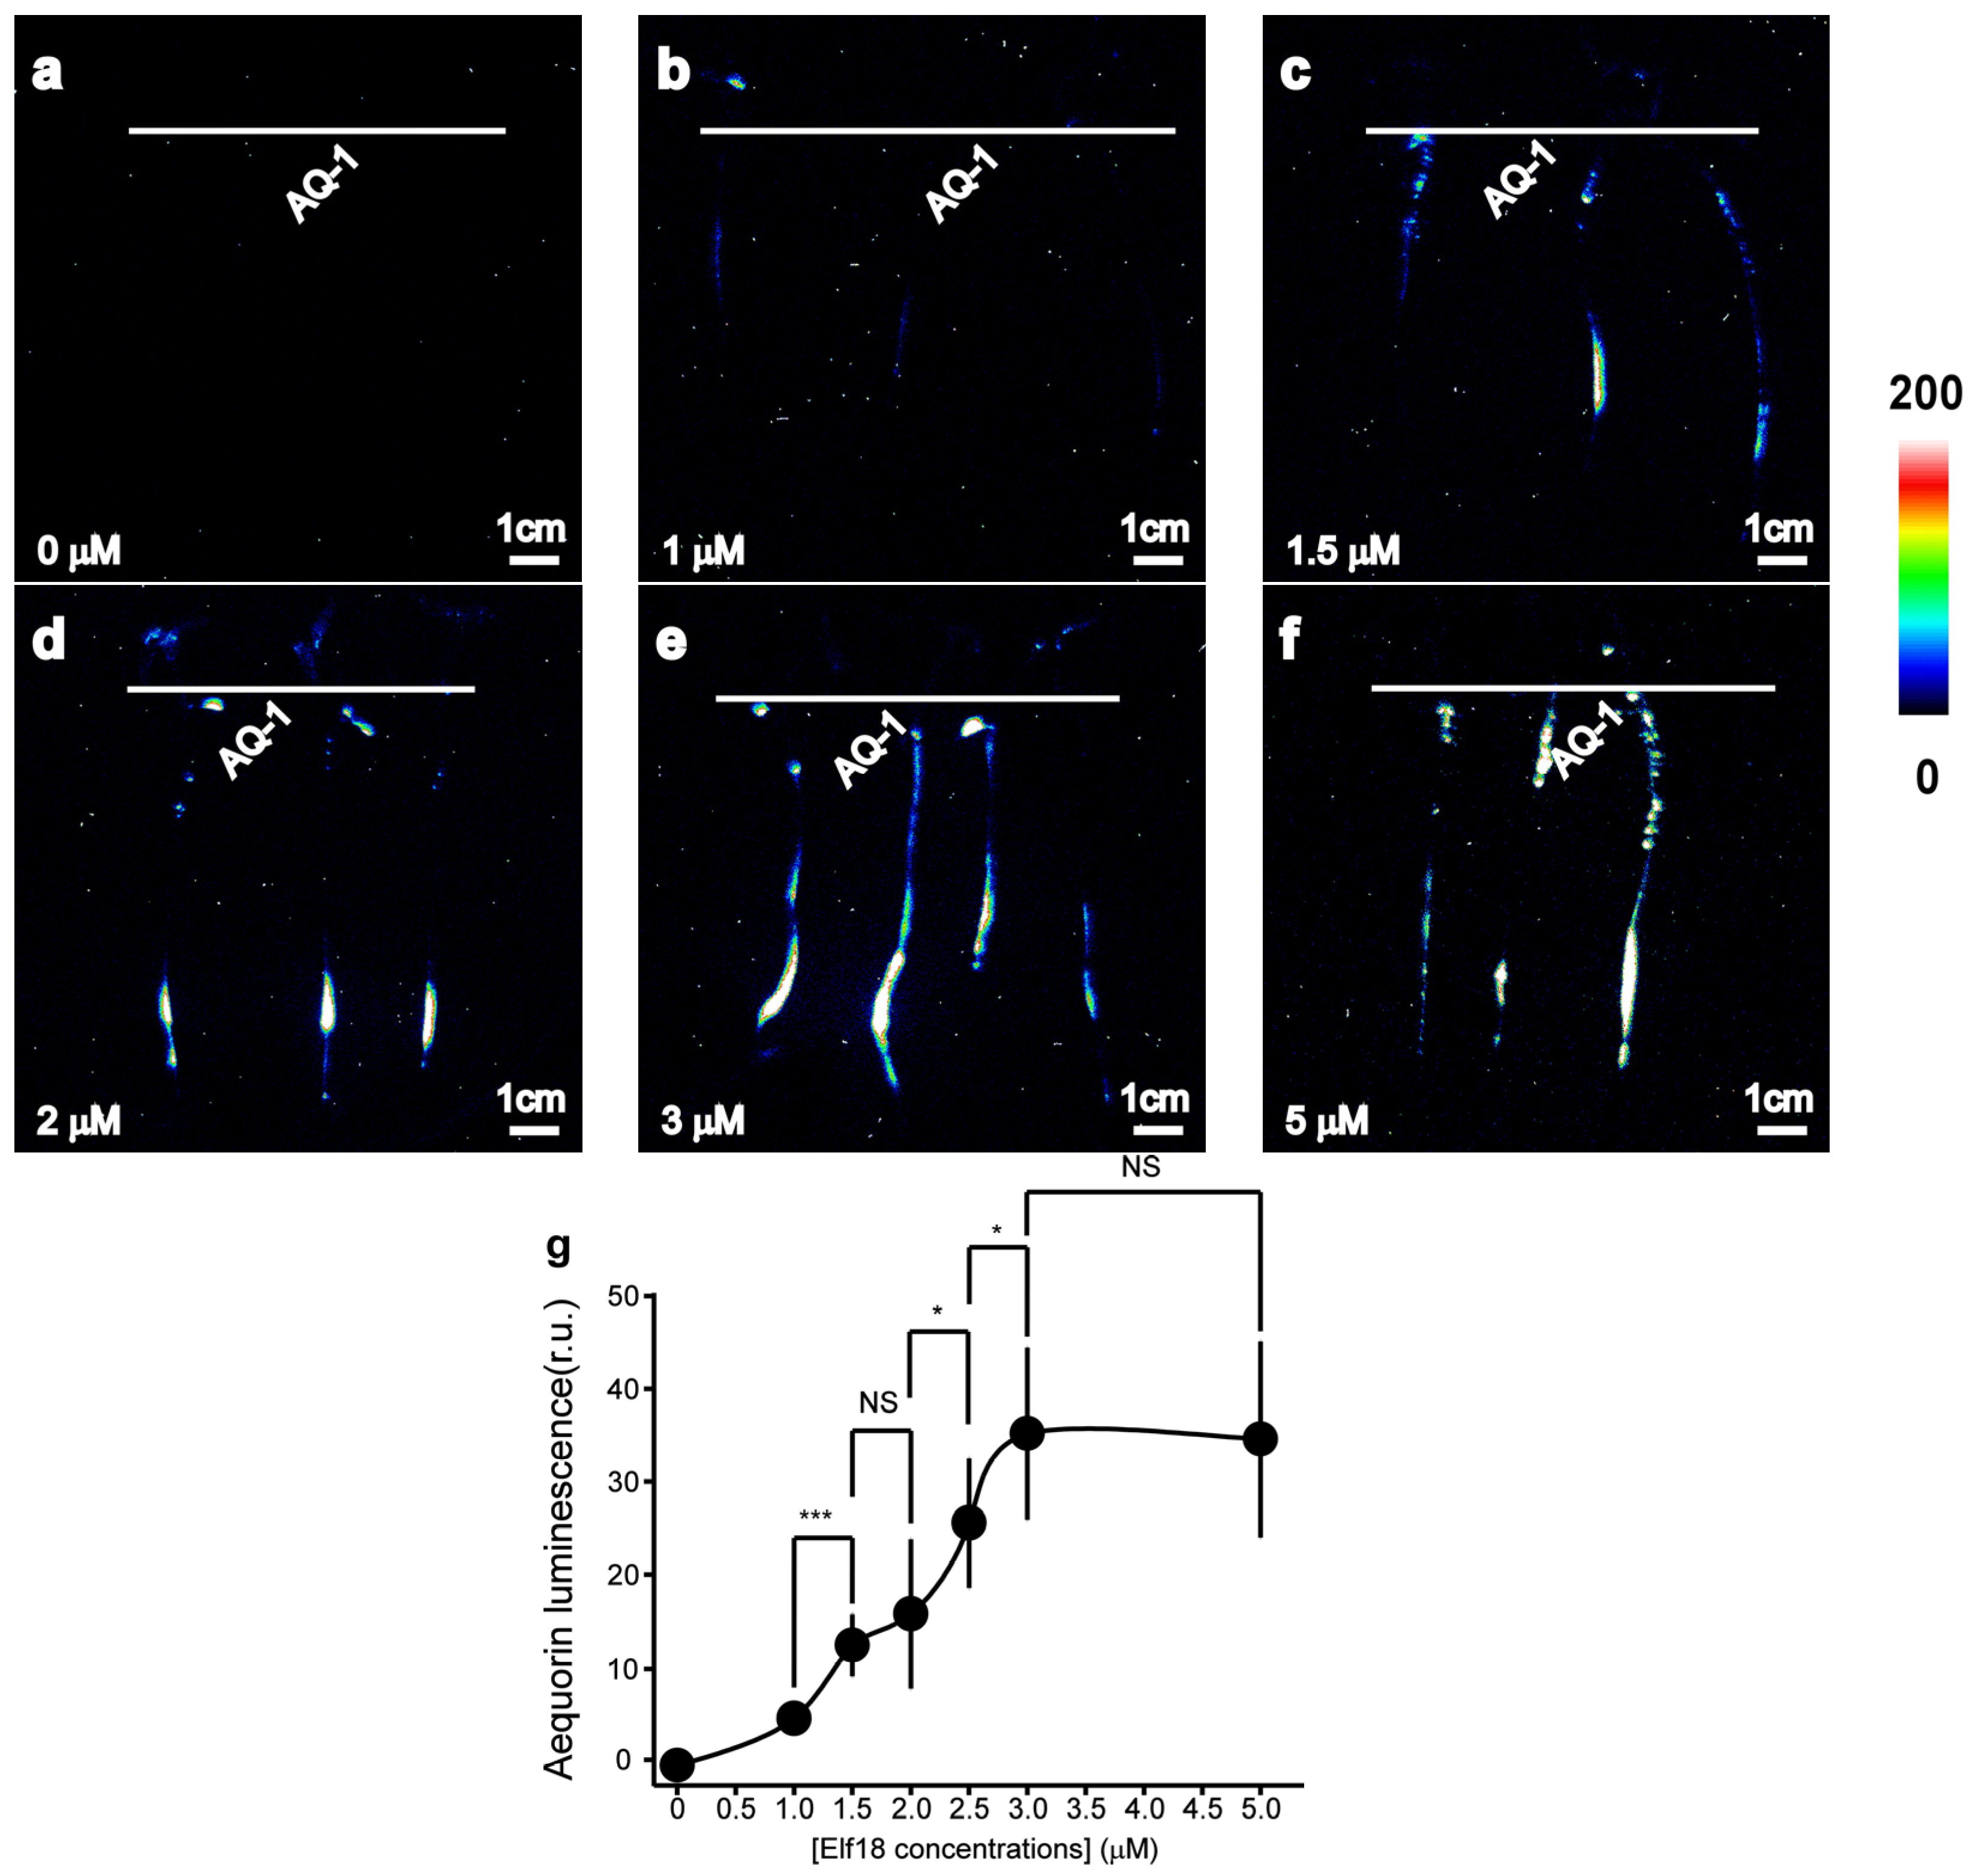
Elf18 induced a concentration-dependent increase in the luminescence signal (Figure 3). The effect was more pronounced with 1.5 μM elf18 than with 1 μM (Figure 3b,c), and the effect of the 3 μM elf18 treatment was similar to that of the 5 μM elf18 treatment (Figure 3e,f). The average luminescence intensity of tomato roots in response to varying concentrations of elf18 treatment was calculated. This study revealed a notable and swift rise in luminescence intensity within a specific concentration range of elf18 treatment (1 μM to 3 μM) (Figure 3b).
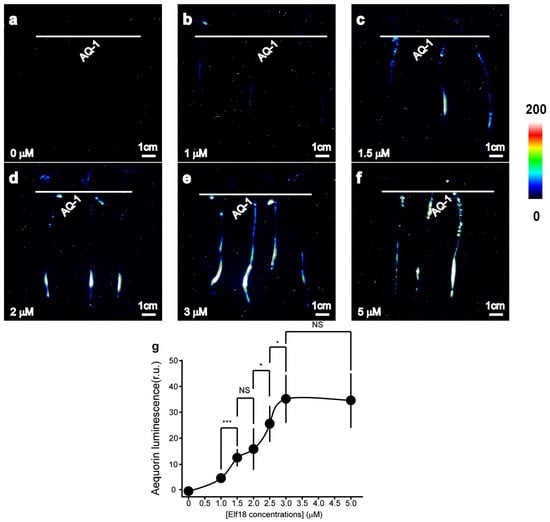
Figure 3.
Aequorin-based luminescence in roots treated with elf18. (a–f) Pseudo-colour images of aequorin luminescence in roots treated with different concentrations of elf18. The relationship between the luminescence intensity and the pseudo-colour images is scaled by a pseudo-colour bar. (g) The line chart of the luminescence signal intensity in tomato roots under elf18 treatments. The data from independent experiments are shown (mean ± SD; n = 15; * p < 0.05; *** p < 0.001; NS, not significant p > 0.05).
3.3. [Ca2+]i Increase in Tomato Roots and Leaves Can Be Monitored under H2O2 or Pep1 Treatment
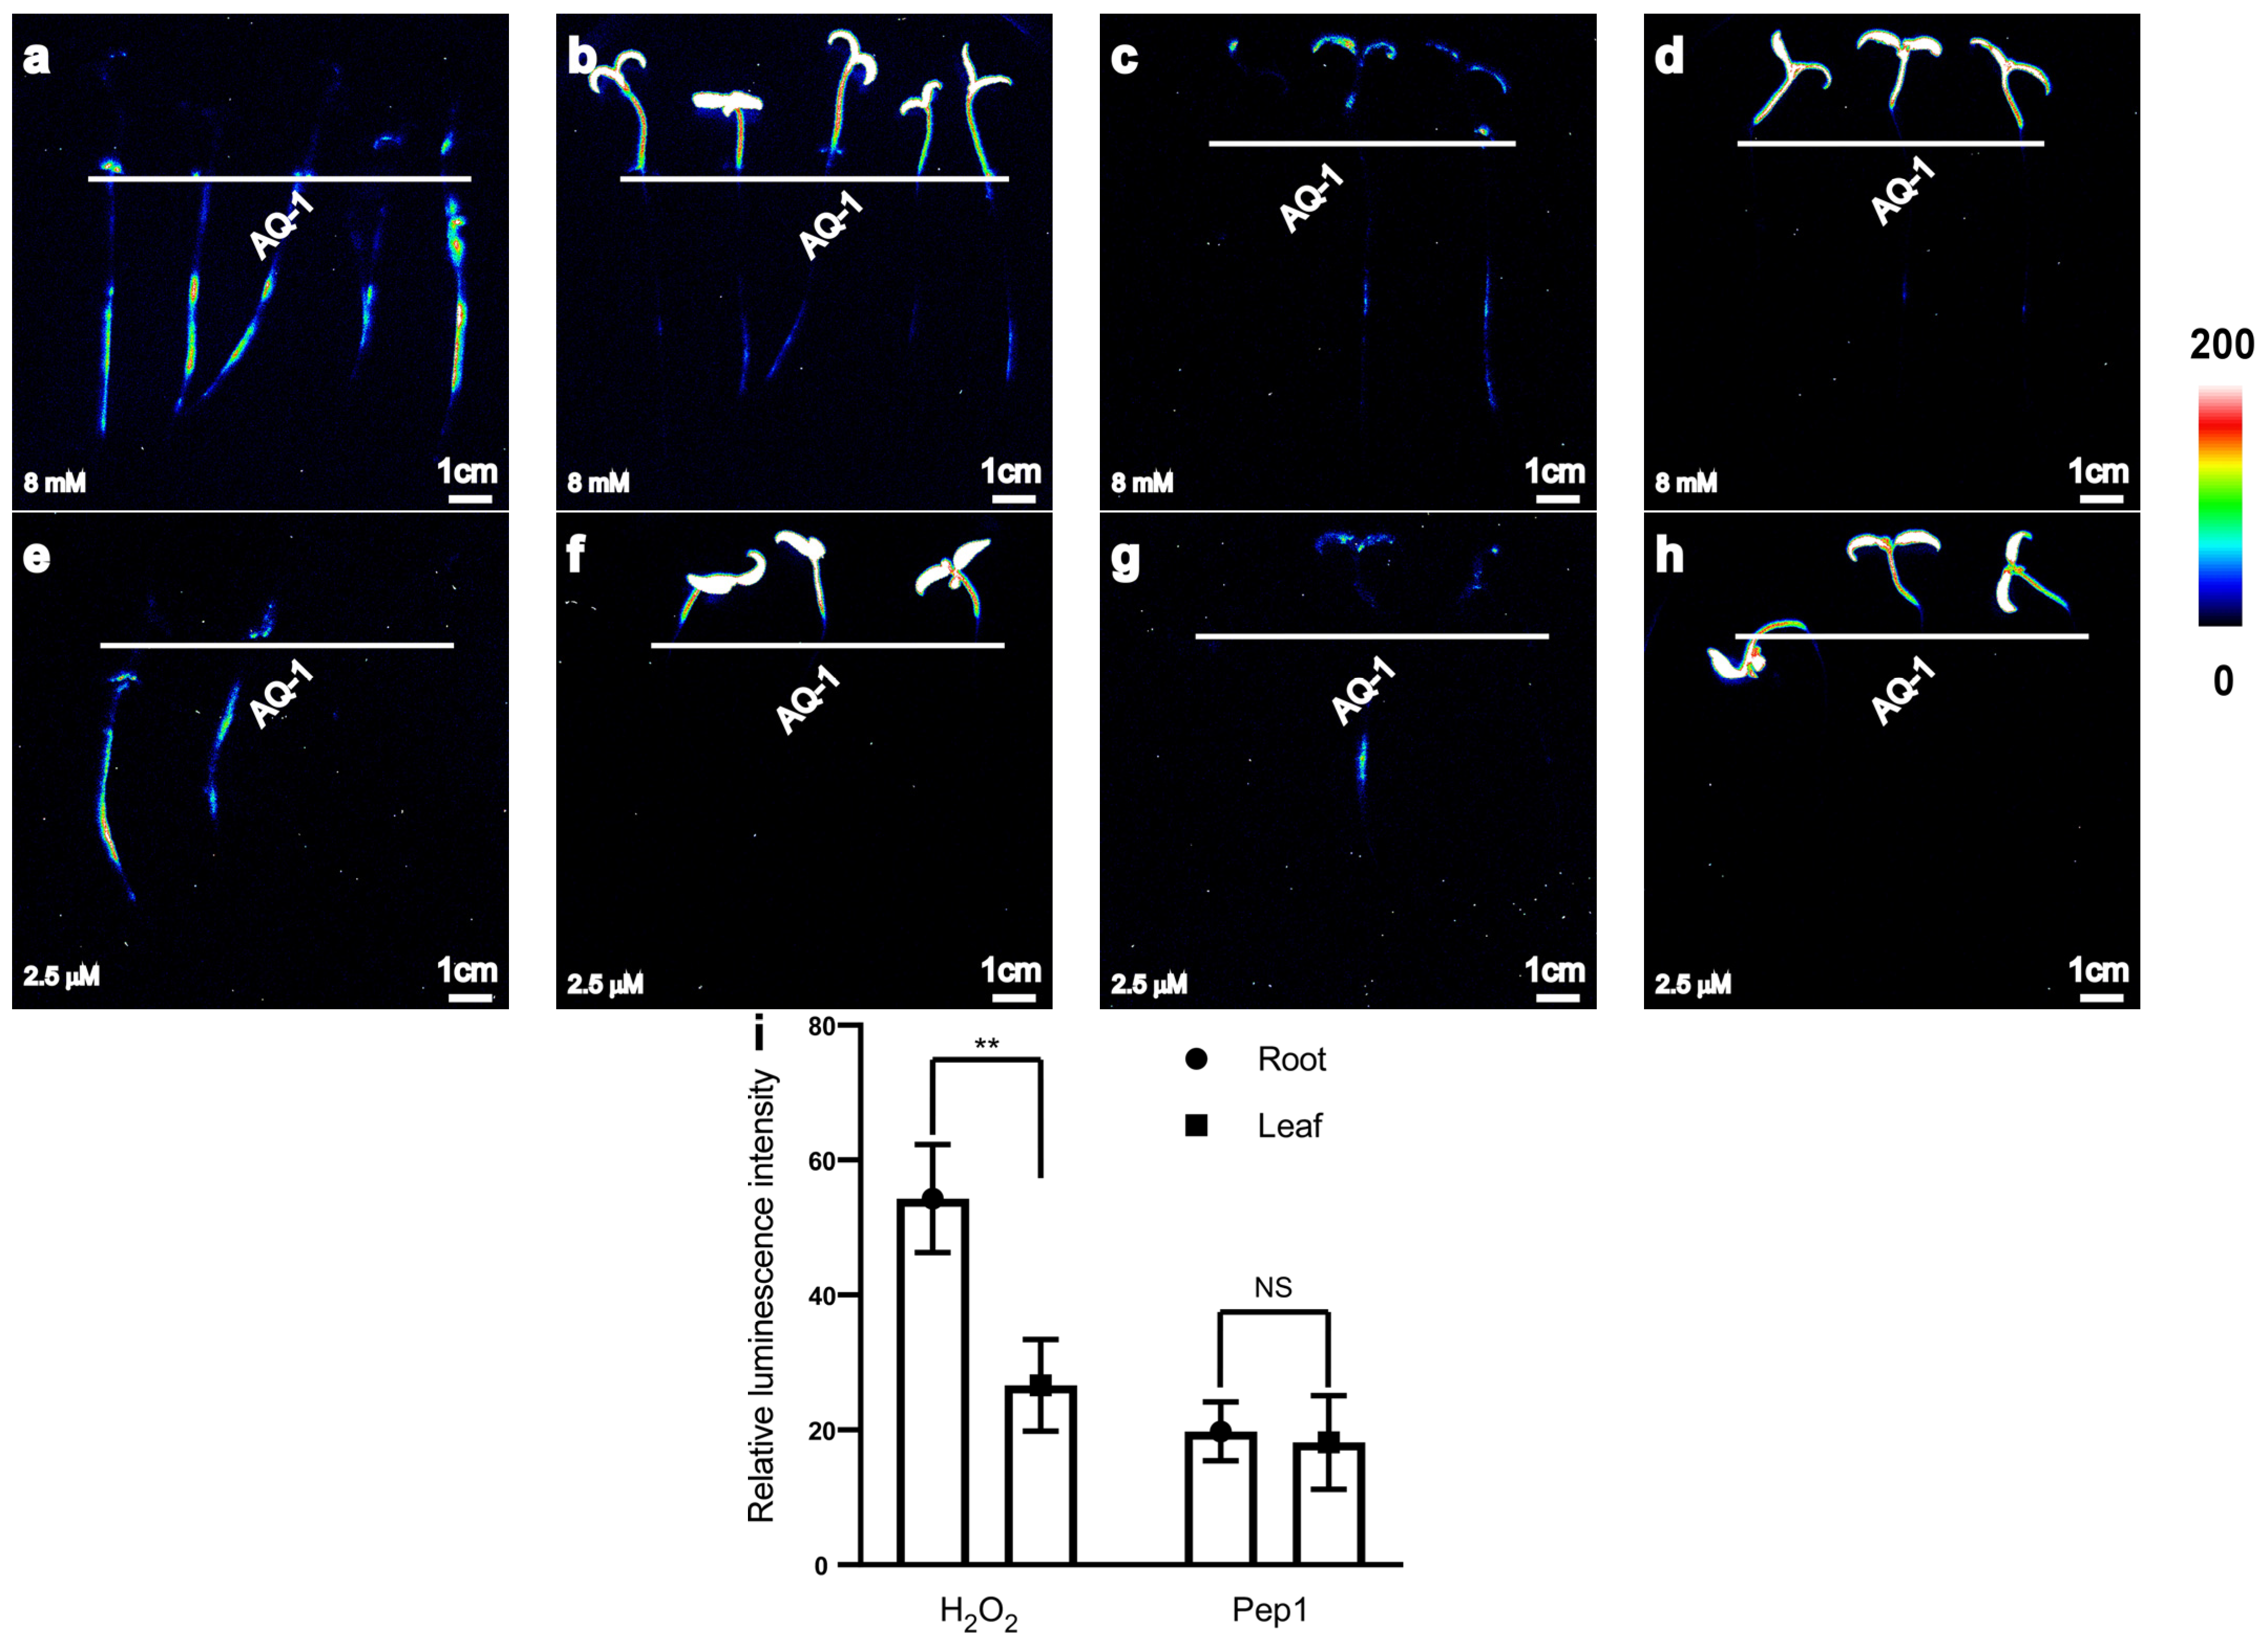
With the aim of adapting the apoaequorin-expressing transgenic tomato for a simple, highly sensitive, and stable method of recording Ca2+ responses to various stimuli, we further investigated the use of the system for recording Ca2+ signals in response to other abiotic or biotic stresses to confirm the availability of [Ca2+]i changes in the apoaequorin-expressing transgenic tomato. A visible concentration of luminescence signals was successfully induced in both tomato roots and leaves by 8 mM H2O2 or 2.5 μM Pep1 (Figure 4a–h).
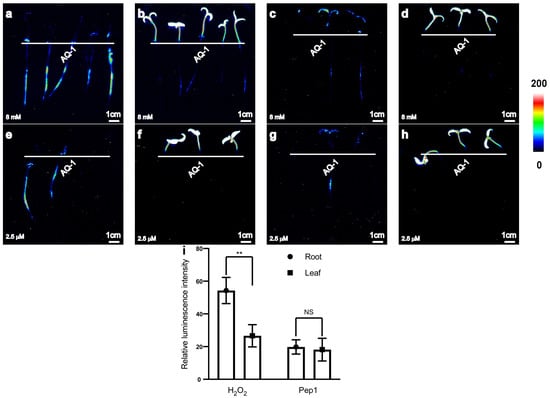
Figure 4.
Transgenic tomato seedlings expressing apoaequorin exhibited different luminescence signals in roots and leaves. (a–d) Pseudo-colour images of aequorin luminescence in tomato without (a) or with (c) addition of surfactant 0.1% Silwet L-77 under 8 mM H2O2 treatments; pseudo-colour images of chloroplast autofluorescence in tomato without (b) or with (d) addition of surfactant 0.1% Silwet L-77 under 8 mM H2O2 treatments. (e–h) Pseudo-colour images of aequorin luminescence in tomato without (e) or with (g) addition of 0.1% Silwet L-77 under 2.5 µM Pep1 treatments; pseudo-colour images of chloroplast autofluorescence in tomato without (f) or with (h) addition of surfactant 0.1% Silwet L-77 under 2.5 µM Pep1 treatments. Pseudo-colour images are scaled by pseudo-colour bars. (i) Column chart of luminescence signal intensity in tomato without or with addition of surfactant 0.1% Silwet L-77 under 8 mM H2O2 or 2.5 μM Pep1 (a–h). Data from independent experiments are shown (mean ± SD; n = 15; ** p < 0.01; NS, not significant p > 0.05).
The different abiotic or biotic stimuli can also induce an increase in [Ca2+]i, and these signals can be monitored in both the leaves and roots using the apoaequorin-expressing transformation system. At the same concentration, the average luminescence intensity of tomato roots was higher than that of leaves under H2O2 treatment, whereas the average luminescence intensity in tomato roots and leaves was similar under Pep1 treatment (Figure 4i).
4. Discussion
The use of apoaequorin expression in plants has proven to be a useful tool for investigating Ca2+-mediated signalling in response to various stresses in whole seedlings in a non-invasive manner [30,31,34]. This study presents a method for monitoring changes in [Ca2+]i in tomatoes by expressing apoaequorin. The luminescence patterns of tomato seedlings at different developmental stages were examined. In this study, we transferred recombinant aequorin into tomato plants as a reporter of [Ca2+]i. The luminescence of transgenic tomatoes was strong in the roots treated with exogenous Ca2+. This study observed a rapid increase in cytosolic calcium concentration in response to NaCl or elf18 treatments in plants. The luminescence signals also showed a lower increase in intensity with elf18 treatment compared to NaCl treatment. Additionally, Ca2+ signalling was also detected in response to H2O2 or Pep1 in the tomatoes. Transgenic tomatoes expressing apoaequorin can efficiently detect changes in [Ca2+]i and provide a good platform to study tomato adaptation to different abiotic/biotic stresses. This study also shows that luminescence is consistently detectable during the growth of true leaves in plants, making this period optimal for detection. Luminescence is weakened in seedlings that are too small or have already developed cotyledons or lateral roots.
The transformation system of recombinant aequorin was used to compare various stimuli, including abiotic and biotic stresses, which induce Ca2+ responses in tomato seedlings. Initially, aequorin luminescence was confined to tomato roots. However, the expression of apoaequorin was widespread, as demonstrated in Figure 1b–e. Although leaf wax did not obstruct aequorin luminescence due to the chloroplast autofluorescence emitted from the leaf cells (Figure 1d), it is speculated that the leaf wax could hinder the penetration of coelenterazine, resulting in undetected aequorin luminescence (Figure 1c). To aid the penetration of coelenterazine through the leaf wax, a surfactant (0.1% Silwet L-77) was used. Both luminescence signals were detected in the roots and leaves (Figure 1h). The luminescence signals in the leaves were lower than those in the roots (Figure 4). It is suspected that the toxic effect of the surfactant on tomato roots was the same at the same concentration stimulus. These results are consistent with the luminescence signals in rice [34]. The system was found to be suitable for reflecting the [Ca2+]i levels in tomato roots but not in leaves, especially under biotic stress.
This study analysed the changes in [Ca2+]i levels in response to varying concentrations of salt stress. The results indicate that the [Ca2+]i levels increased with NaCl dosage within a certain range and were particularly sensitive between 200 mM and 300 mM NaCl (Figure 2b). However, severe salt stress (above 400 mM NaCl) did not significantly increase [Ca2+]i levels compared to salt stress at 400 mM NaCl. It is worth noting that tomato plants exhibit moderate salt resistance [36]. The detection system became saturated, preventing the detection of stronger luminescent signals after treatment with high concentrations of NaCl/elf18. It is possible that stress levels higher than 400 mM NaCl/3 μM elf18 can significantly increase [Ca2+]i and go undetected by our system. Treatment with 100 mM NaCl or 1 μM elf18 can induce an increase in [Ca2+]i and the expression of many salt/elf18 response genes [37,38]. It has been reported that H2O2 or Pep1 induce a biphasic increase in [Ca2+]i in Arabidopsis [39,40]. Our experiment yielded similar results, detecting the luminescence signals with H2O2 or Pep1.
In fact, there are more sensitive and non-invasive calcium imaging techniques in plants, such as Yellow Cameleon 3.6 [24,25] and ratiometric matryoshka biosensors [24,27,41]. However, the above techniques cannot be used to screen for tomato mutants that are specifically defective in different stress-induced increases in [Ca2+]i. The system we have established can be used to find the sensor using calcium imaging-based unbiased forward genetic screens, as has been done in Arabidopsis [42,43].
5. Conclusions
We have established a calcium reporter line in tomato using aequorin luminescence. [Ca2+]i responses to abiotic or biotic stresses, such as NaCl, H2O2, elf18, and Pep1, were evaluated. Furthermore, the concentration of [Ca2+]i increased with the dosage of NaCl/elf18. The aequorin-based system developed in this study provides a powerful tool for studying Ca2+ signalling in response to different stimuli and identifying plant sensors under all kinds of stresses. The system was used to test the responses of [Ca2+]i changes to NaCl, elf18, H2O2, and Pep1 in tomato leaves and roots. When combined with other techniques, this system based on aequorin would be a very useful tool to study the specificity and crosstalk of plant signalling networks under abiotic and biotic stresses in tomato.
Author Contributions
Conceptualization, X.L. (Xunyan Liu); Methodology, L.L. and X.L. (Xiaofei Li); Software, L.L. and X.L. (Xiaofei Li); Validation, L.L., X.L. (Xiaofei Li) and X.L. (Xunyan Liu); Formal analysis, X.L. (Xiaofei Li) and Y.T.; Investigation, Y.T. and X.L. (Xunyan Liu); Resources, X.L. (Xunyan Liu); Data curation, L.L. and X.L. (Xunyan Liu); Writing—original draft, X.L. (Xunyan Liu); Writing—review & editing, Y.T. and X.L. (Xunyan Liu); Visualization, L.L.; Supervision, X.L. (Xunyan Liu); Project administration, X.L. (Xunyan Liu); Funding acquisition, X.L. (Xunyan Liu). All authors have read and agreed to the published version of the manuscript.
Funding
This study was funded by the Zhejiang Province Public Welfare Technology Application Research Project, grant number LGN18C020005, and the Zhejiang Major Scientific and Technological Project of Agricultural (Upland crop) Breeding, grant number 2021C02064-6.
Data Availability Statement
The original contributions presented in the study are included in the article, further inquiries can be directed to the corresponding author.
Acknowledgments
We thank Jun Ni for providing the expression vector used for the tomato transgenic research.
Conflicts of Interest
The authors declare no conflicts of interest.
References
- Verma, S.; Chug, A.; Singh, A.P. Application of convolutional neural networks for evaluation of disease severity in tomato plant. J. Discret. Math. Sci. C 2020, 23, 273–282. [Google Scholar] [CrossRef]
- Waqas, M.A.; Kaya, C.; Riaz, A.; Farooq, M.; Nawaz, I.; Wilkes, A.; Li, Y. Potential mechanisms of abiotic stress tolerance in crop plants induced by thiourea. Front. Plant Sci. 2019, 10, 1336. [Google Scholar] [CrossRef] [PubMed]
- Kimura, S.; Sinha, N. Tomato (Solanum lycopersicum): A Model Fruit-Bearing Crop. CSH Protoc. 2008, 2008, pdb.emo105. [Google Scholar] [CrossRef] [PubMed]
- León-García, E.; Coronel, O.A.D.Á.; Vela-Gutiérrez, G.; Medina, J.D.L.C.; García, H.S. Tomato (Solanum lycopersicum). In Fruit and Vegetable Phytochemicals, 2nd ed.; Yahia, E.M., Ed.; Wiley-Blackwell: Hoboken, NJ, USA, 2017; Chapter 68; pp. 1259–1278. [Google Scholar]
- Bai, Y.L.; Sunarti, S.; Kissoudis, C.; Visser, R.G.F.; Van der Linden, C.G. The role of tomato WRKY genes in plant responses to combined abiotic and biotic Stresses. Front. Plant Sci. 2018, 9, 801. [Google Scholar] [CrossRef] [PubMed]
- Liang, X.Q.; Ma, N.N.; Wang, G.D.; Meng, X.; Ai, X.Z.; Meng, Q.W. Suppression of SlNAC1 reduces heat resistance in tomato plants. Biol. Plantarum 2015, 59, 92–98. [Google Scholar] [CrossRef]
- Li, Q.; Shen, H.; Yuan, S.; Dai, X.; Yang, C. miRNAs and lncRNAs in tomato: Roles in biotic and abiotic stress responses. Front. Plant Sci. 2022, 13, 1094459. [Google Scholar] [CrossRef] [PubMed]
- Hieu, P.V.; Toan, T.B. Agricultural development based on CRISPR-CAS9 and Retrons techniques: A perspective application on tomato. Sabrao J. Breed. Genet. 2023, 55, 237–253. [Google Scholar] [CrossRef]
- Ali, M.S.; Baek, K.H. Jasmonic acid signaling pathway in response to abiotic stresses in plants. Int. J. Mol. Sci. 2020, 21, 621. [Google Scholar] [CrossRef] [PubMed]
- Gupta, S.; Kaur, N.; Kant, K.; Jindal, P.; Ali, A.; Naeem, M. Calcium: A master regulator of stress tolerance in plants. S. Afr. J. Bot. 2023, 163, 580–594. [Google Scholar] [CrossRef]
- Naz, M.; Afzal, M.R.; Raza, M.A.; Pandey, S.; Qi, S.; Dai, Z.; Du, D. Calcium (Ca2+) signaling in plants: A plant stress perspective. S. Afr. J. Bot. 2024, 169, 464–485. [Google Scholar] [CrossRef]
- Poovaiah, B.W.; McFadden, J.J.; Reddy, A.S. The role of calcium ions in gravity signal perception and transduction. Physiol. Plant 1987, 71, 401–407. [Google Scholar] [CrossRef]
- Poovaiah, B.W.; Reddy, A.S. Calcium and signal transduction in plants. CRC Crit. Rev. Plant Sci. 1993, 12, 185–211. [Google Scholar] [CrossRef] [PubMed]
- Trewavas, A.; Malho, R. Ca2+ signalling in plant cells: The big network! Curr. Opin. Plant Biol. 1998, 1, 428–433. [Google Scholar] [CrossRef] [PubMed]
- Reddy, A. Calcium: Silver bullet in signaling. Plant Sci. 2001, 160, 381–404. [Google Scholar] [CrossRef] [PubMed]
- Xiong, L.; Schumakerm, K.S.; Zhu, J.K. Cell signaling during cold, drought, and salt stress. Plant Cell 2002, 14, S165–S183. [Google Scholar] [CrossRef] [PubMed]
- Sanders, D.; Pelloux, J.; Brownlee, C.; Harper, J. Calcium at the crossroads of signaling. Plant Cell 2002, 14, S401–S417. [Google Scholar] [CrossRef] [PubMed]
- Gong, Z.; Xiong, L.; Shi, H.; Yang, S.H.; Herrera-Estrella, L.R.; Xu, G.H.; Chao, D.Y.; Li, J.R.; Wang, P.Y.; Qin, F.; et al. Plant abiotic stress response and nutrient use efficiency. Sci. China Life Sci. 2020, 63, 635–674. [Google Scholar] [CrossRef]
- Batistic, O.; Kudla, J. Analysis of calcium signaling pathways in plants. Biochim. Biophys. Acta 2012, 1820, 1283–1293. [Google Scholar] [CrossRef]
- Luan, S. The CBL-CIPK network in plant calcium signaling. Trends Plant Sci. 2009, 14, 37–42. [Google Scholar] [CrossRef]
- Monshausen, G.B. Visualizing Ca2+ signatures in plants. Curr. Opin. Plant Biol. 2012, 15, 677–682. [Google Scholar] [CrossRef]
- Miyawaki, A.; Llopis, J.; Heim, R.; McCaffery, J.M.; Adams, J.A.; Ikura, M.; Tsien, R.Y. Fluorescent indicators for Ca2+ based on green fluorescent proteins and calmodulin. Nature 1997, 388, 882–887. [Google Scholar] [CrossRef] [PubMed]
- Miyawaki, A.; Griesbeck, O.; Heim, R.; Tsien, R.Y. Dynamic and quantitative Ca2+ measurements using improved cameleons. Proc. Natl. Acad. Sci. USA 1999, 96, 2135–2140. [Google Scholar] [CrossRef] [PubMed]
- Nagai, T.; Yamada, S.; Tominaga, T.; Ichikawa, M.; Miyawaki, A. Expanded dynamic range of fluorescent indicators for Ca2+ by circularly permuted yellow fluorescent proteins. Proc. Natl. Acad. Sci. USA 2004, 101, 10554–10559. [Google Scholar] [CrossRef] [PubMed]
- Swanson, S.J.; Gilroy, S. Imaging changes in cytoplasmic calcium using the Yellow Cameleon 3.6 biosensor and confocal microscopy. Methods Mol. Biol. 2013, 1009, 291–302. [Google Scholar]
- Nakai, J.; Ohkura, M.; Imoto, K. Recombinant aequorin as tool for monitoring calcium concentration in subcellular compartments. Methods Enzymol. 2000, 327, 440–456. [Google Scholar]
- Nakai, J.; Ohkura, M.; Imoto, K. A high signal-to-noise Ca2+ probe composed of a single green fluorescent protein. Nat. Biotechnol. 2001, 19, 137–141. [Google Scholar] [CrossRef] [PubMed]
- Ohkura, M.; Matsuzaki, M.; Kasai, H.; Imoto, K.; Nakai, J. Genetically encoded bright Ca2+ probe applicable for dynamic Ca2+ imaging of dendritic spines. Anal. Chem. 2005, 77, 5861–5869. [Google Scholar] [CrossRef]
- Campbell, A.K.; Trewavas, A.J.; Knight, M.R. Calcium imaging shows differential sensitivity to cooling and communication in luminous transgenic plants. Cell Calcium 1996, 19, 211–218. [Google Scholar] [CrossRef] [PubMed]
- Knight, M.R.; Campbell, A.K.; Smith, S.M.; Trewavas, A.J. Transgenic plant aequorin reports the effects of touch and cold-shock and elicitors on cytoplasmic calcium. Nature 1991, 352, 524–526. [Google Scholar] [CrossRef]
- Zhu, X.H.; Feng, Y.; Liang, G.M.; Liu, N.; Zhu, J.K. Aequorin-based luminescence imaging reveals stimulus- and tissue-specific Ca2+ dynamics in Arabidopsis Plants. Molecular Plant 2013, 6, 444–455. [Google Scholar] [CrossRef]
- Ngou, B.P.M.; Ahn, H.K.; Ding, P.; Jones, J.D.G. Mutual potentiation of plant immunity by cell-surface and intracellular receptors. Nature 2021, 592, 110–115. [Google Scholar] [CrossRef] [PubMed]
- Yamaguchi, K.; Kawasaki, T. Pathogen- and plant-derived peptides trigger plant immunity. Peptides 2021, 144, 170611. [Google Scholar] [CrossRef]
- Zhang, Y.; Wang, Y.; Taylor, J.L.; Jiang, Z.; Zhang, S.; Mei, F.; Wu, Y.; Wu, P.; Ni, J. Aequorin-based luminescence imaging reveals differential calcium signalling responses to salt and reactive oxygen species in rice roots. J. Exp. Bot. 2015, 66, 2535–2545. [Google Scholar] [CrossRef] [PubMed]
- Sun, H.J.; Uchii, S.; Watanabe, S.; Ezura, H. A highly efficient transformation protocol for Micro-Tom, a model cultivar for tomato functional genomics. Plant Cell Physiol. 2006, 47, 426–431. [Google Scholar] [CrossRef] [PubMed]
- Cuartero, J.; Fernández-Muñoz, R. Tomato and salinity. Sci. Hortic. 1999, 78, 83–125. [Google Scholar] [CrossRef]
- Seo, J.S.; Diloknawarit, P.; Park, B.S.; Chua, N.H. ELF18-INDUCED LONG NONCODING RNA 1 evicts fibrillarin from mediator subunit to enhance PATHOGENESIS-RELATED GENE 1 (PR1) expression. New Phytol. 2019, 221, 2067–2079. [Google Scholar] [CrossRef]
- Ouyang, B.; Yang, T.; Li, H.; Zhang, L.; Zhang, Y.; Zhang, J.; Fei, Z.; Ye, Z. Identification of early salt stress response genes in tomato root by suppression subtractive hybridization and microarray analysis. J. Exp. Bot. 2007, 58, 507–520. [Google Scholar] [CrossRef] [PubMed]
- Rentel, M.C.; Knight, M.R. Oxidative stress-induced calcium signaling in Arabidopsis. Plant Physiol. 2004, 135, 1471–1479. [Google Scholar] [CrossRef] [PubMed]
- Cao, X.; Jiang, Z.; Yi, Y.; Yang, Y.; Ke, L.; Pei, Z.; Zhu, S. Biotic and abiotic stresses activate different Ca2+ permeable channels in Arabidopsis. Front. Plant Sci. 2017, 8, 83. [Google Scholar] [CrossRef]
- Ast, C.; Foret, J.; Oltrogge, L.M.; De Michele, R.; Kleist, T.J.; Ho, C.H.; Frommer, W.B. Ratiometric Matryoshka biosensors from a nested cassette of green- and orange-emitting fluorescent proteins. Nat. Commun. 2017, 8, 431. [Google Scholar] [CrossRef]
- Jiang, Z.H.; Zhu, S.; Ye, R.; Xue, Y.; Chen, A.; An, L.Z.; Pei, Z.M. Relationship between NaCl- and H2O2-induced cytosolic Ca2+ increases in response to stress in Arabidopsis. PLoS ONE 2013, 8, e76130. [Google Scholar]
- Yuan, F.; Yang, H.; Xue, Y.; Kong, D.; Ye, R.; Li, C.; Zhang, J.; Theprungsirikul, L.; Shrift, T.; Krichilsky, B.; et al. OSCA1 mediates osmotic-stress-evoked Ca2+ increases vital for osmosensing in Arabidopsis. Nature 2014, 514, 367–371. [Google Scholar] [CrossRef] [PubMed]

Disclaimer/Publisher’s Note: The statements, opinions and data contained in all publications are solely those of the individual author(s) and contributor(s) and not of MDPI and/or the editor(s). MDPI and/or the editor(s) disclaim responsibility for any injury to people or property resulting from any ideas, methods, instructions or products referred to in the content. |
© 2024 by the authors. Licensee MDPI, Basel, Switzerland. This article is an open access article distributed under the terms and conditions of the Creative Commons Attribution (CC BY) license (https://creativecommons.org/licenses/by/4.0/).