Abstract
Selecting uniform and healthy seedlings is important to ensure that a certain level of production can be reliably achieved in a plant factory. The objectives of this study were to investigate the potential of non-destructive image analysis for predicting the leaf area and shoot fresh weight of lettuce and to determine the feasibility of using a simple image analysis to select robust seedlings that can produce a uniform and dependable yield of lettuce in a plant factory. To vary the range of the leaf area and shoot fresh weight of lettuce seedlings, we applied two- and three-day irrigation intervals during the period of seedling production and calculated the projected canopy size (PCS) from the top-view images of the lettuce seedlings, although there were no significant growth differences between the irrigation regimes. A high correlation was identified between the PCS and shoot fresh weight for the lettuce seedlings during the period of seedling production, with a coefficient of determination exceeding 0.8. Therefore, the lettuce seedlings were classified into four grades (A–D) based on their PCS values calculated at transplanting. In the early stages of cultivation after transplanting, there were differences in the lettuce growth among the four grades; however, at the harvest (28 days after transplanting), there was no significant difference in the lettuce yield between grades A–C, with the exception of grade D. The lettuce seedlings in grades A–C exhibited the anticipated yield (150 g/plant) at the harvest time. In the correlation between the PCS and leaf area or the shoot fresh weight of lettuce during the cultivation period after transplanting and the entire cultivation period, the R2 values were higher than 0.9, confirming that PCS can be used to predict lettuce growth with greater accuracy. In conclusion, we demonstrated that the PCS calculation from the top-view images, a straightforward image analysis technique, can be employed to non-destructively and accurately predict lettuce leaf area and shoot fresh weight, and the seedlings with the potential to yield above a certain level after transplanting can be objectively and accurately selected based on PCS.
1. Introduction
In recent years, the stability of crop production has been challenged by a number of factors, including the increasing frequency of extreme weather events due to climate change and the decline in agricultural land area and rural population resulting from urbanization [1]. Plant factories are becoming an acceptable alternative, as crops can be cultivated throughout the year in a planned and controlled manner, regardless of external environmental conditions. A plant factory is a system that cultivates crops using artificial lighting in multiple layers within a well-insulated and enclosed space without the use of pesticides and herbicides [2]. The plant factory’s cultivation rooms are equipped with a sophisticated climate control system, comprising air conditioners, dehumidifiers, and fans, which ensures that the environment within the rooms is consistently maintained at optimal levels for crop production [3].
Lettuce is the most cultivated and profitable leafy vegetable in plant factories due to its rapid growth, short production cycle, low energy requirement, and high nutritional value [4,5,6,7]. Various types of lettuce are being cultivated, categorized by their morphological characteristics including crisp head, butter head, cos, and romaine [8,9]. Lettuce is frequently utilized as a model crop to investigate the response to diverse environments in a plant factory [10,11,12].
In large cultivation rooms of commercial plant factories, spatial and temporal heterogeneities in the environmental conditions are caused by the height of the multiple layers, the location of air conditioners and fans, and other factors [13]. Commercial plant factories are required to produce quantity above a certain standard on a set schedule; therefore, it is necessary to ensure that the standard of uniform growth is maintained at each growth stage. Kozai et al. [2] emphasized that the production of seedlings with a uniform phenotype represents an essential initial step in the successful cultivation of crops in a plant factory. Many researchers reported that the growth and quality of seedlings at the time of planting have a direct impact on the subsequent growth of crops after transplanting, which in turn affects yield [14,15].
Despite the recognition of the importance of selecting healthy seedlings above a certain threshold, the selection of healthy seedlings at the time of transplanting in a plant factory is still dependent upon the expertise and experience of managers or workers. Thus, the non-destructive detection of seedling growth during the seedling production period is important for the automation of the entire cultivation process in a plant factory and for the establishment of objective seedling selection criteria. Phenotypic characteristics, such as leaf area and plant height, are the primary parameters for evaluating and predicting plant growth [16]. The detection of plant phenotypes can be achieved relatively easily usingvarious types of cameras such as visible, multispectral, and hyperspectral cameras in a plant factory [2]. Non-destructive detection methods of crop growth have been extensively studied due to their advantages, including non-invasiveness, high speed, and high sensitivity [17,18].
A variety of image analysis methods have been demonstrated to be effective in assessing plant growth, nutrient status, and vegetation indices in a range of agronomic and horticultural plants [19,20]. Non-destructive canopy size measurements provide a simple and effective method for quantifying plant growth during the growing period, and projected canopy size (PCS) is calculated as the two-dimensional area that a plant’s canopy covers when viewed from above [21]. Kim and van Iersel [22] could easily screen fast-growing cultivars by establishing a correlation between PCS and dry weight and light-use efficiency in green lettuce seedlings. It was also reported that lettuce growth can be sufficiently analyzed by replacing leaf area and dry weight obtained by destructive measurements with PCS and fresh weight obtained by non-destructive analysis to calculate crop growth indices such as relative growth rate (RGR), net assimilation rate (NAR), and leaf area ratio (LAR) [23]. In the various growth parameters, the fresh weight of lettuce represents a critical factor in the determination of market prices [24]. Therefore, PCS has previously been applied to predict the fresh weight of lettuce [19], and recent studies have employed three-dimensional analysis or machine learning to achieve highly accurate predictions of fresh weight based on PCS [25,26]. A number of studies have been conducted on the prediction of lettuce growth using PCS; however, most of these studies have focused on the seedling stage or a specific time after transplanting. While Jayalath and van Iersel [27] investigated the changes in the PCS of lettuce from sowing to harvest, there is a lack of studies that have conducted a periodical analysis of PCS in conjunction with the destructive measurement of growth in the entire cultivation cycle with a separation of the nursery (seedling production) and cultivation (after transplanting to harvest) stage, which reflects the environmental conditions and growth period of commercial plant factories.
Given that the plant factory can maintain a uniform and optimal environment for crop growth, we hypothesized that the occurrence of unmarketable lettuce with a fresh weight below a certain threshold at harvest time was due to variations in lettuce seedling growth, potentially resulting from differences in seed germination and other factors. It was therefore hypothesized that lettuce seedlings that are predicted to grow into lettuce with low yield could be identified before transplanting by a simple and non-destructive method, PCS analysis. In this study, we measured the projected canopy size (PCS) using a camera and investigated the correlation between the PCS and the leaf area and shoot fresh weight measured destructively in lettuce seedlings. Following the grading of lettuce seedlings based PCS values, the yields of each grade of lettuce seedlings were monitored to ascertain the efficacy of image analysis at the time of transplanting in establishing healthy seedling standards that could ensure a certain level of yield. The overarching objective of this study is to assess the feasibility of employing a PSC-based, non-destructive process for the selection of healthy lettuce seedlings in a plant factory.
2. Materials and Methods
2.1. Plant Materials and Seedling Production
“Frillice” lettuce (Lactuca Sativa L.; Mifko Seed Corp., Hanam, Republic of Korea) was used as a plant material in this study. The lettuce seedlings were cultivated for 11 days after sowing (DAS) in “Growform” media (Smithers-Oasis Korea Co. Ltd., Chunam, Republic of Korea). To create differences in seedling growth, we varied the frequency of sub-irrigation; every two days (2DI) and every three days (3DI). The Yamazaki lettuce nutrient solution, with pH of 6.0 and EC of 1.0 ds m−1, was employed for seedling production. The cultivation room in the plant factory was maintained at air temperature of 24/22 °C and relative humidity of 65 ± 5%. White LEDs (Futuregreen Co. Ltd., Yongin, Republic of Korea) were used as a light source, and the light intensity and photoperiod were set at 180 μmol·m−2·s−1 and 16/8 h (light/dark), respectively. Figure 1 shows the spectral distribution of LEDs used in this study.
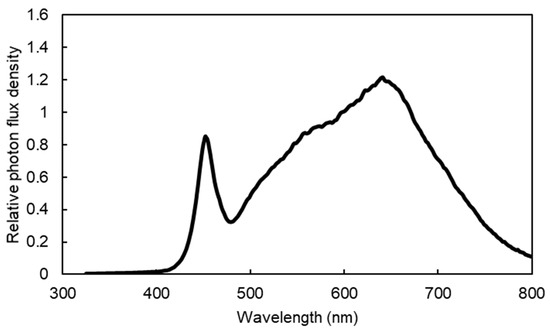
Figure 1.
Spectral distribution of LEDs used in this study.
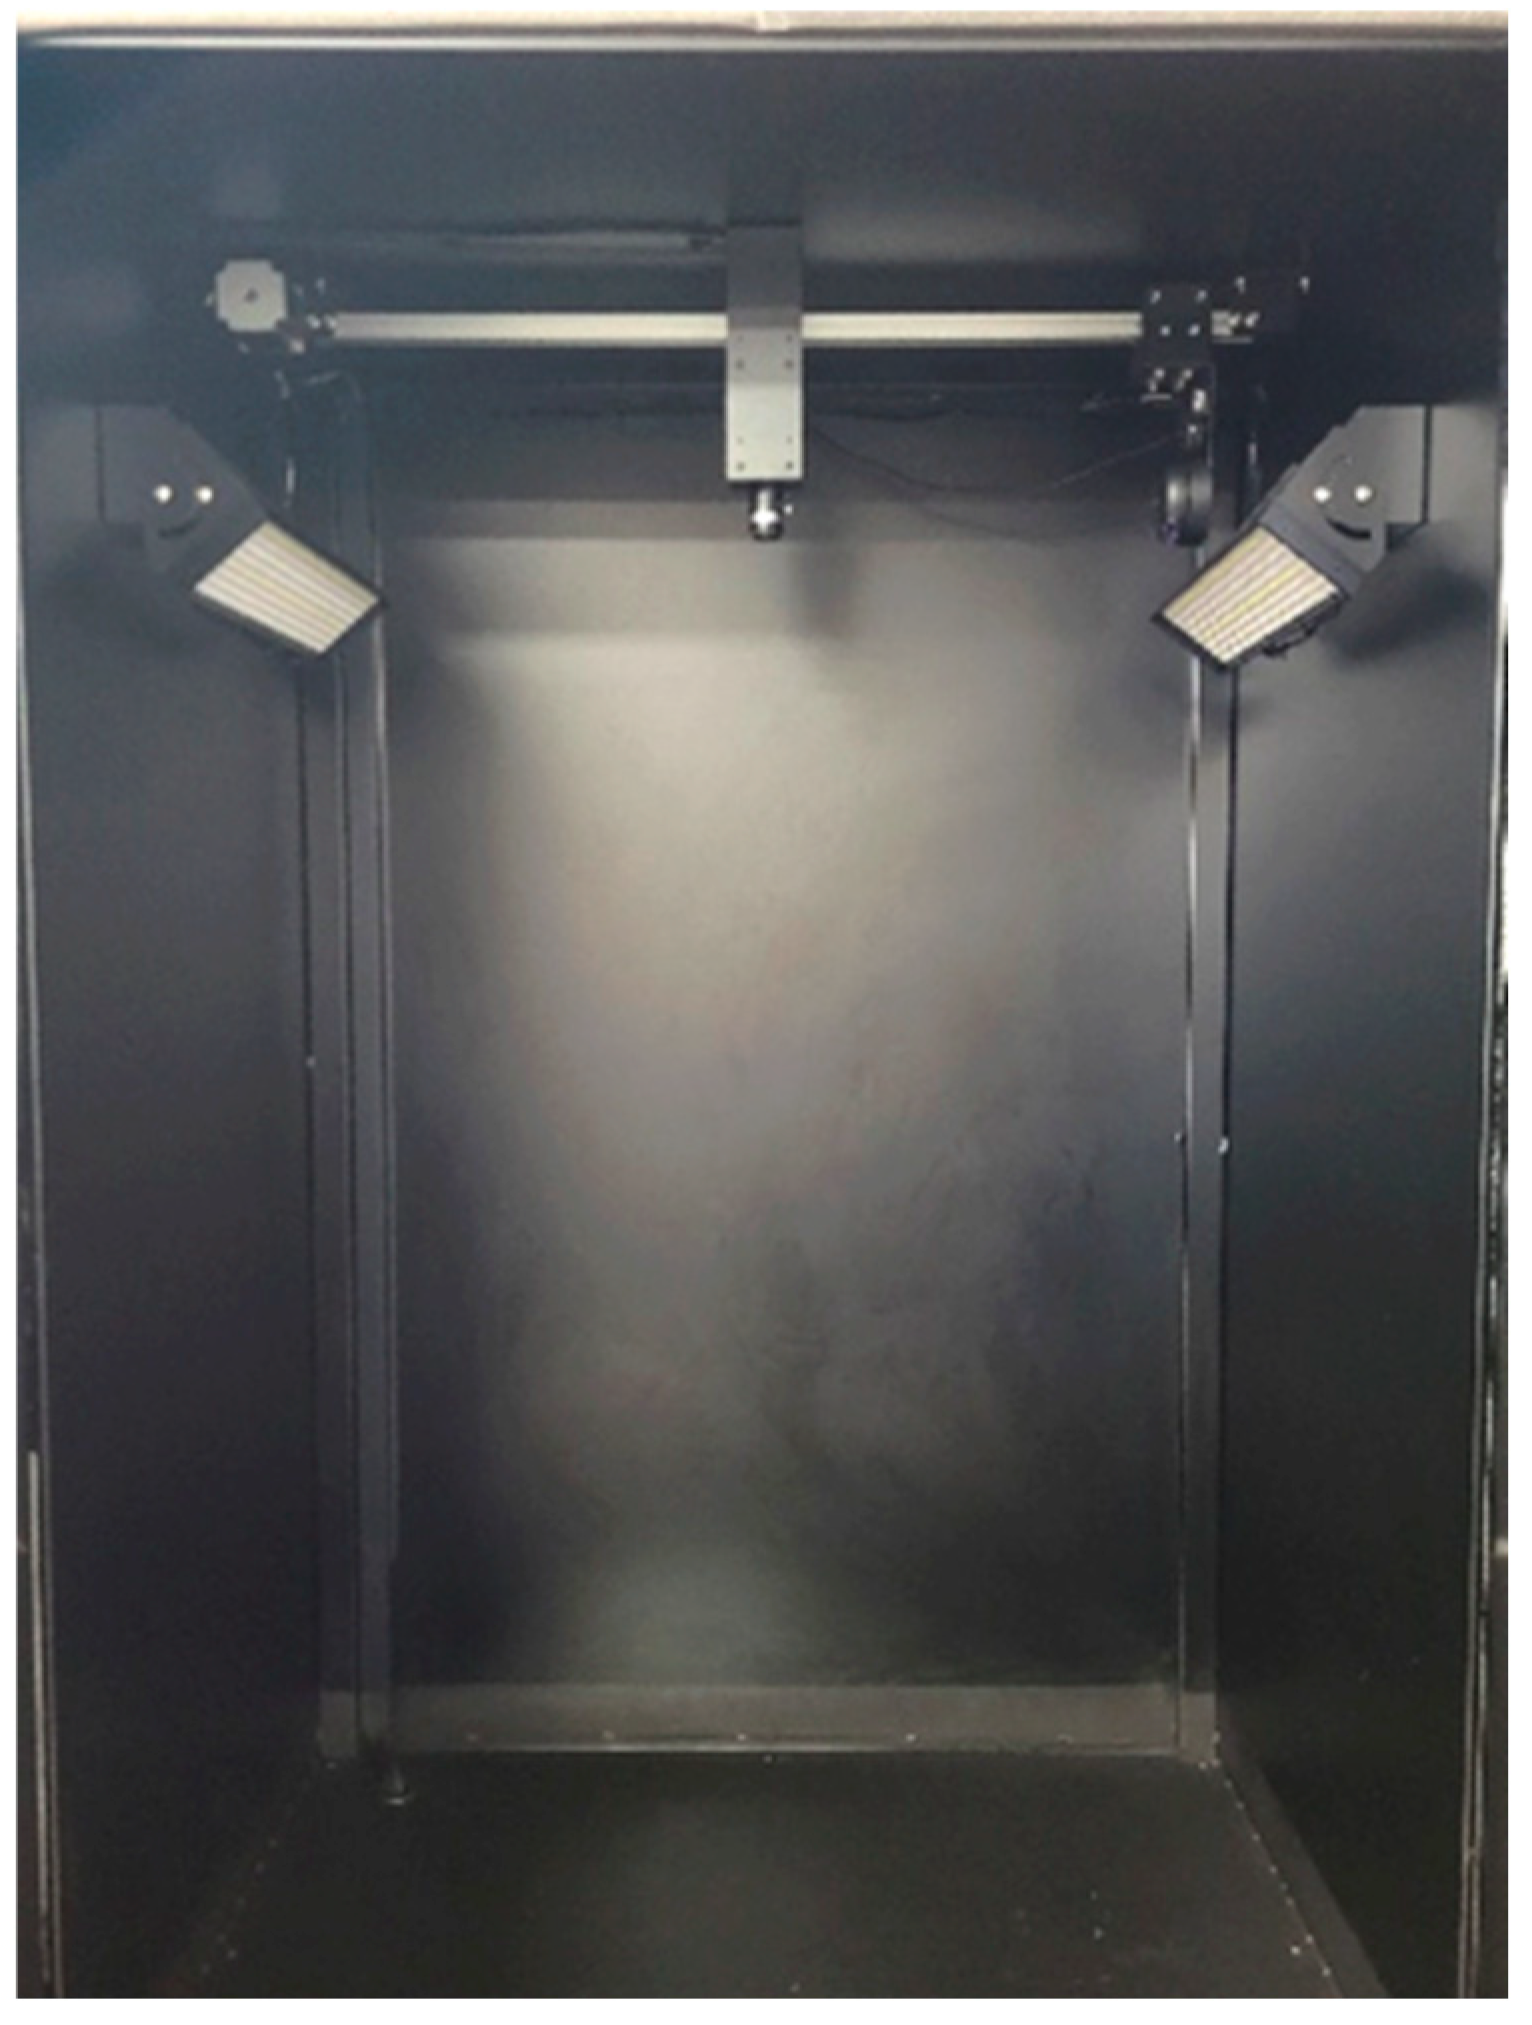
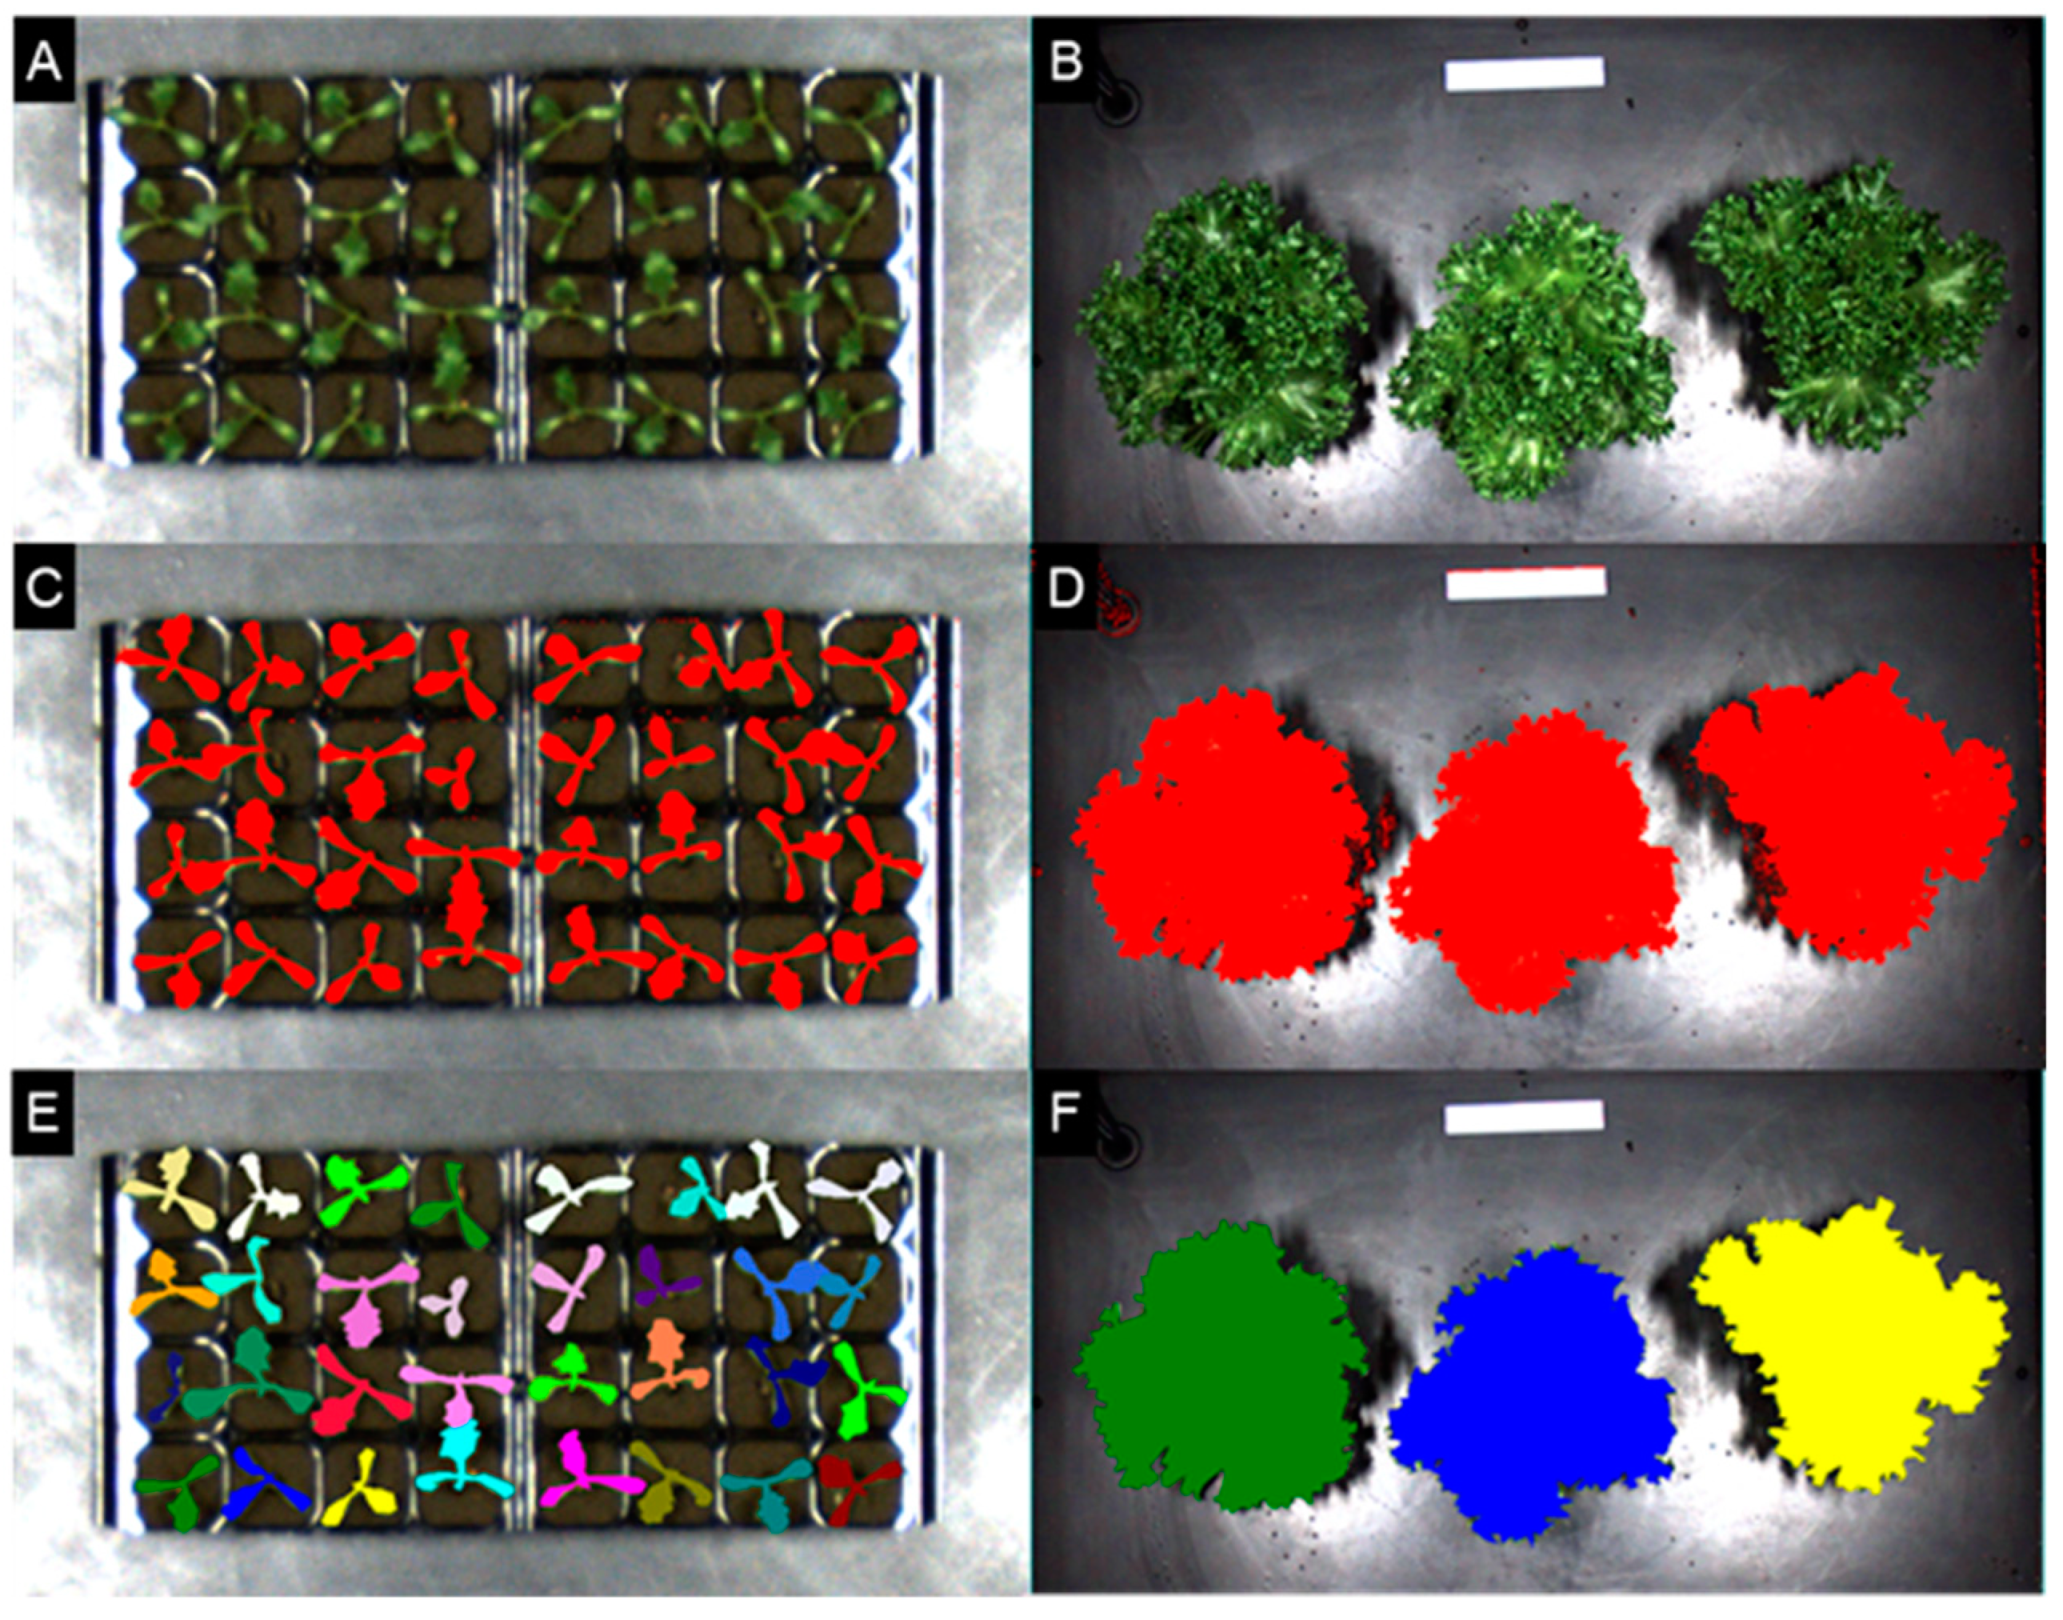
From 4 DAS to 11 DAS, the growth of seedlings was daily measured, both destructively and non-destructively. The destructive growth measurement parameters were leaf area and shoot fresh weight. Leaf area was obtained with a leaf area meter (LI-3100, LI-COR Inc., Lincoln, NE, USA), and shoot fresh weight was measured using a weighing scale. For non-destructive measurement of lettuce seedling growth, we obtained the image of lettuce seedlings using Plant Image Measurement System (PIMS) consisting of a multispectral camera (FS-3200T-10GE-NNC, JAI, Copenhagen, Denmark), LEDs that are capable of emitting light in the RGB (450, 550, and 650 nm) and NIR (750 and 830 nm) regions, and a normalization bar (Figure 2). The image data were obtained from the camera positioned at a height of 1.0 m above the crop in a top view. To quantify PCS, the images were processed using ENVI software (ENVI 5.3, L3Harris Geospatial, Broomfield, CO, USA), which separated plant from background and counted the number of pixels representing the canopy (Figure 3). The counted pixel values were converted to area values with a calibration to account for the distance of the crop from the camera and image resolution.
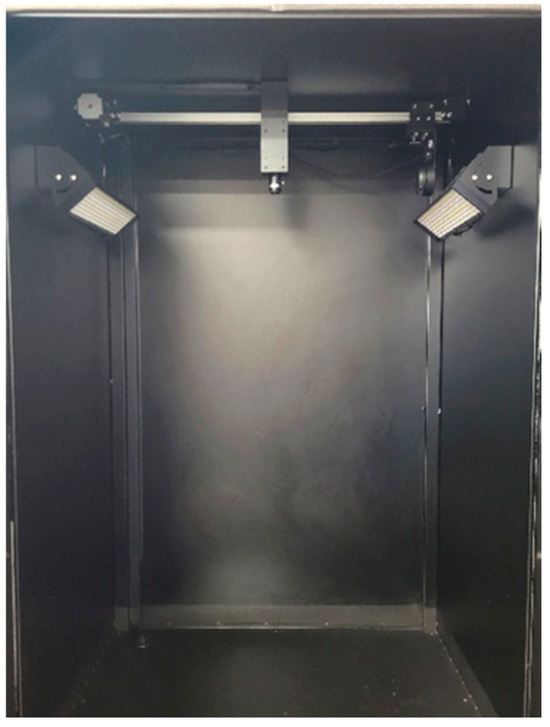
Figure 2.
PIMS (Plant Image Measurement System) used for non-destructive estimation of leaf area and fresh weight of ‘Frillice’ lettuce seedlings in a plant factory.

Figure 3.
Images of ‘Frillice’ lettuce seedlings and mature plants taken with PIMS (A,B), separated from their background (C,D), and detected individually using ENVI program (E,F).
To confirm the capacity of PCS to reflect the growth changes of lettuce seedlings, we investigated the correlation between PCS and growth parameters (leaf area and shoot fresh weight), which were measured daily throughout the period of seedling production. Given the high correlation between shoot fresh weight and PCS, lettuce seedlings were classified into four grades (A–D) based on their PCS.
2.2. Growth of Lettuce Crop by Seedling Classification after Transplanting
At 12 DAS, the lettuce seedlings classified based on PCS were transplanted in the planting plate (60 × 60 cm) with the planting density 33.3 plant/m2 and cultivated for 28 days. After transplanting, lettuce crops were cultivated using a DFT hydroponic system with the Yamazaki nutrient solution for lettuce. The pH of nutrient solution was maintained at 6.0, and the EC of nutrient solution gradually increased to 1.6 (from 12 to 26 DAS) to 2.4 ds m−1 (from 27 to 40 DAS). After transplanting, the environmental conditions in the plant factory were established to be similar to those for seedling production, including the air temperature, relative humidity, and photoperiod except for the light intensity (220 μmol·m−2·s−1).
During the lettuce cultivation, the growth of lettuce crops was measured destructively and non-destructively on a weekly basis, and we investigated the correlation between PCS and growth parameters (leaf area and shoot fresh weight). At 7, 14, 21, and 28 days after transplanting (DAT), the lettuce was sampled according to grade, and the growth of the lettuce was measured, including leaf length, number of leaves, leaf area, and shoot fresh weight.
2.3. Statistical Analysis
Statistical analyses were performed using SAS program (SAS 9.4, SAS Institute Inc., Cary, NC, USA), and the student’s t-test and Duncan multiple range test were used to compare mean values for significant differences (p < 0.05). Box-and-whisker plots and linear regression analysis were conducted using Microsoft®® Excel®® (Mircrosoft 365 MSO Version 16.0.16501.20074, Redmend, WA, USA).
3. Results
3.1. Differences in Lettuce Seedling Growth between Irrigation Regimes
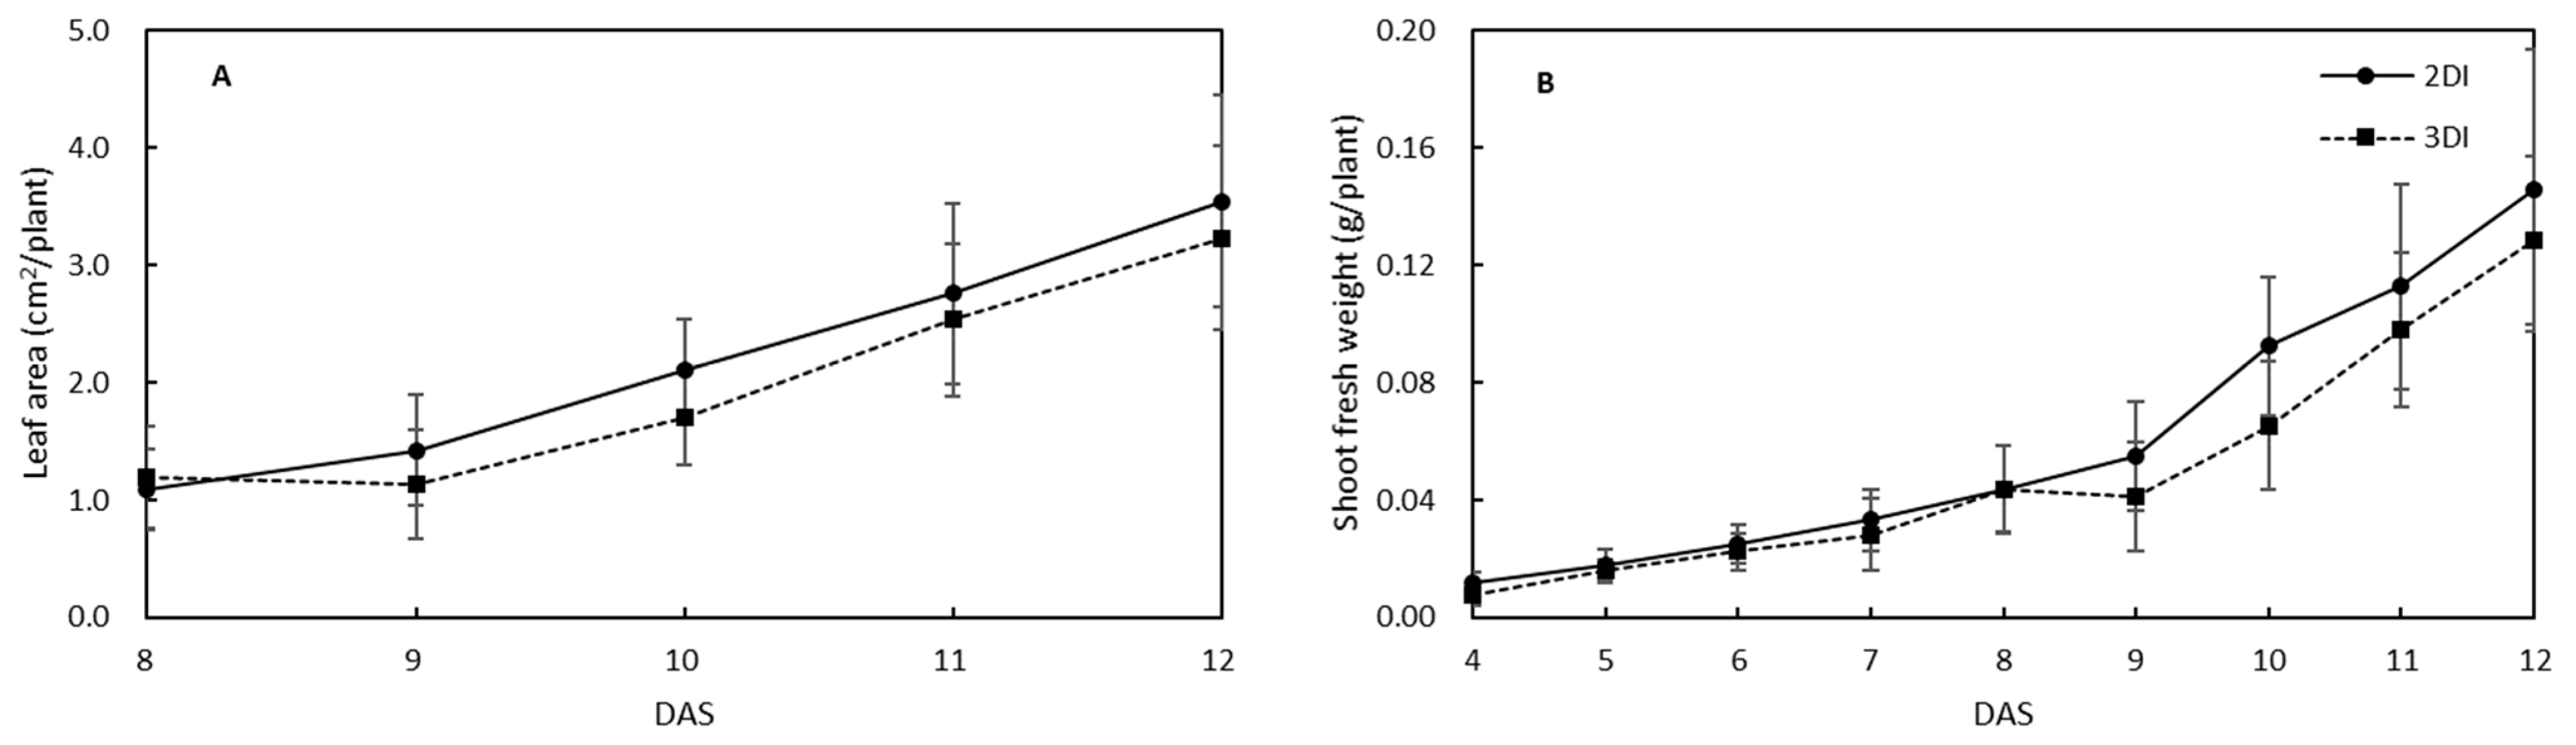
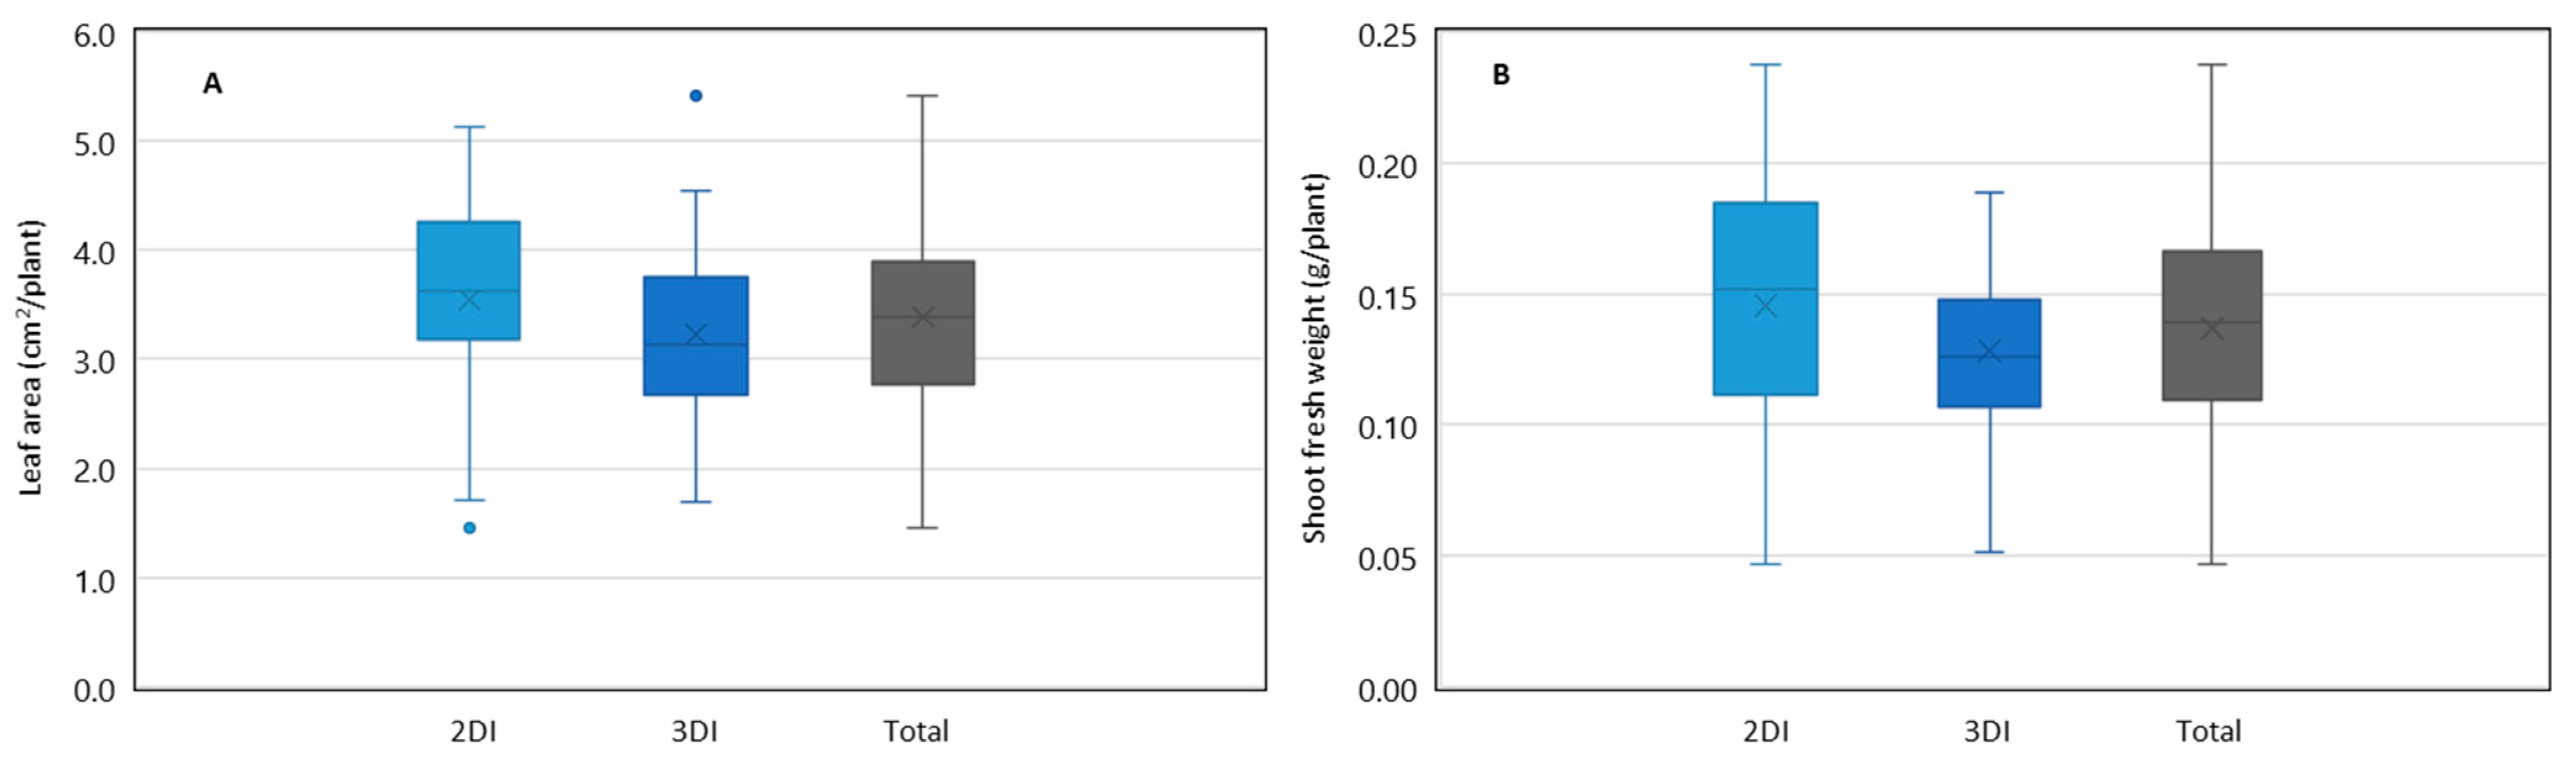
At 12 DAS, the lettuce seedlings irrigated every two days showed a higher leaf area and shoot fresh weight than those irrigated every three days; however, no significant differences were observed between the irrigation regimes (Figure 4). The leaf area and shoot fresh weight exhibited no observable difference between the irrigation treatments until 8 DAS, and there was a tendency for growth to be higher in the 2DI treatment from 9 DAS. In the distribution of growth parameters by irrigation regimes, it was revealed that the 3DI treatment exhibited lower Q4 (the maximum) and Q3 (the highest 25% of the data) values for leaf area and shoot fresh weight than the 2DI treatment (Figure 5). The Q3 value of shoot fresh weight in the 3DI treatment was found to be lower than the median value for the 2DI treatment. The leaf area and shoot fresh weight for all irrigation treatments exhibited a range of 1.45–5.42 cm2/plant and 0.047–0.238 g/plant, respectively.
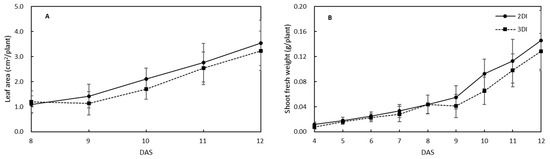
Figure 4.
Changes in leaf area (A) and shoot fresh weight (B) of ‘Frillice’ lettuce seedlings during the period of seedling production in a plant factory. The seedlings were sub-irrigated every two (2DI) or three (3DI) days and sampled for 12 DAS.
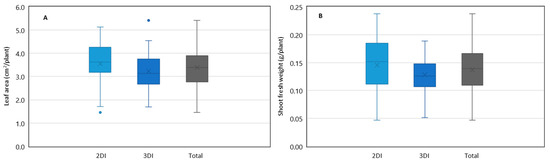
Figure 5.
Distribution of leaf area (A) and shoot fresh weight (B) of ‘Frillice’ lettuce seedlings cultivated under different irrigation regimes at 12 DAS.
3.2. Growth Estimation and Grading of Lettuce Seedlings Based on PCS
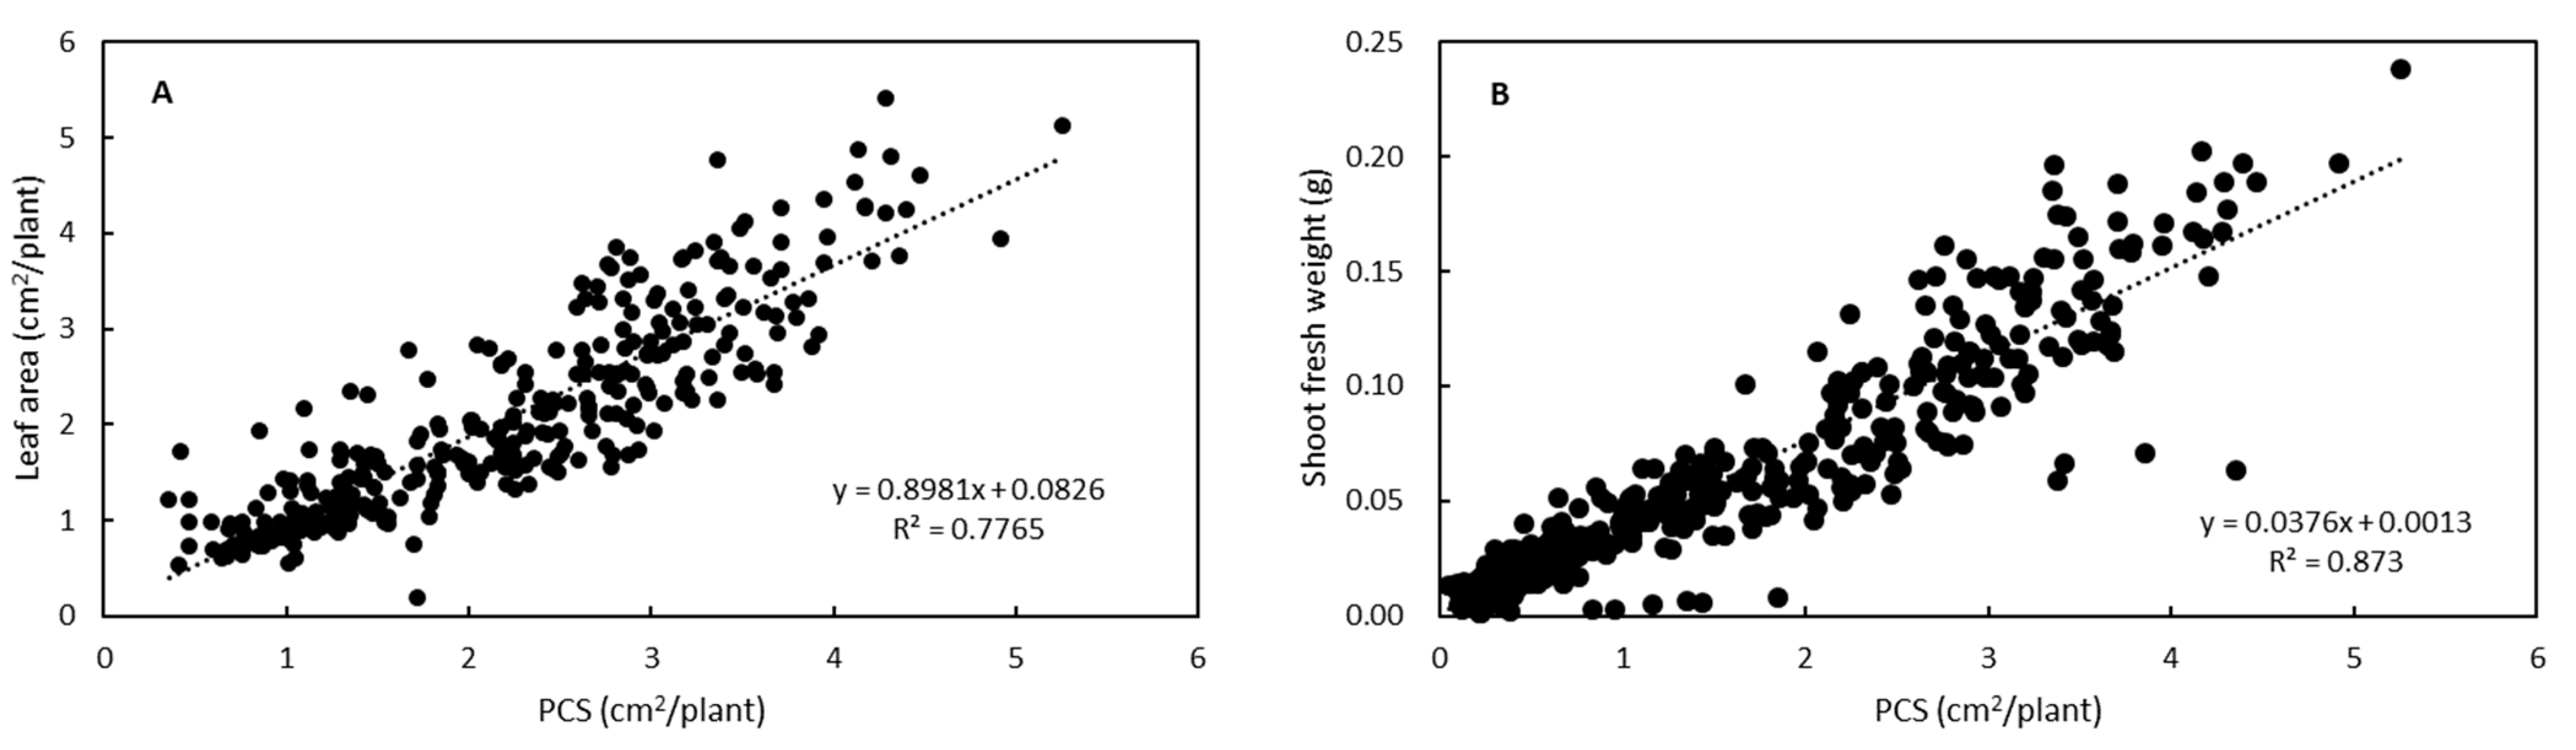
The correlations between PCS and growth parameters (leaf area and shoot fresh weight) measured during the period of seedling production were investigated, and the coefficient of determination (R2) was high with values of 0.78 and 0.88, respectively (Figure 6).

Figure 6.
Correlation between PCS and leaf area (A) and shoot fresh weight (B) of ‘Frillice’ lettuce seedlings.
Following the confirmation that the growth of lettuce seedlings can be predicted based on PCS, a non-destructive PCS measurement was conducted just before transplanting for the grading of the lettuce seedlings. Considering the distribution of the leaf area and shoot fresh weight in lettuce seedlings at 12 DAS, we categorized the lettuce seedlings into four grades based on the PCS. The PCS ranges for the A, B, C, and D grades were set at 5–7, 4–5, 2–4, and <2 cm2/plant, respectively (Table 1 and Figure 7).

Table 1.
PCS and predicted shoot fresh weight of ‘Frillice’ lettuce seedlings in four different grades.
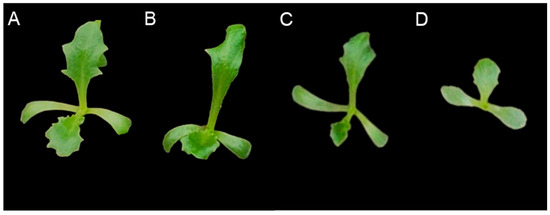
Figure 7.
“Frillice” lettuce seedlings in four different grades ((A) grade A, (B) grade B, (C) grade C, (D) grade D).
3.3. Lettuce Growth by Grading after Transplanting
After transplanting, the lettuce growth of each grade was investigated at weekly intervals (Table 2). At 7 DAT, there was a difference in the growth of the lettuce based on the order of the grades; however, at 14 DAT, the growth of the lettuce in grade B was higher than that in grade A. At the time of harvest (28 DAT), there was no difference in the growth of the lettuce between grades A, B, and C, and the lettuce in grade D had a significantly lower yield (Figure 8).
Table 2.
Changes in growth of lettuce crops after transplanting as affected by seedling grades.
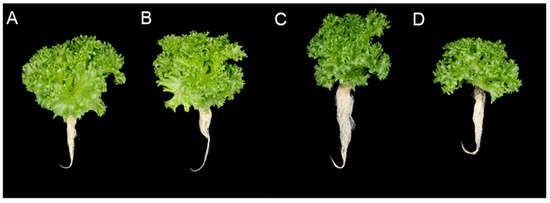
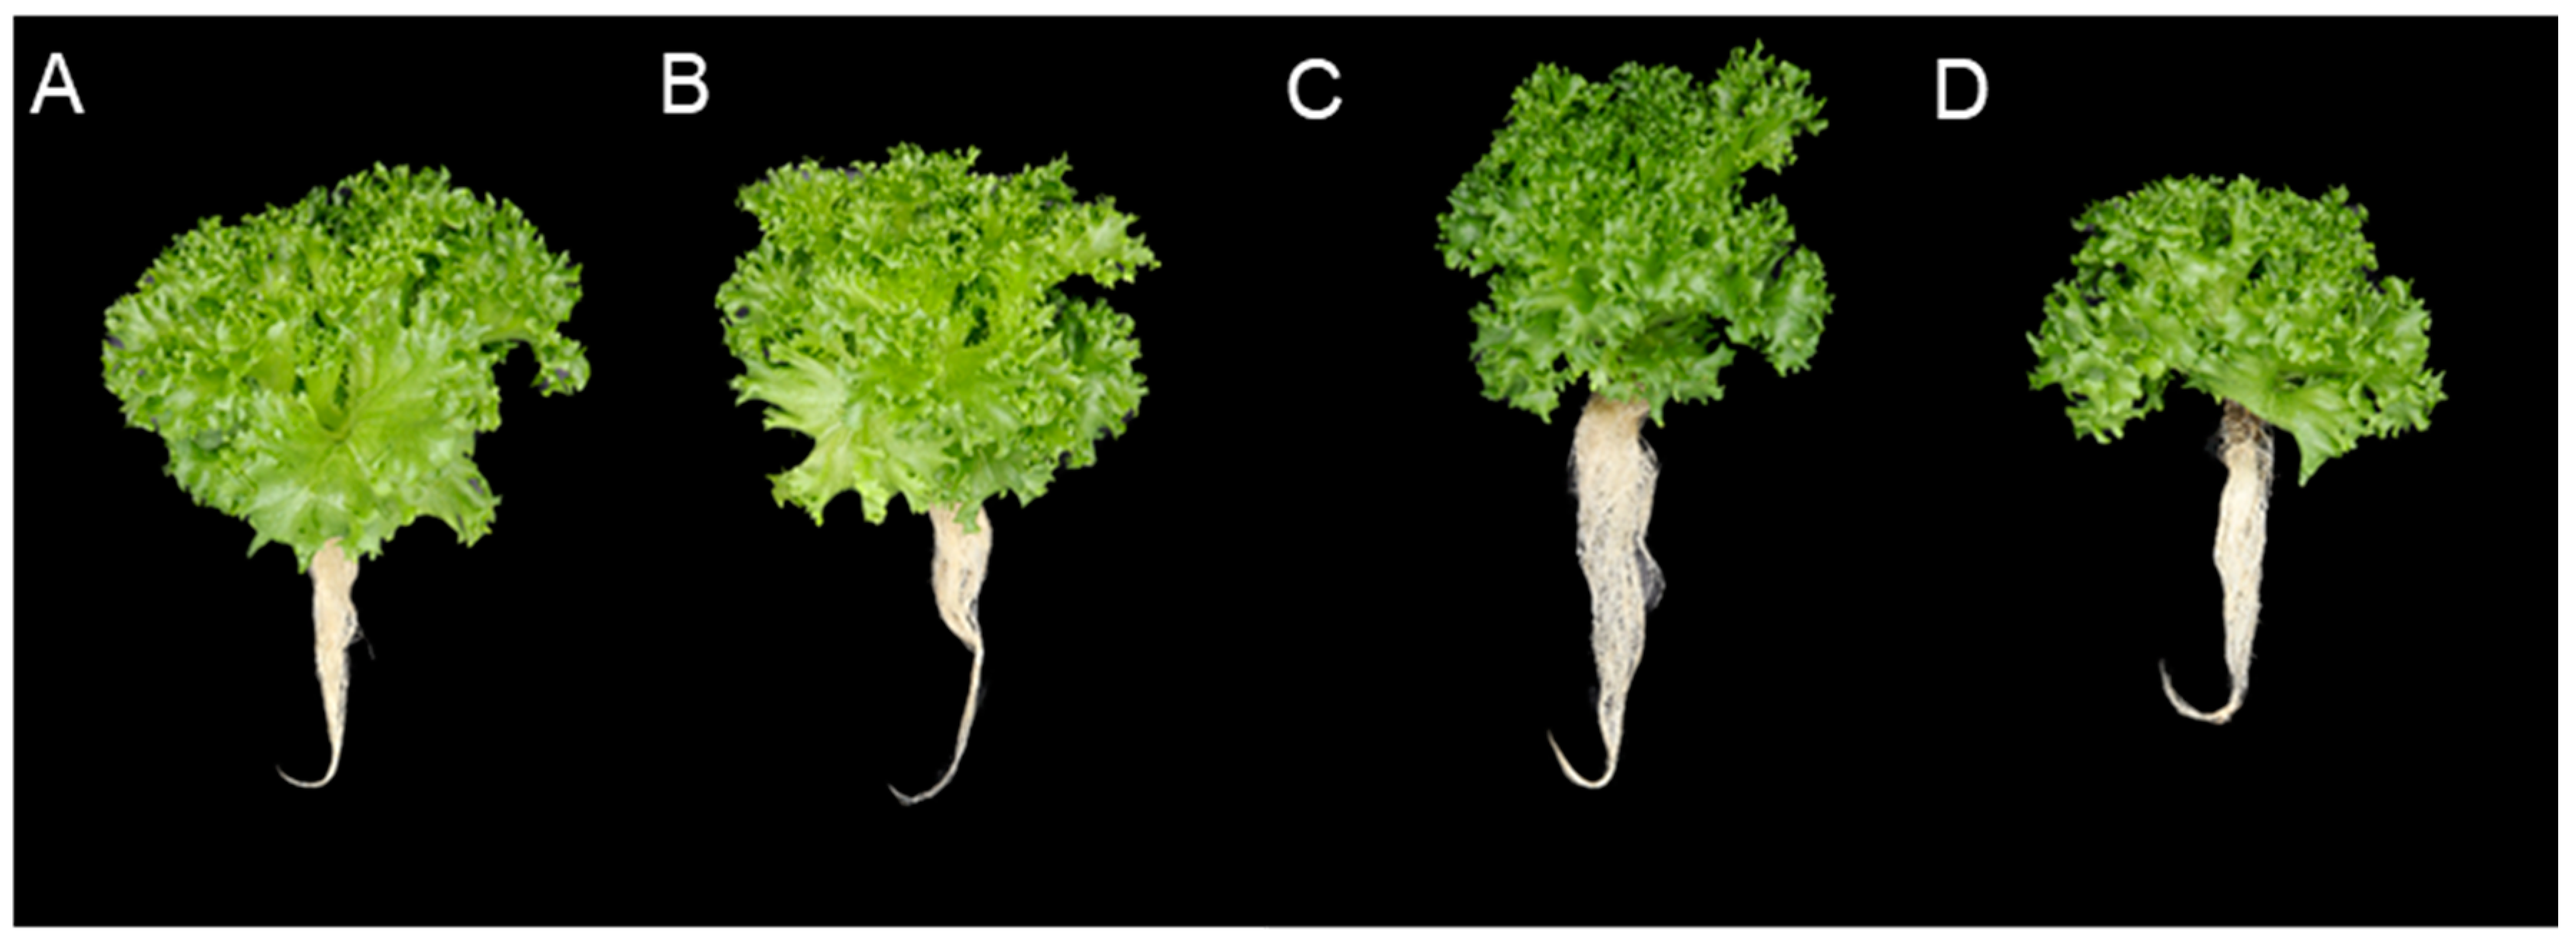
Figure 8.
“Frillice” lettuce at harvest (28 DAT in a hydroponic system) according to seedling grades ((A) grade A, (B) grade B, (C) grade C, (D) grade D).
To determine whether there was a significant difference in the growth of the lettuce that could be produced by different irrigation regimes during the period of seedling production, we investigated the yield of lettuce by the irrigation regimes in grades B and C. No significant difference was found (Table 3).
Table 3.
Yield of ‘Frillice’ lettuce cultivated using seedlings of in grades B and C at 28 DAT as affected by irrigation regime.
3.4. Growth Estimation of Lettuce after Transplanting Based on PCS
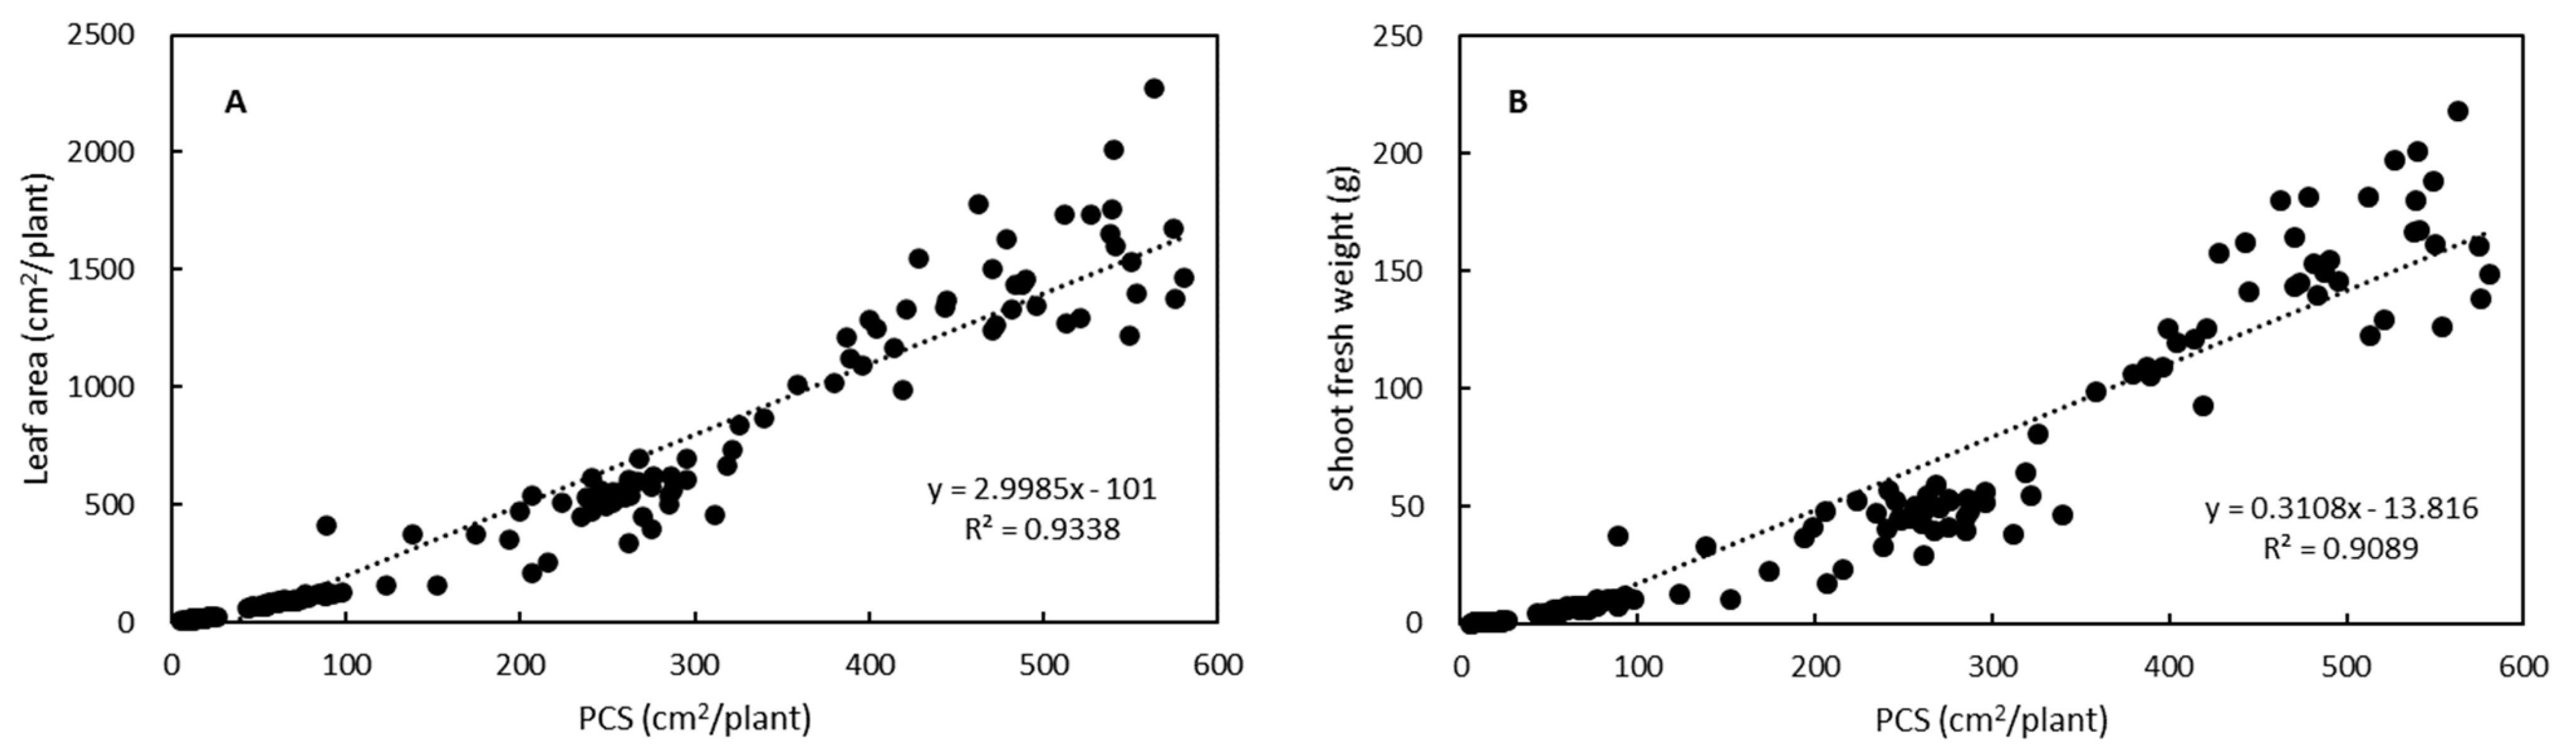
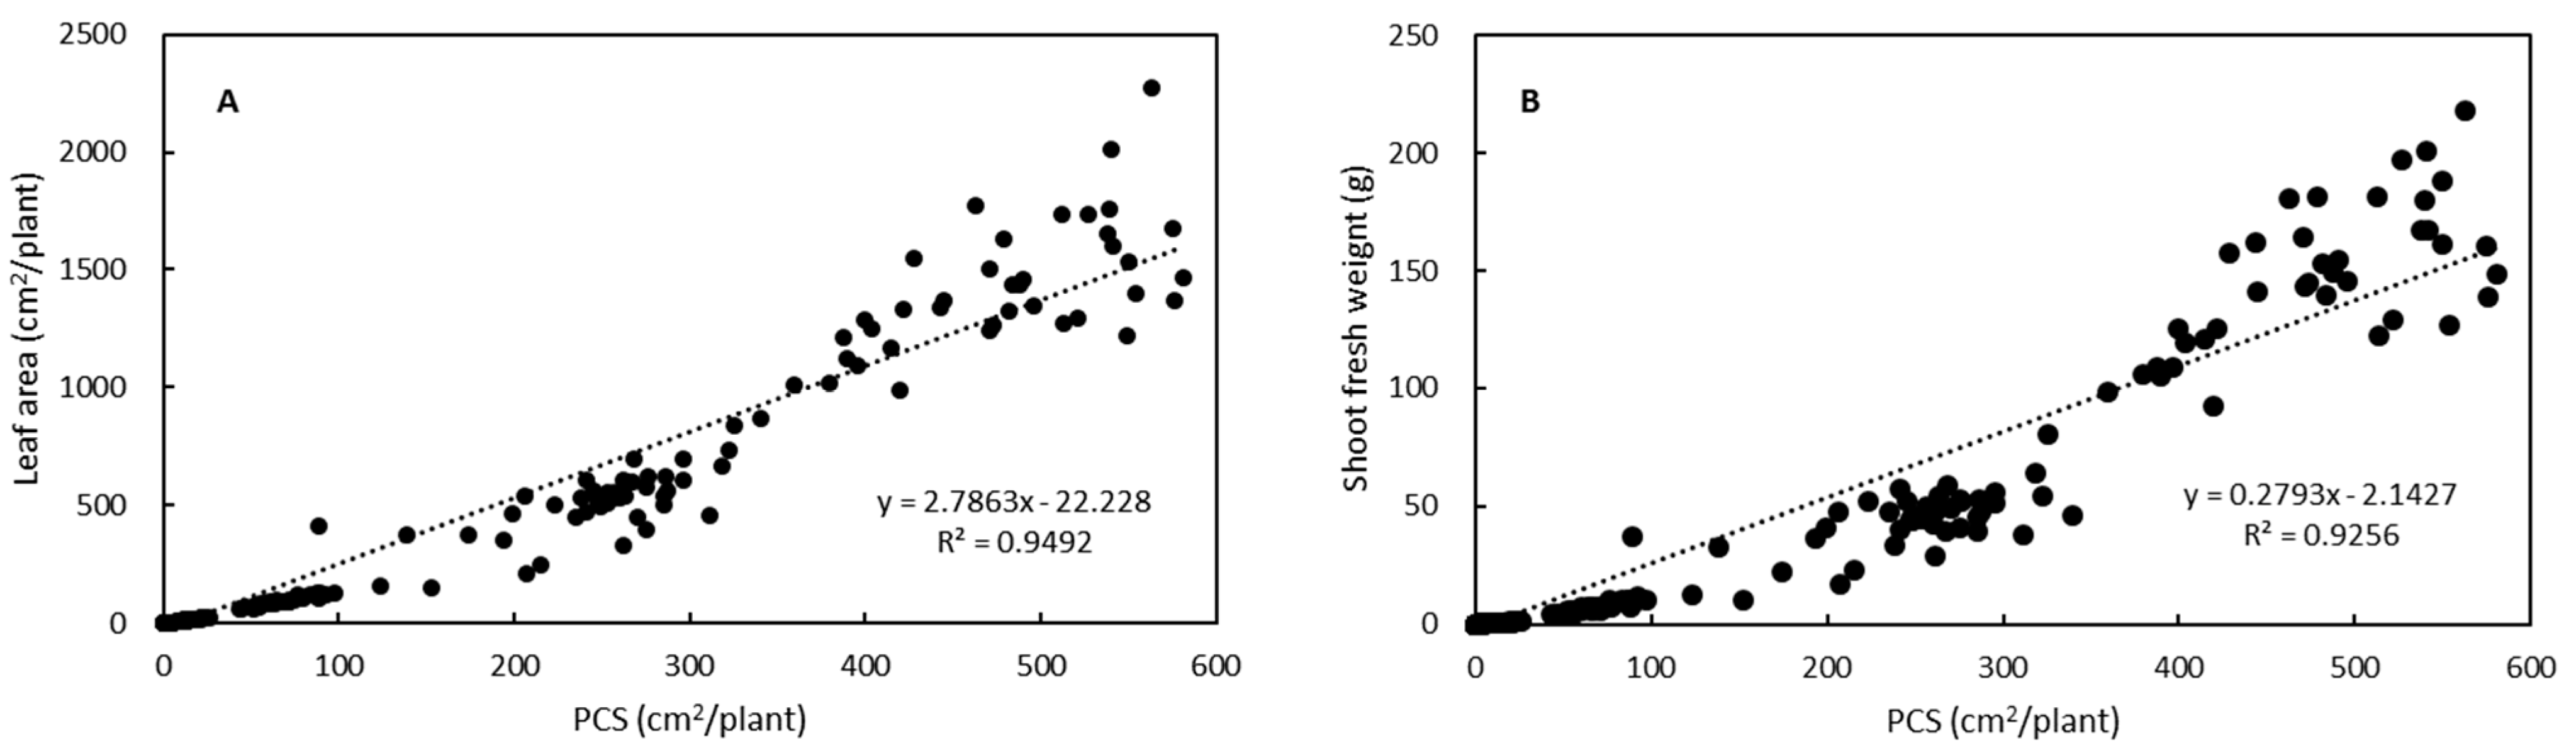
We investigated the correlation between the growth parameters (leaf area and shoot fresh weight) and PCS during the cultivation period after transplanting, and the coefficients of determination (R2) in the correlation equation between the PCS and leaf area or shoot fresh weight were identified as 0.93 and 0.91, respectively (Figure 9). The PCS-based prediction equations for the leaf area and shoot fresh weight throughout the entire lettuce production period also demonstrated high prediction accuracy, as evidenced by the coefficients of determination for 0.95 and 0.93, respectively (Figure 10).
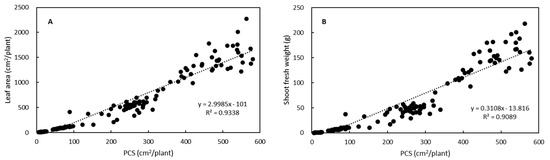
Figure 9.
Correlation between PCS and leaf area (A) and shoot fresh weight (B) throughout lettuce cultivation after transplanting.

Figure 10.
Correlation between PCS and leaf area (A) and shoot fresh weight (B) throughout the entire lettuce production period.
4. Discussion
4.1. Changes in Lettuce Growth by Different Irrigation Regimes during the Period of Seedling Production
From 9 DAS, the lettuce seedlings exhibited increased root water uptake and leaf transpiration, which appeared to retard the growth of the lettuce seedlings in the treatments that were sub-irrigated every 3 days. During the period of seedling production (12 DAS), the number of irrigations in the 2 and 3DI treatments was six and four times, respectively. The irrigation rate in the 3DI treatment was approximately 67% of that in the 2DI treatment, which is designated as a mild drought stress condition. Consequently, the seedling growth in the 3DI treatment was delayed; however, there was no significant difference between the irrigation regimes at 12 DAS. Coelho et al. [28] reported that the lettuce growth had no significant difference between the 75 and 100% irrigation treatment. In this study, the objective of varying the irrigation regimes was not to assess the impact of drought stress on lettuce seedling growth but to achieve a range of lettuce seedling sizes for grading at transplanting. While there was no significant difference in lettuce seedling growth at 12 DAS between the irrigation regimes, varying the irrigation regimes allowed for a more diverse size distribution and the production of seedlings of varying sizes, effectively meeting the set objective.
4.2. Prediction of Lettuce Growth Based on PCS
We calculated the PCS from top-view images of the lettuce and conducted a series of periodic measurements of the leaf area and shoot fresh weight of the lettuce at designated intervals throughout the period of seedling production and crop cultivation after transplanting. The predictive accuracy of the leaf area and shoot fresh weight of the lettuce based on the PCS was found to be consistently high, with R2 values exceeding 0.9 during the entire cultivation period and slightly lower but still acceptable R2 values of 0.78 and 0.87 during the seedling production period. The advantage of the PCS analysis is that it can be derived from RGB images, which makes it an accessible technique that does not require the use of expensive and complex equipment such as multispectral or hyperspectral cameras, chlorophyll fluorescence image cameras, etc. [29]. With the PCS, it is difficult to reflect on leaf overlap and twisting [30]; however, we were able to derive an expression for the leaf area estimation of the lettuce based on the PCS through a linear regression model. Leaf area can be employed as a predictor of plant size and yield, given that an increase in leaf area is correlated with growth resulting from photosynthesis [31]. This indicates that it is feasible to predict the fresh weight of lettuce based on the PCS, which is significantly correlated with the leaf area; and, in this study, the accuracy of predicting the fresh weight of lettuce based on the PCS was similarly high as that of the leaf area. In previous studies [29,30], a sigmoidal growth curve with the cultivation day or PCS was observed for the leaf area and biomass of leafy vegetables. However, in this study, leaf area or shoot fresh weight with a PCS was a good fit for the linear regression equation, which is probably due to the morphological characteristics of “Frillice” cultivar. “Frillice” cultivar has a relatively slow growth rate and weaving leaves. As it grows outwards, the canopy can be effectively projected with a top-view imaging system. Previous studies have reported that canopy size can be used as a reliable indicator of crop biomass in lettuce [29], cereals [32], cotton [33], and Arabidopsis [34].
4.3. Yield of Lettuce after Transplanting by Seedling Grade Based on PCS
As we confirmed that PCS can predict the growth of lettuce seedlings well, the lettuce seedlings were categorized into four grades, A–D, based on their PCS values. The growth of lettuce exhibited significant differences by seedling grade at the early stage of cultivation after transplanting. However, at the harvest stage (28 DAT), there was no significant difference in yields among the A–C grades, while a reduction in yield was observed only in the D grade. This indicates that if only seedlings above a specific size threshold are selected for transplanting and subsequently planted, a targeted quantity of lettuce can be produced at harvest time under the condition that a uniform and optimal environment is maintained throughout the period of cultivation after transplanting. In plant factories, the variations of seedling growth that occur during the period of seedling production, such as delayed germination, result in growth differences after transplanting; therefore, it is important to select seedlings based on the basis of accurate and objective criteria. However, these tasks still rely on the experience and skills of human operators in plant factories. Moriyuki and Fukuda [35] used chlorophyll fluorescence imaging for selecting seedlings and predicting yield in lettuce cultivated in a plant factory. In this study, we demonstrated that the selection of healthy seedlings with the potential to achieve yields above a certain threshold and the prediction of fresh weight throughout the entire cultivation period can be achieved by analyzing simply PCS from top-view images. The growth of lettuce seedlings in the largest size, grade A, was highest up to 7 DAT; thereafter, the difference in growth between grades A and B disappeared from 14 DAT, which is thought to be due to more root damage in seedlings above a certain size when pulled from the seedling tray or placed in the hole of the planting plate. A number of studies conducted to correlate image data with growth parameters at a specific point for lettuce seedlings and focused on selecting the seedlings or varieties at a given time [18,36,37]. There have been few studies to confirm the yield of the selected seedlings by means of image analysis. The result of this study showed that based on the PCS value of the seedlings before transplanting, the yield of lettuce decreased sharply below a certain threshold, and within a certain range, the yield did not increase proportionally to the increase in the PCS value of the seedlings.
5. Conclusions
In this study, we confirmed that non-destructive image analysis can predict important growth parameters such as leaf area and shoot fresh weight for lettuce, and the PCS calculated from the top-view images can be used to select well-performing seedlings that can achieve a certain yield of lettuce at the harvest. Our results demonstrated that the utilization of an imaging system in a plant factory can facilitate the non-destructive and continuous analysis of crop growth and that it is possible to perform a selective transplanting of only well-performing seedlings by establishing a connection between an imaging system and an automated transplanting robot.
Author Contributions
Conceptualization, J.J. and Y.K.; Data Curation, J.J. and Y.H.; Formal Analysis, J.J.; Funding Acquisition, Y.K.; Investigation, J.J. and Y.H.; Methodology, Y.K.; Project Administration, Y.K.; Resources, Y.K.; Supervision, Y.K.; Validation, Y.K.; Visualization, J.J.; Writing—Original Draft Preparation, J.J. and Y.H.; Writing—Review and Editing, Y.K. All authors have read and agreed to the published version of the manuscript.
Funding
This research was carried out with the support of the “Smart Farm Innovation Technology Development Program” (Project No. 423001021HD030), Korea Smart Farm R&D Foundation and the 2022 Advanced Facility Fund of the University of Seoul.
Data Availability Statement
The original contributions presented in the study are included in the article, further inquiries can be directed to the corresponding author.
Conflicts of Interest
The authors declare no conflicts of interest.
References
- Kim, J.; Kim, K.S.; Kim, Y.; Chung, Y.S. A short review: Comparisons of high-throughput phenotyping methods for detecting drought tolerance. Sci. Agric. 2020, 78, e20190300300. [Google Scholar] [CrossRef]
- Kozai, T.; Niu, G.; Masabni, J.G. (Eds.) Plant Factory Basics, Applications and Advances; Academic Press: London, UK, 2021; pp. 11–22. [Google Scholar]
- Kozai, T. Smart plant factory. In The Next Generation Indoor Vertical Farms; Springer: Singapore, 2018; Volume 238, 7p. [Google Scholar]
- Lee, J.G.; Choi, C.S.; Jang, Y.A.; Jang, S.W.; Lee, S.G.; Um, Y.C. Effects of air temperature and air flow rate control on the tipburn occurrence of leaf lettuce in a closed-type plant factory system. Hortic. Environ. Biotechnol. 2013, 54, 303–310. [Google Scholar] [CrossRef]
- Paim, B.T.; Crizel, R.L.; Tatiane, S.J.; Rodrigues, V.R.; Rombaldi, C.V.; Galli, V. Mild drought stress has potential to improve lettuce yield and quality. Sci. Hortic. 2020, 272, 109578. [Google Scholar] [CrossRef]
- He, R.; Zhang, Y.; Song, S.; Su, W.; Hao, Y.; Liu, H. UV-A and FR irradiation improves growth and nutritional properties of lettuce grown in an artificial light plant factory. Food Chem. 2021, 345, 128727. [Google Scholar] [CrossRef]
- Shin, Y.K.; Bhandari, S.R.; Jo, J.S.; Song, J.W.; Lee, J.G. Effect of drought stress on chlorophyll fluorescence parameters, phytochemical contents, and antioxidant activities in lettuce seedlings. Horticulturae 2021, 7, 238. [Google Scholar] [CrossRef]
- Kim, M.J.; Moon, Y.; Kopsell, D.A.; Park, S.; Tou, J.C.; Waterland, N.L. Nutritional value of crisphead ‘Iceberg’ and romaine lettuces (Lactuca sativa L.). J. Agric. Sci. 2017, 8, 1–10. [Google Scholar] [CrossRef]
- Still, D.W. Lettuce. In Vegetables; Springer: Berlin/Heidelberg, Germany, 2007; pp. 127–140. [Google Scholar]
- Li, Q.; Kubota, C. Effects of supplemental light quality on growth and phytochemicals of baby leaf lettuce. Environ. Exp. Bot. 2009, 67, 59–64. [Google Scholar] [CrossRef]
- Hang, T.; Lu, N.; Takagaki, M.; Mao, H. Leaf area model based on thermal effectiveness and photosynthetically active radiation in lettuce grown in mini-plant factories under different light cycles. Sci. Hortic. 2019, 252, 113–120. [Google Scholar] [CrossRef]
- Yan, Z.; He, D.; Niu, G.; Zhai, H. Evaluation of growth and quality of hydroponic lettuce at harvest as affected by the light intensity, photoperiod and light quality at seedling stage. Sci. Hortic. 2019, 248, 138–144. [Google Scholar] [CrossRef]
- Okayama, T.; Okamura, K.; Park, J.E.; Ushada, M.; Murase, H. A simulation for precision airflow control using multi-fan in a plant factory. Environ. Control Biol. 2008, 46, 183–194. [Google Scholar] [CrossRef]
- Johkan, M.; Shoji, K.; Goto, F.; Hashida, S.N.; Yoshihara, T. Blue light-emitting diode light irradiation of seedlings improves seedling quality and growth after transplanting in red leaf lettuce. HortScience 2010, 45, 1809–1814. [Google Scholar] [CrossRef]
- Nkurunziza, E.; Nyalala, S.; Umuhoza, K.N.J. Effect of seedling quality on growth, yield and quality of tomato (Solanum lycopersicum L.). Int. J. Hortic. Sci. 2022, 28, 64–72. [Google Scholar] [CrossRef]
- Yang, S.; Zheng, L.; Gao, W.; Wang, B.; Hao, X.; Mi, J.; Wang, M. An efficient processing approach for colored point cloud-based high-throughput seedling phenotyping. Remote Sens. 2020, 12, 1540. [Google Scholar] [CrossRef]
- Mishra, K.B.; Mishra, A.; Klem, K.; Govindjee. Plant phenotyping: A perspective. Indian J. Plant Physiol. 2016, 21, 514–527. [Google Scholar] [CrossRef]
- Du, J.; Lu, X.; Fan, J.; Qin, Y.; Yang, X.; Guo, X. Image-based high-throughput detection and phenotype evaluation method for multiple lettuce varieties. Front. Plant Sci. 2020, 11, 563386. [Google Scholar] [CrossRef]
- Jung, D.H.; Park, S.H.; Han, X.Z.; Kim, H.J. Image processing methods for measurement of lettuce fresh weight. J. Biosyst. Eng. 2015, 40, 89–93. [Google Scholar] [CrossRef]
- Hu, Y.; Wang, L.; Xiang, L.; Wu, Q.; Jiang, H. Automatic non-destructive growth measurement of leafy vegetables based on kinect. Sensors 2018, 18, 806. [Google Scholar] [CrossRef]
- Legendre, R.; van Iersel, M.W. Supplemental far-red light stimulates lettuce growth: Disentangling morphological and physiological effects. Plants 2021, 10, 166. [Google Scholar] [CrossRef]
- Kim, C.; van Iersel, M.W. Morphological and physiological screening to predict lettuce biomass production in controlled environment agriculture. Remote Sens. 2022, 14, 316. [Google Scholar] [CrossRef]
- Eguchi, M.; Enjoji, A.; Yamaguchi, J.; Iwasaki, Y.; Kitaya, Y. An alternative method for growth analysis of lettuce grown in a plant factory with artificial lighting using projected canopy area and fresh mass. In Proceedings of the XXXI International Horticultural Congress (IHC2022): International Symposium on Advances in Vertical Farming 1369, Angers, France, 14–20 August 2022; pp. 243–248. [Google Scholar]
- Hosoda, Y.; Tada, T.; Goto, H. Lettuce Fresh Weight Prediction in a Plant Factory Using Plant Growth Models. IEEE Access 2024, 12, 97226–97234. [Google Scholar] [CrossRef]
- Mortensen, A.K.; Bender, A.; Whelan, B.; Barbour, M.M.; Sukkarieh, S.; Karstoft, H.; Gislum, R. Segmentation of lettuce in coloured 3D point clouds for fresh weight estimation. Comput. Electron. Agric. 2018, 154, 373–381. [Google Scholar] [CrossRef]
- Xu, D.; Chen, J.; Li, B.; Ma, J. Improving lettuce fresh weight estimation accuracy through RGB-D fusion. Agronomy 2023, 13, 2617. [Google Scholar] [CrossRef]
- Jayalath, T.C.; van Iersel, M.W. Canopy size and light use efficiency explain growth differences between lettuce and mizuna in vertical farms. Plants 2021, 10, 704. [Google Scholar] [CrossRef] [PubMed]
- Coelho, A.F.S.; Gomes, É.P.; Sousa, A.D.P.; Glória, M.B.A. Effect of irrigation level on yield and bioactive amine content of American lettuce. J. Sci. Food Agric. 2005, 85, 1026–1032. [Google Scholar] [CrossRef]
- Iradukunda, M.; van Iersel, M.W.; Seymour, L.; Lu, G.; Ferrarezi, R.S. Low-cost imaging to quantify germination rate and seedling vigor across lettuce cultivars. Sensors 2024, 24, 4225. [Google Scholar] [CrossRef] [PubMed]
- Ban, S.; Hong, I.; Kwack, Y. Prediction of growth and quality of chinese cabbage seedlings cultivated in different plug cell sizes via analysis of image data using multispectral camera. Horticulturae 2023, 9, 1288. [Google Scholar] [CrossRef]
- Li, L.; Tong, Y.X.; Lu, J.L.; Li, Y.M.; Yang, Q.C. Lettuce growth, nutritional quality, and energy use efficiency as affected by red–blue light combined with different monochromatic wavelengths. HortScience 2020, 55, 613–620. [Google Scholar] [CrossRef]
- Golzarian, M.R.; Frick, R.A.; Rajendran, K.; Berger, B.; Roy, S.; Tester, M.; Lun, D.S. Accurate inference of shoot biomass from high-throughput images of cereal plants. Plant Methods 2011, 7, 2. [Google Scholar] [CrossRef] [PubMed]
- Jiang, Y.; Li, C.; Paterson, A.H.; Sun, S.; Xu, R.; Robertson, J. Quantitative analysis of cotton canopy size in field conditions using a consumer-grade RGB-D camera. Front. Plant Sci. 2018, 8, 2233. [Google Scholar] [CrossRef]
- Weraduwage, S.M.; Chen, J.; Anozie, F.C.; Morales, A.; Weise, S.E.; Sharkey, T.D. The relationship between leaf area growth and biomass accumulation in Arabidopsis thaliana. Front. Plant Sci. 2015, 6, 167. [Google Scholar] [CrossRef]
- Moriyuki, S.; Fukuda, H. High-throughput growth prediction for Lactuca sativa L. seedlings using chlorophyll fluorescence in a plant factory with artificial lighting. Front. Plant Sci. 2016, 7, 394. [Google Scholar] [CrossRef] [PubMed]
- Li, C.; Adhikari, R.; Yao, Y.; Miller, A.G.; Kalbaugh, K.; Li, D.; Nemali, K. Measuring plant growth characteristics using smartphone based image analysis technique in controlled environment agriculture. Comput. Electron. Agric. 2020, 168, 105123. [Google Scholar] [CrossRef]
- Zhang, P.; Li, D. YOLO-VOLO-LS: A novel method for variety identification of early lettuce seedlings. Front. Plant Sci. 2022, 13, 806878. [Google Scholar] [CrossRef] [PubMed]


Disclaimer/Publisher’s Note: The statements, opinions and data contained in all publications are solely those of the individual author(s) and contributor(s) and not of MDPI and/or the editor(s). MDPI and/or the editor(s) disclaim responsibility for any injury to people or property resulting from any ideas, methods, instructions or products referred to in the content. |
© 2024 by the authors. Licensee MDPI, Basel, Switzerland. This article is an open access article distributed under the terms and conditions of the Creative Commons Attribution (CC BY) license (https://creativecommons.org/licenses/by/4.0/).