
Ecklonia maxima and Glycine–Betaine-Based Biostimulants Improve Blueberry Yield and Quality

 ,
,  , ,
, ,  , and
, and 
Abstract
1. Introduction
2. Materials and Methods
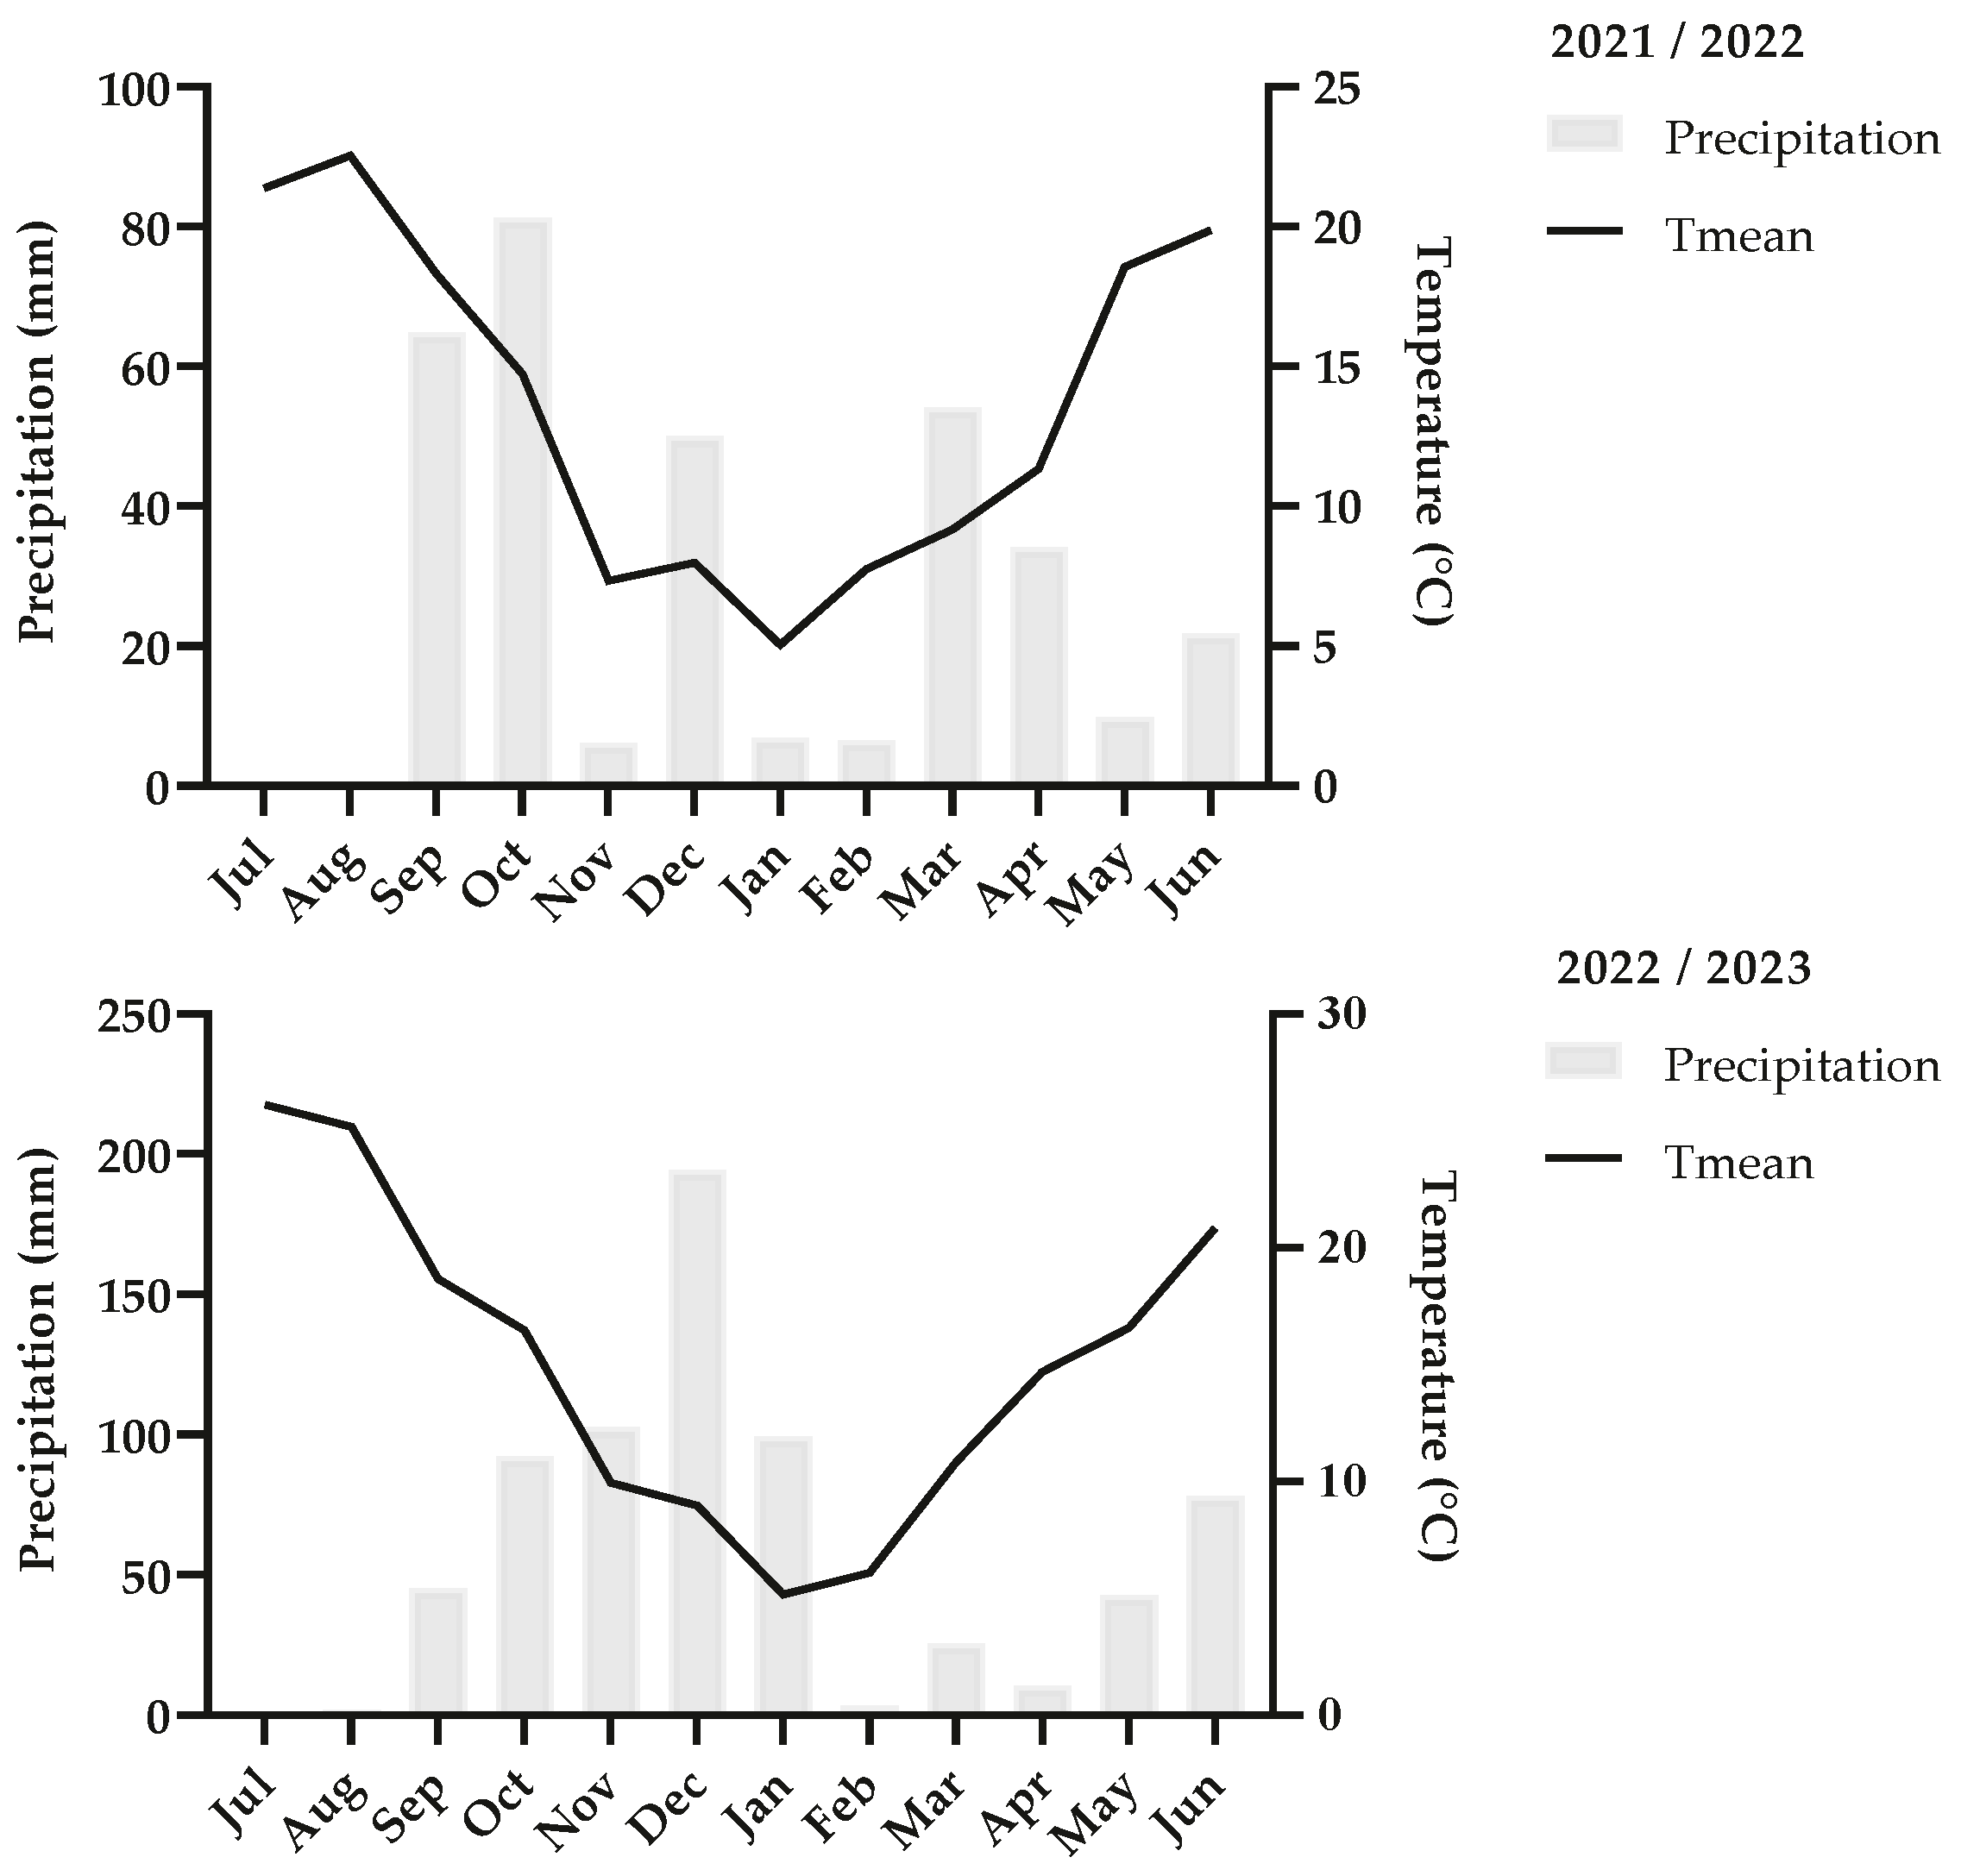
2.1. Characteristics of the Research Area and Plant Material
2.2. Experimental Design and Sampling
2.3. Yield and Fruit Quality Assessment
2.4. Determination of Organic Acids
2.5. Sensory Analysis
2.6. Statistical Analysis
3. Results
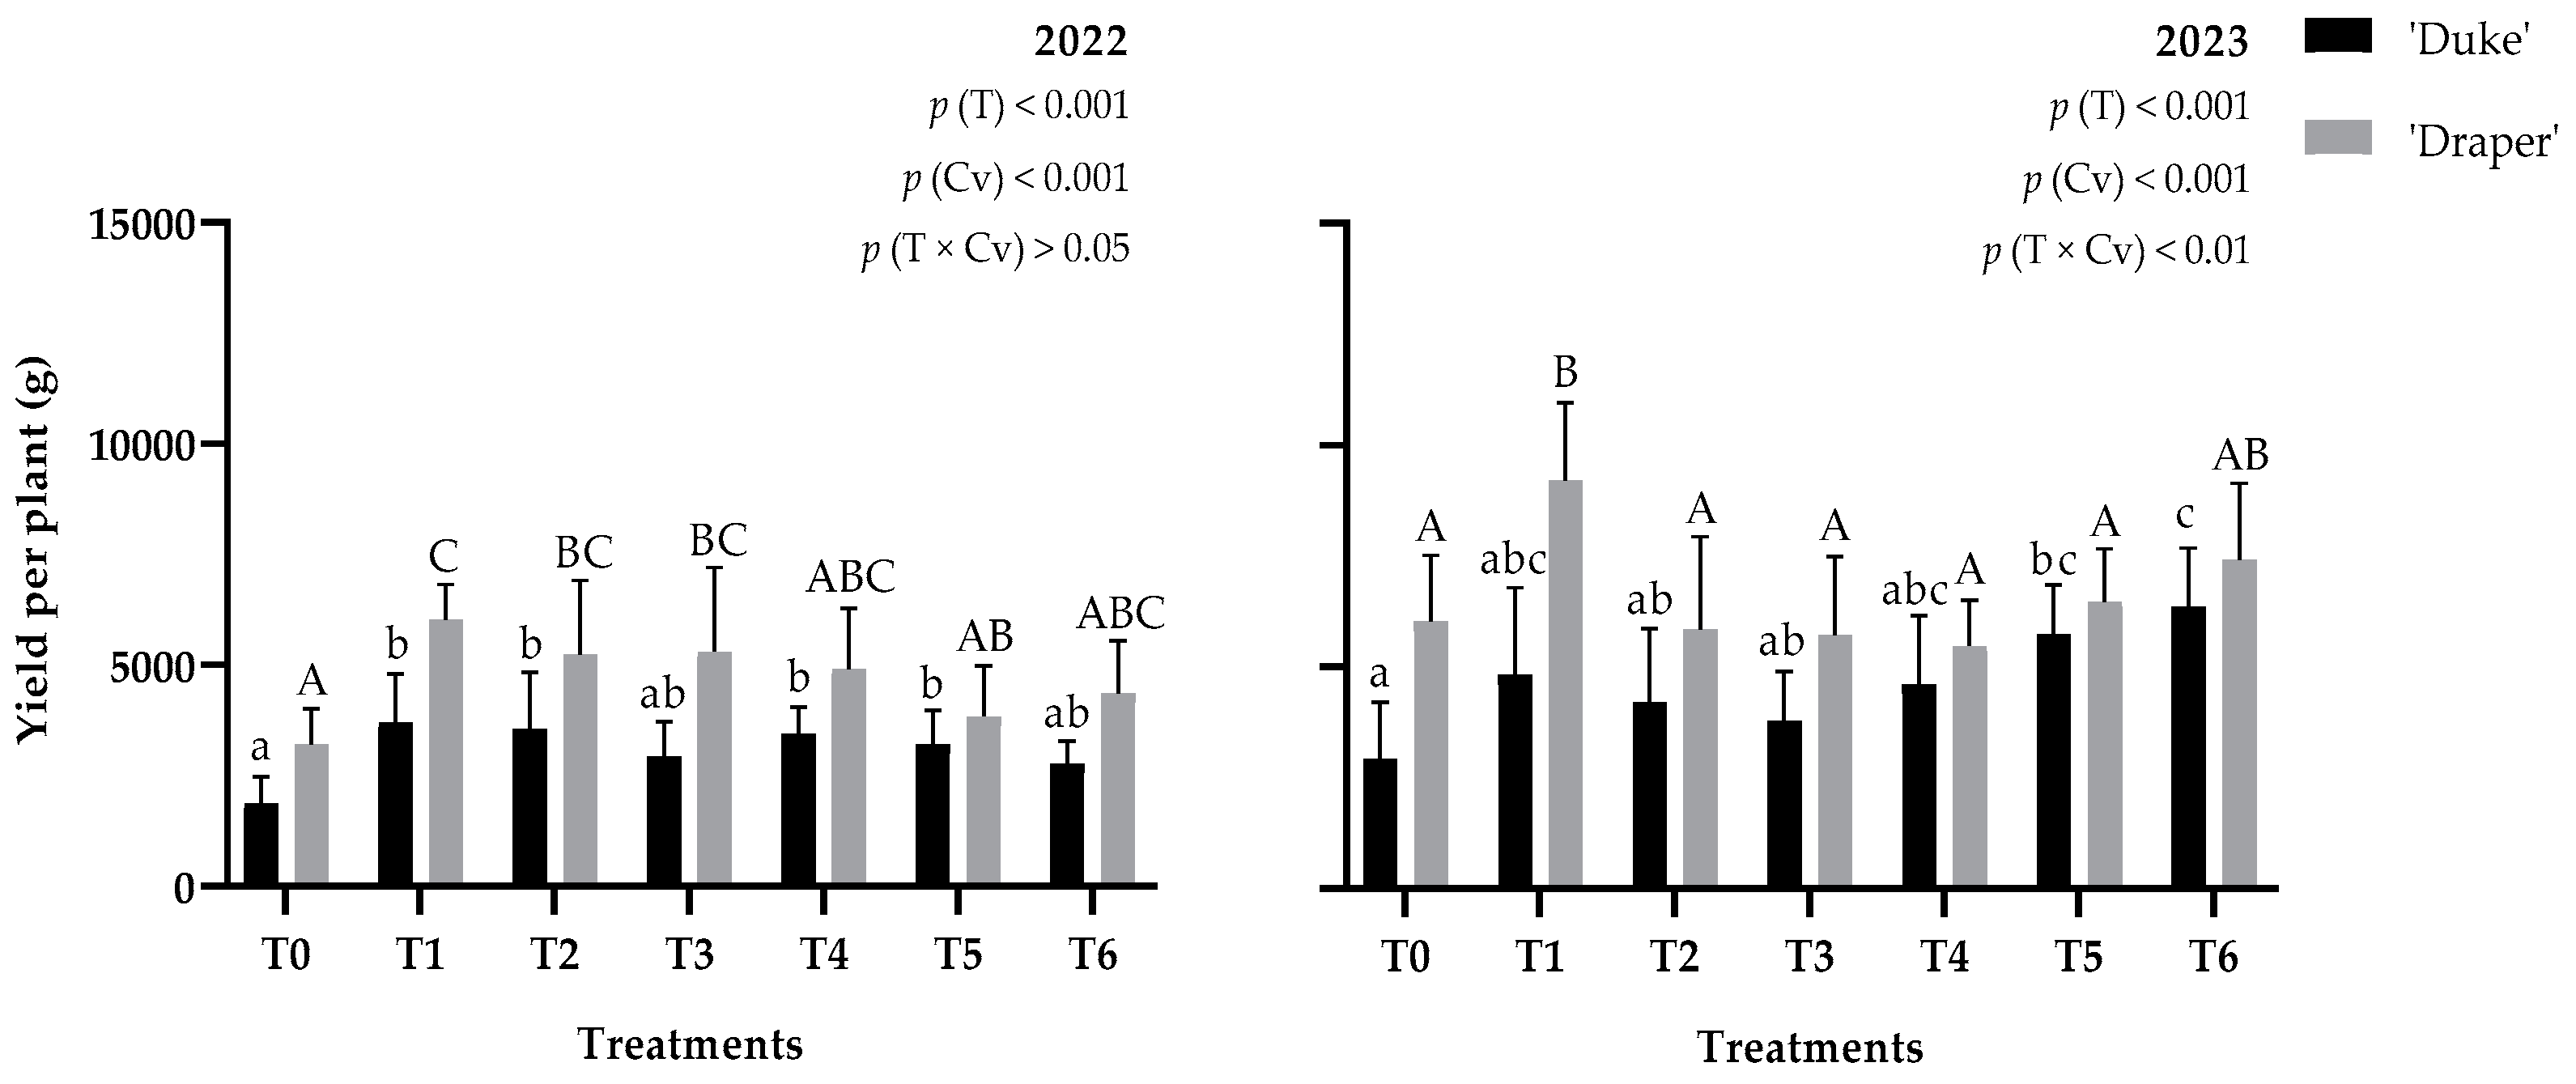
3.1. Fruit Yield
3.2. Fruit Weight and Size
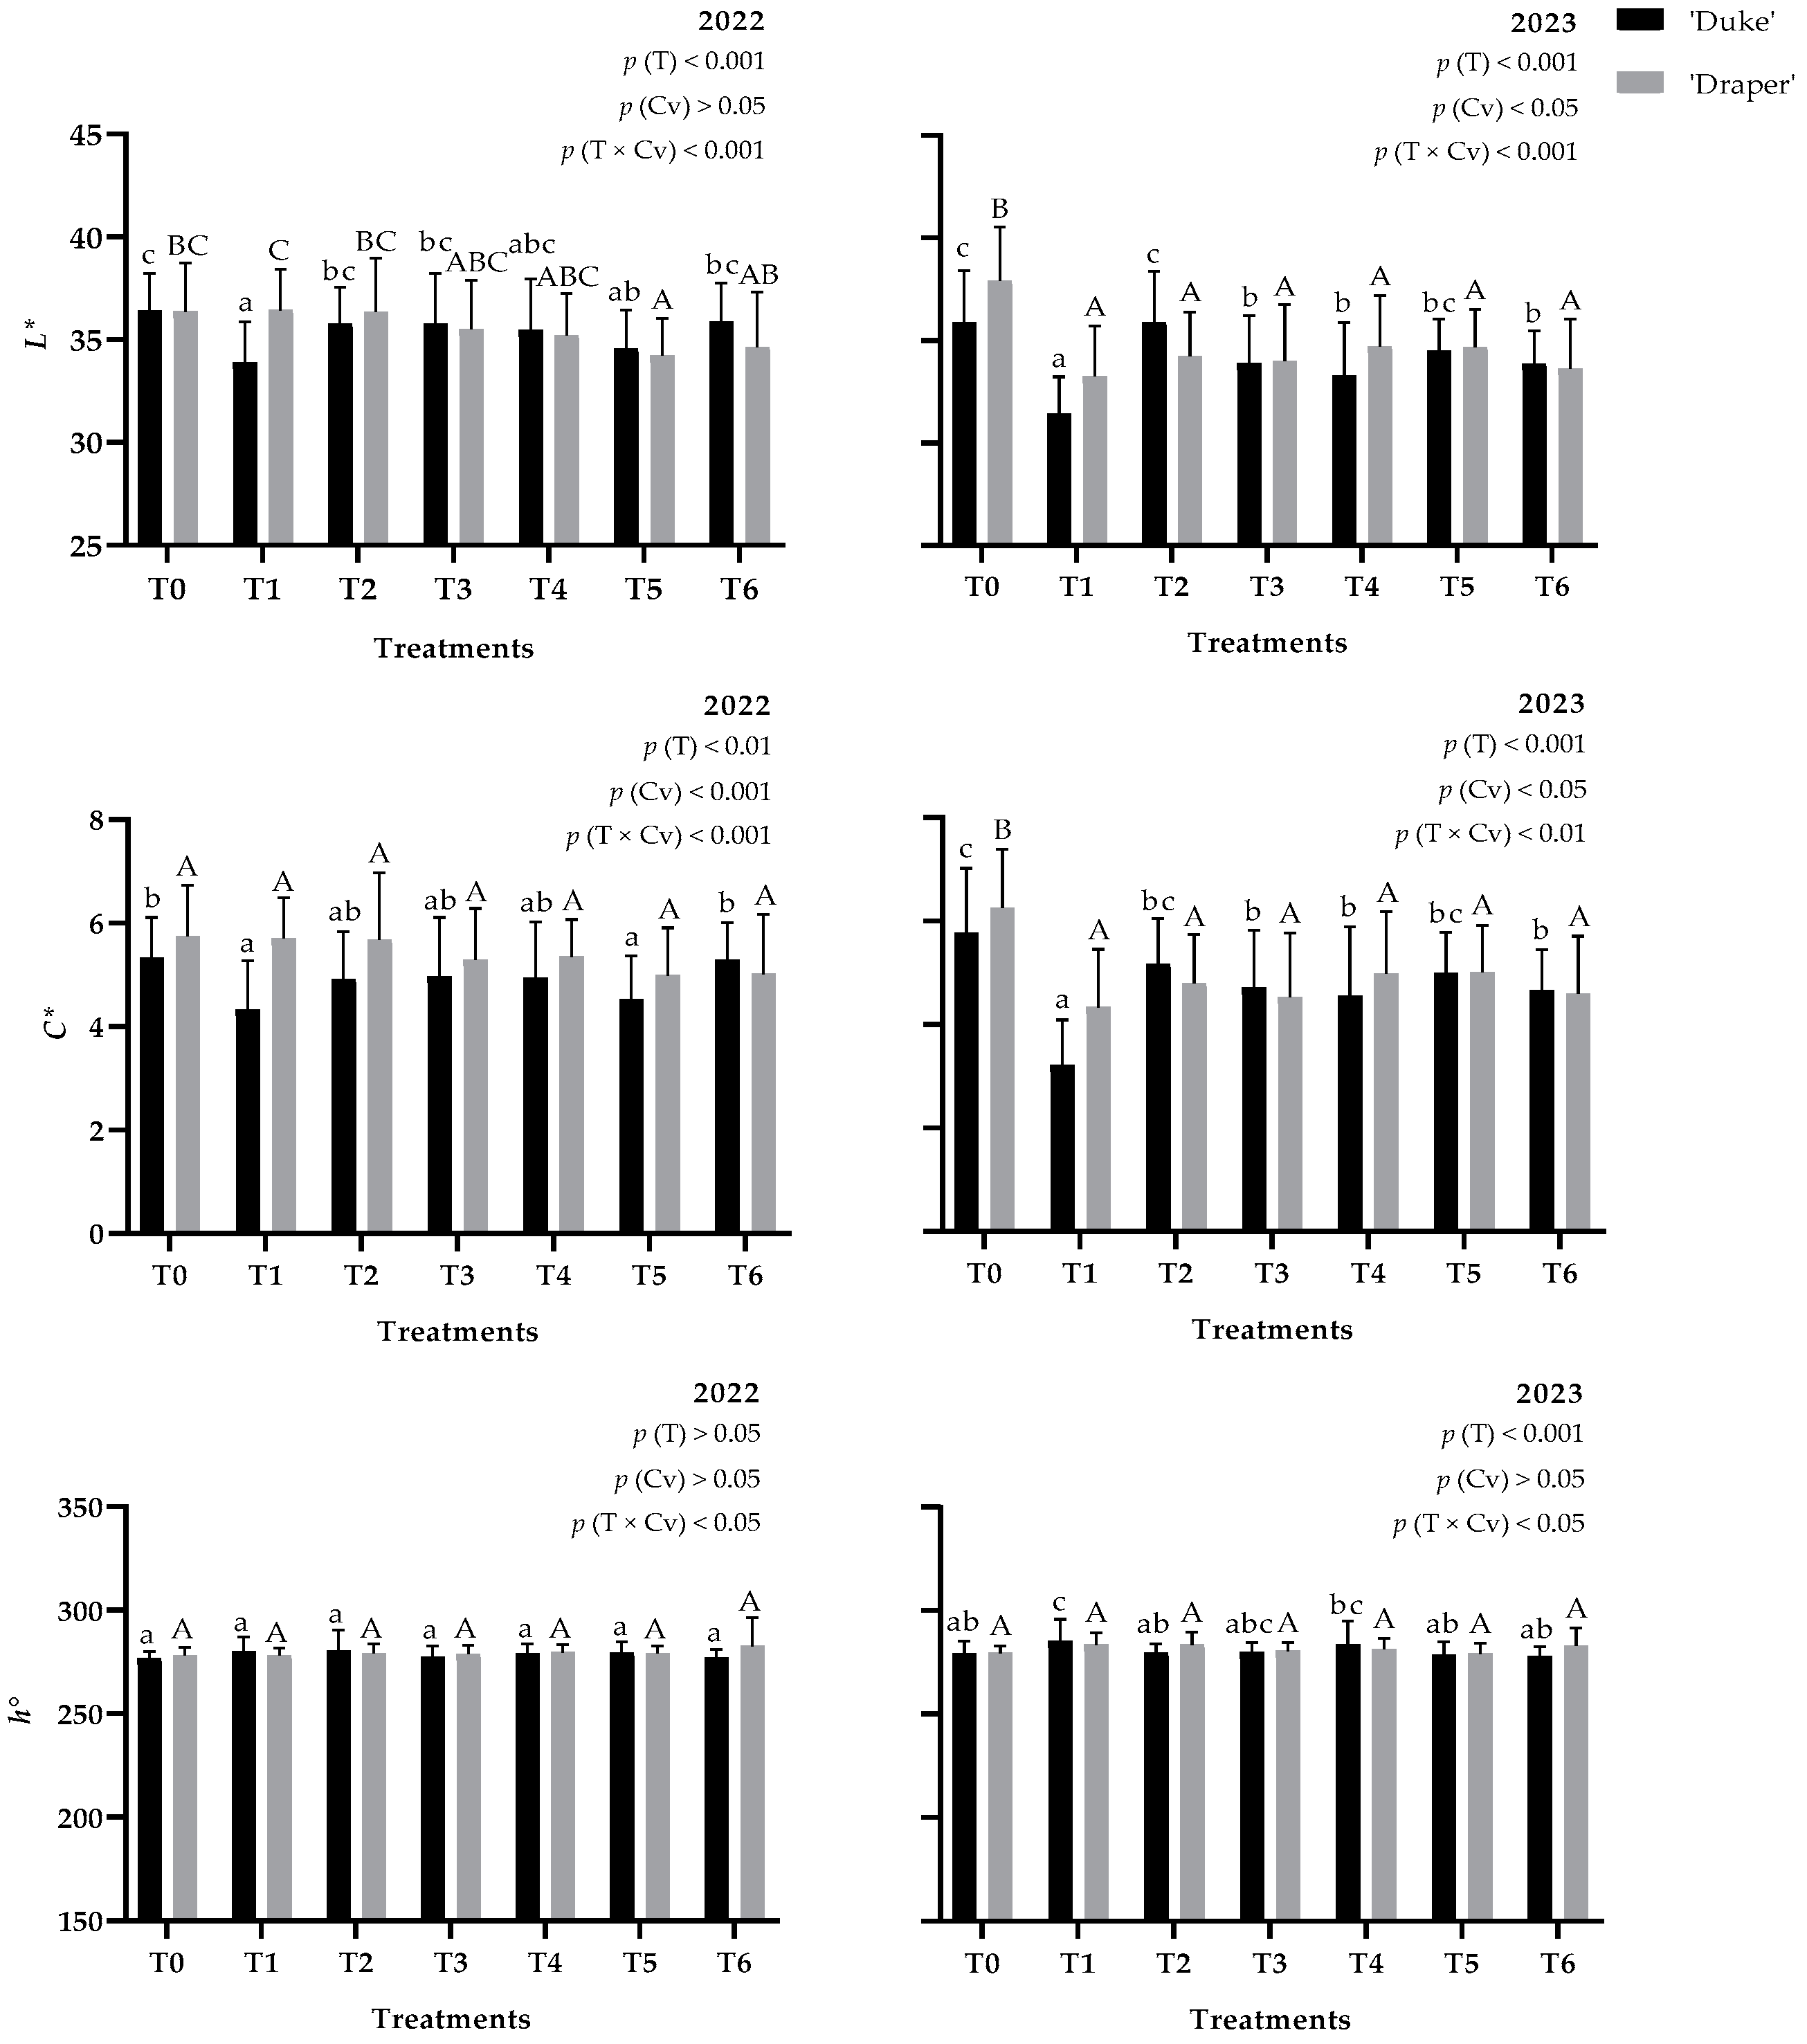
3.3. Fruit Color
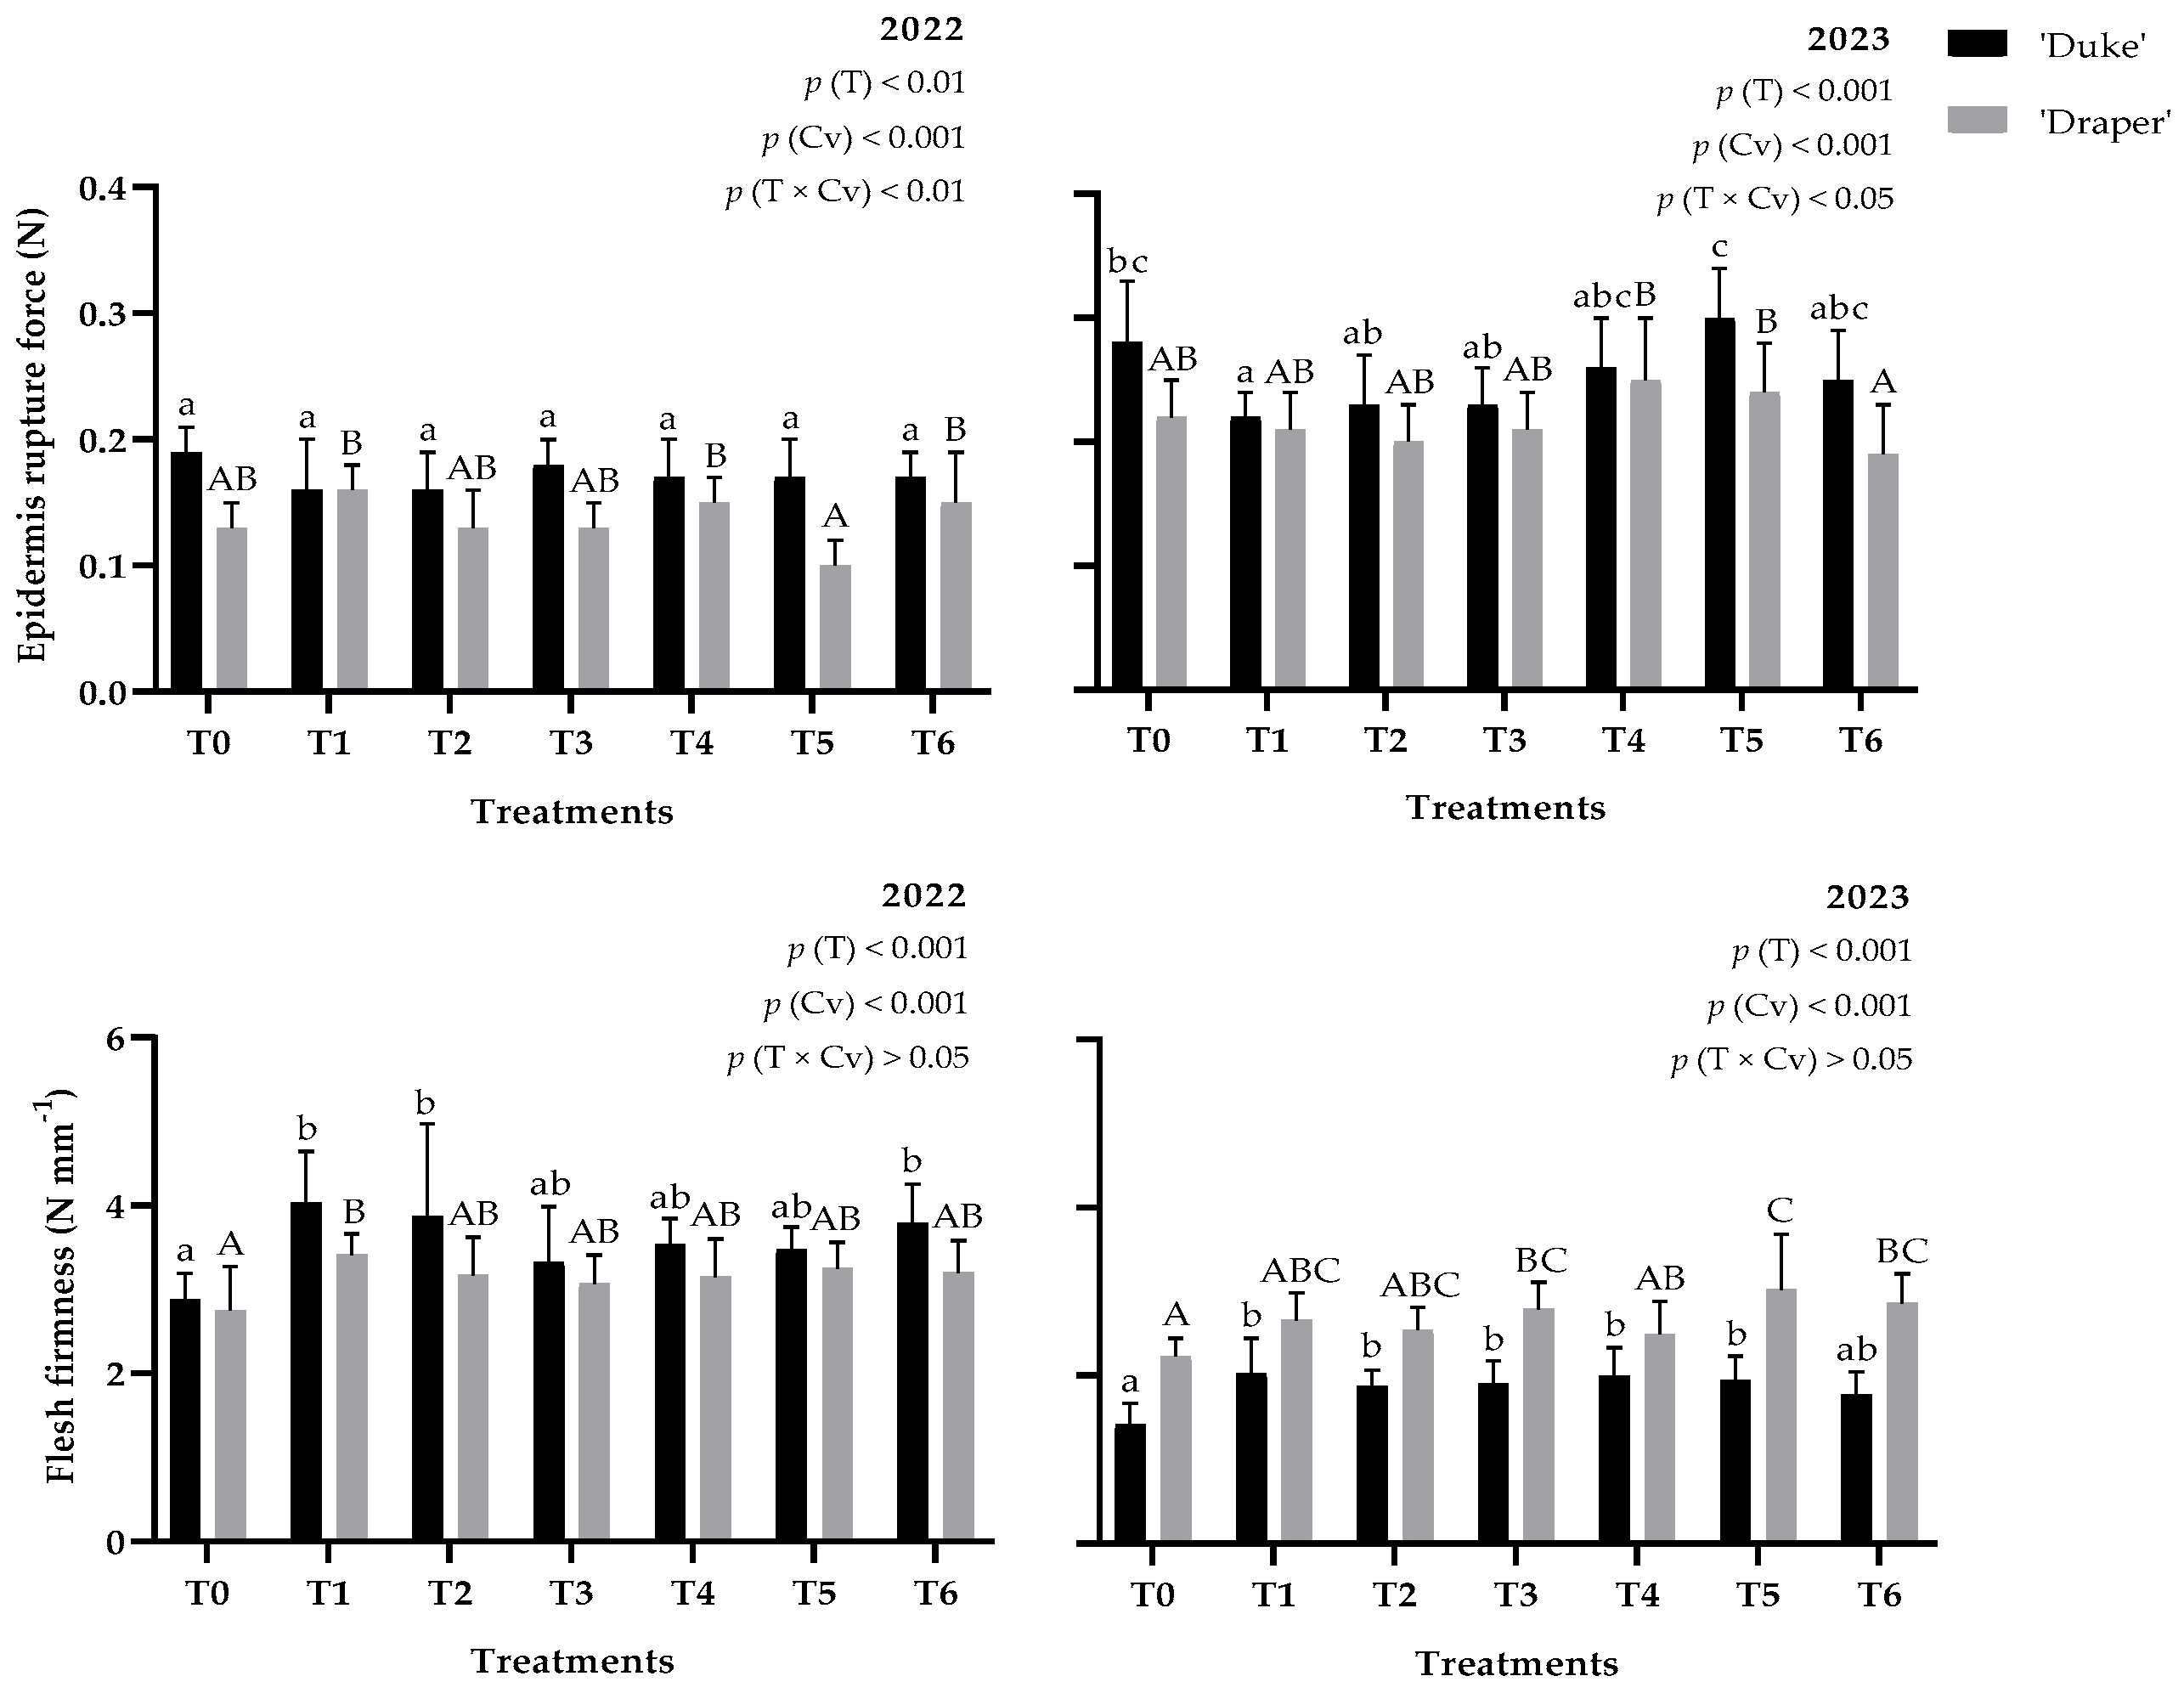
3.4. Texture Attributes
3.5. pH, Total Soluble Solids, Titratable Acidity, and Maturity Index
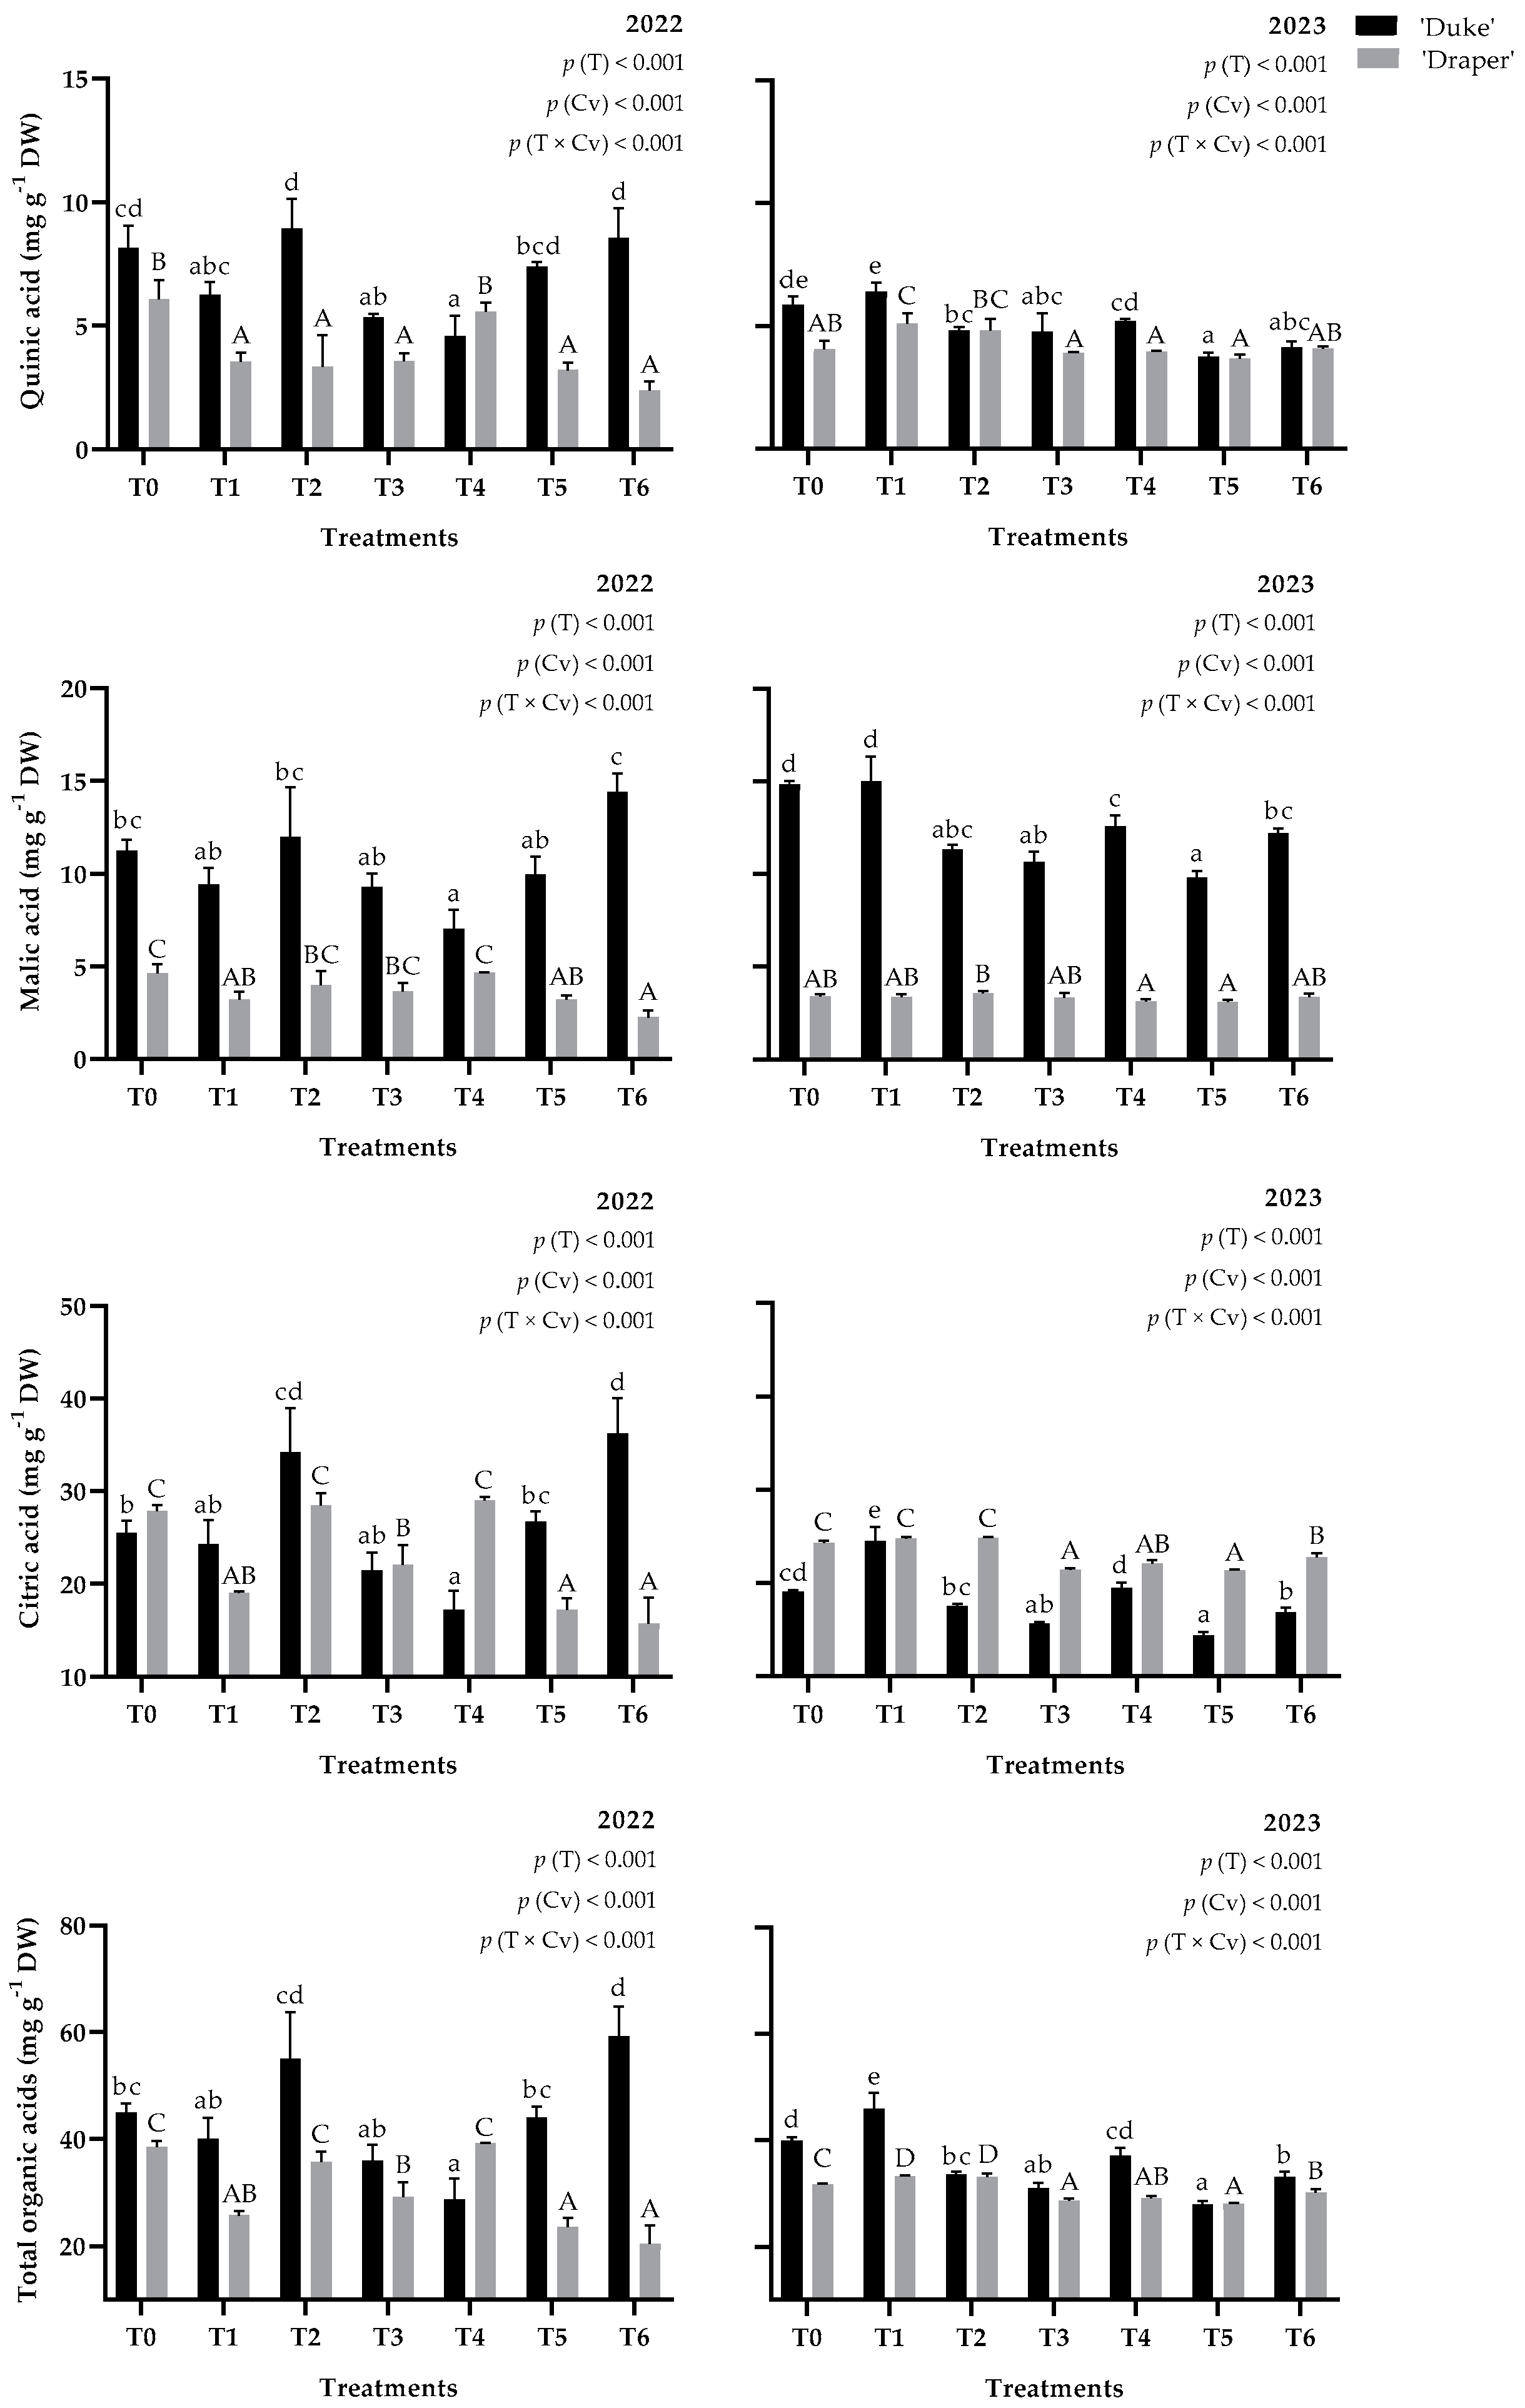
3.6. Organic Acids
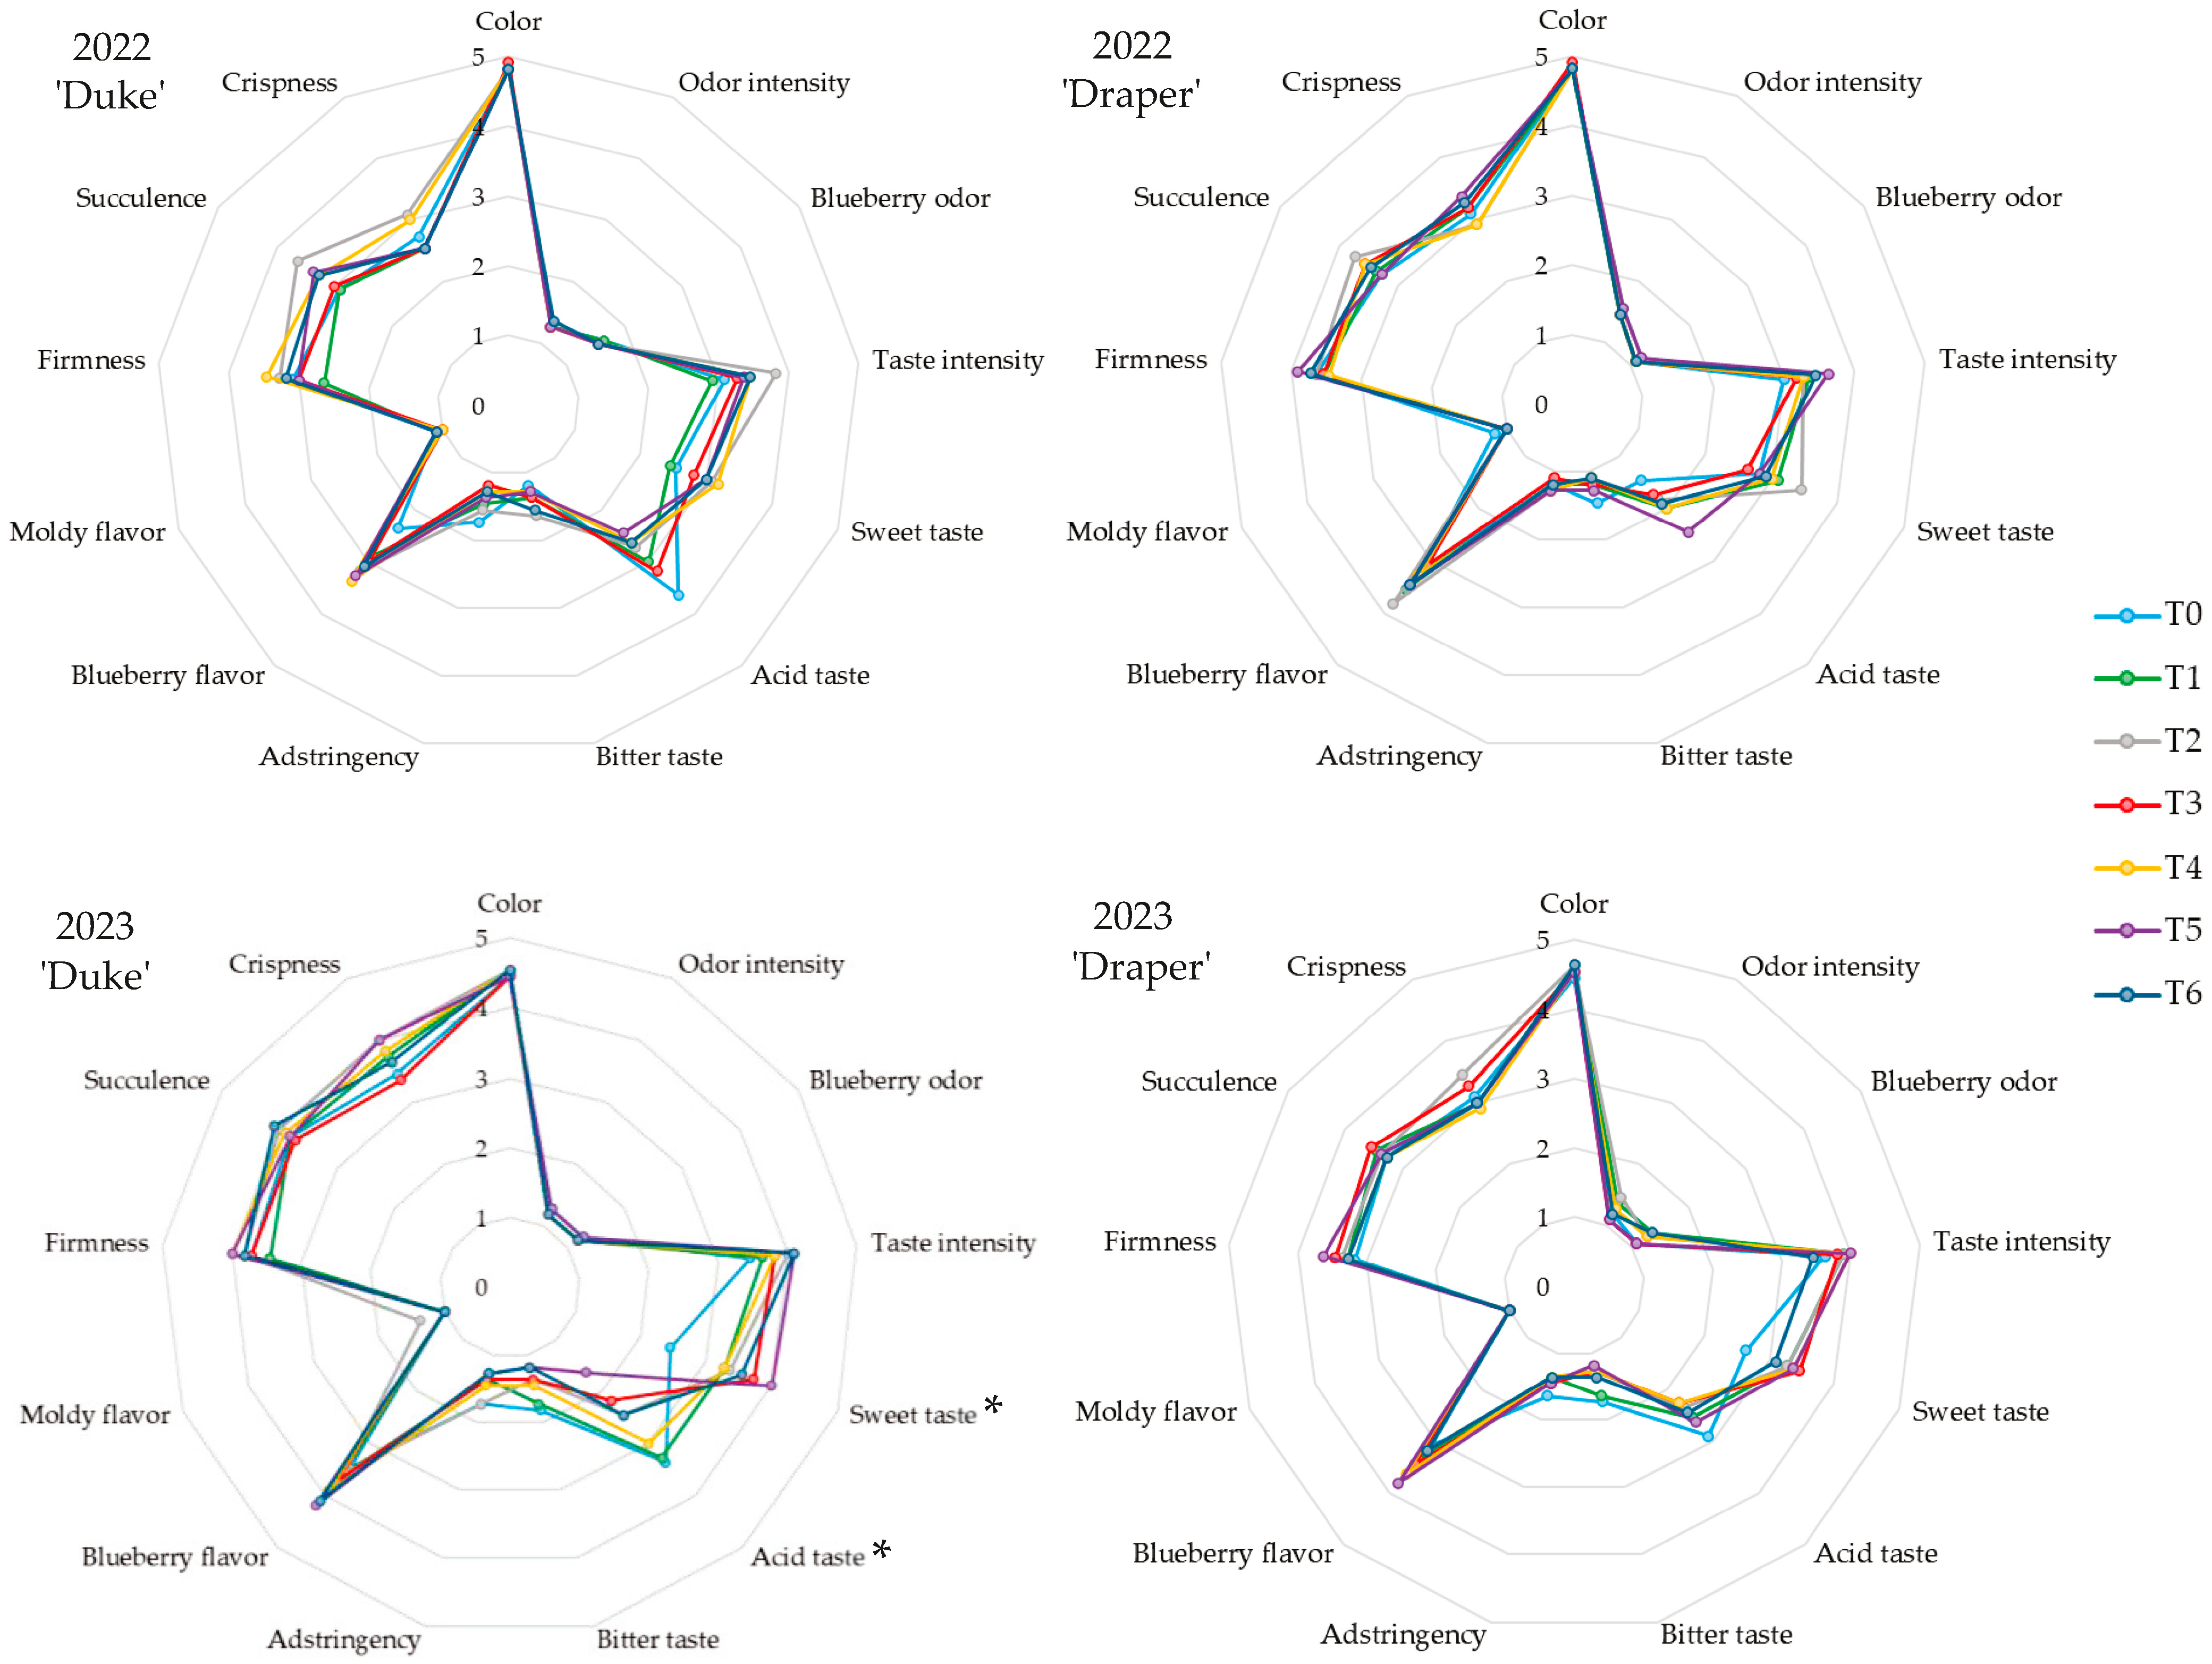
3.7. Sensorial Analysis
4. Discussion
4.1. Can Biostimulants Impact Blueberry Yield
4.2. EM and GB Improve Blueberry Biometric Properties
4.3. Effect of Biostimulants Application on Blueberry Color
4.4. Blueberry Texture Is Affected by EM and GB Foliar Application
4.5. The Influence of the Foliar Application of Biostimulants on pH, TSS, TA, and MI
4.6. Do the Foliar Treatments Affect Blueberry Acidity
4.7. The Role of Spray Treatments on Sensorial Attributes
5. Conclusions
Author Contributions
Funding
Data Availability Statement
Acknowledgments
Conflicts of Interest
Appendix A

| Parameters | p (T) | p (Cv) | p (Y) | p (T × Cv) | p (T × Y) | p (C × Y) | p (T × Cv × Y) |
|---|---|---|---|---|---|---|---|
| Yield | <0.001 | <0.001 | <0.001 | <0.01 | <0.001 | >0.05 | >0.05 |
| Weight | <0.001 | <0.001 | <0.001 | <0.001 | >0.05 | <0.001 | >0.05 |
| Height | <0.001 | <0.001 | <0.001 | <0.001 | <0.01 | <0.001 | >0.05 |
| Width | <0.001 | <0.001 | <0.001 | <0.001 | >0.05 | <0.001 | <0.05 |
| Calyx scar | <0.001 | <0.001 | <0.001 | >0.05 | >0.05 | <0.05 | >0.05 |
| Width/Height | <0.001 | <0.001 | <0.001 | <0.001 | <0.01 | >0.05 | >0.05 |
| L* | <0.001 | <0.001 | <0.001 | <0.001 | <0.001 | >0.05 | <0.01 |
| C* | <0.001 | <0.001 | <0.001 | <0.001 | <0.001 | >0.05 | >0.05 |
| h° | <0.001 | <0.001 | <0.001 | <0.001 | <0.05 | >0.05 | >0.05 |
| ERF | <0.001 | <0.001 | <0.001 | <0.001 | <0.001 | >0.05 | >0.05 |
| FF | <0.001 | <0.001 | <0.001 | >0.05 | <0.05 | <0.001 | >0.05 |
| pH | <0.001 | <0.001 | <0.001 | >0.05 | >0.05 | <0.001 | <0.01 |
| TSS | <0.001 | <0.001 | <0.01 | <0.05 | <0.05 | >0.05 | <0.001 |
| TA | <0.001 | <0.05 | <0.05 | >0.05 | >0.05 | <0.001 | >0.05 |
| MI | <0.001 | <0.001 | >0.05 | >0.05 | >0.05 | <0.001 | >0.05 |
| Quinic Acid | <0.001 | <0.001 | <0.001 | <0.001 | <0.001 | <0.001 | <0.001 |
| Malic Acid | <0.001 | <0.001 | <0.001 | <0.001 | <0.001 | <0.001 | <0.001 |
| Citric Acid | <0.001 | >0.05 | <0.001 | <0.001 | <0.001 | <0.001 | <0.001 |
| Total Organic Acids | <0.001 | <0.001 | <0.001 | <0.001 | <0.001 | <0.001 | <0.001 |
References
- Brazelton, C.; Fain, C.; Ogg, M.; Riquelme, C.; Rodriguez, V.; Ilyas, S. Global State of the Blueberry Industry Report; IBO: Santiago, Chile, 2023; p. 226. [Google Scholar]
- Rokayya, S.; Jia, F.; Li, Y.; Nie, X.; Xu, J.; Han, R.; Yu, H.; Amanullah, S.; Almatrafi, M.M.; Helal, M. Application of Nano-Titanum Dioxide Coating on Fresh Highbush Blueberries Shelf Life Stored under Ambient Temperature. LWT 2021, 137, 110422. [Google Scholar] [CrossRef]
- Duan, Y.; Tarafdar, A.; Chaurasia, D.; Singh, A.; Bhargava, P.C.; Yang, J.; Li, Z.; Ni, X.; Tian, Y.; Li, H.; et al. Blueberry Fruit Valorization and Valuable Constituents: A Review. Int. J. Food Microbiol. 2022, 381, 109890. [Google Scholar] [CrossRef] [PubMed]
- Działo, M.; Mierziak, J.; Korzun, U.; Preisner, M.; Szopa, J.; Kulma, A. The Potential of Plant Phenolics in Prevention and Therapy of Skin Disorders. Int. J. Mol. Sci. 2016, 17, 160. [Google Scholar] [CrossRef] [PubMed]
- Kalt, W.; Cassidy, A.; Howard, L.R.; Krikorian, R.; Stull, A.J.; Tremblay, F.; Zamora-Ros, R. Recent Research on the Health Benefits of Blueberries and Their Anthocyanins. Adv. Nutr. 2020, 11, 224–236. [Google Scholar] [CrossRef] [PubMed]
- Silva, S.; Costa, E.M.; Veiga, M.; Morais, R.M.; Calhau, C.; Pintado, M. Health Promoting Properties of Blueberries: A Review. Crit. Rev. Food Sci. Nutr. 2020, 60, 181–200. [Google Scholar] [CrossRef] [PubMed]
- Gilbert, J.L.; Olmstead, J.W.; Colquhoun, T.A.; Levin, L.A.; Clark, D.G.; Moskowitz, H.R. Consumer-Assisted Selection of Blueberry Fruit Quality Traits. HortScience 2014, 49, 864–873. [Google Scholar] [CrossRef]
- Moggia, C.; Valdés, Y.; Arancibia, A.; Valdés, M.; Radrigan, C.; Icaza, G.; Beaudry, R.; Lobos, G.A. A Comparison of Firmness Assessment Instruments for Fresh Blueberry Fruit. HortTechnology 2022, 32, 172–181. [Google Scholar] [CrossRef]
- Regulation (EU) 2019/1009 of the European Parliament and of the Council of 5 June 2019 Laying Down Rules on the Making Available on the Market of EU Fertilising Products and Amending Regulations (EC) No 1069/2009 and (EC) No 1107/2009 and Repealing Regulation (EC) No 2003/2003. Available online: https://eur-lex.europa.eu/legal-content/EN/TXT/?uri=CELEX%3A02019R1009-20230316 (accessed on 4 April 2024).
- Calvo, P.; Nelson, L.; Kloepper, J.W. Agricultural Uses of Plant Biostimulants. Plant Soil 2014, 383, 3–41. [Google Scholar] [CrossRef]
- Yakhin, O.I.; Lubyanov, A.A.; Yakhin, I.A.; Brown, P.H. Biostimulants in Plant Science: A Global Perspective. Front. Plant Sci. 2017, 7, 2049. [Google Scholar] [CrossRef]
- Regni, L.; Del Buono, D.; Miras-Moreno, B.; Senizza, B.; Lucini, L.; Trevisan, M.; Morelli Venturi, D.; Costantino, F.; Proietti, P. Biostimulant Effects of an Aqueous Extract of Duckweed (Lemna minor L.) on Physiological and Biochemical Traits in the Olive Tree. Agriculture 2021, 11, 1299. [Google Scholar] [CrossRef]
- El Boukhari, M.E.M.; Barakate, M.; Bouhia, Y.; Lyamlouli, K. Trends in Seaweed Extract Based Biostimulants: Manufacturing Process and Beneficial Effect on Soil-Plant Systems. Plants 2020, 9, 359. [Google Scholar] [CrossRef]
- Stirk, W.A.; Rengasamy, K.R.R.; Kulkarni, M.G.; Van Staden, J. Plant Biostimulants from Seaweed: An Overview. In The Chemical Biology of Plant Biostimulants; Geelen, D., Xu, L., Eds.; Wiley: Hoboken, NJ, USA, 2020; pp. 31–55. [Google Scholar] [CrossRef]
- Del Buono, D. Can Biostimulants Be Used to Mitigate the Effect of Anthropogenic Climate Change on Agriculture? It Is Time to Respond. Sci. Total Environ. 2021, 751, 141763. [Google Scholar] [CrossRef] [PubMed]
- Khan, W.; Rayirath, U.P.; Subramanian, S.; Jithesh, M.N.; Rayorath, P.; Hodges, D.M.; Critchley, A.T.; Craigie, J.S.; Norrie, J.; Prithiviraj, B. Seaweed Extracts as Biostimulants of Plant Growth and Development. J. Plant Growth Regul. 2009, 28, 386–399. [Google Scholar] [CrossRef]
- Kadam, S.U.; Álvarez, C.; Tiwari, B.K.; O’Donnell, C.P. Extraction of Biomolecules from Seaweeds. In Seaweed Sustainability; Elsevier: Amsterdam, The Netherlands, 2015; pp. 243–269. [Google Scholar] [CrossRef]
- Goñi, O.; Quille, P.; O’Connell, S. Seaweed Carbohydrates. In The Chemical Biology of Plant Biostimulants; Geelen, D., Xu, L., Eds.; Wiley: Hoboken, NJ, USA, 2020; pp. 57–95. [Google Scholar] [CrossRef]
- Blunden, G.; Morse, P.F.; Mathe, I.; Hohmann, J.; Critchley, A.T.; Morrell, S. Betaine Yields from Marine Algal Species Utilized in the Preparation of Seaweed Extracts Used in Agriculture. Nat. Prod. Commun. 2010, 5, 581–585. [Google Scholar] [CrossRef] [PubMed]
- Aryee, A.N.; Agyei, D.; Akanbi, T.O. Recovery and Utilization of Seaweed Pigments in Food Processing. Curr. Opin. Food Sci. 2018, 19, 113–119. [Google Scholar] [CrossRef]
- Guinan, K.J.; Sujeeth, N.; Copeland, R.B.; Jones, P.W.; O’Brien, N.M.; Sharma, H.S.S.; Prouteau, P.F.J.; O’Sullivan, J.T. Discrete Roles For Extracts of Ascophyllum nodosum in Enhancing Plant Growth and Tolerance to Abiotic and Biotic Stresses. Acta Hortic. 2013, 1009, 127–135. [Google Scholar] [CrossRef]
- Mukherjee, A.; Patel, J.S. Seaweed Extract: Biostimulator of Plant Defense and Plant Productivity. Int. J. Environ. Sci. Technol. 2020, 17, 553–558. [Google Scholar] [CrossRef]
- Spinelli, F.; Fiori, G.; Noferini, M.; Sprocatti, M.; Costa, G. A Novel Type of Seaweed Extract as a Natural Alternative to the Use of Iron Chelates in Strawberry Production. Sci. Hortic. 2010, 125, 263–269. [Google Scholar] [CrossRef]
- Battacharyya, D.; Babgohari, M.Z.; Rathor, P.; Prithiviraj, B. Seaweed Extracts as Biostimulants in Horticulture. Sci. Hortic. 2015, 196, 39–48. [Google Scholar] [CrossRef]
- Colapietra, M.; Alexander, A. Effect of Foliar Fertilization on Yield and Quality of Table Grapes. Acta Hortic. 2006, 721, 213–218. [Google Scholar] [CrossRef]
- Norrie, J.; Keathley, J.P. Benefits of Ascophyllum nodosum marine-plant extract application to “thompson seedless” grape production. Acta Hortic. 2006, 727, 243–248. [Google Scholar] [CrossRef]
- Raqgab, A.-M. Seaweed Extract Improves Growth, Yield and Quality of Different Watermelon Hybrids. Res. J. Agric. Biol. Sci. 2010, 6, 161–168. [Google Scholar]
- Colavita, G.M.; Spera, N.; Blackhall, V.; Sepulveda, G.M. Effect of seaweed extract on pear fruit quality and yield. Acta Hortic. 2011, 909, 601–607. [Google Scholar] [CrossRef]
- Khan, A.S.; Ahmad, B.; Jaskani, M.J.; Ahmad, R.; Malik, A.U. Foliar Application of Mixture of Amino Acids and Seaweed (Ascophylum nodosum) Extract Improve Growth and Physico-Chemical Properties of Grapes. Int. J. Agric. Biol. 2012, 14, 383–388. [Google Scholar]
- Abad, M.S.F.; Abedi, B.; Ne’emati, S.H. Studying the Effects of Foliar Spraying of Seaweed Extract as a Bio-Stimulant on the Increase on the Yield and Quality of Tomato (Lycopersicon esculentum L.). World J. Environ. Biosci. 2019, 8, 11–17. [Google Scholar]
- Soppelsa, S.; Kelderer, M.; Casera, C.; Bassi, M.; Robatscher, P.; Matteazzi, A.; Andreotti, C. Foliar Applications of Biostimulants Promote Growth, Yield and Fruit Quality of Strawberry Plants Grown under Nutrient Limitation. Agronomy 2019, 9, 483. [Google Scholar] [CrossRef]
- Nagy, P.T.; Csihon, Á.; Szabó, A. Effects of algae products on nutrient uptake and fruit quality of apple. Nat. Resour. Sustain. 2019, 9, 80–91. [Google Scholar] [CrossRef]
- Correia, S.; Aires, A.; Queirós, F.; Carvalho, R.; Schouten, R.; Silva, A.P.; Gonçalves, B. Climate Conditions and Spray Treatments Induce Shifts in Health Promoting Compounds in Cherry (Prunus avium L.) Fruits. Sci. Hortic. 2020, 263, 109147. [Google Scholar] [CrossRef]
- Gonçalves, B.; Morais, M.C.; Sequeira, A.; Ribeiro, C.; Guedes, F.; Silva, A.P.; Aires, A. Quality Preservation of Sweet Cherry Cv. “staccato” by Using Glycine-Betaine or Ascophyllum nodosum. Food Chem. 2020, 322, 126713. [Google Scholar] [CrossRef]
- Mattner, S.W.; Villalta, O.N.; McFarlane, D.J.; Islam, M.T.; Arioli, T.; Cahill, D.M. The Biostimulant Effect of an Extract from Durvillaea potatorum and Ascophyllum nodosum Is Associated with the Priming of Reactive Oxygen Species in Strawberry in South-Eastern Australia. J. Appl. Phycol. 2023, 35, 1789–1800. [Google Scholar] [CrossRef]
- Loyola López, N.E.; Aguirre Poblete, F.; Godoy Astudillo, O. Effect of Sucralose and Biostimulant on Pre-and Postharvest of Blueberries (Vaccinium corymbosum L. Cv. Elliot) under Organic and Conventional Production Systems. Acta Agron. 2015, 65, 123–129. [Google Scholar] [CrossRef]
- Koort, A.; Starast, M.; Põldma, P.; Moor, U.; Mainla, L.; Maante-Kuljus, M.; Karp, K. Sustainable Fertilizer Strategies for Vaccinium corymbosum x V. angustifolium under Abandoned Peatland Conditions. Agriculture 2020, 10, 121. [Google Scholar] [CrossRef]
- Lenart, A.; Wrona, D.; Klimek, K.; Kapłan, M.; Krupa, T. Assessment of the Impact of Innovative Fertilization Methods Compared to Traditional Fertilization in the Cultivation of Highbush Blueberry. PLoS ONE 2022, 17, e0271383. [Google Scholar] [CrossRef]
- Paraschiv, M.C.; Nicola, C.; Hoza, D. Effect of Organic Foliar Fertilizers on Yield and Fruit Quality of Seven Highbush Blueberry (Vaccinium corymbosum L.) Cultivars. Sci. Pap. Ser. B Hortic. 2023, 67, 1–10. [Google Scholar]
- Colla, G.; Hoagland, L.; Ruzzi, M.; Cardarelli, M.; Bonini, P.; Canaguier, R.; Rouphael, Y. Biostimulant Action of Protein Hydrolysates: Unraveling Their Effects on Plant Physiology and Microbiome. Front. Plant Sci. 2017, 8, 2202. [Google Scholar] [CrossRef]
- Ureta Ovalle, A.; Atenas, C.; Larraín, P. Application of an Ecklonia maxima Seaweed Product at Two Different Timings Can Improve the Fruit Set and Yield in “Bing” Sweet Cherry Trees. Acta Hortic. 2019, 1235, 319–326. [Google Scholar] [CrossRef]
- Kocira, S.; Szparaga, A.; Hara, P.; Treder, K.; Findura, P.; Bartoš, P.; Filip, M. Biochemical and Economical Effect of Application Biostimulants Containing Seaweed Extracts and Amino Acids as an Element of Agroecological Management of Bean Cultivation. Sci. Rep. 2020, 10, 17759. [Google Scholar] [CrossRef]
- Consentino, B.B.; Vultaggio, L.; Iacuzzi, N.; La Bella, S.; De Pasquale, C.; Rouphael, Y.; Ntatsi, G.; Virga, G.; Sabatino, L. Iodine Biofortification and Seaweed Extract-Based Biostimulant Supply Interactively Drive the Yield, Quality, and Functional Traits in Strawberry Fruits. Plants 2023, 12, 245. [Google Scholar] [CrossRef]
- Sabatino, L.; Consentino, B.B.; Rouphael, Y.; Baldassano, S.; De Pasquale, C.; Ntatsi, G. Ecklonia maxima-Derivate Seaweed Extract Supply as Mitigation Strategy to Alleviate Drought Stress in Chicory Plants. Sci. Hortic. 2023, 312, 111856. [Google Scholar] [CrossRef]
- Hanson, A.D.; Rhodes, D. 14C Tracer Evidence for Synthesis of Choline and Betaine via Phosphoryl Base Intermediates in Salinized Sugarbeet Leaves. Plant Physiol. 1983, 71, 692–700. [Google Scholar] [CrossRef]
- Sakamoto, A.; Murata, N. The Role of Glycine Betaine in the Protection of Plants from Stress: Clues from Transgenic Plants. Plant Cell Environ. 2002, 25, 163–171. [Google Scholar] [CrossRef] [PubMed]
- Chen, T.H.H.; Murata, N. Glycinebetaine: An Effective Protectant against Abiotic Stress in Plants. Trends Plant Sci. 2008, 13, 499–505. [Google Scholar] [CrossRef] [PubMed]
- Chen, T.H.H.; Murata, N. Glycinebetaine Protects Plants against Abiotic Stress: Mechanisms and Biotechnological Applications. Plant Cell Environ. 2011, 34, 1–20. [Google Scholar] [CrossRef]
- Hayes, M.A.; Shor, A.C.; Jesse, A.; Miller, C.; Kennedy, J.P.; Feller, I. The Role of Glycine Betaine in Range Expansions; Protecting Mangroves against Extreme Freeze Events. J. Ecol. 2020, 108, 61–69. [Google Scholar] [CrossRef]
- Hafez, E.M.; Gowayed, S.M.; Nehela, Y.; Sakran, R.M.; Rady, A.M.S.; Awadalla, A.; Omara, A.E.-D.; Alowaiesh, B.F. Incorporated Biochar-Based Soil Amendment and Exogenous Glycine Betaine Foliar Application Ameliorate Rice (Oryza sativa L.) Tolerance and Resilience to Osmotic Stress. Plants 2021, 10, 1930. [Google Scholar] [CrossRef] [PubMed]
- Monteiro, E.; Baltazar, M.; Pereira, S.; Correia, S.; Ferreira, H.; Alves, F.; Cortez, I.; Castro, I.; Gonçalves, B. Ascophyllum nodosum Extract and Glycine Betaine Preharvest Application in Grapevine: Enhancement of Berry Quality, Phytochemical Content and Antioxidant Properties. Antioxidants 2023, 12, 1835. [Google Scholar] [CrossRef]
- Mäkelä, P.; Jokinen, K.; Kontturi, M.; Peltonen-Sainio, P.; Pehu, E.; Somersalo, S. Foliar application of glycine betaine—A novel product from sugar beet as an approach to increase tomato yield. Ind. Crops Prod. 1998, 7, 139–148. [Google Scholar] [CrossRef]
- Wang, G.; Wang, J.; Xue, X.; Lu, C.; Chen, R.; Wang, L.; Han, X. Foliar spraying of glycine betaine lowers photosynthesis inhibition of Malus hupehensis leaves under drought and heat stress. Int. J. Agric. Biol. 2020, 23, 1121–1128. [Google Scholar] [CrossRef]
- Correia, S.; Queirós, F.; Ribeiro, C.; Vilela, A.; Aires, A.; Barros, A.I.; Schouten, R.; Silva, A.P.; Gonçalves, B. Effects of Calcium and Growth Regulators on Sweet Cherry (Prunus avium L.) Quality and Sensory Attributes at Harvest. Sci. Hortic. 2019, 248, 231–240. [Google Scholar] [CrossRef]
- Li, M.; Zhi, H.; Dong, Y. Influence of Preharvest and Postharvest Applications of Glycine Betaine on Fruit Quality Attributes and Storage Disorders of “Lapins” and “Regina” Cherries. HortScience 2019, 54, 1540–1545. [Google Scholar] [CrossRef]
- Serapicos, M.; Afonso, S.; Gonçalves, B.; Silva, A.P. Exogenous Application of Glycine Betaine on Sweet Cherry Tree (Prunus avium L.): Effects on Tree Physiology and Leaf Properties. Plants 2022, 11, 3470. [Google Scholar] [CrossRef]
- Retamales, J.B.; Hancock, J.F. Blueberries, 2nd ed.; Crop production science in horticulture series; CABI: Boston, MA, USA, 2018. [Google Scholar]
- Merca (Laies), M.M.; Cosmulescu, S.N. The diversity of some phenological features in blueberry cultivars (Vaccinium corymbosum L.) grown in Banat area, Romania. Sci. Pap. Ser. B Hortic. 2022, 66, 127–132. [Google Scholar]
- Phillips, M.M.; Case, R.J.; Rimmer, C.A.; Sander, L.C.; Sharpless, K.E.; Wise, S.A.; Yen, J.H. Determination of Organic Acids in Vaccinium Berry Standard Reference Materials. Anal. Bioanal. Chem. 2010, 398, 425–434. [Google Scholar] [CrossRef]
- ISO 8589; Sensory Analysis—General Guidance for the Design of Test Rooms. International Organization for Standardization: Geneva, Switzerland, 2007.
- Vilela, A.; Gonçalves, B.; Ribeiro, C.; Fonseca, A.T.; Correia, S.; Fernandes, H.; Ferreira, S.; Bacelar, E.; Silva, A.P. Study of Textural, Chemical, Color and Sensory Properties of Organic Blueberries Harvested in Two Distinct Years: A Chemometric Approach. J. Texture Stud. 2016, 47, 199–207. [Google Scholar] [CrossRef]
- ISO 4121; Sensory Analysis—Guidelines for the Use of Quantitative Response Scales. International Organization for Standardization: Geneva, Switzerland, 2003.
- Correia, S.; Gonçalves, B.; Aires, A.; Silva, A.; Ferreira, L.; Carvalho, R.; Fernandes, H.; Freitas, C.; Carnide, V.; Paula Silva, A. Effect of Harvest Year and Altitude on Nutritional and Biometric Characteristics of Blueberry Cultivars. J. Chem. 2016, 2016, 8648609. [Google Scholar] [CrossRef]
- Aires, A.; Carvalho, R.; Matos, M.; Carnide, V.; Silva, A.P.; Gonçalves, B. Variation of Chemical Constituents, Antioxidant Activity, and Endogenous Plant Hormones throughout Different Ripening Stages of Highbush Blueberry (Vaccinium corymbosum L.) Cultivars Produced in Centre of Portugal. J. Food Biochem. 2017, 41, e12414. [Google Scholar] [CrossRef]
- Zhang, J.; Nie, J.; Li, J.; Zhang, H.; Li, Y.; Farooq, S.; Bacha, S.A.S.; Wang, J. Evaluation of Sugar and Organic Acid Composition and Their Levels in Highbush Blueberries from Two Regions of China. J. Integr. Agric. 2020, 19, 2352–2361. [Google Scholar] [CrossRef]
- Smrke, T.; Veberic, R.; Hudina, M.; Zitko, V.; Ferlan, M.; Jakopic, J. Fruit Quality and Yield of Three Highbush Blueberry (Vaccinium corymbosum L.) Cultivars Grown in Two Planting Systems under Different Protected Environments. Horticulturae 2021, 7, 591. [Google Scholar] [CrossRef]
- Deolu-Ajayi, A.O.; Van Der Meer, I.M.; Van Der Werf, A.; Karlova, R. The Power of Seaweeds as Plant Biostimulants to Boost Crop Production under Abiotic Stress. Plant Cell Environ. 2022, 45, 2537–2553. [Google Scholar] [CrossRef]
- Mousavi, S.M.; Jafari, A.; Shirmardi, M. The Effect of Seaweed Foliar Application on Yield and Quality of Apple Cv. “Golden Delicious”. Sci. Hortic. 2024, 323, 112529. [Google Scholar] [CrossRef]
- El-Miniawy, S.; Ragab, M.; Youssef, S.; Metwally, A. Influence of foliar spraying of seaweed extract on growth, yield and quality of strawberry plants. J. Appl. Sci. Res. 2014, 10, 88–94. [Google Scholar]
- Ashour, M.; Al-Souti, A.S.; Hassan, S.M.; Ammar, G.A.G.; Goda, A.M.A.-S.; El-Shenody, R.; Abomohra, A.E.-F.; El-Haroun, E.; Elshobary, M.E. Commercial Seaweed Liquid Extract as Strawberry Biostimulants and Bioethanol Production. Life 2023, 13, 85. [Google Scholar] [CrossRef] [PubMed]
- Irani, H.; ValizadehKaji, B.; Naeini, M.R. Biostimulant-Induced Drought Tolerance in Grapevine Is Associated with Physiological and Biochemical Changes. Chem. Biol. Technol. Agric. 2021, 8, 5. [Google Scholar] [CrossRef]
- Kumari, R.; Kaur, I.; Bhatnagar, A.K. Effect of Aqueous Extract of Sargassum johnstonii Setchell & Gardner on Growth, Yield and Quality of Lycopersicon esculentum Mill. J. Appl. Phycol. 2011, 23, 623–633. [Google Scholar] [CrossRef]
- Shabana, A.I.; Shafeek, M.R.; Ahmed, H.I.; Abdel-Al, F.S. Improving growth, fruit setting, total yield and fruit quality of sweet pepper plants (Capsicum annuum L.) by using antioxidant and seaweed extracts. Middle East J. Agric. Res. 2015, 4, 154–161. [Google Scholar]
- Kurepin, L.V.; Ivanov, A.G.; Zaman, M.; Pharis, R.P.; Hurry, V.; Hüner, N.P.A. Interaction of Glycine Betaine and Plant Hormones: Protection of the Photosynthetic Apparatus during Abiotic Stress. In Photosynthesis: Structures, Mechanisms, and Applications; Hou, H.J.M., Najafpour, M.M., Moore, G.F., Allakhverdiev, S.I., Eds.; Springer International Publishing: Cham, Switzerland, 2017; pp. 185–202. [Google Scholar] [CrossRef]
- Zhang, T.; Liang, J.; Wang, M.; Li, D.; Liu, Y.; Chen, T.H.H.; Yang, X. Genetic Engineering of the Biosynthesis of Glycinebetaine Enhances the Fruit Development and Size of Tomato. Plant Sci. 2019, 280, 355–366. [Google Scholar] [CrossRef]
- Ragab, M.E.; Helal, N.A.S.; Sawan, O.M.; Fawzy, Z.F.; El-Sawy, S.M. Foliar application of glycine betaine for alleviating water stress of tomato plants grown under sandy soil conditions. Int. J. ChemTech Res. 2015, 8, 52–67. [Google Scholar]
- Adak, N. Effects of Glycine Betaine Concentrations on the Agronomic Characteristics of Strawberry Grown Under Deficit Irrigation Conditions. Appl. Ecol. Environ. Res. 2019, 17, 3753–3767. [Google Scholar] [CrossRef]
- Taskin, S.; Ertan, E. Exogenous Applications of Kaolin and Glycine Betaine Increased the Yield and Quality of Olive Fruit and Olive Oil. Erwerbs-Obstbau 2023, 65, 337–346. [Google Scholar] [CrossRef]
- Baltazar, M.; Correia, S.; Guinan, K.J.; Sujeeth, N.; Bragança, R.; Gonçalves, B. Recent Advances in the Molecular Effects of Biostimulants in Plants: An Overview. Biomolecules 2021, 11, 1096. [Google Scholar] [CrossRef]
- Bound, S.; Norrie, J. Seaweed Extracts Improve Cherry Fruit Quality. In Proceedings of the Horticulture for the Future: APHC/AuSHS/NZIAHS Joint Conference, Lorne, VIC, Australia, 18–22 September 2011. [Google Scholar]
- Ibrahim, E.A.; Ebrahim, N.E.S.; Mohamed, G.Z. Effect of water stress and foliar application of chitosan and glycine betaine on lettuce. Sci. Rep. 2023, 13, 17274. [Google Scholar] [CrossRef]
- Hwang, H.; Kim, Y.-J.; Shin, Y. Assessment of Physicochemical Quality, Antioxidant Content and Activity, and Inhibition of Cholinesterase between Unripe and Ripe Blueberry Fruit. Foods 2020, 9, 690. [Google Scholar] [CrossRef]
- Silva, J.F.; Pinheiro, R.F.; Amaro, A.L.; Pereira, M.J.; Roriz, M.; Pintado, M.; Vasconcelos, M.W.; Carvalho, S.M.P. Otimização da aplicação de um bioestimulante para o aumento da produtividade e qualidade do morango. In Actas Portuguesas de Horticultura, Proceedings of 3º Simpósio Nacional de Fruticultura, Vila Real, Portugal, 4–5 December 2014; Rodrigues, R., Silva, A.P., Eds.; Associação Portuguesa de Horticultura: Lisbon, Portugal, 2014; pp. 380–388. [Google Scholar]
- Moggia, C.; Graell, J.; Lara, I.; Schmeda-Hirschmann, G.; Thomas-Valdés, S.; Lobos, G.A. Fruit Characteristics and Cuticle Triterpenes as Related to Postharvest Quality of Highbush Blueberries. Sci. Hortic. 2016, 211, 449–457. [Google Scholar] [CrossRef]
- Khan, R.I.; Hafiz, I.A.; Shafique, M.; Ahmad, T.; Ahmed, I.; Qureshi, A.A. Effect of Pre-Harvest Foliar Application of Amino Acids and Seaweed (Ascophylum nodosum) Extract on Growth, Yield, and Storage Life of Different Bell Pepper (Capsicum annuum L.) Cultivars Grown under Hydroponic Conditions. J. Plant Nutr. 2018, 41, 2309–2319. [Google Scholar] [CrossRef]
- Shi, J.; Xiao, Y.; Jia, C.; Zhang, H.; Gan, Z.; Li, X.; Yang, M.; Yin, Y.; Zhang, G.; Hao, J.; et al. Physiological and Biochemical Changes during Fruit Maturation and Ripening in Highbush Blueberry (Vaccinium corymbosum L.). Food Chem. 2023, 410, 135299. [Google Scholar] [CrossRef]
- Gilbert, J.L.; Guthart, M.J.; Gezan, S.A.; Pisaroglo De Carvalho, M.; Schwieterman, M.L.; Colquhoun, T.A.; Bartoshuk, L.M.; Sims, C.A.; Clark, D.G.; Olmstead, J.W. Identifying Breeding Priorities for Blueberry Flavor Using Biochemical, Sensory, and Genotype by Environment Analyses. PLoS ONE 2015, 10, e0138494. [Google Scholar] [CrossRef]
- Mannino, G.; Gentile, C.; Ertani, A.; Serio, G.; Bertea, C.M. Anthocyanins: Biosynthesis, Distribution, Ecological Role, and Use of Biostimulants to Increase Their Content in Plant Foods—A Review. Agriculture 2021, 11, 212. [Google Scholar] [CrossRef]
- Wang, Y.; Liu, S.; Zhang, H.; Zhao, Y.; Zhao, H.; Liu, H. Glycine Betaine Application in Grain Filling Wheat Plants Alleviates Heat and High Light-Induced Photoinhibition by Enhancing the psbA Transcription and Stomatal Conductance. Acta Physiol. Plant. 2014, 36, 2195–2202. [Google Scholar] [CrossRef]
- Tran, T.L.C.; Callahan, D.L.; Islam, M.T.; Wang, Y.; Arioli, T.; Cahill, D. Comparative Metabolomic Profiling of Arabidopsis thaliana Roots and Leaves Reveals Complex Response Mechanisms Induced by a Seaweed Extract. Front. Plant Sci. 2023, 14, 1114172. [Google Scholar] [CrossRef]
| Treatments | Years | Weight (g) | Height (mm) | Width (mm) | Ø Calyx Scar (mm) | Width/Height Ratio | |||||
|---|---|---|---|---|---|---|---|---|---|---|---|
| Duke | Draper | Duke | Draper | Duke | Draper | Duke | Draper | Duke | Draper | ||
| T0 | 2022 | 2.13 ± 0.27 a | 3.36 ± 0.47 A | 12.36 ± 0.48 ab | 13.72 ± 0.76 ABC | 17.54 ± 0.84 a | 20.65 ± 1.17 A | 6.38 ± 0.88 a | 6.59 ± 0.76 A | 1.42 ± 0.08 a | 1.51 ± 0.06 A |
| 2023 | 2.18 ± 0.26 a | 2.99 ± 0.41 A | 12.82 ± 0.49 a | 13.57 ± 0.78 A | 17.55 ± 0.92 a | 19.34 ± 0.99 A | 6.94 ± 0.57 a | 6.49 ± 0.69 A | 1.37 ± 0.06 a | 1.43 ± 0.07 A | |
| T1 | 2022 | 2.38 ± 0.42 b | 3.64 ± 0.54 AB | 12.59 ± 0.57 b | 13.67 ± 0.56 AB | 18.26 ± 1.21 b | 21.33 ± 1.02 BCD | 7.91 ± 1.09 a | 6.98 ± 1.02 A | 1.45 ± 0.08 ab | 1.56 ± 0.07 B |
| 2023 | 2.71 ± 0.32 d | 3.34 ± 0.46 BC | 13.58 ± 0.41 d | 13.75 ± 0.81 ABC | 18.98 ± 0.77 d | 20.05 ± 0.97 BC | 7.50 ± 0.71 b | 6.54 ± 0.87 A | 1.40 ± 0.06 ab | 1.46 ± 0.07 A | |
| T2 | 2022 | 2.33 ± 0.31 ab | 3.40 ± 0.51 A | 12.19 ± 0.57 a | 13.64 ± 0.59 AB | 18.35 ± 0.90 b | 20.79 ± 1.08 AB | 7.64 ± 1.01 a | 6.98 ± 0.83 A | 1.51 ± 0.09 c | 1.52 ± 0.07 AB |
| 2023 | 2.51 ± 0.32 bcd | 3.11 ± 0.57 AB | 13.18 ± 0.73 bc | 13.58 ± 0.77 A | 18.59 ± 0.81 bcd | 19.53 ± 0.98 AB | 7.26 ± 0.62 ab | 6.83 ± 1.01 A | 1.41 ± 0.06 b | 1.44 ± 0.06 A | |
| T3 | 2022 | 2.33 ± 0.30 ab | 3.34 ± 0.52 A | 12.39 ± 0.44 ab | 13.57 ± 0.51 A | 18.19 ± 0.82 b | 20.68 ± 1.12 AB | 7.49 ± 0.96 a | 6.52 ± 1.01 A | 1.47 ± 0.06 bc | 1.52 ± 0.06 AB |
| 2023 | 2.47 ± 0.39 bc | 3.22 ± 0.59 ABC | 12.86 ± 0.66 ab | 13.63 ± 0.64 AB | 18.15 ± 1.06 b | 19.94 ± 1.18 BC | 7.29 ± 0.77 ab | 6.82 ± 1.03 A | 1.41 ± 0.06 b | 1.46 ± 0.07 A | |
| T4 | 2022 | 2.40 ± 0.41 b | 3.55 ± 0.60 AB | 12.44 ± 0.53 ab | 13.93 ± 0.58 ABC | 18.01 ± 1.08 ab | 20.98 ± 1.30 ABC | 7.50 ± 0.91 a | 6.80 ± 0.89 A | 1.45 ± 0.07 ab | 1.51 ± 0.08 A |
| 2023 | 2.44 ± 0.31 b | 3.28 ± 0.42 ABC | 13.18 ± 0.53 bc | 13.86 ± 0.65 ABC | 18.25 ± 0.79 bc | 19.82 ± 0.94 ABC | 7.01 ± 0.68 a | 6.65 ± 0.78 A | 1.39 ± 0.06 ab | 1.43 ± 0.05 A | |
| T5 | 2022 | 2.39 ± 0.37 b | 3.82 ± 0.47 B | 12.45 ± 0.57 ab | 14.03 ± 0.56 C | 18.46 ± 0.98 b | 21.77 ± 0.88 D | 7.40 ± 1.47 a | 6.94 ± 1.03 A | 1.48 ± 0.07 bc | 1.55 ± 0.07 B |
| 2023 | 2.44 ± 0.39 b | 3.43 ± 0.55 C | 13.24 ± 0.76 cd | 14.05 ± 0.67 C | 18.20 ± 0.84 bc | 20.28 ± 0.97 C | 7.05 ± 0.68 a | 6.77 ± 0.80 A | 1.38 ± 0.07 ab | 1.45 ± 0.07 A | |
| T6 | 2022 | 2.44 ± 0.36 b | 3.76 ± 0.55 B | 12.39 ± 0.57 ab | 13.72 ± 0.76 BC | 18.22 ± 0.86 b | 21.53 ± 1.11 CD | 7.34 ± 0.72 a | 6.81 ± 0.96 A | 1.47 ± 0.07 bc | 1.54 ± 0.07 AB |
| 2023 | 2.65 ± 0.35 cd | 3.37 ± 0.60 BC | 13.54 ± 0.59 cd | 14.02 ± 0.51 BC | 18.71 ± 0.85 cd | 20.27 ± 1.07 C | 7.30 ± 0.59 ab | 6.54 ± 0.85 A | 1.38 ± 0.05 ab | 1.45 ± 0.06 A | |
| p(T) | 2022 | <0.001 | <0.001 | <0.001 | <0.01 | <0.001 | |||||
| 2023 | <0.001 | <0.001 | <0.001 | <0.05 | <0.001 | ||||||
| p(Cv) | 2022 | <0.001 | <0.001 | <0.001 | <0.001 | <0.001 | |||||
| 2023 | <0.001 | <0.001 | <0.001 | <0.001 | <0.001 | ||||||
| p(T × Cv) | 2022 | <0.05 | <0.01 | <0.01 | >0.05 | <0.001 | |||||
| 2023 | <0.05 | <0.01 | <0.001 | <0.05 | >0.05 | ||||||
| Treatments | Years | pH | TSS (°Brix) | TA (% citric acid) | Maturity Index | ||||
|---|---|---|---|---|---|---|---|---|---|
| Duke | Draper | Duke | Draper | Duke | Draper | Duke | Draper | ||
| T0 | 2022 | 2.92 ± 0.13 a | 3.46 ± 0.03 AB | 12.13 ± 0.15 a | 14.60 ± 0.20 AB | 0.85 ± 0.08 a | 0.52 ± 0.06 A | 14.37 ± 1.31 a | 28.57 ± 2.53 A |
| 2023 | 3.08 ± 0.19 a | 2.78 ± 0.05 A | 12.93 ± 0.45 a | 13.13 ± 0.21 A | 0.56 ± 0.09 b | 0.89 ± 0.13 B | 23.37 ± 4.05 a | 15.02 ± 2.59 A | |
| T1 | 2022 | 3.05 ± 0.06 a | 3.38 ± 0.27 AB | 12.63 ± 0.12 ab | 15.07 ± 0.06 B | 0.78 ± 0.08 a | 0.43 ± 0.05 A | 16.29 ± 1.54 a | 35.12 ± 4.10 A |
| 2023 | 3.15 ± 0.05 a | 2.89 ± 0.05 AB | 12.37 ± 1.15 a | 13.27 ± 0.06 A | 0.46 ± 0.01 ab | 0.71 ± 0.09 AB | 26.95 ± 1.75 a | 19.00 ± 2.70 AB | |
| T2 | 2022 | 3.00 ± 0.09 a | 3.20 ± 0.13 A | 12.33 ± 0.12 a | 14.73 ± 0.59 AB | 0.75 ± 0.13 a | 0.44 ± 0.06 A | 16.70 ± 2.85 a | 33.78 ± 5.07 A |
| 2023 | 3.05 ± 0.08 a | 3.07 ± 0.13 AB | 12.27 ± 0.21 a | 14.40 ± 0.92 AB | 0.54 ± 0.02 ab | 0.63 ± 0.15 AB | 22.94 ± 1.41 a | 23.75 ± 6.52 AB | |
| T3 | 2022 | 3.13 ± 0.15 a | 3.52 ± 0.07 AB | 13.50 ± 0.36 c | 14.47 ± 0.06 AB | 0.68 ± 0.04 a | 0.44 ± 0.06 A | 19.86 ± 0.67 a | 33.29 ± 4.25 A |
| 2023 | 3.28 ± 0.16 a | 3.09 ± 0.05 B | 13.30 ± 0.17 a | 14.90 ± 0.30 B | 0.41 ± 0.10 a | 0.62 ± 0.06 AB | 33.89 ± 7.98 a | 24.33 ± 2.85 AB | |
| T4 | 2022 | 3.05 ± 0.01 a | 3.47 ± 0.09 AB | 13.07 ± 0.35 bc | 13.77 ± 0.47 A | 0.86 ± 0.17 a | 0.54 ± 0.09 A | 15.56 ± 2.98 a | 26.04 ± 4.01 A |
| 2023 | 3.29 ± 0.13 a | 3.06 ± 0.08 AB | 12.57 ± 0.70 a | 14.93 ± 0.23 B | 0.42 ± 0.03 ab | 0.72 ± 0.05 AB | 29.82 ± 3.11 a | 20.82 ± 1.65 AB | |
| T5 | 2022 | 3.15 ± 0.06 a | 3.73 ± 0.08 B | 12.77 ± 0.25 ab | 15.13 ± 0.21 B | 0.75 ± 0.07 a | 0.42 ± 0.08 A | 17.04 ± 1.58 a | 36.52 ± 6.11 A |
| 2023 | 3.32 ± 0.07 a | 3.06 ± 0.17 AB | 12.40 ± 0.46 a | 14.63 ± 0.64 B | 0.41 ± 0.05 ab | 0.69 ± 0.13 AB | 30.46 ± 4.65 a | 21.69 ± 4.50 AB | |
| T6 | 2022 | 3.16 ± 0.03 a | 3.41 ± 0.09 AB | 13.27 ± 0.25 bc | 14.70 ± 0.50 AB | 0.80 ± 0.09 a | 0.51 ± 0.14 A | 16.70 ± 1.70 a | 30.13 ± 7.83 A |
| 2023 | 3.30 ± 0.05 a | 3.14 ± 0.16 B | 12.77 ± 0.23 a | 14.70 ± 0.26 B | 0.46 ± 0.03 ab | 0.58 ± 0.06 A | 28.08 ± 1.78 a | 25.63 ± 2.79 B | |
| p(T) | 2022 | <0.001 | <0.01 | >0.05 | >0.05 | ||||
| 2023 | <0.001 | <0.01 | <0.01 | <0.01 | |||||
| p(Cv) | 2022 | <0.001 | <0.001 | <0.001 | <0.001 | ||||
| 2023 | <0.001 | <0.001 | <0.001 | <0.001 | |||||
| p(T × Cv) | 2022 | <0.05 | <0.001 | >0.05 | >0.05 | ||||
| 2023 | >0.05 | <0.05 | >0.05 | >0.05 | |||||
Disclaimer/Publisher’s Note: The statements, opinions and data contained in all publications are solely those of the individual author(s) and contributor(s) and not of MDPI and/or the editor(s). MDPI and/or the editor(s) disclaim responsibility for any injury to people or property resulting from any ideas, methods, instructions or products referred to in the content. |
© 2024 by the authors. Licensee MDPI, Basel, Switzerland. This article is an open access article distributed under the terms and conditions of the Creative Commons Attribution (CC BY) license (https://creativecommons.org/licenses/by/4.0/).
Share and Cite
Lopes, T.; Silva, A.P.; Ribeiro, C.; Carvalho, R.; Aires, A.; Vicente, A.A.; Gonçalves, B. Ecklonia maxima and Glycine–Betaine-Based Biostimulants Improve Blueberry Yield and Quality. Horticulturae 2024, 10, 920. https://doi.org/10.3390/horticulturae10090920
Lopes T, Silva AP, Ribeiro C, Carvalho R, Aires A, Vicente AA, Gonçalves B. Ecklonia maxima and Glycine–Betaine-Based Biostimulants Improve Blueberry Yield and Quality. Horticulturae. 2024; 10(9):920. https://doi.org/10.3390/horticulturae10090920
Chicago/Turabian StyleLopes, Tiago, Ana Paula Silva, Carlos Ribeiro, Rosa Carvalho, Alfredo Aires, António A. Vicente, and Berta Gonçalves. 2024. "Ecklonia maxima and Glycine–Betaine-Based Biostimulants Improve Blueberry Yield and Quality" Horticulturae 10, no. 9: 920. https://doi.org/10.3390/horticulturae10090920
APA StyleLopes, T., Silva, A. P., Ribeiro, C., Carvalho, R., Aires, A., Vicente, A. A., & Gonçalves, B. (2024). Ecklonia maxima and Glycine–Betaine-Based Biostimulants Improve Blueberry Yield and Quality. Horticulturae, 10(9), 920. https://doi.org/10.3390/horticulturae10090920