Abstract
Steppe peony (Paeonia tenuifolia L.) is a strictly protected herbaceous species in Serbia, yet its growing conditions, nutrient needs, and heavy metal status are under-researched. This research is vital for conservation, as it supports sustainable cultivation, genetic diversity, and habitat restoration. This study addresses the gap in understanding how climate and soil characteristics affect P. tenuifolia, particularly regarding nutrient availability and heavy metal accumulation. Despite its recognized medicinal value, insufficient data on environmental impacts limit effective conservation and cultivation strategies. Addressing this gap will help determine optimal growth conditions and ensure the species’ survival and medicinal use. Data on P. tenuifolia natural habitats in Serbia were collected following the Descriptor List for medicinal plants. Field and laboratory analyses assessed climatic and soil characteristics, as well as macro- and microelement contents and heavy metals in soil and plant organs. In Serbia, P. tenuifolia thrives in a semi-arid steppe climate on light, sandy loam soils with a pH of 6.9–7.4. The soils are rich in humus (4.36–5.76%) and nitrogen (0.34–0.37%), but low in phosphorus (1.16–3.50 mg/100 g) and variable in potassium (12.5–52.4 mg/100 g). Soil microelements are abundant, and harmful heavy metals are below critical levels. Plant organs, including flowers, seeds, leaves, and stems, show high phosphorus and magnesium levels, while potassium, manganese, and copper are generally low. The levels of potentially harmful elements like cadmium and chromium are near the maximum-allowed limits, suggesting avoidance of highly acidic soils for the cultivation of P. tenuifolia. Among the examined soils, Arenic chernozem is recommended for preserving the species’ natural resources.
1. Introduction
The steppe or fern-leaf peony (Paeonia tenuifolia L.) is one of 27 Eurasian herbaceous species in the section Paeoniae, the sole genus in the Paeoniaceae family [1]. This glacial relict species [2,3] is renowned for both its aesthetic appeal [4] and its medicinal properties [5,6]. Recent research on wild populations from Serbia has identified a range of secondary metabolites in its petals [7,8], leaves [9], and roots [10], highlighting its diverse potential applications. Specifically, the petals have demonstrated skin-care benefits, with extracts promoting the protective and defensive functions of skin through keratinocyte proliferation [7,8]. The leaves exhibit antimicrobial properties, showing strong activity against both Gram-negative bacteria (S. typhimurium and P. aeruginosa) and Gram-positive bacteria (L. monocytogenes), making them valuable for treating gastrointestinal disorders [9]. The roots are rich in compounds that regulate plant growth and defense, such as abscisic acid, flavonoids (catechin and epicatechin), and gallic acid derivatives (gallic acid and ellagic acid). These compounds are significant for combating oxidative stress and pathogens. Additionally, root extracts have shown anti-enzymatic potential against cholinesterases, enzymes linked to neurological disorders such as Alzheimer’s and Parkinson’s diseases [10].
P. tenuifolia is native to a broad range of countries, including Armenia, Azerbaijan, Bulgaria, Georgia, Romania, Russia, Serbia, Turkey, and Ukraine [1]. In Serbia, this species is found from 100 m above sea level at the Deliblato Sands (an exceptional nature reserve known as the “savannah in the middle of Europe”) to 1050–1300 m above sea level at Golemi Vrh in the Vidlič Mountains, where it thrives on a south-facing calcareous plateau [11]. According to the IUCN Red List [12], P. tenuifolia is classified as endangered, with a high risk of extinction, leading to its strict protection in several countries, including Serbia [13].
Among herbaceous peonies, P. tenuifolia is notable for its exceptional environmental tolerance, enduring temperatures as low as −32 °C. Despite this resilience, the species is sensitive to elevated winter temperatures, which are essential for breaking seed and bud dormancy [14,15]. Like other herbaceous peonies, P. tenuifolia is threatened by habitat loss driven by climate change, unsustainable human activities [16,17], inadequate conservation measures, and increased disease susceptibility [17,18,19]. Analysis of temperature data from 15 meteorological stations in Serbia over an 18-year period (1888–2006) reveals a significant rise in the lowest winter temperatures [20], which could potentially worsen the decline of P. tenuifolia populations in their natural habitats.
Protecting plant species within their natural habitats is the most effective conservation strategy. In Serbia, targeted protective measures and population monitoring for P. tenuifolia are already in place [13]. However, detailed information on the plant’s specific growth requirements and its potential for cultivation as part of a conservation strategy remains limited. Additionally, there is a lack of data on the nutrient and heavy metal content in various parts of P. tenuifolia. Understanding these factors is crucial for ensuring the health of the plant and the safe use of its parts [21]. While research has examined nutrient and heavy metal levels in other herbaceous peonies, such as P. officinalis and P. lactiflora [22,23,24,25], including the translocation and accumulation of heavy metals in P. lactiflora [26], the patterns of heavy metal accumulation in different organs of P. tenuifolia are still unexplored.
The knowledge gap addressed in this study is the limited understanding of how specific climate and soil characteristics affect the growth of P. tenuifolia populations in Serbia, particularly in relation to nutrient availability and heavy metal accumulation. While the medicinal value of P. tenuifolia is recognized, there are insufficient data on how variations in environmental factors influence its nutritional profile and potential contamination with heavy metals. This gap hinders effective cultivation and conservation strategies for this endangered species. Addressing this gap will help identify optimal conditions for growth and inform practices to ensure the plant’s survival and medicinal efficacy. Therefore, the aim of this study was to determine the influence of specific climate and soil properties on the growth and health of Paeonia tenuifolia populations in Serbia. This includes the following: characterizing the soil and climate conditions of the habitats where P. tenuifolia is found; assessing the levels of essential nutrients and potentially harmful heavy metals in both the above-ground and underground organs of the plant; and investigating the correlation between these concentrations and the associated soil and climate variables. By addressing these objectives, the study seeks to refine our understanding of the ecological requirements for the successful cultivation and conservation of this endangered species, which is valued for its medicinal properties.
2. Materials and Methods
2.1. Habitats and Associated Climatic Conditions
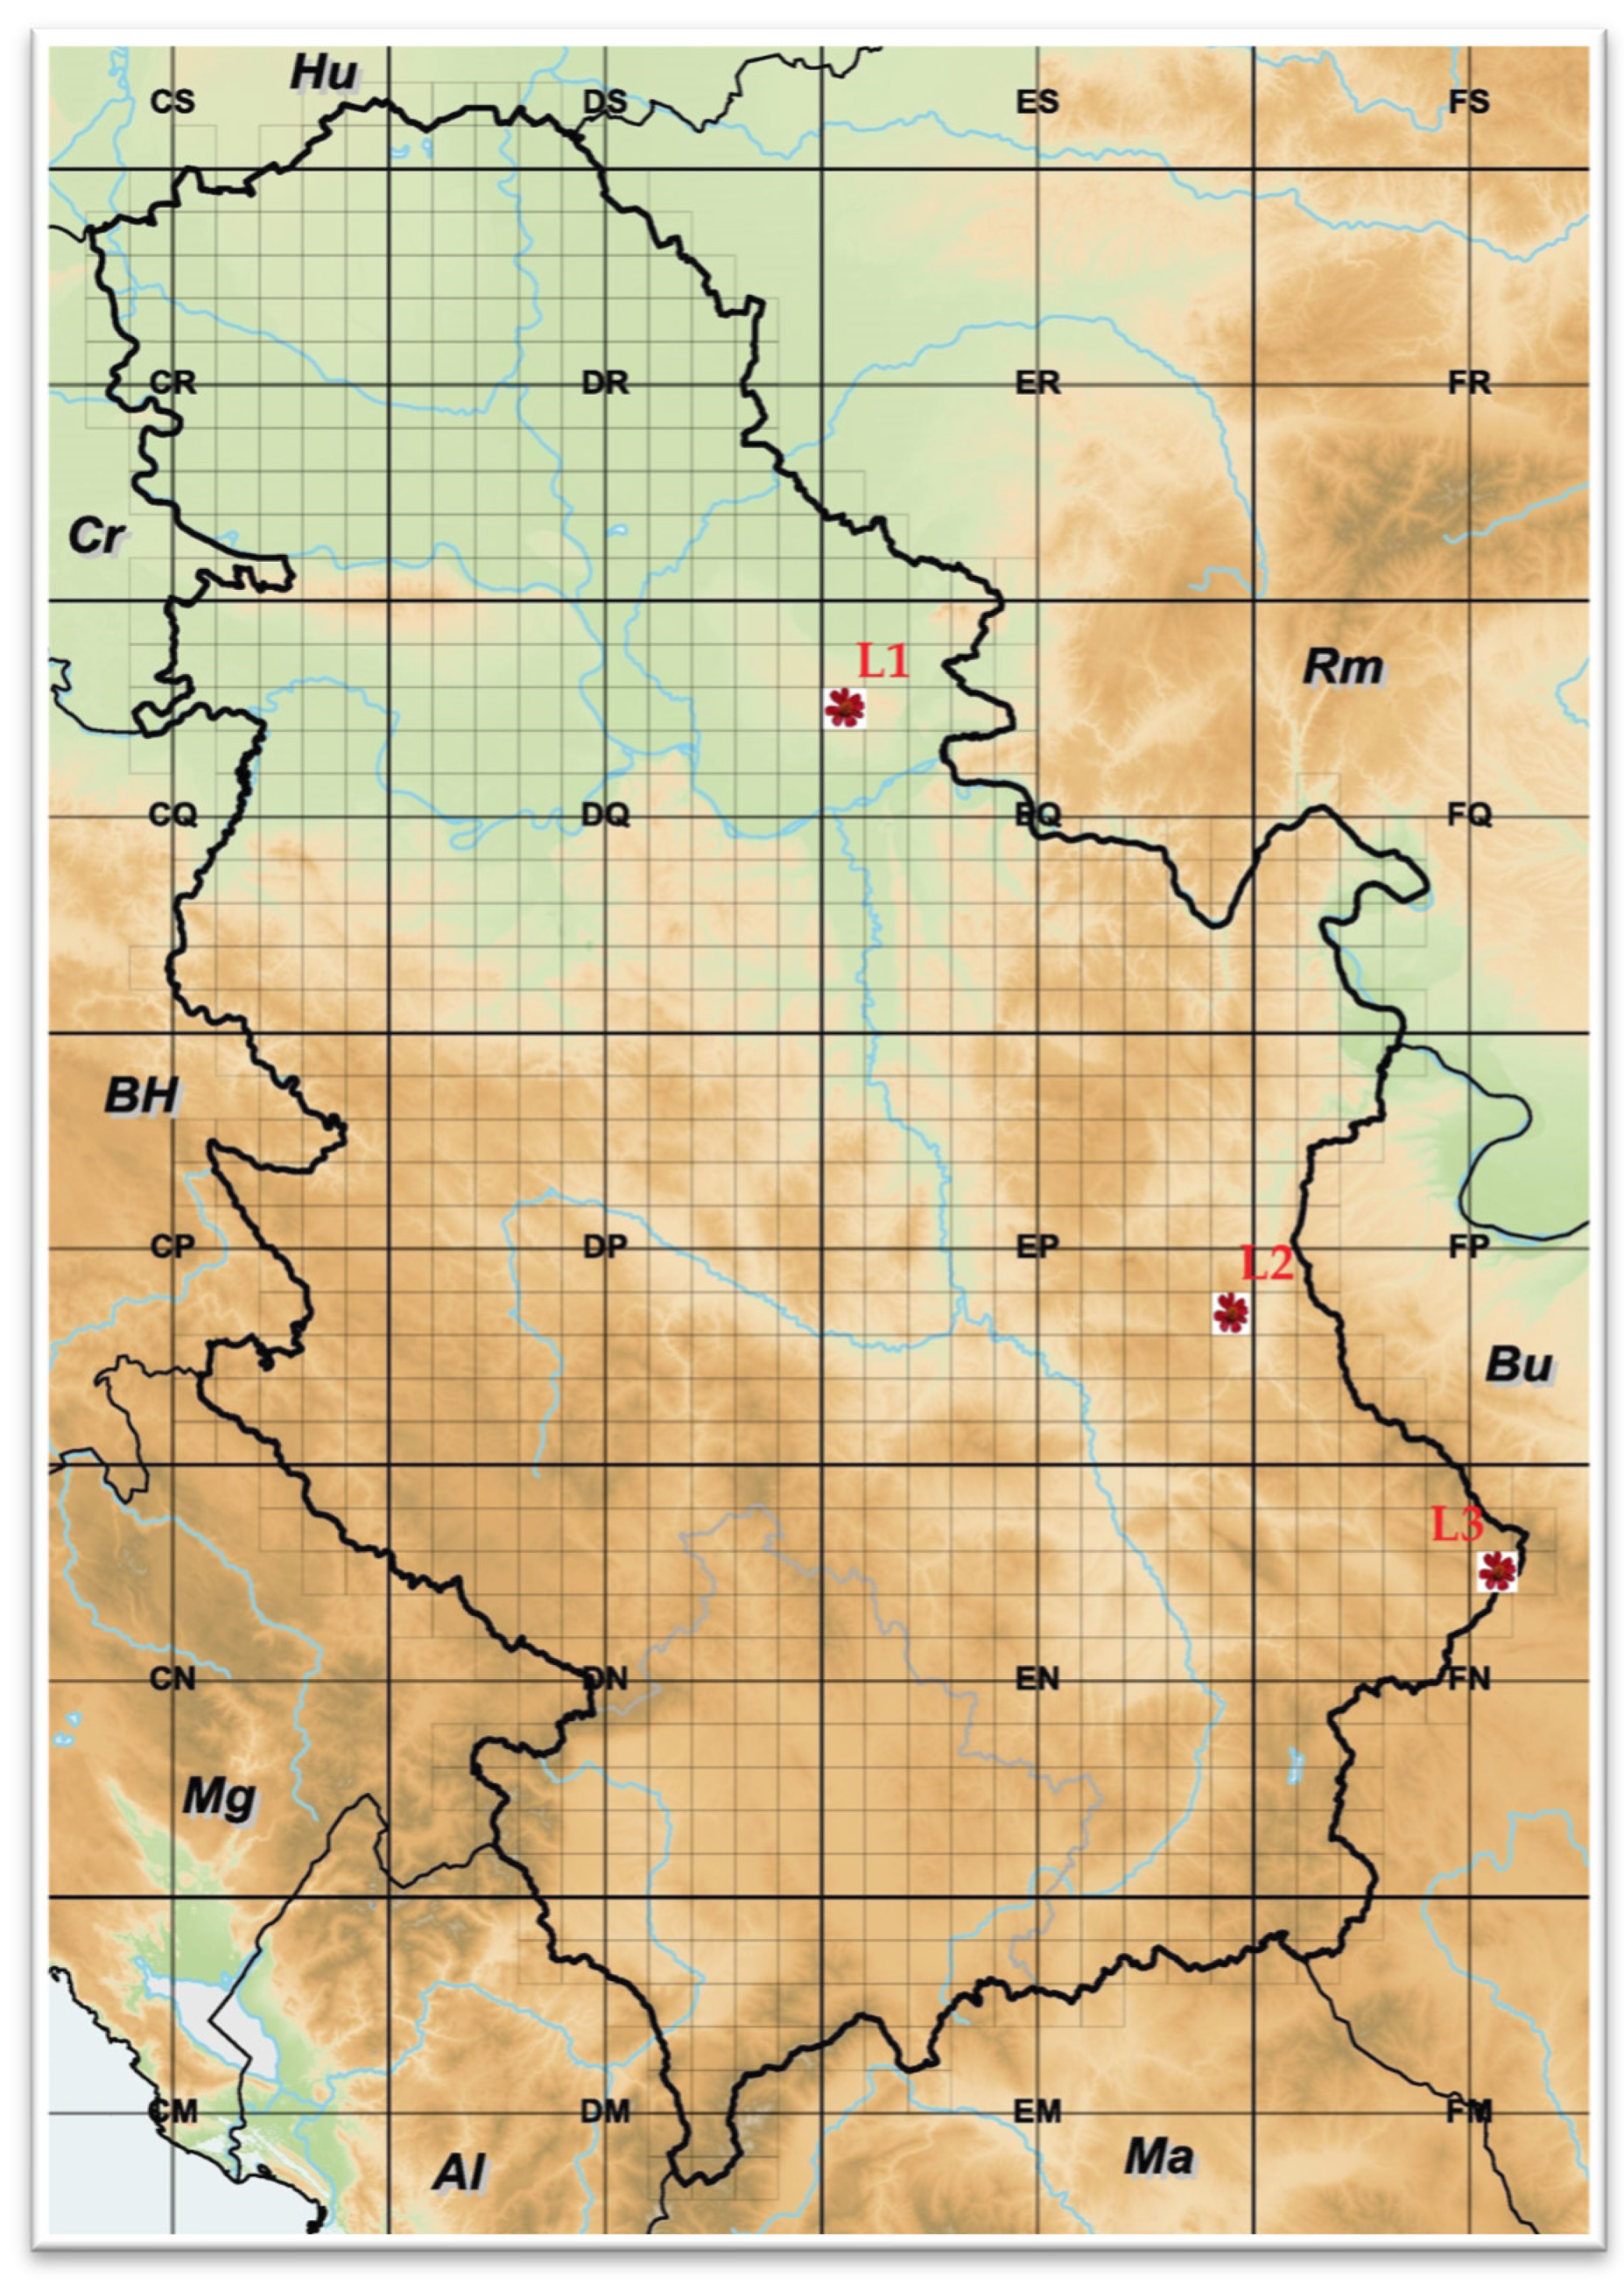
Three natural habitats of P. tenuifolia populations in Serbia were included in this study, as marked in Figure 1: (L1) Deliblato sand, locality in the Vojvodina province, northeast Serbia; (L2) Bogovo Gumno, locality on Devica Mountain, southeast Serbia; and (L3) Gulenovci, locality near Dimitrovgrad city, southeast Serbia.
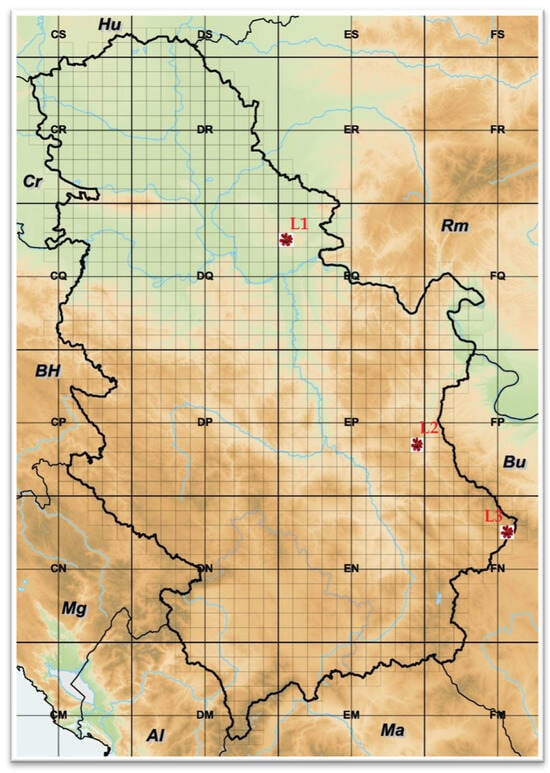
Figure 1.
Natural habitats of Paeonia tenuifolia L. populations in the Republic of Serbia: (L1) Deliblato sand; (L2) Bogovo Gumno; and (L3) Gulenovci.
For each habitat (locality), the following two categories of data were collected, in compliance with FAO descriptors for medicinal and aromatic plants: (1) site data, including locality name and its latitude, longitude, and elevation; and (2) site environment data, including topography, higher-level landform, inclination, form, and aspect, land element and position, overall vegetation surrounding and on the site, and the possible sources of contamination.
Using data gathered at the nearest meteorological station (MS), long-term climate data (sums of monthly precipitation and average monthly air temperatures) are presented for each locality over the last fifteen-year period (2008–2022) prior to this study. The utilized MSs were as follows: MS Banatski Karlovac (BK) is 90 m above sea level and 10 km away from L1, MS Knjaževac (KN) is 263 m above sea level and 18 km away from L2, and MS Dimitrovgrad (DM) is 448 m above sea level and 10 km away from L3 (Table S1). For monitoring relative air humidity (Rh, %) and air temperature (T, °C) at each locality, multi-use data loggers (LogTag® model HAXO-8, MicroDAQ.com Ltd., Contoocook, NH, USA) were installed and configured to record data every hour during the entire year 2022. The collected data were processed according to the method described in Gunn et al. [27].
2.2. Soil Characterization and Chemical Analyses
At each locality, data on soil depth [28] and soil taxonomy [29] were gathered. The soil samples were classified according to the WRB Reference Soil Group [30]. In the laboratory, several analyses of the surface soil layer were carried out. The pH in H2O was determined in a suspension of soil with water (10 g/25 cm3), while the pH in 1 M KCl was determined in a suspension of soil with potassium chloride (10 g/25 cm3), both with the use of a pH meter [31]. The determination of free calcium carbonate (CaCO3) was conducted volumetrically using Schreiber’s calcimeter method [32]. The determination of humus content was carried out according to Tjurin’s modified method [33]. The determination of total nitrogen content was carried out by the automatic method [34] using a CHNS analyzer (Vario MACRO Cube, Elementar Analysen Systeme GmbH, Langenselbold, Germany). Available phosphorus in the soil was determined by the ammonium lactate (AL) method, expressed as mg P2O5 per 100 g of soil, while readily available phosphorus was determined spectrophotometrically [31]. Available potassium in the soil was determined by the ammonium lactate (AL) method, expressed as mg K2O per 100 g of soil, while readily available potassium was determined by a flame photometer [31]. The total amount of macro- and micronutrients and heavy metals in soil was determined by destruction with concentrated nitric acid (HNO3+ H2O2) using the Varian ICP-OES Vista Pro apparatus (SpectraLab, Markham, ON, Canada) via the method of inductively coupled plasma ICP-MS [35]. The soil texture was determined by the pipette method (sieving sedimentation) sample preparation with Na-pyrophosphate, according to Thun et al. [36]. The soil textural class was determined using the USDA textural triangle diagram [37].
2.3. Plant Material and Chemical Analyses
During the 2022 vegetation season, the plant material was collected at three distinct stages of steppe peony plant development. For accuracy, each sample was taken at the same locality, which was geographically and physically marked for accuracy. In each development phase, typical plants were sampled, corresponding phenotypically (by habitus) to the largest number of individuals in that locality. Considering that the species is strictly protected and needed permission for collection from their natural habitats (no. 353-03-162/2022-4 granted by the Ministry of Environmental Protection of the Republic of Serbia on 24 February 2022), only the permitted number of individuals on each locality was sampled (5–10 plants or plant parts per repetition, and there were three repetitions). The following P. tenuifolia plant material was collected in triplicate: the flower, leaf, and stem samples in the full flowering stage (May 2022); seed and follicle samples in the seed maturity stage (July 2022); and the root samples by the end of the plant vegetation (October 2022). In the laboratory, the plant samples were washed with distilled water before drying at a temperature of 105 °C to a constant weight (Laboratory Convection Oven MOV-212, Sanyo, Japan). Absolute dry plant material (DM) was transferred using a desiccator to an analytical balance (Kern and Sohn ABJ 220–4NM, 0.0001 Readability, KERN & SOHN GmbH, Balingen, Germany), where the amount needed for each analytical procedure was measured. Then, the samples were ground (M-20, IKA Universal Mill, IKA®-Werke GmbH & Co. KG, Staufen, Germany).
The following chemical analyses were performed: determination of the content of biogenic macronutrients (total nitrogen, phosphorus, potassium, calcium, and magnesium, %), determination of the content of biogenic microelements (total iron, manganese, zinc, and copper, mg kg−1 DW), and determination of the content of heavy metals (total cadmium, lead, nickel, and chromium, mg kg−1 DW).
The total nitrogen (N) was determined by alkaline distillation following the standard Kjeldahl digestion method [38]. For the analysis of phosphorus (P) and potassium (K), the plant material was subjected to digestion in a mixture of acids (conc. H2SO4 + H2O2) at 450 °C; in the destroyed sample, P content was determined by the vanadate–molybdate method, using a UV spectrophotometer (Helios Alpha, Thermo Spectronic, PROFCONTROL GmbH, Schönwalde-Glien, Germany), while K content was determined by the flame technique, using the Thermo Solaar S4 AA Spectrometer (International Equipment Trading Ltd., Mundelein, IL, USA). The contents of total iron (Fe), manganese (Mn), zinc (Zn), and copper (Cu) were also determined using the Thermo Solaar S4 AA Spectrometer, Fisher, UK in an acetylene–air flame. The contents of heavy metals, total cadmium (Cd), lead (Pb), nickel (Ni), and chromium (Cr), were determined in samples previously decomposed in a mixture of acids (HNO3 + H2O2, p.a. for trace elements, Thermo Fisher Scientific Inc., Waltham, MA, USA) using the AAS technique with the GTA 120 Graphite Tube Atomizer (Agilent 240Z AA, SpectraLab, Markham, ON, Canada).
2.4. Statistical Analysis
Three analyses were performed for each variable, with their arithmetic means and standard deviations. The analysis of variance (ANOVA), followed by Duncan’s post hoc test (p < 0.05), was used to compare the variation in the content of the investigated elements in the studied material derived from various localities. The data were analyzed using SPSS 26.0 software (SPSS, Inc., Chicago, IL, USA).
Correlation analysis was carried out with the aim of calculating the possible impact of soil factors (pH level and humus content) as well as the content of plant nutrients and heavy metals in the soil on their content in the plant organs of P. tenuifolia. Microsoft Excel spreadsheet software was used for correlation analysis, and to evaluate the significance, the t-test was used for the n−2 number of degrees of freedom.
3. Results
3.1. Habitats and Associated Climatic Conditions
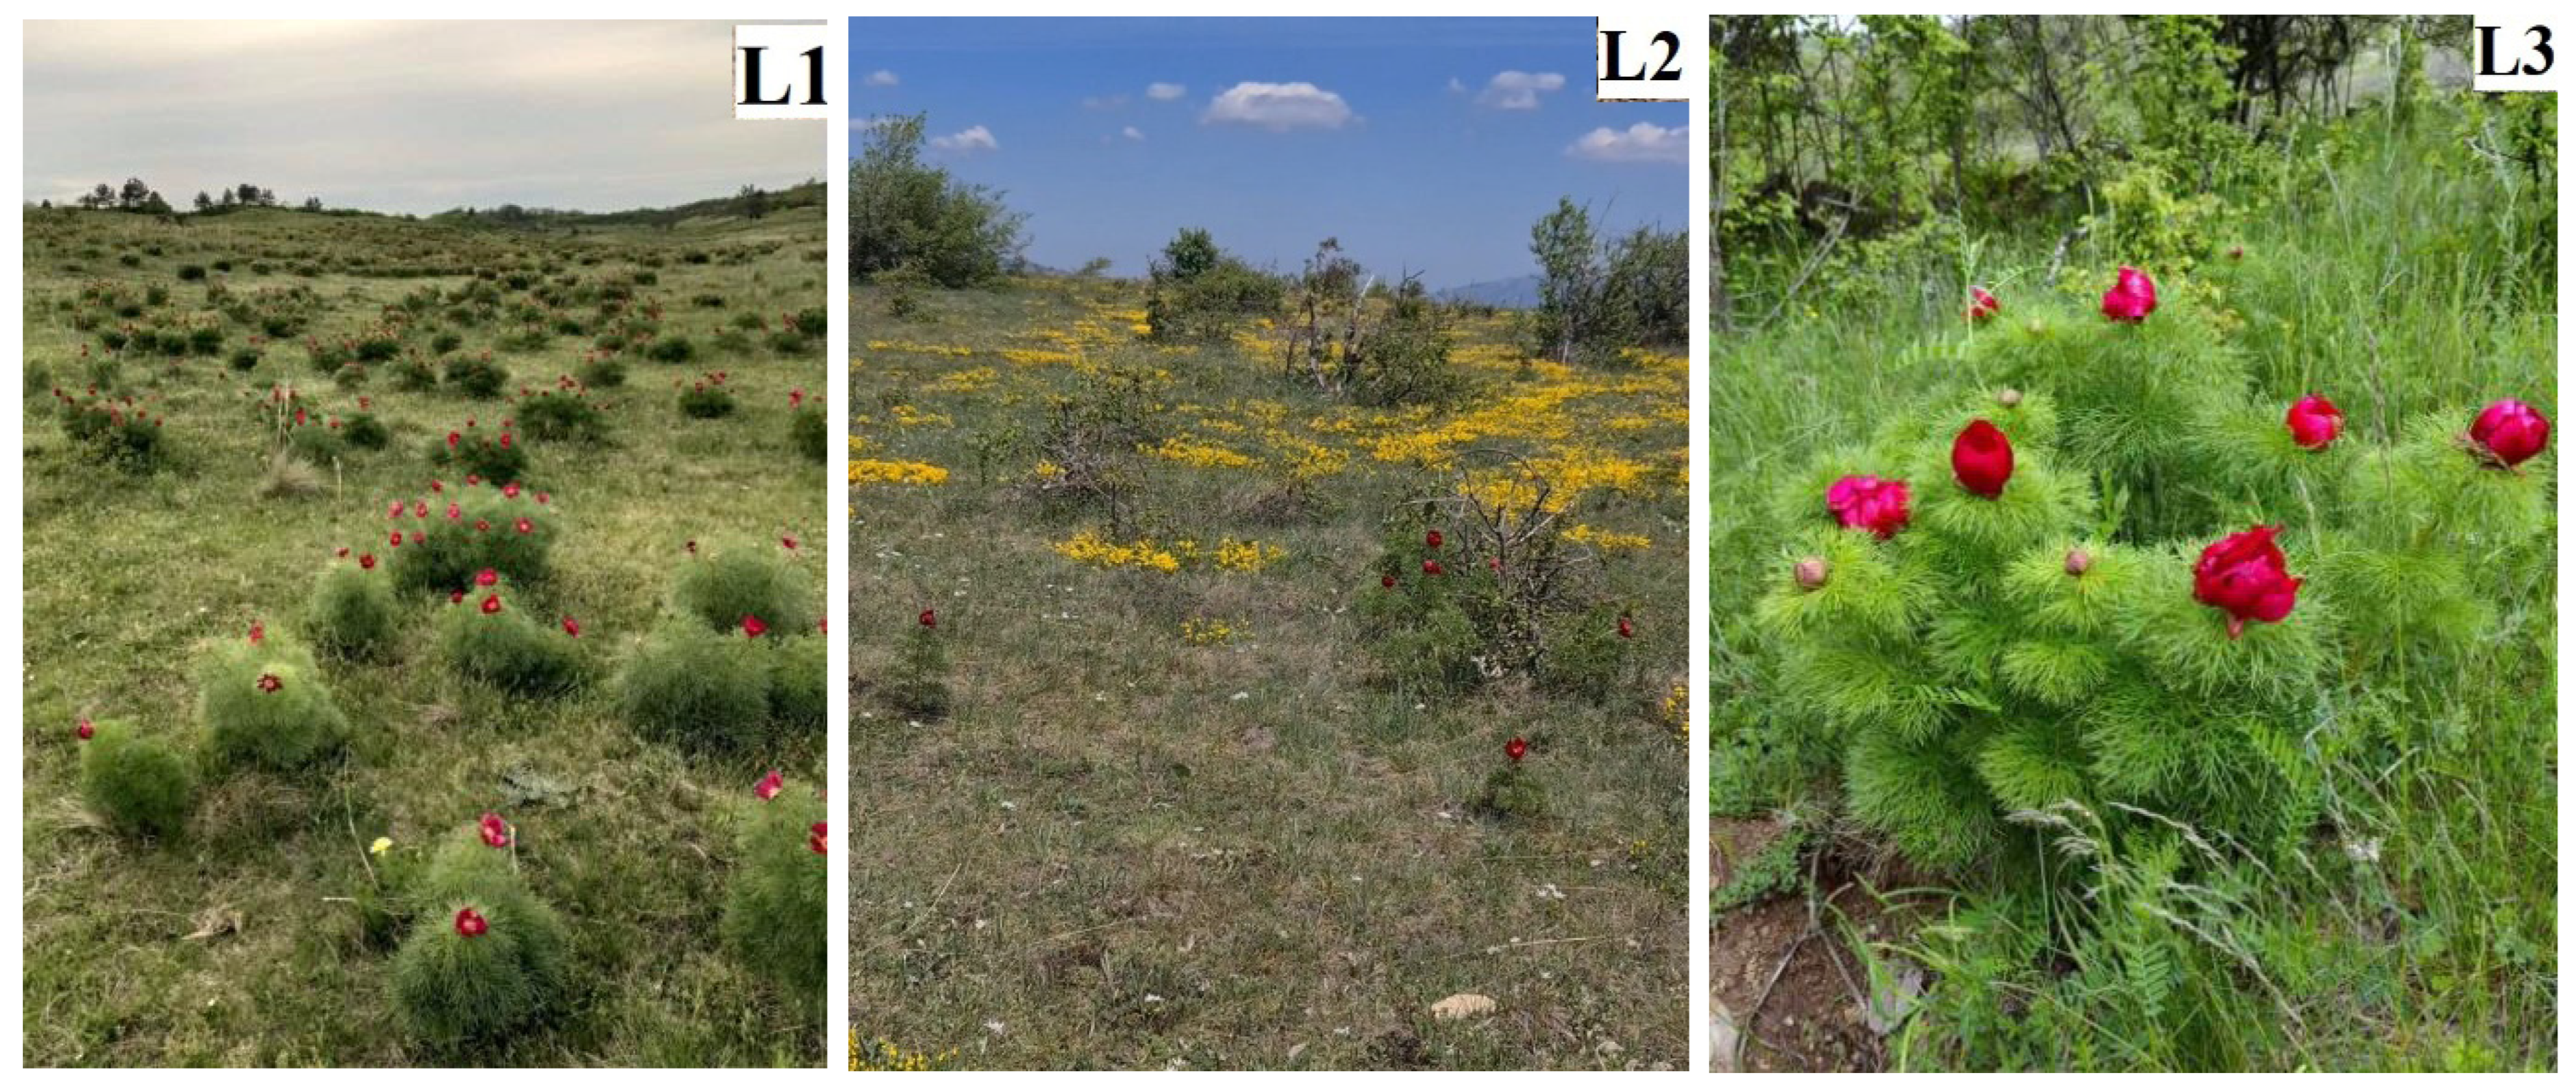
Data on three natural habitats with wild-growing P. tenuifolia populations, gathered in accordance with the proposed MAPs Descriptor List, are summarized in Table 1 and supplemented with authentic images of each habitat with flowering P. tenuifolia populations (Figure 2). The presented data contribute to the overall understanding of how external environmental conditions can impact the retention of valuable nutrients and harmful elements in plant tissues, which, in turn, may affect the potential use of plant material.

Table 1.
Data on natural habitats of Paeonia tenuifolia L. populations in Serbia.

Figure 2.
Natural stands with flowering Paeonia tenuifolia L. plants: (May 2022): (L1) Deliblato sands; (L2) Bogovo gumno; and (L3) Gulenovci.
P. tenuifolia populations spontaneously grow in the eastern part of Serbia, at sites that are exposed to the sun, in upland and mountainous regions (at altitudes ranging from 150 to 950 m above sea level), on a primarily flat or slightly sloping terrain, at localities outside industrial areas and beyond the reach of potential sources of contamination. The vegetation in the habitats is very sparse, with shrubs and grasses interspersed with layers of trees and shrubs.
The relative air humidity and temperature data monitored at the studied habitats during 2022 are given in Table 2. Additional data on the distribution and the amount of monthly precipitation and average monthly temperatures during the same year were extracted from the annual bulletin of the Republic Hydrometeorological Service of Serbia [39], and are further illustrated using Walter’s climate diagram (Figure S1).
Table 2.
Average values of monthly temperature (°C) and relative air humidity (%) at localities with wild Paeonia tenuifolia L. populations in Serbia during 2022.
The average annual temperatures for the studied year of 2022, measured at the MSs nearest the studied habitats, were higher than the 15-year averages by about 0.2–0.6 C (Figure S1, Table S1). In addition, data loggers at the studied habitats recorded temperature differences that appeared to be dominantly dependent on altitude; the lowest were recorded at an altitude of 950 m above sea level (L2), while the highest was recorded at an altitude of 156 m above sea level (L1), with a difference in the mean annual temperature between them of 3.24 °C. The same trend was observed during the vegetation period (IV–IX, 2022): the highest average temperature was observed at L1 (19.75 °C) and lowest at L2 (15.85 °C) (Table 2).
In the first part of the year 2022 (months I–IV), the total precipitations at L1 and L3 were 127 and 136 mm, respectively, while at L2, they were only 70 mm (Figure S1). However, they differed the most in April, when P. tenuifolia plants were in a phase of intense growth and development. In contrast to that period, the period V–IX (i.e., from the phase of flowering to the phase of seed maturation) was characterized by a higher level of precipitation, particularly at L3 (Figure S1).
The annual Rh average values did not differ much between the habitats, and they ranged in the interval of 63.8–71.1% (Table 2). However, the rhythm of the monthly Rh averages during the year differed, with the largest annual fluctuation observed at L1, from 90.4% in I to 47.2% in VII. The mean Rh in the vegetation period (IV–IX) of 2022 at the localities varied in a narrow interval between 58.33% at L1 and 63.52% at L2 (Table 2). In general, it was observed that the period of intense vegetation of P. tenuifolia plants, which corresponds to the period IV–VIII, was characterized by the lowest Rh at all habitats (Table 2).
3.2. Soil Characteristics and Chemical Analyses
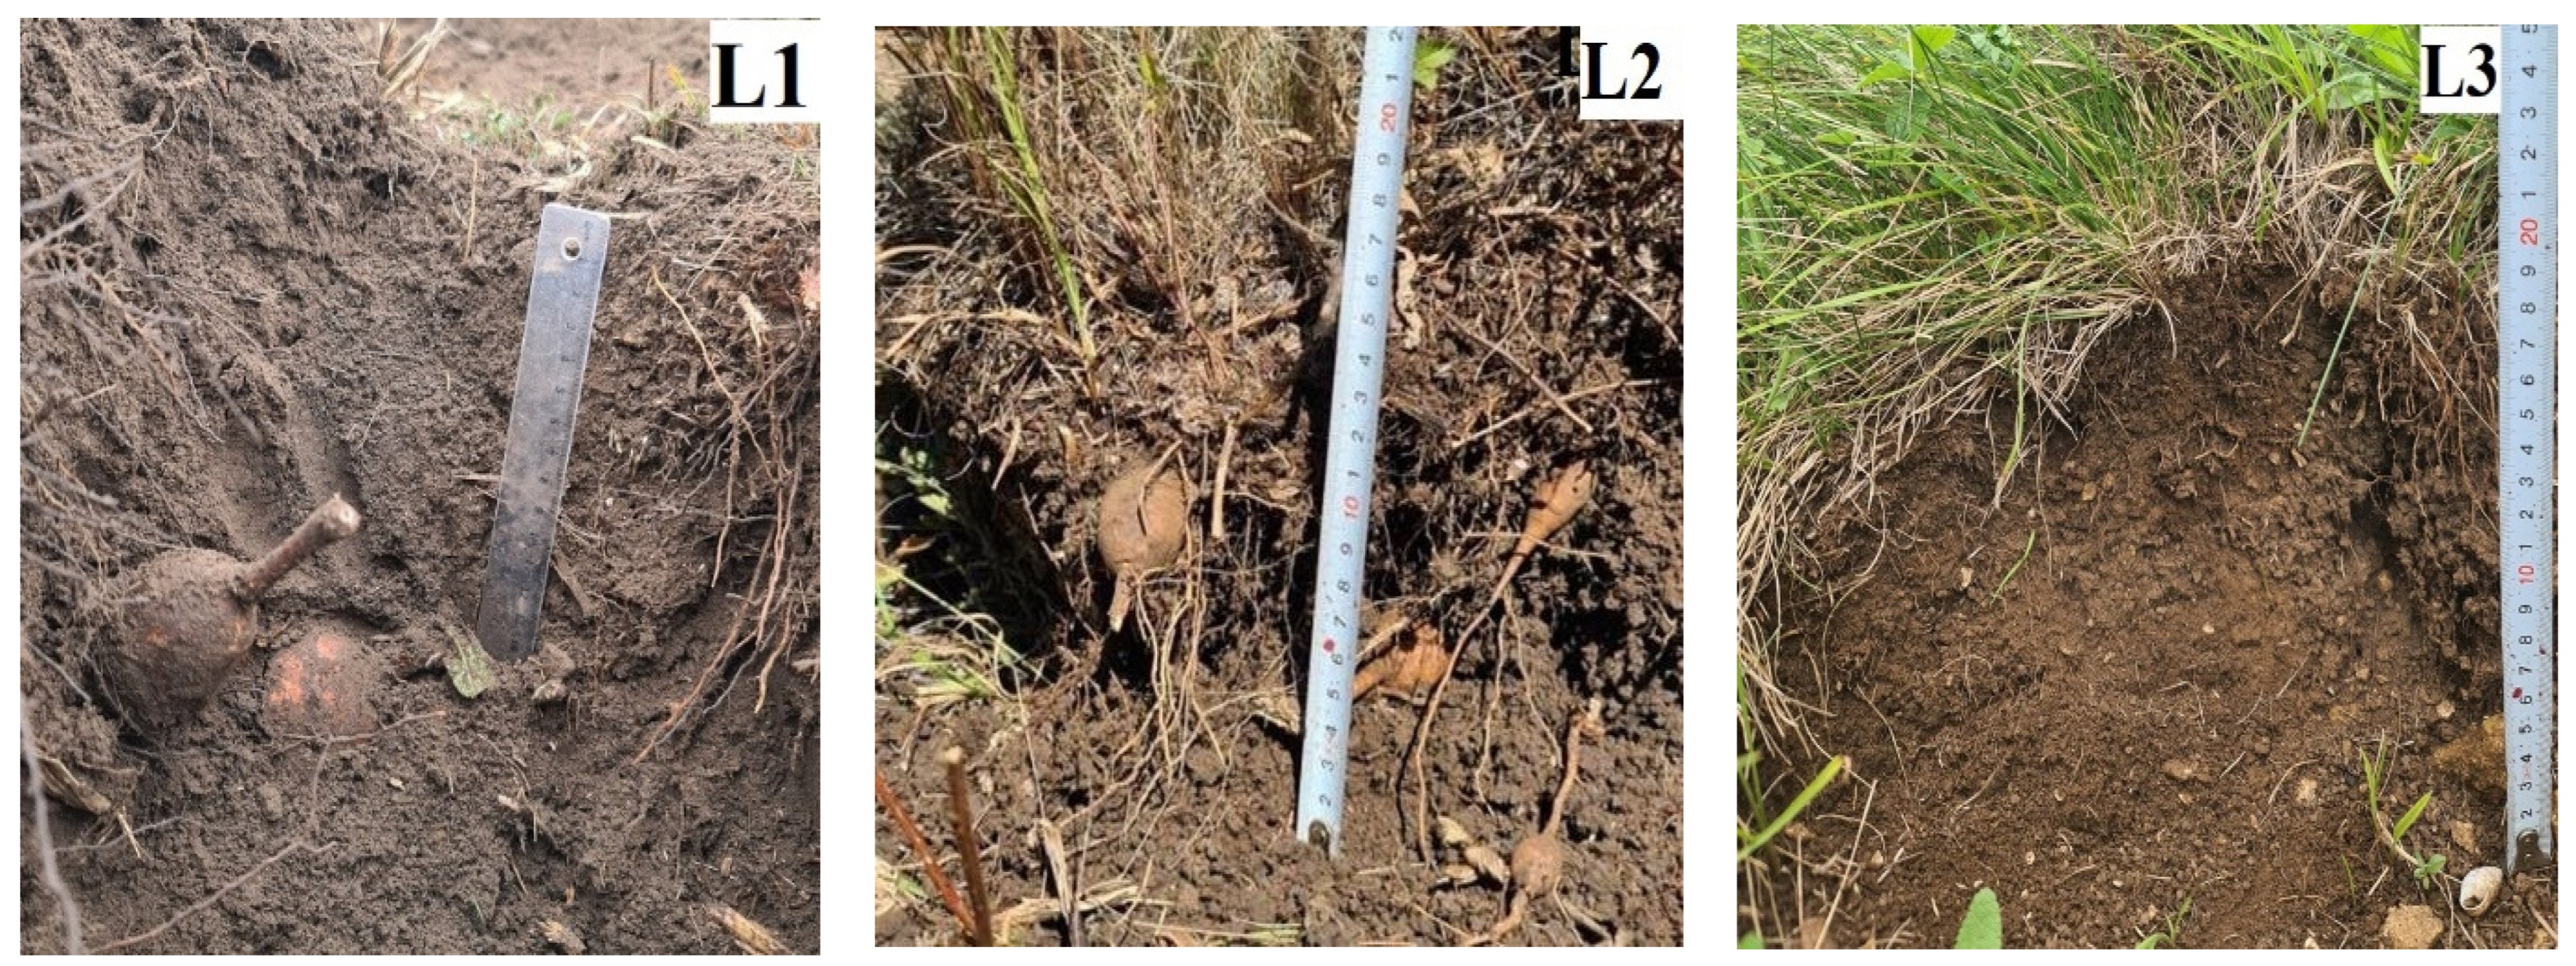
The major chemical properties and granulometric composition of the soil samples from different natural habitats of P. tenuifolia are summarized in Table 3. These data are supplemented with authentic images from each habitat that were made during the root extraction of P. tenuifolia (Figure 3).
Table 3.
Major chemical properties and granulometric composition of the surface layer of the soils from the natural habitats of P. tenuifolia L. populations in Serbia in 2022.

Figure 3.
Appearance of the soils in the natural habitats of P. tenuifolia L. populations in Serbia (October 2022): (L1) loamy sand; (L2) loam; and (L3) sandy loam.
The total contents of some nutrients and some potentially harmful trace elements in the surface layer of soils sampled from the studied habitats of P. tenuifolia L. are presented in Table 4.
Table 4.
The total content of some nutrients, as well as some potentially harmful trace elements (in conc. HNO3 + H2O2) in the soil surface layer, sampled from the habitats of P. tenuifolia L. in Serbia in 2022.
3.3. Chemical Analyses of Plant Material
The content of macronutrients (N, P, K, Ca, and Mg) in the flower, leaf, stem, follicle, seed, and root of P. tenuifolia at three localities in Serbia is presented in Figure 4. The highest nitrogen (N) contents were observed in the leaves (2.58–3.04%) and flowers (2.30–2.49%) during the flowering of plants, and in seeds (2.30–2.53%) during their ripening. The content of phosphorus (P) was the highest in flowers (0.55–0.69%) followed by seeds (0.49–0.68%), leaves (0.47–0.58%), and stems (0.44–0.54%). The content of potassium (K) was the highest in stems (1.44–1.87%), followed by flowers (1.41–1.76%), leaves (1.07–1.23%), and follicles (1.01–1.34%), and it was quite lower in the seeds (0.66–0.97%) and root tubers (0.37–0.72%). The highest content of calcium (Ca) was observed in the leaves (1.4–1.8%) and follicles (1.2–1.8%), while in all other organs, this content did not exceed 1.2% (Figure 4D). The leaf and flower contained the most magnesium (Mg) (0.33–0.54%), followed by follicles and seeds (0.22–0.34%), and it was quite lower in the stems and root tubers (0.17–0.34%) (Figure 4E).
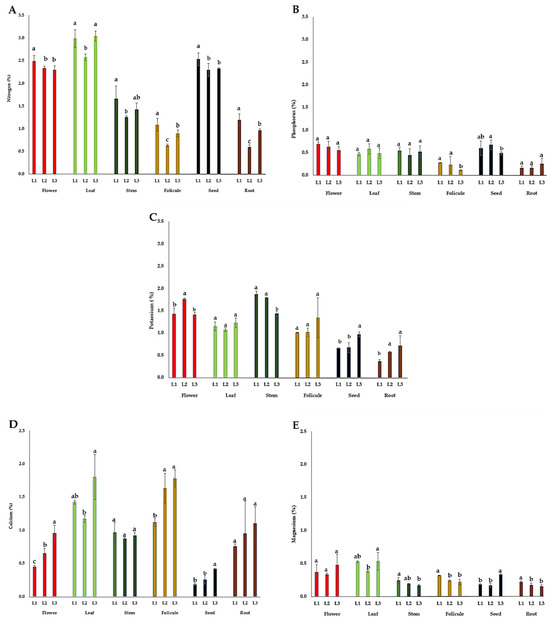
Figure 4.
The mean values of macronutrient content in different plant organs of wild-growing P. tenuifolia plants at three localities in Serbia: (A) nitrogen; (B) potassium; (C) phosphorus; (D) calcium; and (E) magnesium. Localities: L1—Deliblato sands; L2—Bogovo Gumno; and L3—Gulenovci. Letters on bars (a, b, c) refer to the statistical evaluation of macronutrient contents between localities illustrated by bars in the diagrams (p < 0.05, Duncan’s or the Games–Howell test). Error bars indicate standard deviations (n = 3). Flowers, leaves, and stems were collected in the full flowering stage (May 2022); follicles and seeds were collected in the seed maturity stage (July 2022); and roots were collected by the end of vegetation (October 2022).
The content of micronutrients (Fe, Zn, Mn, and Cu) in the flowers, leaves, stems, follicles, seeds, and roots of P. tenuifolia at three localities in Serbia is presented in Figure 5. The iron (Fe) content in this study was the highest in the leaves (55–87 mg kg−1) and flowers (41–74 mg kg−1), followed by stems (36–46 mg kg−1), follicles (40–49 mg kg−1), and seeds (29–49 mg kg−1), and it was quite lower in root tubers (19–48 mg kg−1). The zinc (Zn) content in this study was the highest in the leaves (36–50 mg kg−1) and flowers (35–49 mg kg−1), followed by seeds (35–36 mg kg−1), stems (22–26 mg kg−1), root tubers (20–44 mg kg−1), and follicles (17–26 mg kg−1). The content of manganese (Mn) observed in this study was the highest in the leaves (14–21 mg kg−1), followed by the flowers (10–11 mg kg−1), seeds (6–12 mg kg−1), stems (5–9 mg kg−1), and root tubers and follicles (3–6 mg kg−1). The copper (Cu) content in P. tenuifolia was at a relatively low level (Figure 5D); it was the highest in seeds and stems (8–11 mg kg−1), followed by flowers (8–10 mg kg−1), follicles (7–10 mg kg−1), leaves (6–10 mg kg−1), and root tubers (5–8 mg kg−1).
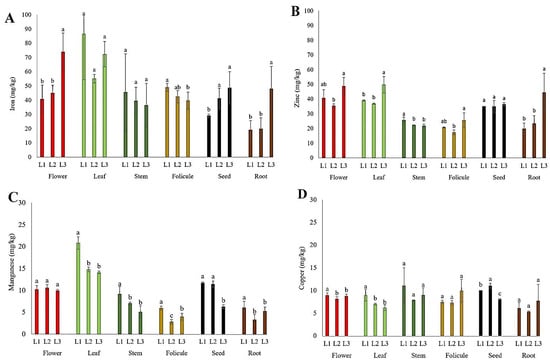
Figure 5.
The mean values of micronutrient content in different plant parts of wild-growing P. tenuifolia species at three localities in Serbia: (A) iron; (B) zinc; (C) manganese; and (D) copper. Localities: L1—Deliblato sands; L2—Bogovo Gumno; and L3—Gulenovci. Letters on bars (a, b, c) refer to the statistical evaluation of the micronutrient contents between localities illustrated by the bars in the diagrams (p < 0.05, Duncan’s or the Games–Howell test). Error bars indicate standard deviations (n = 3). Flowers, leaves, and stems were collected in the full flowering stage (May 2022); follicles and seeds were collected in the seed maturity stage (July 2022); and roots were collected by the end of vegetation (October 2022).
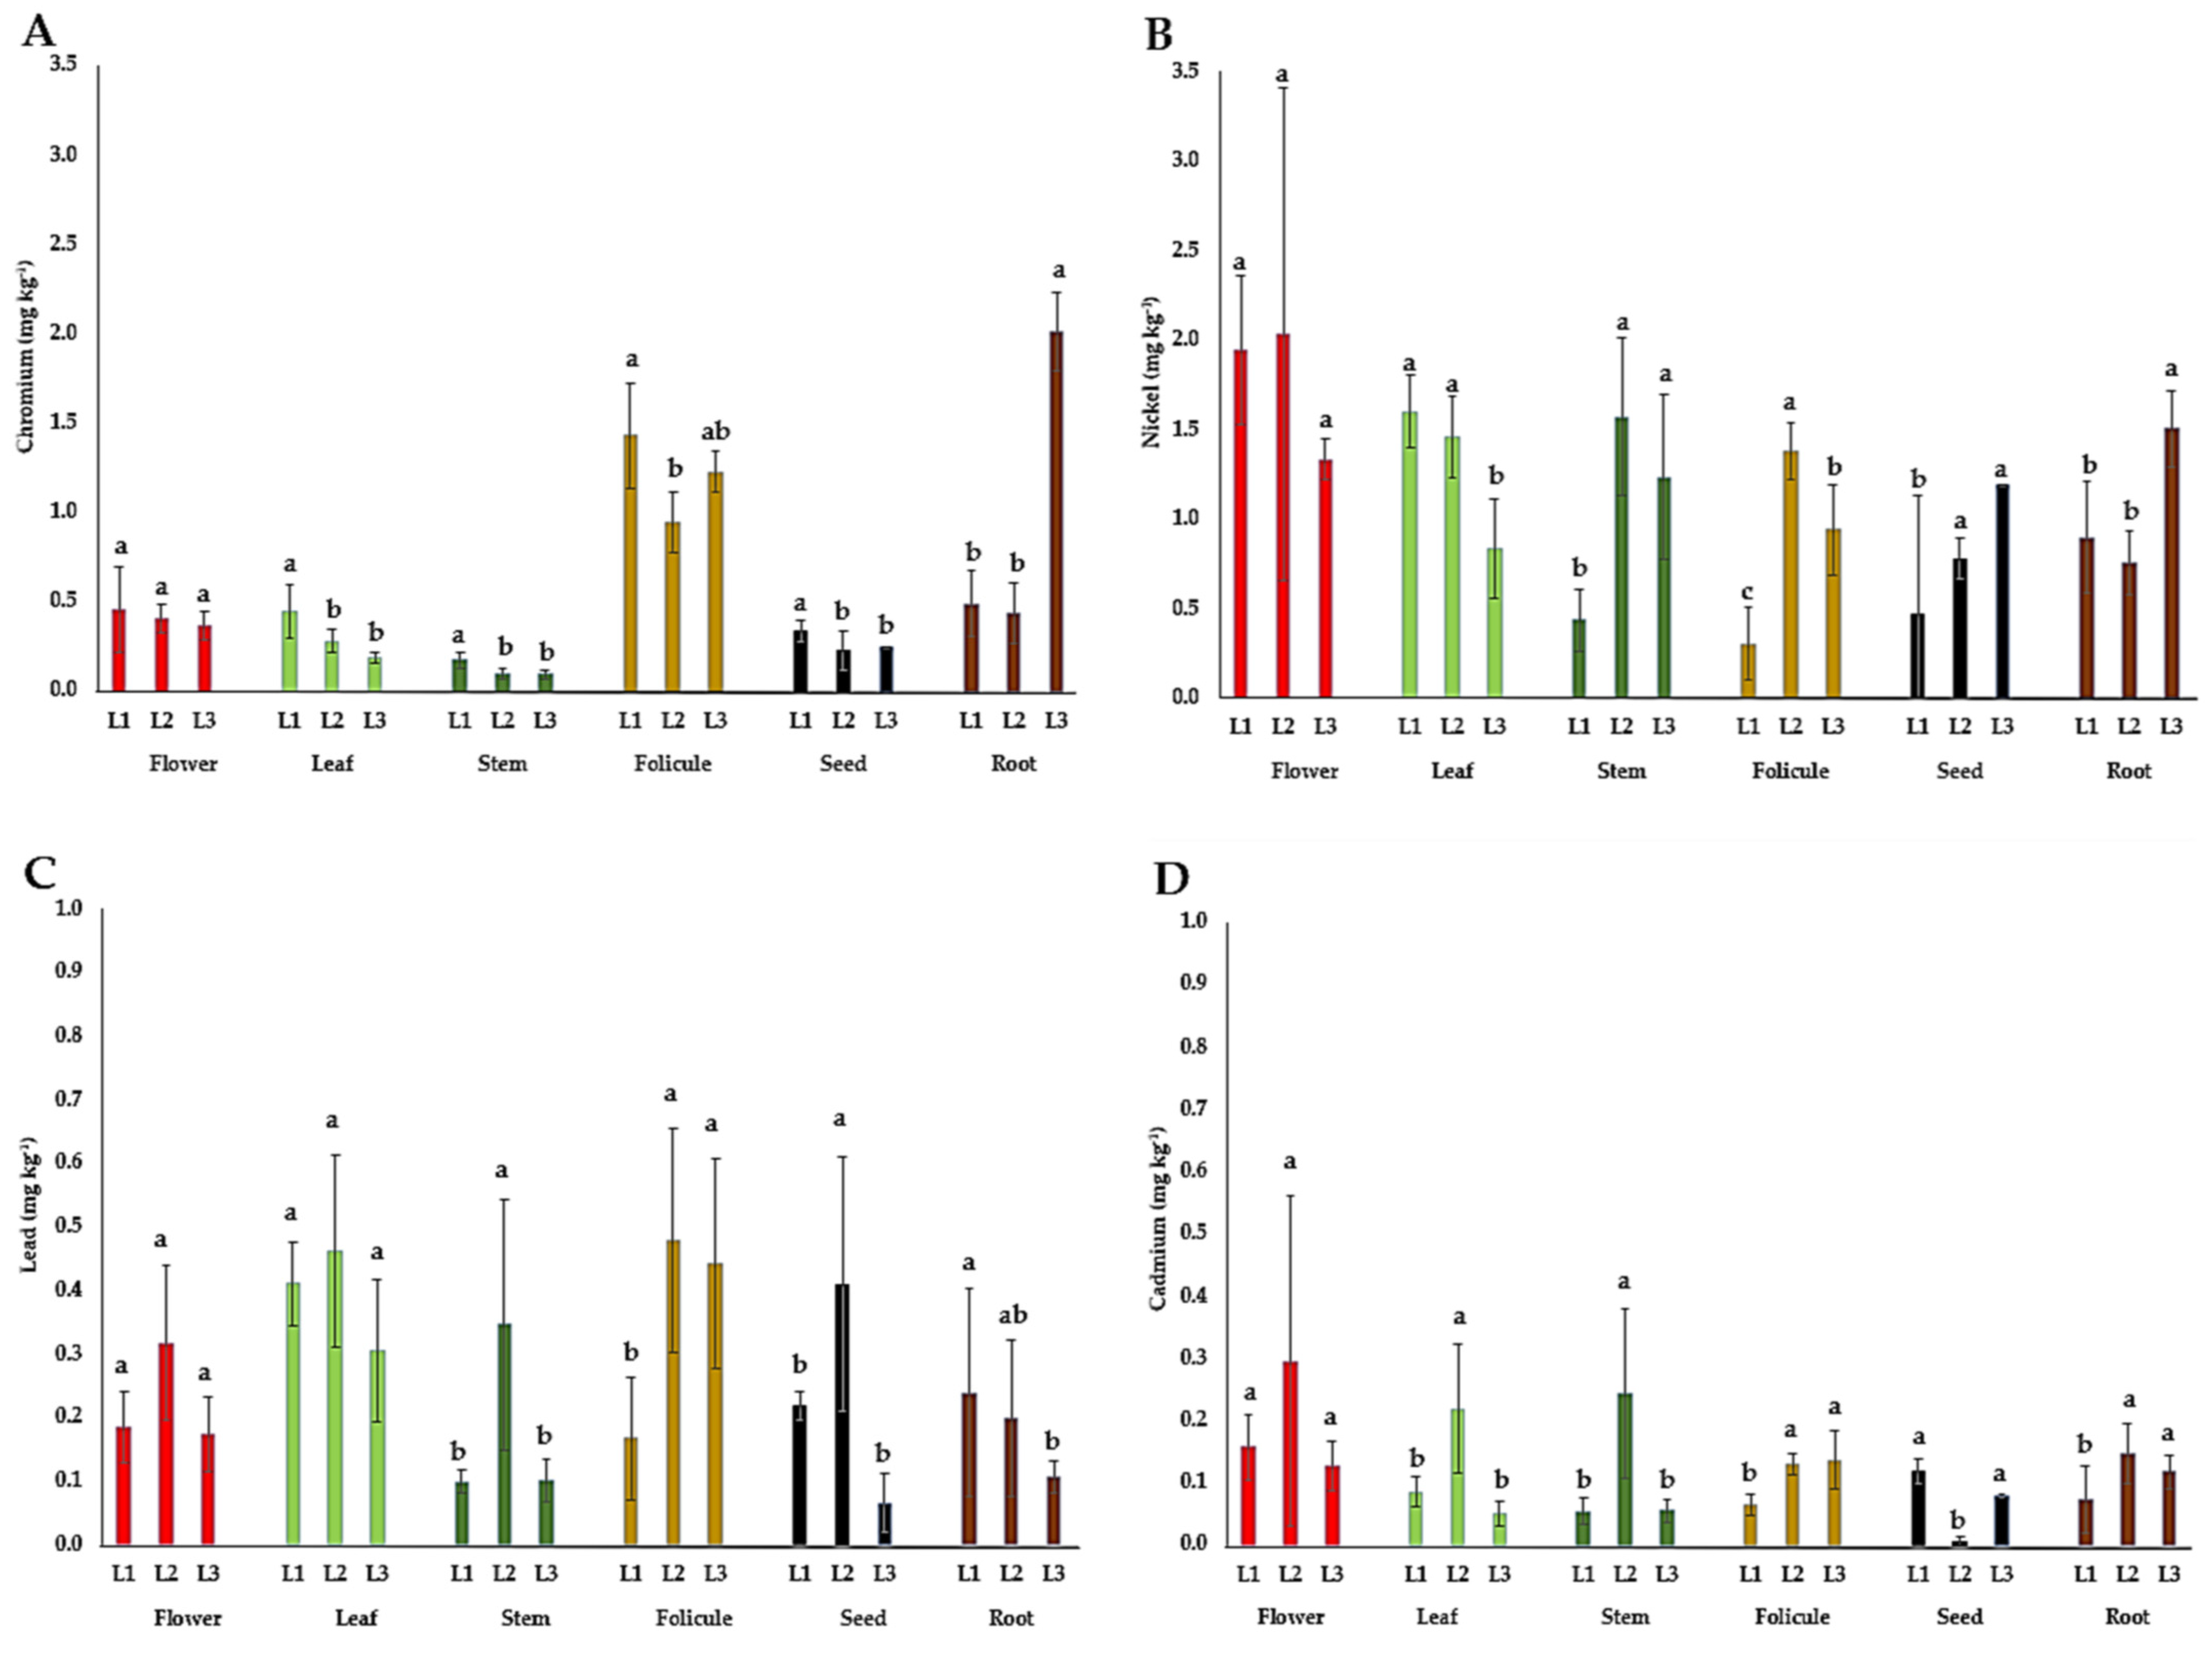
The content of heavy metals (Cr, Ni, Pb, and Cd) in the flowers, leaves, stems, follicles, seeds, and roots of P. tenuifolia at three localities in Serbia is presented in Figure 6. The content of chromium (Cr) in P. tenuifolia plant organs in this study was the highest in root tubers (0.4–2.0 mg kg−1) and follicles (1–1.4 mg kg−1), followed by flowers (0.4–0.5 mg kg−1), leaves (0.2–0.5 mg kg−1), seeds (0.2–0.3 mg kg−1), and stems (0.1–0.2 mg kg−1). The nickel (Ni) content in this study was the highest in flowers (1.3–2.0 mg kg−1), followed by leaves (0.8–1.6 mg kg−1), stems (0.4–1.6 mg kg−1), seeds (0.5–1.2 mg kg−1), root tubers (0.8–1.5 mg kg−1), and follicles (0.3–1.4 mg kg−1). The lead (Pb) content in this study was the highest in the leaves (0.3–0.5 mg kg−1), followed by follicles (0.2–0.5 mg kg−1), flowers (0.2–0.3 mg kg−1), seeds (0.1–0.4 mg kg−1), stems (0.1–0.3 mg kg−1), and root tubers (0.1–0.2 mg kg−1). The cadmium (Cd) content in this study was the highest in the flowers (0.13–0.30 mg kg−1), stems (0.05–0.24 mg kg−1), and leaves (0.05–0.22 mg kg−1), followed by root tubers (0.07–0.15 mg kg−1), follicles (0.07–0.14 mg kg−1), and seeds (0.01–0.12 mg kg−1).
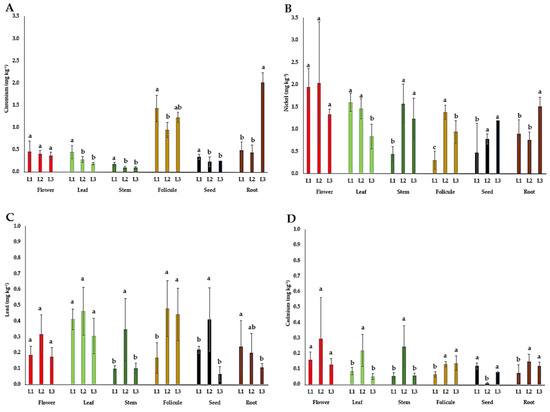
Figure 6.
The mean values of heavy metal contents in different plant parts of wild-growing Paeonia tenuifolia L. species at three localities in Serbia: (A) chromium; (B) nickel; (C) lead; and (D) cadmium. Localities: L1—Deliblato sands; L2—Bogovo Gumno; and L3—Gulenovci. Letters on bars (a, b, c) refer to the statistical evaluation of the micronutrient contents between localities illustrated by bars in the diagrams (p < 0.05, Duncan’s or the Games–Howell test). Error bars indicate standard deviations (n = 3). Flowers, leaves, and stems were collected in the full flowering stage (May 2022); follicles and seeds were collected in the seed maturity stage (July 2022); and roots were collected by the end of vegetation (October 2022).
3.4. Correlations
The results of the correlation analysis are provided in the supplementary material; the correlations of some soil properties with the content of plant nutrients and heavy metals in P. tenuifolia plant organs are presented in Table S2, while the correlations of the total content of plant nutrients and heavy metals in soils with their content in the studied plant organs are presented in Table S3.
Correlation analysis of the influence of soil pH on the content of elements in the plant parts of P. tenuifolia was examined in the narrow pH interval of the soils of natural habitats of this species (pH/H2O = 6.86–7.36; pH/KCl = 6.06–7.11). Correlative relationships were observed between soil pH in H2O and Ca and Mg content, as well as between soil pH in KCl and Mg content, but only in plant leaves (Table S2). In the case of heavy metals, correlative relationships between soil pH in KCl and Ni content were observed only for stems and follicles, while for Cd content, only for the leaves of P. tenuifolia (Table S2).
The lack of correlation between the content of humus in the soil and the content of mineral elements in plant organs (Table S2) can be attributed to the uniformly high content of humus in the studied soils, which ranged from 4.36 to 5.56%.
When analyzing the influence of the total content of plant nutrients in the soil, a positive correlation was observed for K with its content in the follicle, seed, and root, as well as for Ca in the soil with its content in the flowers, leaves, follicles, and seeds (Table S3). Regarding heavy metals, a correlation was found only for Ni content in soil and its content in the follicle, as well as for Pb in the flowers and stems of P. tenuifolia (Table S3).
4. Discussion
4.1. Habitats and Associated Climate
According to previous data [11], the incidence of wild populations of P. tenuifolia in Serbia ranges from 100 m above sea level in the Deliblato sands to Golemi Vrh at the Vidlič Mountains (between 1050 and 1300 m above sea level). Spontaneous populations of P. tenuifolia were detected in this study, conducted 10 years late, with an altitude interval of 150–950 m (Table 1). The largest and best-preserved population was discovered in Deliblato sands (Figure 2, L1). One of the reasons for this can be the loose sandy substrate under the surface humus layer of the soil in this locality, which enables the penetration of water and roots into deeper layers and thereby promotes the development of larger and stronger roots, thus increasing the capacity of plant growth and survival even in dry periods. The hard limestone substrate on the other two sites (L2 and L3) does not provide such opportunities. P. tenuifolia is considered very intolerant of competition [41], which was also observed in our study; only shrubs and low grass steppe vegetation besides P. tenuifolia were widespread in all habitats, and the entire vegetation was scarce (Table 1, Figure 2).
Serbia has a moderate continental climate, with occasional local variations based on site, relief, and other local characteristics. All populations of P. tenuifolia were found in the eastern part of the country (Figure 1), which is characterized by semi-arid steppe climate elements. Over the last 15 years, the mentioned region has experienced an increase in mean annual temperatures of approximately 1 °C, but the average monthly precipitation has remained relatively constant (Table S1). Similar observations have previously been reported for the locality of Deliblato sands [42]. Clearly, the areas in Serbia where wild steppe peony populations thrive have been impacted by the worldwide temperature rise as a result of broad climate changes. Even though P. tenuifolia persists to thrive in the wild in these parts of Serbia, the rise in temperature could eventually become a limiting factor for its survival in these areas.
It can be noted that this species found its natural habitat in Serbia in warmer plain conditions as well as in colder mountain conditions such as L1 and L2 habitats, respectively (Table 2). Different temperatures at the studied habitats caused different periods in which plants went through their phenological phases. For example, the flowering phase at L1 was 10–12 days earlier than at L2, and this was similarly observed for the seed formation and ripening phases. Common to all habitats was the relatively low air humidity (Rh = about 60%), during which P. tenuifolia completes all its developmental stages.
4.2. Soil
Soil types in the natural habitats of P. tenuifolia are Chernozem arenic formed on aeolian sand and Calcomelanosols (black soil formed on limestones; WRB RSG: Mollic Leptiosol (skeletic). The common feature of the soil in all three localities is a shallow surface humus layer (up to 10–25 cm deep), which, along with the climate, additionally contributes to the aridity of these habitats (Table 3). The contents of humus and total nitrogen (N) were uniformly high in all localities, while the content of phosphorus was very low, which is characteristic for these soil types when they are non-arable [29]. Localities differed mostly in the content of available potassium, which ranged from poor at L1 to rich at L3 (Table 3). According to the USDA Soil Texture Triangle, all three soil types had generally lighter textures, and there were slight differences between them: L1 (loamy sand), L2 (loam), and L3 (sandy loam) (Table 3). According to the literature [43], the average Fe content in soils is 3.5%, with calcareous, organic, and sandy soils having lower amounts. These findings are consistent with the results from this study, which show that the total Fe content at L1 (sandy soil) was 0.93%, at L2 (Ca–organic) 1.45%, and at L3 (Ca–organic) 1.26% (Table 4). Despite the high total content in the soil, the solubility and availability of Fe for plants are generally extremely low, particularly in aerated alkaline soils such as those sampled from L1 and L3.
The lowest Mn content in the soils in the natural habitats of P. tenuifolia was observed in sandy soil in L1 and the highest in the L2 locality, with a higher content of clay and silt (Table 3 and Table 4). Its total content in the range of 350 to 700 mg kg−1 is considered normal for uncontaminated soils [44], but its availability for plants depends on a large number of different environmental factors. The Zn average content in studied soils ranged between 40.5 and 88.5 mg kg−1, which is in agreement with Kabata Pendias [43], who reported its range between 60 and 89 mg kg−1 for all soil types. The determined Zn contents in all studied soil samples were far below what is maximally allowed (300 mg kg−1) in agricultural soils [40]. The copper average content in examined soils ranged within the interval 14.2–26.9 mg kg−1, being significantly below the maximally allowed 100 mg kg−1 in agricultural soils [40]; the lowest was in sandy soils and the highest in soil with much higher clay content (Table 3 and Table 4). A similar influence of the soil texture on the Cu content was also observed in other soil types [43].
Regarding heavy metals, the Ni content was consistently below the MDK value of 50 mg kg−1 of the soil, which is common for uncontaminated soils and in line with earlier research [43], which reported this heavy metal’s range at 7–92 mg kg−1 in different soil groups. Similarly, the Cr content was also below the MDK value of 100 mg kg−1. According to previous data [45], the content of Cr in soils varies in a wide interval (2–1100 mg kg−1) depending on its content in the parent substrate. With regard to the Pb content in all examined soils, their contents were far below the MDK limit of 100 mg kg−1. This was similarly observed for Cd content [40], which was also, in studied soils, below the MDK limit of 3 mg kg−1 (Table 4). Taking into account the pH interval in the studied soils (6.9–7.4), the increase in mobility and availability of Cd for plants was not expected. This is consistent with previous findings [46], which reported the highest Cd solubility in the pH range of 4.0–4.5.
4.3. Plant Material
Understanding plant nutrient content in different parts of P. tenuifolia in the phase of their potential exploitation (harvest) is crucial for estimating soil nutrient removal, soil selection, and fertilization needs, aiding in crop cultivation and fertilization decisions.
Content of macronutrients (N, P, K, Ca, and Mg). A higher N content in organs observed during the intense physiological processes in plants (in leaf photosynthesis, flower fertilization, and seed storing) was, according to Mengel and Kirkby [44], expected considering its essential roles in amino acids, proteins, and enzyme systems. On the other hand, N contents in stems were about 50% lower (1.25–1.66%) compared to that of leaves and flowers, and an even lower content was detected in follicles (0.63–1.08%) and root tubers (0.60–1.19%). P. tenuifolia growing in the deepest soil (L1) had the highest N content, as it provided better water and nutrient supply for the plants; this tendency was observed in all plant organs (Figure 4A). It is common for flowers and their reproductive organs to contain high P contents, as it plays an important physiological role in pollen germination [44]. A high P content (0.65–0.66%) was recently reported in the petals of P. officinalis [24]. The high content of P in peony leaves in this study can be explained by its role in building phospholipids in biomembranes and for energy transfer in leaf cells, where photosynthesis takes place. Plants also store P in reserve tissues in the form of phytin [47], which may explain its high content in P. tenuifolia seeds. The lower P contents in the follicles (0.11–0.28%) are not surprising given the large proportion of lignified cell walls in the follicle tissue. The low content of P in root tubers (0.16–0.25%) is similar to that in the roots of another herbaceous peony, P. lactiflora [25]. In addition, all soils where P. tenuifolia grew in Serbia were very poor in P content (Table 2), though the plants did not show the symptoms of its deficiency, such as change in leaf color [44], disturbance in the formation of flowers [48], or seeds [49]. On the contrary, the flowers and seeds contained high P content (Figure 5B). Therefore, it could be suggested that P. tenuifolia plants probably adapted to P deficiency in the soil, similarly to some other plant species reported by Lambers et al. [50]. In most cases, the differences in P content in the same plant organs between localities were not significant (Figure 4B). The content of K in the leaves was slightly lower and at approximately the same level of 1.1–1.2% in all localities (Figure 4C), and it was below the suggested value for the vegetative organs, at 2–5% [51]. P. tenuifolia has small needle-like leaves without a large proportion of parenchymal tissue in them, which explains the lower K content in the leaves. This plant species has thick, juicy, and green stems, which, in addition to their role in transport, also have a role in photosynthesis, which explains the higher K content observed in its stems compared to its leaves (Figure 4C). P. tenuifolia leaves and follicles showed no variation in K content between localities (Figure 4C), indicating that other factors, such as this species’ genetic specificity, influenced the K content of the remaining four plant organs. This is consistent with recent studies in which relatively low K content was observed in the petals of some P. lactiflora cultivars [25] and P. officinalis [24]. According to the data presented in Figure 5C, P. tenuifolia generally showed a lower K content in all of its organs (<2%) than previously reported [51]. Concerning the Ca content, older leaves, roots, and stems with a higher proportion of cell walls were relatively rich in Ca, while plant tissues with a high relative water content (young leaves, flowers, and roots) contain lower Ca contents [52]. The Ca contents in the petals of P. officinalis [24] and P. lactiflora [25] correlate with the Ca content in the flowers of P. tenuifolia in our study. Also, the Ca content in the roots of P. lactiflora [25] corresponds to that obtained in our study. Comparing the localities, the contents of Ca in the flowers, leaves, follicles, seeds, and roots were the highest at L3 (Figure 4D). Considering that Ca uptake from soil (mass flow) depends on soil moisture and the concentration of Ca2+ in the soil solution [44], more precipitations during the vegetation only at L3 (Figure S1) obviously resulted in more favorable soil moisture for Ca uptake than at other localities and higher Ca content in plant material originating from L3. Regarding the content of Mg, 0.15–0.35% is considered sufficient for vegetative plant parts [52,53]. In our study, the Mg content in all organs exceeded this level (Figure 4E), the highest being observed in the leaves and flowers, which was, in some cases, even higher than 0.5%. Considering that Mg can potentially be harmful for plants if leaf concentrations exceed 1.5% [52,53], which can occur under drought stress, the leaves and flowers of P. tenuifolia may be considered a rich source of this element and could be utilized for nutritional purposes. In the plant organs of other herbaceous peonies, such high Mg contents were not observed [24,25].
Content of micronutrients (Fe, Zn, Mn, and Cu). Although the micronutrient content considered sufficient or ideal for many other plant species is well known [44,54], it has never been defined in P. tenuifolia. The critical content of Fe in the leaves of higher plants ranges from 50 to 150 mg Fe kg−1 of plant material [54]. The deficiency of this microelement is called Fe-chlorosis, and it is commonly found in plants that grow in lime-rich soils. The Fe content in P. tenuifolia was found within a wide interval, from 20 mg kg−1 (in roots) to 86 mg kg−1 (in leaves), as presented in Figure 5A. In addition to the differences between the plant organs, the Fe content also depended on the locality. In the flowers and roots, the content was the highest at L3, while in the seeds, an equally higher content was observed at L2 and L3, compared to L1. In the leaves, the content did not differ between localities due to great variability within the samples of the same locality. The Fe content in the petals of herbaceous P. lactiflora cultivars ranged within the interval of 48.7–149.72 mg kg−1 [25], which correlates with the content in the flowers of P. tenuifolia in this study. The Fe content in most organs of wild P. tenuifolia growing in Serbia differed from that of other species of the genus Paeonia. In another study [25], a much higher Fe content was observed in the roots of wild-growing P. lactiflora (150–350 mg kg−1) than in the roots of P. tenuifolia in this study (Figure 6A). More similar values of Fe in roots (26.84–120.76 mg kg−1) were detected in P. lactiflora wild-growing in the lowland part of eastern China [26]. Although Li et al. [25] did not provide the soil characteristics, Wang and Hu [26] reported that the soil was weakly alkaline, suggesting that it contributed to a lower Fe uptake by the roots, which is consistent with our findings. Wang and Hu [26] also studied the Fe content in the stems (59.48–719.52 mg kg−1 DW) and leaves (255.45–913.74 mg kg−1 DW) of P. lactiflora; the values were highly variable and much higher than the corresponding organs of P. tenuifolia in our study (Figure 5A). In the flowers of herbaceous peony P. officinalis, cultivated in slightly acidic soil in Poland [24], much lower Fe contents were detected (21.8–35.66 mg kg−1) compared to this study; the Fe contents in the roots of P. tenuifolia from localities L1 and L2 were below 20 mg kg−1 (Figure 5A), suggesting a slightly lower Fe uptake potential of this peony species, which should be taken into consideration when introducing it into culture. According to Broadley et al. [54], the critical Zn deficiency level in leaves in most plant species is below 15 or 20 mg kg−1 DW, which was not detected in this study (Figure 5B). The Zn content in the plant tissue of P. tenuifolia proved to depend on locality; at L3, the contents were much higher in flowers, leaves, and roots than those from other localities (Figure 5B), although the analyses of the soils from the same localities (Table 4) showed a different trend concerning the total content of this element, indicating that other factors also influence the level of Zn uptake. The Zn content detected in the petals of 50 cultivars of P. lactiflora ranged within the interval of 12.4–41.2 mg kg−1 [23,25], which is in agreement with the Zn content in the flowers of P. tenuifolia in this study (Figure 6B). Much lower Zn contents, 12.6–22.7 mg kg−1, were detected in the flowers of P. officinalis [24]. In the roots and leaves of P. lactiflora [26], Zn contents were 8.03–17.5 mg kg−1 and 15.07–22.46 mg kg−1, respectively, and they were much lower than in the corresponding organs of P. tenuifolia in this study. The content of Zn in the stems of P. lactiflora ranged from 10.35 to 35.19 mg kg−1, which was similar to the results of this study (Figure 5B). Considering that the critical content of Mn deficiency in fully formed leaves of most plants is between 10 and 20 mg kg−1 [54], the content in the leaves of P. tenuifolia in this study was at the lower limit of the optimal (Figure 5C). Differences in the Mn content in flowers were not observed between localities. However, in all other organs, L1 stands out with a higher Mn content, and in seeds, both L1 and L2 stand out compared to the other localities. The differences in pseudo-total Mn in the soil observed between localities (Table 4) did not correlate with the Mn content in the studied plant organs of P. tenuifolia, suggesting that other factors influenced Mn uptake in this species. Similar to our results, Wang and Hu [26] also found a low Mn content in the roots of P. lactiflora (3.8–7.7 mg kg−1), while in the leaves and stems, the contents were higher (28.6–62.9 and 13.4–29.6 mg kg−1, respectively). In contrast, in P. lactiflora, a higher content was determined in the roots (12–18 mg kg−1) [25]. In the flowers of P. officinalis, there was a lower Mn content (6–10.6 mg kg−1) [24] compared to the contents in our study. It can be suggested that the soil conditions at the studied localities did not favor the high availability of Mn for the plants. The investigated soils were characterized by a high content of organic matter and the presence of Ca-carbonates, which influenced the low rate of Mn uptake by the plants. In addition to the lower Mn contents previously reported for P. lactiflora and P. officinalis, the results of this study support the hypothesis that herbaceous peonies may have lower Mn requirements. The critical level of Cu deficiency in the vegetative plant parts is generally in the range of 1–5 mg kg−1, while the critical level of Cu toxicity in leaves is above the interval of 20–30 mg kg−1 [55]. The low levels of Cu in most organs of P. tenuifolia in this study may be a consequence of the high proportion of organic matter in the soils at these localities, as well as the presence of CaCO3 in the soil. The low Cu content was also found in other species of the genus Paeonia. In the flowers of P. officinalis, it was reported that the Cu contents ranged in the interval of 2.92–4.47 mg kg−1 [24], which is less compared to the results of this study. Lower Cu contents were also discovered in the leaves (4.1–5.9 mg kg−1) and roots (2.67–5.35 mg kg−1) of P lactiflora [26]. Li et al. [25] reported results for the stems (2.98–14.79 mg kg−1) and roots (4–6 mg kg−1) of P. lactiflora that were comparable to those of this study. Furthermore, considering that the majority of P. tenuifolia organs in the present investigation had Cu contents that nearly never exceeded 10 mg kg−1 DM (Figure 5D), it can be assumed that low concentrations of Cu are sufficient for herbaceous peonies to meet their needs. Zn, Mn, and Cu are heavy metals that can be harmful. However, their amounts in the plant organs of P. tenuifolia growing wild in Serbia were far below the maximum permitted, meaning that they do not pose any danger to consumers.
The content of heavy metals (Cr, Ni, Pb, and Cd). Most plants uptake Cr in small amounts, and its mobility within the plant is considered weak, being the most concentrated in the roots [56], which is in agreement with the results of this study. If we analyze the impact of locality on Cr content in plant organs, it could be suggested that the Cr contents in our study did not correlate with the total Cr contents in corresponding soils (Figure 6A and Table 4). Since there is no information about the permissible limits of heavy metals for P. tenuifolia plant material and recent investigations revealed the many beneficial activities it possesses, the WHO permissible limits for medicinal plants were used as a reference [57]. Given that the maximum permitted Cr content in edible products and herbal raw materials is 2 mg kg−1 DW [57], the content of this element in P. tenuifolia root tubers from L2 only (2.01 mg kg−1) may be considered limiting. In P. lactiflora, the Cr contents highly exceeded limits in the petals (in average 17.36 mg kg−1) [23] and also in the leaves (4–17.62 mg kg−1), stems (1.38–13.09 mg kg−1), and roots (0.62–4.26 mg kg−1) [26]. However, for P. tenuifolia growing wild in Serbia, it could be cautiously concluded that it showed no tendency to accumulate Cr. In plants growing in uncontaminated soil, the Ni content may vary in a range of 0.06 to 2 mg kg−1, as its uptake is influenced by numerous environmental and biological factors [43]. However, if the soils are polluted, according to the same authors, the Ni content in plants can reach even more than 1000 mg kg−1. In this study, the contents of Ni in all organs ranged within the specified interval for uncontaminated soils (Table 4). Previous data on Ni content in herbaceous peonies are limited, except for the flowers of P. officinalis, in which the content ranged from 0.64 to 1.61 mg kg−1 [24], which is consistent with its content in P. tenuifolia flowers in this study. Regarding the influence of locality in its content in the studied plant organs, the only differences were detected in flowers (Figure 6B). Its content in the soils from different habitats did not correspond with its content in individual plant organs, which can be associated with other ecological or biological factors that affect Ni uptake (Table 4). Since the Ni content in all organs was at the common level for herb material, it can be cautiously concluded that P. tenuifolia growing wild in Serbia does not have a tendency to accumulate this element. All Pb contents in different plant organs were significantly below the maximum allowed amount of <10 mg kg−1 DW [57]. Such an outcome is most likely the result of the absence of Pb contamination in the soil and the lack of sources of Pb aero-contamination nearby. Similarly, the low Pb contents were also reported in P. laciflora (in the leaves at 0.73–2.55, in the stems at 0.19–2.29, and in the roots at 0.02–0.15 mg kg−1) [26], as well as in P. officinalis (in flowers 0–0.20 mg kg−1) [24]. The WHO [57] recommended a maximum level of 0.3 mg kg−1 DW of Cd in medicinal raw material, while Steinhof [58] reported that in Germany, the limit is set at even lower amounts of 0.2 mg kg−1 for most medicinal plants. The majority of P. tenuifolia plant organs had Cd contents below 0.2 mg kg−1 (Figure 6D), with the exception of the leaves, stems, and particularly the flowers derived from L2, where Cd contents ranged between 0.2 and 0.3 mg kg−1, falling within the two thresholds. In P. officinalis, the range of Cd content in the flowers was in the interval of 0.13–0.29 mg kg−1 [24], which was also observed in the flowers of P. tenuifolia in this study. For P. lactiflora, Wang and Hu [26] reported somewhat lower Cd contents in the roots (0.01–0.04 mg kg−1) and stems (0.04–0.11 mg kg−1), and much lower contents in the leaves (0.02–0.04 mg kg−1). These findings suggest that herbaceous species of the genus Paeonia are not prone to Cd accumulation, provided they grow in soil with a pH/H2O ≥ 6.9.
According to the literature data [43,44,52,54], various ecological and biological factors may affect the uptake of mineral elements from the soil by the plant, such as soil water–air conditions, temperatures, microbiota, etc. Only the influence of soil pH and humus content on the status of mineral elements in P. tenuifolia plant parts was tested by correlation analysis (Tables S2 and S3). The correlative relationships were detected only between the pH and Ca, Mg, Ni, and Cd contents, and mostly in the vegetative organs of P. tenuifolia. Although the populations of P. tenuifolia spontaneously grew in soils within a narrow pH interval and the availability of the mentioned elements in weak acid soils is considered optimal, the obtained results should be considered as informative, as they are insufficient to draw any more serious conclusions.
5. Conclusions
Due to its low competitiveness, Paeonia tenuifolia populations survive only in extremely arid habitats in Serbia, where they outcompete sparse steppe vegetation. However, rising temperatures threaten its survival, making cultivation a viable option.
Wild-growing P. tenuifolia plants from various habitats in Serbia have higher P and Mg contents and lower K, Mn, and Cu contents compared to other herbaceous plants, regardless of the soil nutrient content. These data provide insights into its nutritional value and healthiness, aiding in soil selection for cultivation.
Based on the soil characteristics of the three studied natural habitats, Arenic chernozem is the most suitable for cultivating this endangered species. Highly acidic soils should be avoided due to their potential to increase heavy metal availability, particularly Cd and Cr. For optimal growth, soils with a deeper, lighter loamy texture are preferred.
Supplementary Materials
The following supporting information can be downloaded at: https://www.mdpi.com/article/10.3390/horticulturae10090972/s1, Figure S1: Walter’s climate diagram (3:1) based on data from the nearest meteorological station: (A) MS Banatski Karlovac for L1; (B) MS Knjaževac for L2; (C) MS Dimitrovgrad for L3. YP, annual sum of precipitation (mm); YT, annual average temperature (C); S1, sampling period for flowers, stems, and leaves; S2, sampling period for seeds, follicles, and roots; Table S1: Fifteen-year (2008–2022) averages of precipitation (mm) and air temperature (°C) at the meteorological stations nearest to the studied three localities; Table S2: Correlation of soil features and plant nutrients and heavy metal content in the plant parts of P. tenuifolia L.; Table S3: Correlation of the plant nutrient content and heavy metals in soils and its content in the plant parts of P. tenuifolia L.
Author Contributions
Conceptualization T.M. and D.R.; writing—original draft preparation, D.R., S.M., S.G. and B.T.; visualization T.M.; formal analyses D.R., B.T. and S.G.; statistical analyses A.D. and D.R.; writing—review and editing, T.M., M.L., Ž.P. and A.D., critical review and supervision T.M. and D.R. All authors have read and agreed to the published version of the manuscript.
Funding
This work was supported by the Ministry of Science and Technology of the Republic of Serbia, grants 451-03-1202/2021-09 and 451-03-66/2024-03/200003/1.
Data Availability Statement
Data are contained within the article or Supplementary Material.
Conflicts of Interest
The authors declare no conflicts of interest.
References
- Hong, D.Y. Peonies of the World: Taxonomy and Phytogeography; Missouri Botanical Garden: St. Louis, MI, USA, 2010; p. 302. [Google Scholar]
- Suleymanova, G.; Boldyrev, V.; Savinov, V. Post-fire restoration of plant communities with Paeonia tenuifolia in the Khvalynsky National Park (Russia). Nat. Conserv. Res. 2019, 4, 57–77. [Google Scholar] [CrossRef]
- Seliverstova, E.N.; Khrapach, V.V.; Volkova, V.V.; Shegrinets, N.V. The Results of Plant Monitoring in the Semistozhki Area of Stavropol Region. In Proceedings of the International Scientific and Practical Conference AgroSMART—Smart Solutions for Agriculture, Tyumen, Russia, 16–20 July 2018; KnE Life Sciences: Cambridge, MA, USA, 2019; pp. 1013–1022. [Google Scholar] [CrossRef]
- Prijić, Ž.; Marković, T.; Radanović, D.; Jingqi, X.; Xiuxin, Z.; Gordanić, S.; Mikić, S.; Dragumilo, A.; Čutović, N.; Batinić, P. The effect of the year on the steppe peony’s morphological and ornamental traits. Acta Herbol. 2023, 32, 65–72. [Google Scholar] [CrossRef]
- Ivanova, A.; Delcheva, I.; Tsvetkova, I.; Kujumgiev, A.; Kostova, I. GC-MS Analysis and Anti-Microbial Activity of Acidic Fractions Obtained from Paeonia peregrina and Paeonia tenuifolia Roots. Z. Naturforsch C J. Biosci. 2002, 57, 624–628. [Google Scholar] [CrossRef] [PubMed]
- Marković, M.; Stankov-Jovanović, V.; Smiljić, M. Medicinal flora of the Vidlic mountain in Serbia. Univ. Thought-Publ. Nat. Sci. 2019, 9, 17–26. [Google Scholar] [CrossRef]
- Čutović, N.; Marković, T.; Kostić, M.; Gašić, U.; Prijić, Ž.; Ren, X.; Lukić, M.; Bugarski, B. Chemical Profile and Skin-Beneficial Activities of the Petal Extracts of Paeonia tenuifolia L. from Serbia. Pharmaceuticals 2022, 15, 1537. [Google Scholar] [CrossRef]
- Čutović, N.; Marković, T.; Carević, T.; Stojković, D.; Bugarski, B.; Jovanović, A.A. Liposomal and Liposomes-Film Systems as Carriers for Bioactives from Paeonia tenuifolia L. Petals: Physicochemical Characterization and Biological Potential. Pharmaceutics 2023, 15, 2742. [Google Scholar] [CrossRef]
- Batinić, P.; Jovanović, A.; Stojković, D.; Čutović, N.; Cvijetić, I.; Gašić, U.; Carević, T.; Zengin, G.; Marinković, A.; Marković, T. A novel source of biologically active compounds—The leaves of Serbian herbaceous peonies. Saudi Pharm. J. 2024, 32, 102090. [Google Scholar] [CrossRef]
- Batinić, P.; Jovanović, A.; Stojković, D.; Zengin, G.; Cvijetić, I.; Gašić, U.; Čutović, N.; Pešić, M.B.; Milinčić, D.D.; Carević, T.; et al. Phytochemical analysis, biological activities, and molecular docking studies of root extracts from Paeonia species in Serbia. Pharmaceuticals 2024, 17, 518. [Google Scholar] [CrossRef]
- Lazarević, P.; Stojanović, V. Wild peonies (Paeonia L.) in Serbia—Distribution, state of populations, threat and protection. Zaštita Prir. 2012, 62, 19–44. (In Serbian) [Google Scholar]
- Bilz, M. Paeonia tenuifolia (Europe Assessment). In The IUCN Red List of Threatened Species 2011: E.T165143A5981869; 2024; Available online: https://www.iucnredlist.org/species/165143/5981869 (accessed on 25 August 2024).
- Stevanović, V. Ed Red Book of Flora; Serbia 1—Extinct and Extremely Endangered Taxa; Ministry of Environmental Protection of Republic of Serbia: Belgrade, Serbia, 1999; pp. 167–169. [Google Scholar]
- Yom Din, G.; Cohen, M.; Kamenetsky, R. Database for Herbaceous Peony Cultivated in Warm Climate Regions: Effects of Temperature on Plant Dormancy and Growth. J. Hortic. 2015, 2, 3. [Google Scholar] [CrossRef]
- Marković, T.; Prijić, Ž.; Xue, J.; Zhang, X.; Radanović, D.; Ren, X.; Filipović, V.; Lukić, M.; Gordanić, S. The seed traits associated with dormancy and germination of herbaceous peonies, focusing on species native in Serbia and China. Horticulturae 2022, 8, 585. [Google Scholar] [CrossRef]
- Rockström, J.; Steffen, W.; Noone, K.; Persson, A.; Chapin, F.S.; Lambin, E.; Lenton, T.M.; Scheffer, M.; Folke, C.; Schellnhuber, H.; et al. Planetary boundaries: Exploring the safe operating space for humanity. Ecol. Soc. 2009, 14, 32. Available online: http://www.ecologyandsociety.org/vol14/iss2/art32/ (accessed on 23 March 2022). [CrossRef]
- Zhang, K.; Zhang, Y.; Tao, J. Predicting the potential distribution of Paeonia veitchii (Paeoniaceae) in China by incorporating climate change into a maxent model. Forests 2019, 10, 190. [Google Scholar] [CrossRef]
- Andrieu, E.; Thompson, J.D.; Debussche, M. The impact of forest spread on a marginal population of a protected peony (Paeonia officinalis L.): The importance of conserving the habitat mosaic. Biodivers. Conserv. 2007, 16, 643–658. [Google Scholar] [CrossRef]
- Ne’eman, G. To be or not to be—The effect of nature conservation management on flowering of Paeonia mascula (L.). Mill. Israel. Biol. Conserv. 2003, 109, 103–109. [Google Scholar] [CrossRef]
- Đorđević, S. Temperature and Precipitation Trends in Belgrade and Indicators of Changing Extremes for Serbia. Geogr. Pannonica 2008, 12, 62–68. [Google Scholar] [CrossRef]
- Perković, S.; Paul, C.; Vasić, F.; Helming, K. Human Health and Soil Health Risks from Heavy Metals, Micro(nano)plastics, and Antibiotic Resistant Bacteria in Agricultural Soils. Agronomy 2022, 12, 2945. [Google Scholar] [CrossRef]
- Li, C.; Yan, S.; Daqiu, Z.; Jun, T.; Liguo, F. Research Article Relationship between Major Mineral Nutrient Elements Contents and Flower Colors of Herbaceous Peony (Paeonia lactiflora Pall.). Adv. J. Food Sci. Technol. 2015, 7, 374–382. [Google Scholar] [CrossRef]
- Weixing, L.; Shunbo, Y.; Hui, C.; Yanmin, H.; Jun, T.; Chunhua, Z. Nutritional evaluation of herbaceous peony (Paeonia lactiflora Pall.). Emir. J. Food Agric. 2017, 29, 518–531. [Google Scholar] [CrossRef]
- Grzeszczuk, M.; Stefaniak, A.; Meller, E.; Wysocka, G. Mineral composition of some edible flowers. J. Elem. 2018, 23, 151–162. [Google Scholar] [CrossRef]
- Li, Z.; Dexi, L.; Lijie, Z.; Linghao, L. Mineral Elements and Active Ingredients in Root of Wild Paeonia lactiflora Growing at Duolun County; Inner Mongolia Biological Trace Element Research: Inner, China, 2019. [Google Scholar] [CrossRef]
- Wang, J.; Hu, Y. Translocality and accumulation of heavy metals from the rhizosphere soil to the medicinal plant (Paeonia lactiflora Pall.) grown in Bozhou, Anhui Province, China. Env. Pollut. Bioavail. 2023, 35, 2223768. [Google Scholar] [CrossRef]
- Gunn, C.; Kim, M.P.; Jason, P.B. Nest microclimate at northern Black Swift colonies in Colorado, New Mexico, and California: Temperature and relative humidity. Wilson J. Ornithol. 2012, 124, 797–802. [Google Scholar] [CrossRef]
- Belić, M.; Nešić, L.; Ćirić, V. Practicum in Pedology; Faculty of Agriculture, University of Novi Sad: Novi Sad, Serbia, 2014; pp. 1–90. (In Serbian) [Google Scholar]
- Škorić, A.; Filipovski, G.; Cirić, M. Classification of Yugoslav Soils; Interacademic Board for Soil Science Book 13; Academy of Sciences and Arts of Bosnia and Herzegovina: Sarajevo, Bosnia and Herzegovina, 1985. (In Serbian) [Google Scholar]
- World Reference Base for Soil Resources 2014, International Soil Classification System for Naming Soils and Creating Legends for Soil Maps; FAO Food and Agriculture Organization of the United Nations: Rome, Italy, 2015.
- Manual for Soil Testing, Book I; Chemical Methods of Soil Testing; Yugoslav Society for Soil Research: Zemun, Belgrade, 1966; pp. 78–86. (In Serbian)
- ISO 10693:1995; Soil Quality—Determination of Carbonate Content. Volumetric Method. International Organization for Standardization: Geneva, Switzerland, 1995.
- ISO 14235:1998; Soil Quality—Determination of Organic Carbon by Sulfochromic Oxidation. International Organization for Standardization: Geneva, Switzerland, 1998.
- SRPS ISO 10694:2005; Soil Quality—Determination of Organic and Total Carbon after Dry Combustion (Elementary Analysis). Institute for Standardization of Serbia: Belgrade, Serbia, 2005.
- Jarvis, K.E.; Gray, A.L.; Houk, R.S.; Jarvis, I.; Mac Laren, J.W.; Williams, J.G. Handbook of Inductively Coupled Plasma Mass Spectrometry; Springer: New York, NY, USA, 1992; Available online: https://link.springer.com/book/10.1007/978-1-4613-0697-9 (accessed on 12 August 2024).
- Thun, R.; Hermann, R.; Knickmann, F. Die Untersuchung von Böden. Band I, Methodenbuches des Verbandes Deutscher Landwirtschaftlicher Untersuchungs-und Forschungsanstalten. 3. Aufl.; Neumann: Radebeul/Berlin, Germany, 1955. [Google Scholar]
- USDA United States Department of Agriculture Soil Survey Manual (Handbook No. 18); Government Printing Office: Washington, DC, USA, 2017.
- Sáez-Plaza, P.; Navas, M.J.; Wybraniec, S.; Michałowski, T.; Asuero, A.G. An Overview of the Kjeldahl Method of Nitgen Determination. Part II. Sample Preparation, Working Scale, Instrumental Finish, and Quality Control. Crit. Rev. Anal. Chem. 2013, 43, 224–272. [Google Scholar] [CrossRef]
- Republic Hydrometeorological Service of Serbia. Annual Bulletin for Serbia the year of 2022: Division for Climate Monitoring and Climate Forecast, Department of National Center for Climate Change, Climate Model Development and Disaster Risk Assessment. 2022. Belgrade. Available online: https://www.hidmet.gov.rs/data/klimatologija/eng/2022.pdf (accessed on 12 August 2024).
- Official Gazette of Republic of Serbia 23/1994. Available online: https://www.pravno-informacioni-sistem.rs/arhslgl-sgarh (accessed on 12 August 2024).
- Rudaya, O.A.; Chesnokov, N.N.; Kirina, I.B.; Tarova, Z.N.; Bobrovich, L.V.; Kiriakova, O.I. The research of seed reproduction peculiarities of wild-growing Paeonia L. genus and perspectives of using peony seeds in food-processing industry. In IOP Conference Series: Earth and Environmental Science; IOP Publishing: Bristol, UK, 2021; Volume 845, p. 012002. [Google Scholar] [CrossRef]
- Bohajar, Y.A.M. Droughts and the Process of Aridification as Soil Degradation Factor in Deliblato Sands. Ph.D. Thesis, University of Belgrade, Faculty of Forestry, Beograd, Belgrade, 2016. [Google Scholar]
- Kabata-Pendias, A. Trace Elements in Soils and Plants, 4th ed.; CRC Press Taylor & Francis Group: Boca Raton, FL, USA, 2011; pp. 1–505. [Google Scholar]
- Mengel, K.; Kirkby, E.A. Principles of Plant Nutrition, 5th ed.; Kluwer Academic Publishers: Berlin/Heidelberg, Germany, 2001; pp. 1–849. [Google Scholar]
- Salvador-Blanes, S.; Cornu, S.; Bourennane, H.; King, D. Controls of the spatial variability of Cr concentration in top soils of a central French landscape. Geoderma 2006, 132, 143–157. [Google Scholar] [CrossRef]
- Selim, H.M.; Amacher, M.C. Reactivity and Transport of Heavy Metals in Soils; CRC Press/Lewis Publishers: Boca Raton, FL, USA, 1997; p. 201. [Google Scholar]
- Lott, J.N.A.; Bojarski, M.; Kolasa, J.; Batten, G.D.; Campbell, L.C. A review of the phosphorus content of dry cereal and legume crops of the world. Int. J. Agric. Resour. Gov. Ecol. 2009, 8, 351–370. [Google Scholar] [CrossRef]
- Bould, C.; Parfitt, R.I. Leaf analysis as a guide to the nutrition of fruit crops. X. Magnesium and phosphorus sand culture experiments with apple. J. Sci. Food Agric. 1973, 24, 175–185. [Google Scholar] [CrossRef]
- Barry, D.A.J.; Miller, M.H. Phosphorus nutritional requirement of maize seedlings for maximum yield. Agron J. 1989, 81, 95. [Google Scholar] [CrossRef]
- Lambers, H.; Shane, M.W.; Cramer, M.D.; Pearse, S.J.; Veneklaas, E.J. Root structure and functioning for efficient acquisition of phosphorus: Matching morphological and physiological traits. Ann. Bot. 2006, 98, 693–713. [Google Scholar] [CrossRef]
- Marschner, H.; Cakmak, I. High light intensity enhances chlorosis and necrosis in leaves of zinc, potassium, and magnesium deficient bean (Phaseolus vulgaris) plants. J. Plant Physiol. 1989, 134, 308–315. [Google Scholar] [CrossRef]
- Hawkesford, M.; Horst, W.; Kichey, T.; Lambers, H.; Schjoerring, J.; Skrumsager-Møller, I.; White, P. Functions of Macronutrients. In Marschner’s Mineral Nutrition of Higher Plants, 3rd ed.; Petra Marschner, P., Ed.; Elsevier: Amsterdam, The Netherlands, 2012; pp. 135–189. [Google Scholar]
- Bommala, V.K.; Krishna, M.G.; Rao, C.T. Magnesium matrix composites for biomedical applications: A review. J. Magnes. Alloy 2019, 7, 72–79. [Google Scholar] [CrossRef]
- Broadley, M.; Brown, P.; Cakmak, I.; Rengel, Z.; Fangjie, Z. Function of Micronutrients. In Marschner’s Mineral Nutrition of Higher Plants, 3rd ed.; Petra Marschner, P., Ed.; Elsevier: Amsterdam, The Netherlands, 2012; pp. 191–248. [Google Scholar]
- Robson, A.D.; Reuter, D.J. Diagnosis of copper deficiency and toxicity. In Copper in Soils and Plants; Loneragan, J.F., Robson, A.D., Graham, R.D., Eds.; Academic Press: London, UK; Orlando, FL, USA, 1981; pp. 287–312. [Google Scholar]
- Zayed, A.; Lytle, C.M.; Qian, J.H.; Terry, N. Chromium accumulation, translocality and chemical speciation in vegetable crops. Planta 1998, 206, 239. [Google Scholar] [CrossRef]
- Solimene, U.; Alkofahi, A.; Allemann, C.; Amigoni, M.; Aspan, R.; Azimova, S.; Bloodworth, B.C.; Caccialanza, G.; Caizzi, A.; Cheraghali, M.; et al. WHO Guidelines for Assessing Quality of Herbal Medicines with Reference to Contaminants and Residues; World Health Organization: Geneva, Switzerland, 2007; p. 105. Available online: https://www.who.int/publications/i/item/9789241594448 (accessed on 12 August 2024).
- Steinhof, B. Standardisierung der Qualität von Johanniskrautdrogen und–zubereitungen. Z. För Arznei-Und Gewürzpflanzen 1998, 3, 63–66. [Google Scholar]


Disclaimer/Publisher’s Note: The statements, opinions and data contained in all publications are solely those of the individual author(s) and contributor(s) and not of MDPI and/or the editor(s). MDPI and/or the editor(s) disclaim responsibility for any injury to people or property resulting from any ideas, methods, instructions or products referred to in the content. |
© 2024 by the authors. Licensee MDPI, Basel, Switzerland. This article is an open access article distributed under the terms and conditions of the Creative Commons Attribution (CC BY) license (https://creativecommons.org/licenses/by/4.0/).