Abstract
Research was conducted to examine the marketable yield and fruit weight of six strawberry cultivars (Fragaria × ananassa Duch. ‘Festival’, ‘Fortuna’, ‘Brilliance’, ‘Red Rhapsody’, ‘Sundrench’ and ‘Suzie’) over two years in subtropical Queensland, Australia. In the first year, the transplants were planted on 30 March, while in the second year, they were planted on 22 April. The average daily minimum temperature was 3 °C higher than the long-term average for the area from 1965 to 1990, while the average daily maximum temperature was 1 °C higher. Temperatures and solar radiation were similar in the two years of the study. In contrast, it was wetter in the second year (478 mm) than in the first year (332 mm). Average yield was lower in the second year (142 ± 10 g/plant) than in the first year (330 ± 9 g/plant) (p < 0.001), possibly due to a later planting. Higher rainfall in the second year may have also contributed to a higher incidence of rain damage and fruit rots. Yield was lower in ‘Sundrench’ (176 g/plant) than in the other cultivars (235 to 252 g/plant) (p = 0.003). Fruit weight was lower in the second year (18.2 g) than in the first year (23.8 g) (p < 0.001), and lower in ‘Festival’ and ‘Fortuna’ (18.2 and 19.4 g), intermediate in ‘Brilliance’, ‘Red Rhapsody’ and ‘Sundrench’ (21.0, 21.3 and 21.8 g) and higher in ‘Suzie’ (24.3 g) (p < 0.001). These results demonstrate that yield and fruit size vary in cultivars in Queensland. ‘Suzie’ had the largest fruit, favoring marketing. The low productivity of ‘Sundrench’ suggests that this cultivar is not commercially viable in Queensland. Yields are expected to decline in the future under global warming, in the absence of better-adapted cultivars and other mitigating strategies. Further evaluations of cultivars in Queensland are required under different growing practices, including earlier times of planting, higher plant densities, light shade and protected cropping.
1. Introduction
Strawberry (Fragaria × ananassa Duch.) is one of the most important fruit crops grown around the world and is the leading fruit in the berry catalogue [1]. Total production is about 10 million tonnes, with the crop important in China, the United States, Mexico and several countries in Europe [2,3]. The plants are adapted to a range of environments and are grown in locations with a cool temperate climate (e.g., Norway), a warm subtropical climate (e.g., Florida and Argentina) and a Mediterranean climate (e.g., Spain, Italy and California) [4,5,6]. In tropical locations such as Malaysia and Indonesia, the crop is grown at elevation above 1000 m [7,8]. Plant breeding has been active in the last 200 years, with higher yields, better fruit quality and resistance to the major diseases affecting the crop [9,10,11]. The plants are grown under different production systems, including protected cropping and open-field cultivation. Plants under tunnels or in glasshouses can be grown in benches using soil-less technology. Tunnels are important in the United Kingdom and Spain and in other areas in Europe, but they are less common in the United States and elsewhere [12,13]. Most producers use conventional agronomy, although there is interest in organic or similar low-input technologies [14].
Strawberry is an important crop in Australia, with growers producing 90,000 tonnes of fruit worth AUD (Australian Dollars) 450 million each year [15]. Strawberries are the second most important fruit after banana and are the most important of the berry crops. A range in geography, climates, cultivars and production systems allows for cropping across the whole year. The main production centers are in Queensland (42%), Victoria (36%) and Western Australia (10%). There are smaller industries in South Australia (7%), Tasmania (4%) and New South Wales (1%) [16]. No fruit is produced in the North Territory, where it is too warm for commercial production. Most of the plantings are in the open field, with less than 5% under protected cropping. ‘Red Rhapsody’ is the main cultivar in subtropical areas, while ‘Albion’ is the main cultivar in temperate areas. Eighty-seven percent of the supply goes to the retail sector and 13 percent to the food service sector [15]. There are two principal areas in Queensland, each with a different production season. The winter crop is produced from May to October on the Sunshine Coast, while the summer crop is produced from October to May at elevation on the Granite Belt. A review of production in Queensland and elsewhere indicated that increases in temperature since 1967 were associated with a decrease in yield of 28% in southeast Queensland [17].
The profitability of strawberry growing depends on the yields of the plants, the costs of production and the prices received for the fruit. Strawberries encounter competition during winter across Australia from other popular berries, including blueberries, blackberries and raspberries. Information collected on the throughput and prices for strawberries consigned to the Brisbane Markets in southern Queensland from 2010 to 2020 indicated the strong relationship between supply and demand during the main season in Queensland [15]. About 2000 to 4000 tonnes of fruit were sold from May to October each year from 2010 to 2020. Throughput increased from May to August and then decreased in September. The average price decreased from AUD 3.37 per 250 g punnet in May to AUD 1.39 in August and to AUD 1.17 in September. Average prices were close to the costs of production in August and below the costs of production in September.
There is limited information on the yields of strawberry cultivars in the open field in Queensland. Herrington et al. [18] grew five cultivars (‘Camarosa’, ‘Festival’, ‘Kabarla’, ‘Rubygem’ and ‘Selva’) over a single season in Cleveland. There were three replicates/treatment and six plants/plot. Yields from June to August ranged from 347 to 700 g/plant. In a second study, Herrington et al. [19] grew four cultivars (‘Festival’, ‘Fortuna’, ‘Red Rhapsody’ and ‘Suncoast Delight’) in Nambour from 2012 to 2018. There were three replicates/treatment and 15 plants/plot. It was not indicated if all the cultivars were grown every season. Yields from May to August ranged from 467 to 715 g/plant. Several of the cultivars in these earlier studies are not grown in Queensland anymore. There is also a problem with the estimation of productivity in these studies, with only data on total yields presented. A review of productivity in strawberry indicated that marketable yield had a linear, but inconsistent, relationship with total yield across different cultivars, sites and years [20]. The slope from the regression between marketable and total yield ranged from 0.25 to 0.99, with a median of 0.80, and a mean (± s.e. or standard error) of 0.78 ± 0.01. Marketable yield could not be predicted from total yield. The results of this review demonstrated that marketable yield is a better indicator of productivity than total yield.
This paper examines the performance of six strawberry cultivars grown over two years in subtropical Queensland, Australia. The main objective of the study was to determine the marketable yield and fruit weight of new cultivars available to the industry. The cultivars chosen were the most popular of the current gene pool with commercial producers and were readily available from the plant nurseries. Additional data were collected on the weather during the experiment and how these related to long-term conditions for the area under global warming.
2. Materials and Methods
2.1. Treatments and Experimental Design
Containerized transplants of ‘Festival’, ‘Fortuna’, ‘Brilliance’, ‘Red Rhapsody’, ‘Sundrench’ and ‘Suzie’ were planted on 30 March in 2023 and on 22 April 2024 in the open field at Nambour in Queensland, Australia (latitude 26°62′ S, longitude 152°96′ E and elevation 29 m). The transplants were grown in 72 cell-trays with 41 cm3 cells sourced from a nursery in Armidale, New South Wales (latitude 30°30′ S, longitude 153°39′ E and elevation 980 m). The cultivars were planted in randomized blocks with six replicate blocks/cultivar and 20 plants/plot (120 plants/cultivar).
2.2. Plant Maintenance
The transplants were planted through plastic, in double-row beds 70 cm wide and 130 cm apart from the centers and grown at 30 cm between the rows and 30 cm within the rows. This planting gave a density of 51,282 plants/ha. Irrigation was provided through drip-tape under the plastic when the soil water potential at a 25 cm depth fell below −10 kPa. The plants received a total of 117 kg/ha of N, 24 kg/ha of P, 165 kg/ha of K, 7 kg/ha of Ca and 13 kg/ha of Mg through the irrigation each year.
2.3. Climatic and Soil Conditions
Nambour has a subtropical climate, with cool, dry winters and warm, wet summers. The average maximum and minimum temperatures in July are 21.6 °C and 10.6 °C, while the average maximum and minimum temperatures in December are 29.1 °C and 19.5 °C. Total annual rainfall is 1627 mm, and average solar radiation is 17.8 MJ/day. The soil at the experimental site was a well-drained sandy clay loam.
2.4. Data Collection
Mature fruit were harvested weekly to assess marketable yield, the number of fruit per plant and fruit weight from 21 June to 6 September in 2023 (12 harvests) and from 3 July to 18 September in 2024 (12 harvests). Fruit were harvested from 20 plants/plot, with six plots/treatment (120 plants/treatment). Marketable fruit were at least 12 g fresh weight and were not affected by rain or gray mould (Botrytis cinerea) or were misshapen or had other defects. The non-marketable fruit were harvested and discarded. Daily maximum and minimum temperatures, monthly rainfall and daily solar radiation data were collected at the site from the Bureau of Meteorology (www.bom.gov.au), accessed on 30 October 2024. Average values for temperature and radiation for each month are presented along with total values for rainfall. These data were compared with long-term values for the area.
2.5. Statistical Analyses
Data on yield, the number of fruit per plant and mean average seasonal fruit weight were analyzed by two-way analysis of variance (ANOVA, two years × six cultivars × six blocks) using GenStat (Version 24; VSN International, Hemel Hempstead, UK). Treatment means were separated by calculating least significant differences (LSDs) from the ANOVAs. The relationships between yield, the number of fruit per plant and average fruit weight were analyzed by regression and fitted using the graphical software program SigmaPlot (Version 15; Systat, Chicago, IL, USA). The seasonal changes in cumulative yields were fitted to linear or dose-logistic regressions.
3. Results
3.1. Weather
In the first year, the average daily maximum and minimum temperatures from April to September were 24.3 °C and 12.8 °C (Table 1). Average solar radiation was 15.1 MJ/m2/day, and total rainfall was 332 mm. In the second year, the average maximum and minimum temperatures were 24.1 °C and 13.4 °C (Table 1). Average radiation was 15.2 MJ/m2/day, and rainfall was 478 mm. Temperature and light conditions were similar in the two seasons, whereas it was drier in 2023 than in 2024. During the experiments, the average daily minimum temperature was 3 °C higher than the long-term average for the area from 1965 to 1990, while the average daily maximum temperature was 1 °C higher (Table 1). Radiation levels were similar to long-term values, while it was slightly drier in 2023 and 2024.

Table 1.
Daily temperatures, solar radiation, and total monthly rainfall at Nambour. Long-term average temperatures (1965 to 1990), solar radiation (2004 to 2019) and rainfall (2007 to 2019) are also presented.
3.2. Yield and Fruit Weight
There was no significant interaction between year and cultivar on marketable yield, the number of fruit per plant or on fruit weight (Table 2; p > 0.05). Hence, only the means of the main plots are presented. Average yield across the cultivars was lower in the second year (142 g/plant) than in the first year (330 g/plant) (Table 2; p < 0.001). Average yield across the two years was lower in ‘Sundrench’ and higher in the other cultivars (p = 0.003). Fruit weight was lower in the second year (18.2 g) than in the first year (23.8 g) (p < 0.001), and lower in ‘Festival’ and ‘Fortuna’, intermediate in ‘Brilliance’, ‘Red Rhapsody’ and ‘Sundrench’ and higher in ‘Suzie’ (p < 0.001).
Table 2.
Variations in marketable yield, number of fruit per plant and mean seasonal fruit weight in six strawberry cultivars over two years in Queensland. Data are the means of six replicates per cultivar with standard errors (s.e.). Means in the two groups in a column followed by a common letter are not significantly different by the Fisher’s least significant test at 5% level of significance.
3.3. Relationship Between Yield, and Fruit Number and Fruit Weight
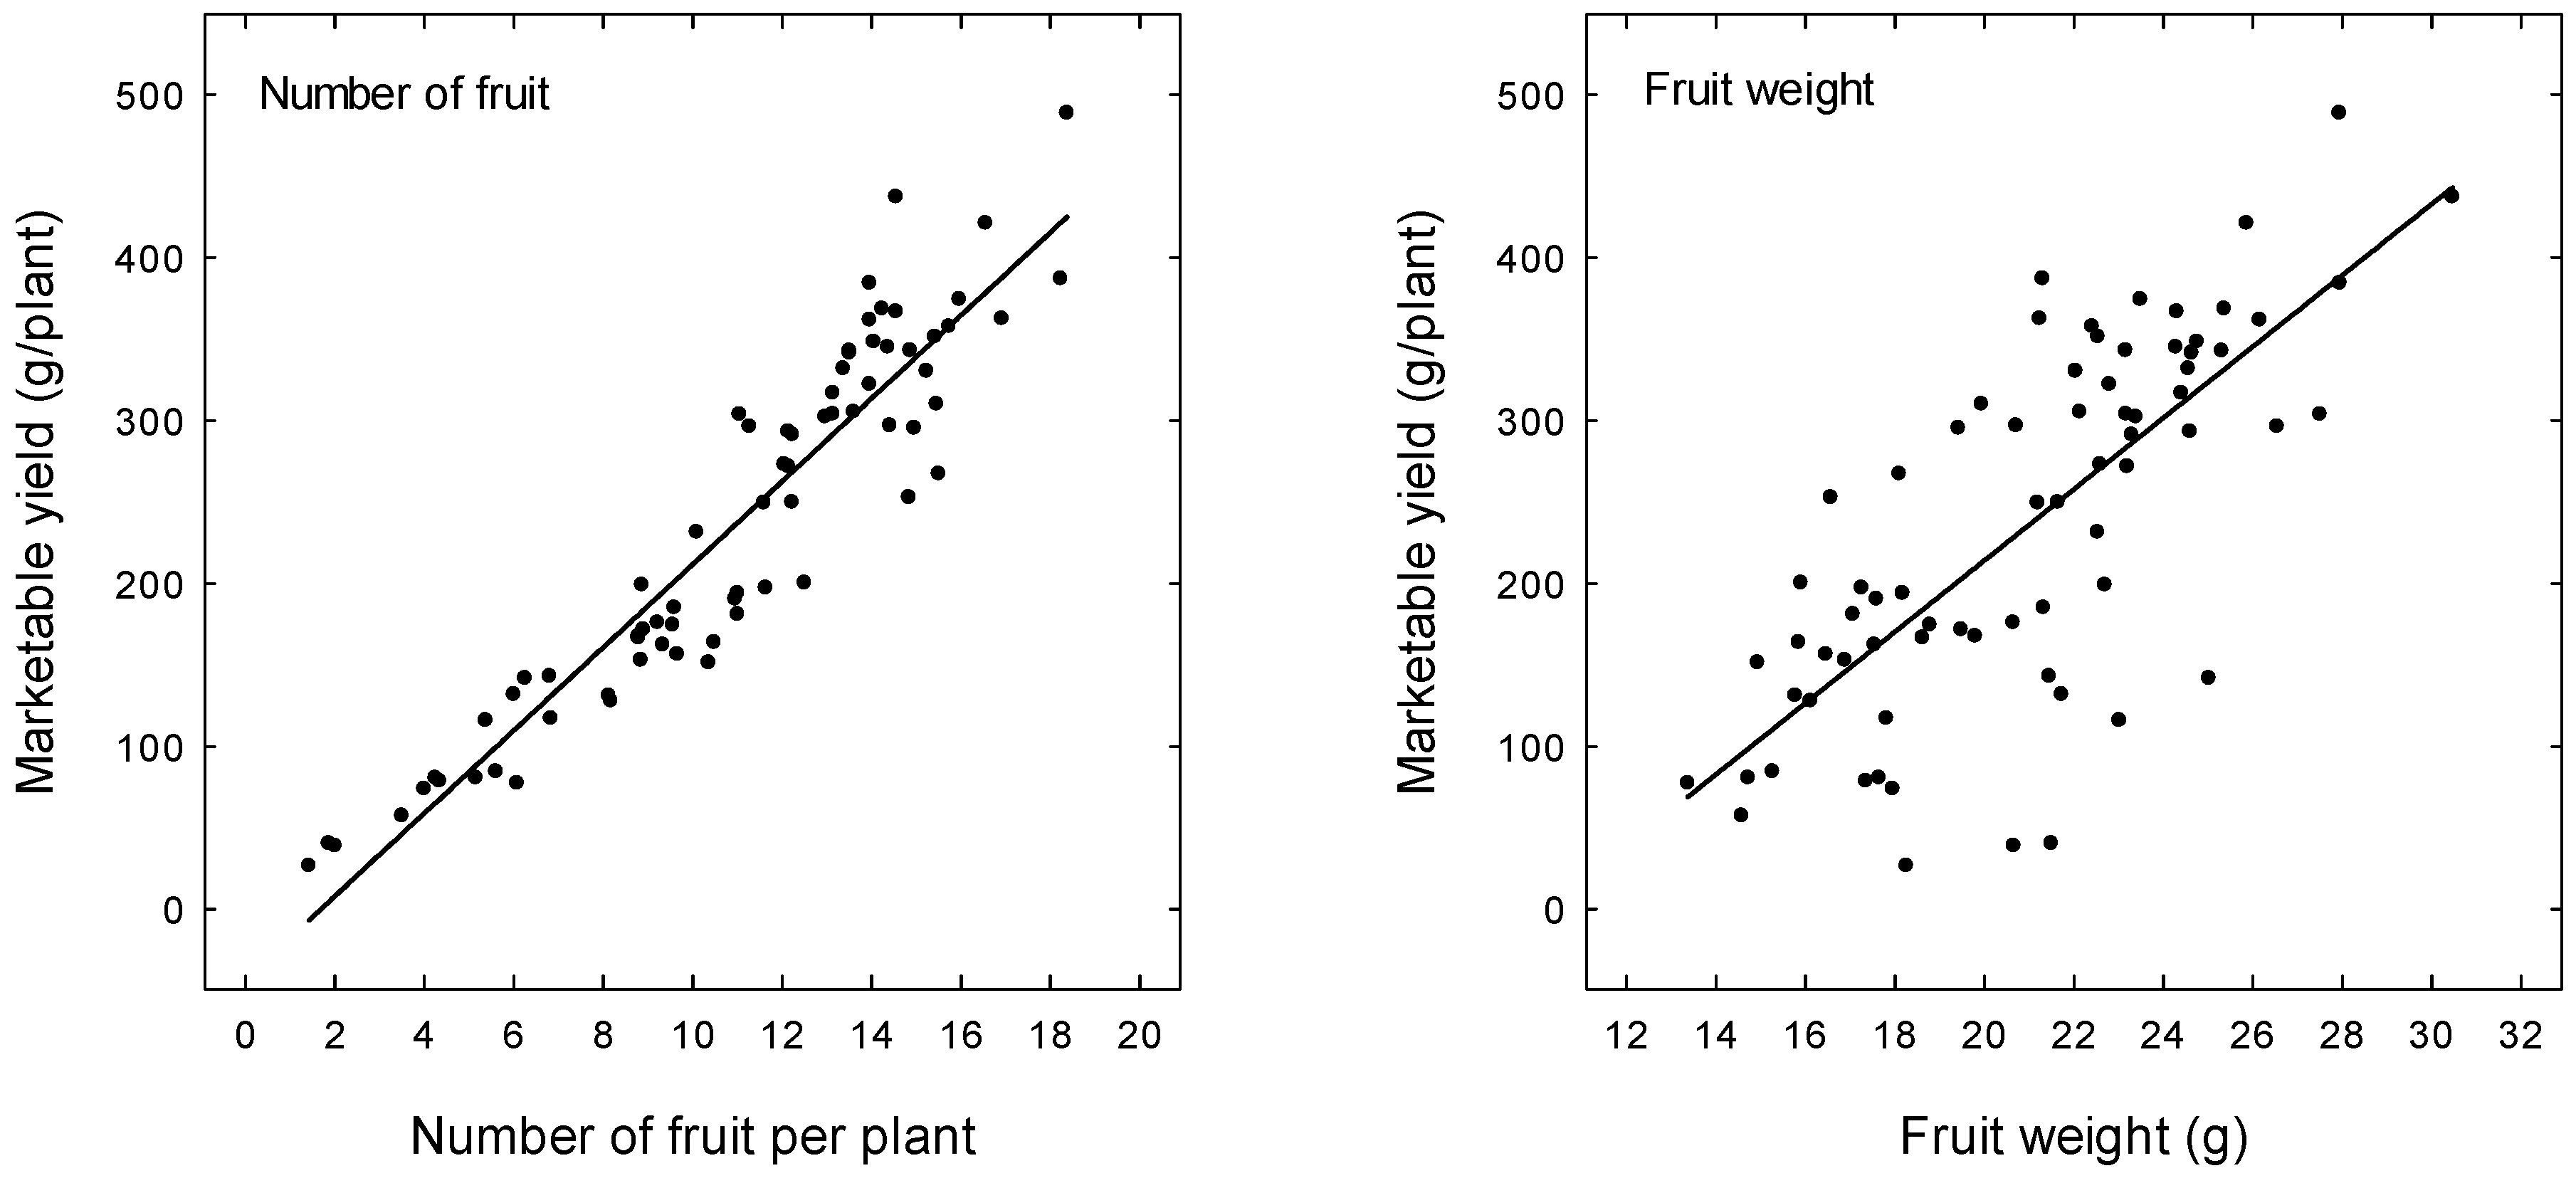
Yield is dependent on both the number of fruit per plant and the size of the fruit. In the present experiments, there were linear relationships between yield and the number of fruit per plant and fruit weight (Figure 1). Yield was more strongly related to the number of fruits per plant (p < 0.001; R2 = 0.88) than to fruit weight (p < 0.001; R2 = 0.54) across the six cultivars and two years (Figure 1).
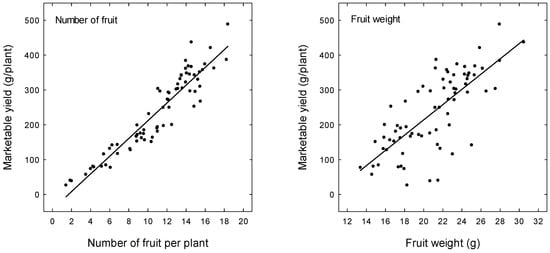
Figure 1.
Relationships between marketable yield and the number of fruit per plant and fruit weight in six strawberry cultivars over two years in Queensland. Yield (g/plant) = Intercept + 25.5 × Number of fruit per plant (p < 0.001, R2 = 0.88, n = 72). Yield (g/plant) = Intercept + 21.9 × Fruit weight (g) (p < 0.001, R2 = 0.54, n = 72).
3.4. Seasonal Changes in Yield
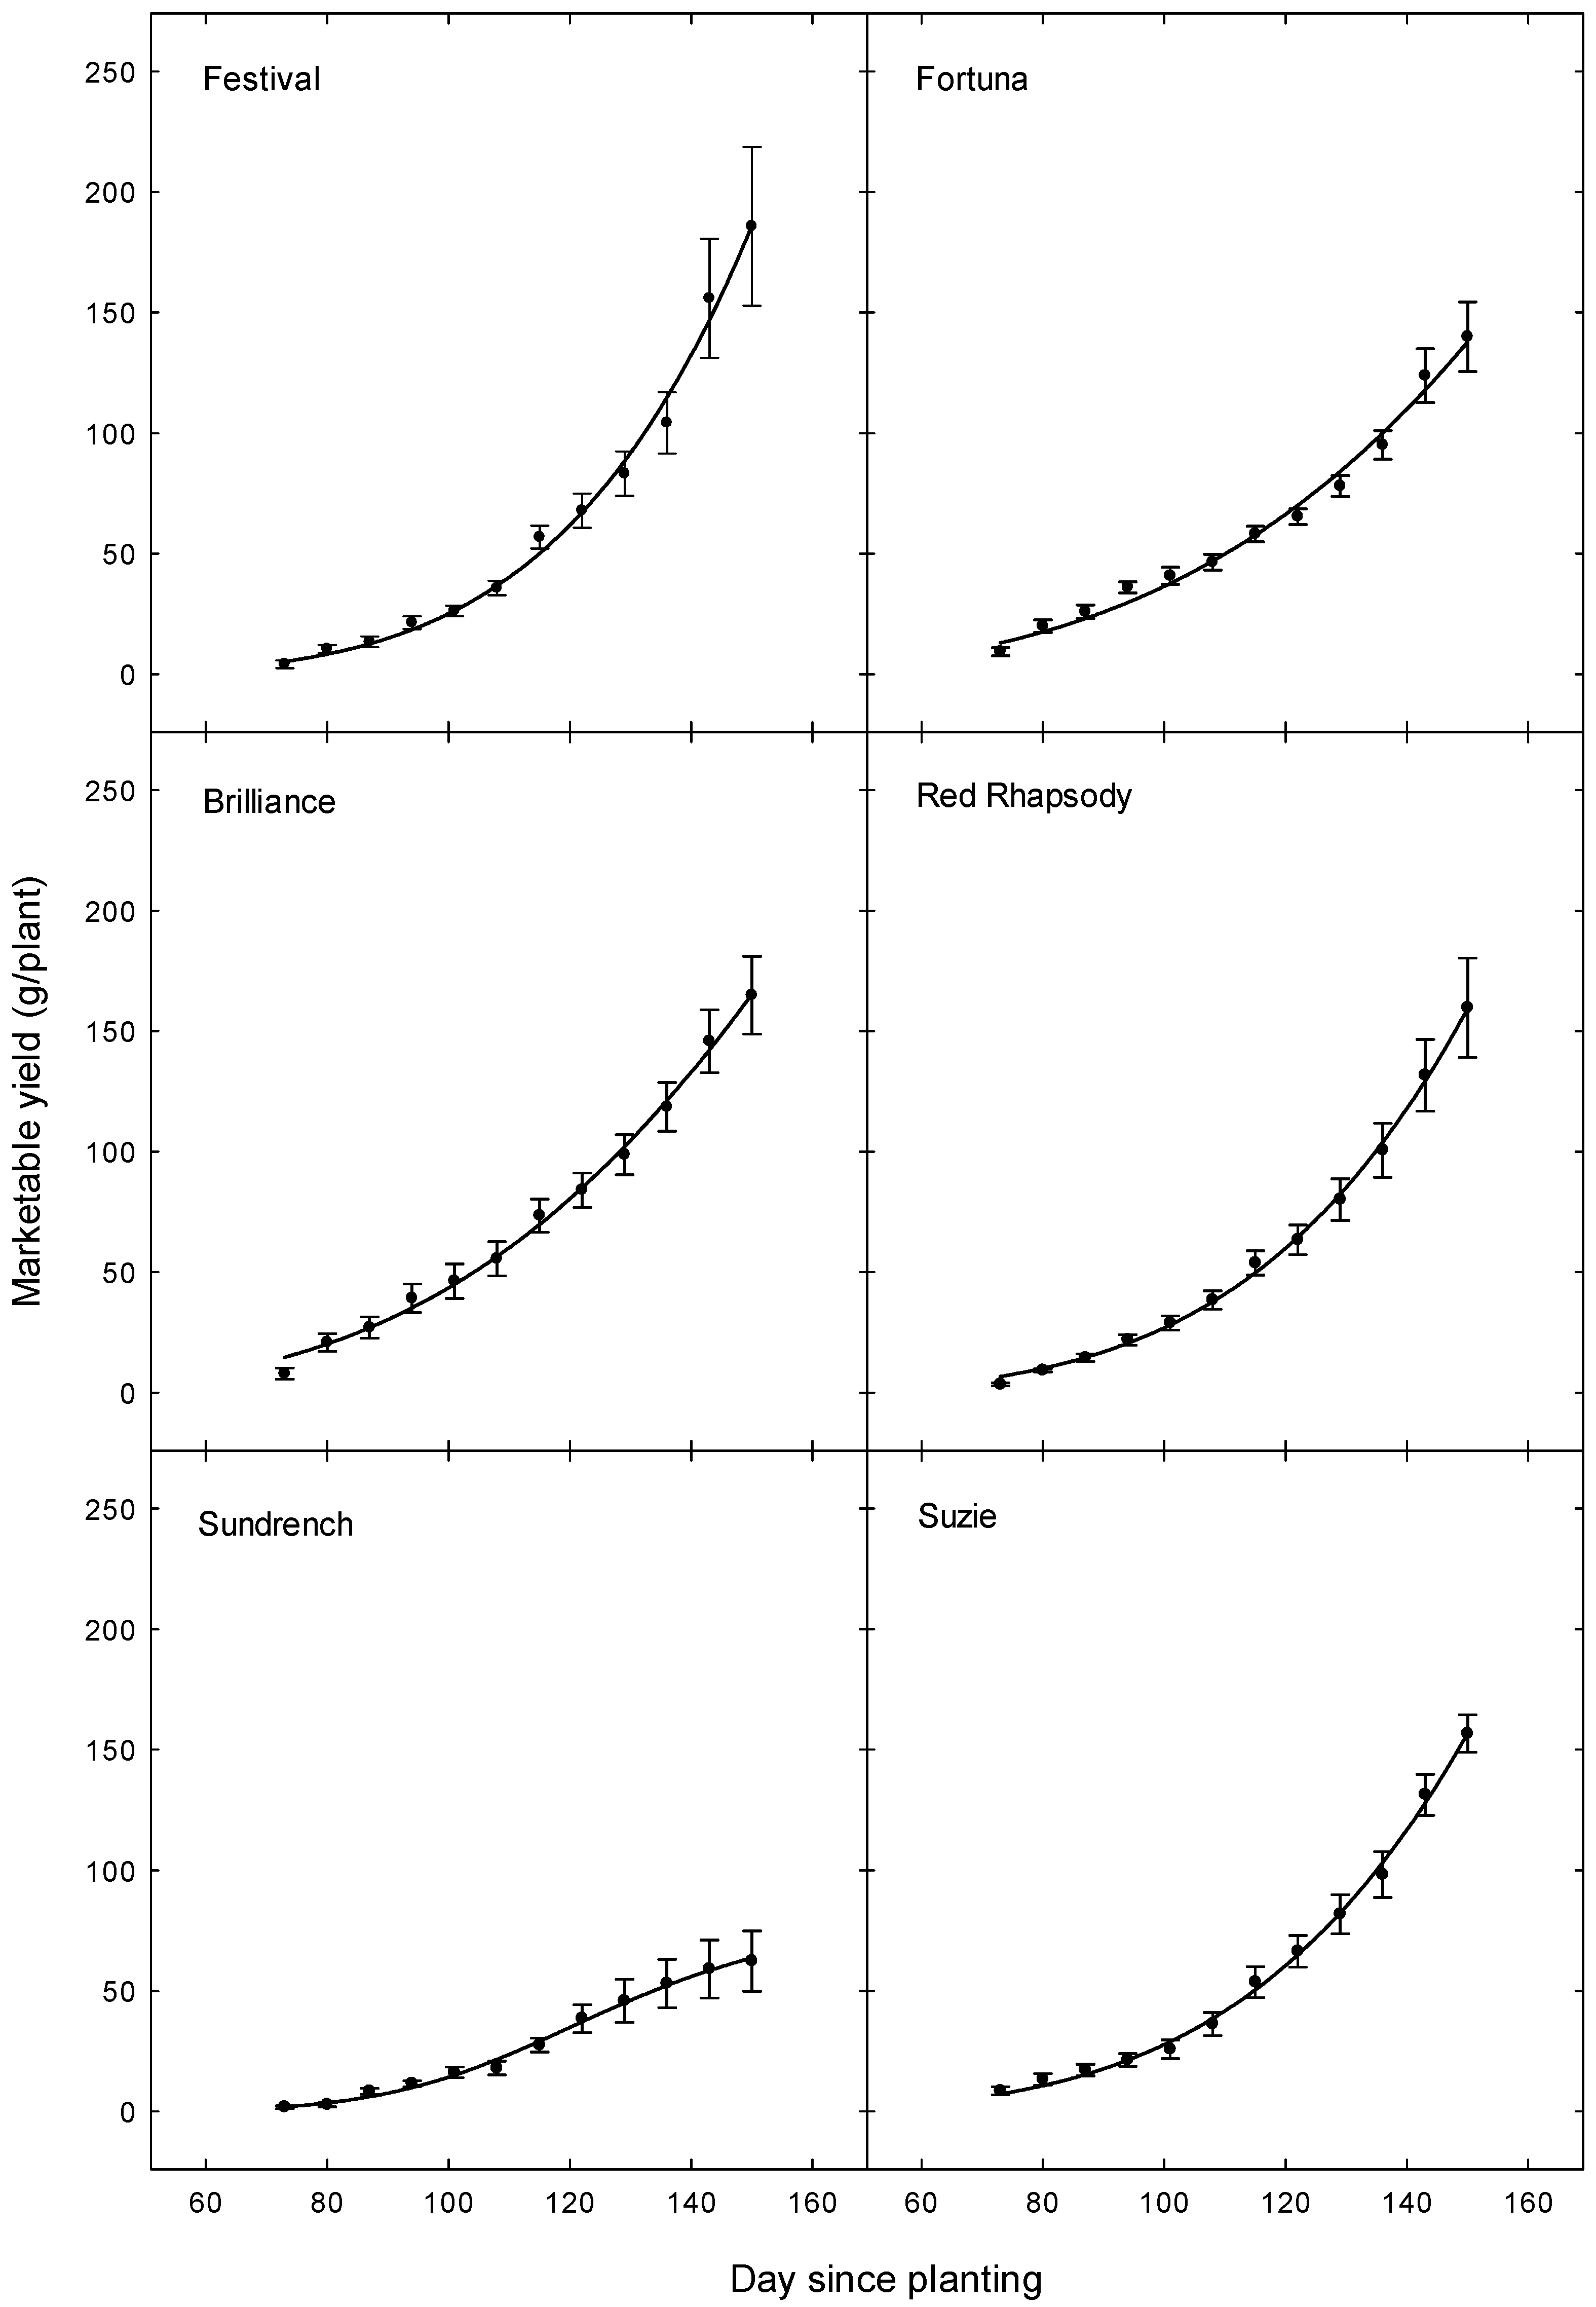
Fruit production is related to flower initiation in strawberry. Changes in cumulative yields over the season followed linear or dose-logistic models, with no fruit produced in the first 70 to 90 days after planting (p < 0.001; R2 = 0.98 to 0.99) (Figure 2 and Figure 3). These results suggest that the transplants did not initiate flowers in the nursery or soon after planting.
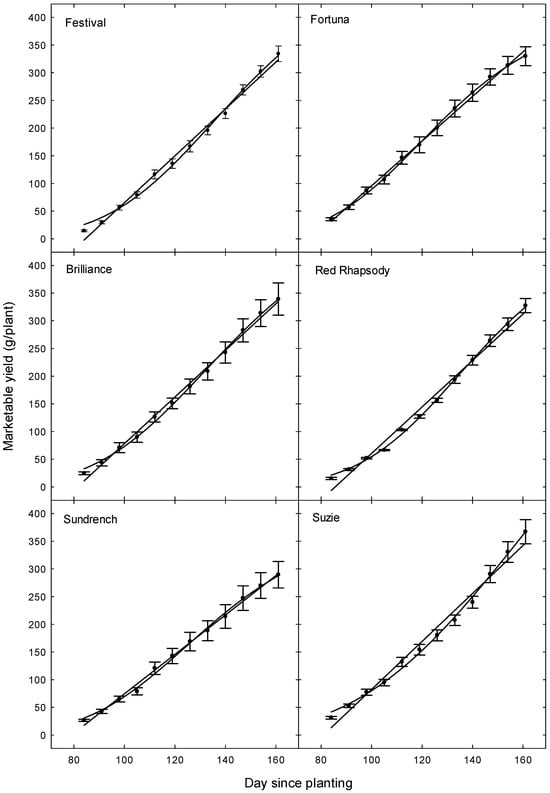
Figure 2.
Seasonal changes in cumulative marketable yield in six strawberry cultivars in Queensland in 2023. Data are the means of six replicates per cultivar with standard errors (s.e.). The changes in yield followed linear or dose-logistic regressions, which are both presented (p < 0.001, R2s = 0.98 to 0.99, n = 12).
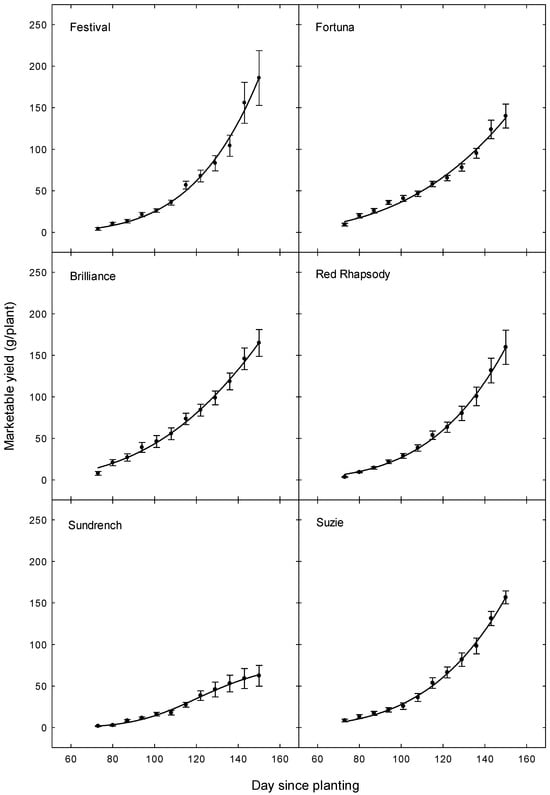
Figure 3.
Seasonal changes in cumulative marketable yield in six strawberry cultivars in Queensland in 2024. Data are the means of six replicates per cultivar with standard errors (s.e.). The changes in yield followed dose-logistic regressions (p < 0.001, R2s = 0.98 to 0.99, n = 12).
4. Discussion
The performance of the strawberry plants in Queensland was influenced by the cultivar and the year. One cultivar (‘Sundrench’) had lower marketable yields than the other cultivars. Overall, ‘Suzie’ had the largest fruit. These results suggest that ‘Sundrench’ is not commercially viable in Queensland. Lower yields in the second year were associated with a later planting and possibly a higher incidence of rain damage and fruit rots under higher rainfall. Temperatures were above the long-term averages for the area, and this possibly affected productivity.
The yields of the plants varied with the cultivar. ‘Sundrench’ had lower yields than the other cultivars across the two years (Table 2). Yield in strawberry depends on the cultivar, time of planting and the environment (especially temperature). Researchers in Florida collected data on the yield of three cultivars using different irrigation strategies [21]. Florida has a climate similar with that of southeast Queensland and produces berries over winter and spring. The workers in Florida reported that mean marketable yield (± s.e.) was 484 ± 23 g/plant in the first year and 567 ± 10 g/plant in the second year [17]. The nursery plants were planted on 18 October, which is equivalent to 18 April in the southern hemisphere.
The yields of the plants were only half in the second year (planted on 22 April) compared with the first year (planted on 30 March) (Table 2). This response was consistent across the six cultivars. Previous research showed that time of planting affected the productivity of strawberry in Queensland and Florida [22,23,24,25,26,27]. In some studies, yields were higher with intermediate plantings, with lower yields with early or late plantings. In others, yields decreased as planting was delayed, or there was no clear response. Low yields with late plantings are associated with a short production season in the fruiting fields [22]. The supply of transplants in Queensland varies each season with the weather and operational issues in the commercial nurseries. The optimum time of planting for most cultivars is from mid-March to early April, but sometimes plants are not supplied until after this window.
Lower yields in the second year compared with the first year were also associated with higher rainfall (478 mm versus 332 from April to September). Higher rainfall in the second year may have also contributed to a higher incidence of rain damage and fruit rots, as previously demonstrated in Florida [28] and Queensland [29]. Menzel et al. [30] studied the incidence of rain damage and fruit rots in strawberry over three years in Queensland. The number of fruit that were affected by rain or disease or both was recorded. Fruit that were affected by rain and disease were rated as diseased and were non-marketable. The main disease affecting the crop in 2012 was gray mould, with less than 1% incidence of stem-end rot. The incidence of stem-end rot in the water-treated controls was 11.3 ± 0.4% in 2013 and 5.6 ± 1.4% in 2014. The incidence of gray mold was 38.0 ± 0.5% in 2012, 18.8 ± 1.6% in 2013, and 19.2 ± 1.8% in 2014. The incidence of disease increased after heavy rain or over-head irrigation. There were strong negative relationships between marketable yield and the incidence of unmarketable fruit (rain and disease) over the three years (R2s = 0.82 to 0.93). The contribution of rain damage and fruit rots to low yields in some cultivars needs to be explored in future studies in Queensland.
Strawberry plants develop new crowns, roots, leaves, inflorescences and stolons over the growing season, depending on the weather (especially temperature and photoperiod) [31]. The shoot apical meristem and the axillary meristems at the base of each leaf initiate new growth [32]. When the terminal meristem produces an inflorescence, the uppermost axillary meristem of the rosette produces an inflorescence-bearing branch crown. Other axillary meristems produce more branch crowns or stolons or remain dormant, depending on the environment. This pattern of growth results in cycles of flowering and fruiting and increases in plant weight as the season progresses [33,34]. In the current study, increases in yield followed linear or dose-logistic models, with no fruit produced in the first 70 to 90 days after planting (Figure 2 and Figure 3). These results suggest that the transplants did not initiate flowers in the nursery or soon after planting. The harvests ended in September when average prices in Queensland are below the costs of production.
The pattern of cropping in strawberry varies with the cultivar and growing environment. Diel and colleagues [35,36,37] demonstrated that there were strong logistic relationships between accumulated yield and the accumulation of heat units over the season in several cultivars in Brazil. Pinochet and Agehara [38] showed that early and mid-season fruit production in three cultivars (‘Florida Radiance’, ‘Florida Brilliance’ and ‘Florida Beauty’) in Florida followed a Gaussian distribution. This model had a symmetrical bell-shaped curve, with the goodness of fit very high in the study (R2s = 0.93 to 0.96).
No information was collected on plant growth in the current work. Several studies have reported on the relationship between fruit production and growth in Queensland and elsewhere [39,40,41]. Typically, heavy flowering and fruit set or high yields reflected leaf initiation or leaf area expansion. Menzel and Smith [40] studied the performance of ‘Festival’ over five years at Nambour. There were strong relationships between the growth of the flowers and immature fruit and leaf expansion across the growing season (R2 = 0.81) and across the five different years (R2 = 0.86). These results indicated that potential productivity was strongly linked to the expansion of the leaves in this environment. Menzel [41] investigated the growth of seven cultivars and breeding lines planted from March to May from 2004 to 2016 in Queensland. Information was collected on the number of fully expanded leaves and dry weight of the flowers and fruit (n = 23). Potential yield, as indicated by the dry weight of the flowers and immature fruit/plant, increased up to 40 to 45 leaves/plant (R2 = 0.49 or 0.50), suggesting that the cultivars did not have excessive leaf production. The results of this study suggested that the development of new cultivars with more leaves/plant might increase cropping of strawberries growing in the subtropics.
The size of the fruit has a strong effect on the profitability of growing strawberries. Cultivars with large fruit have a high proportion of marketable or First-Class fruit and higher returns than cultivars with small fruit. In the current study, fruit weight ranged across the six cultivars and the two seasons. ‘Festival’ and ‘Fortuna’ had small fruit and ‘Suzie’ had large fruit, and the fruit were larger in the first year than in the second year. Fruit weight was not analyzed across the different harvests. Previous research in this area has demonstrated that fruit weight decreases as the season progresses and the weather warms up [42,43].
Climate change will affect strawberry production in many areas around the globe, with lower yields, smaller fruit and lower concentrations of sugars in the fruit [44,45,46,47,48,49]. In the current study in Queensland, the average daily minimum temperature was 3 °C higher than the long-term average for the area, while the average daily maximum temperature was 1 °C higher (Table 1). Menzel [17] indicated that there was a negative linear relationship between yield and temperature in strawberry in the published literature. The mean (± s.d. or standard deviation) estimate of the slope from the regression was −0.14 (± 0.14), the median was −0.11, and the range was from −0.51 to 0.11 (n = 14 studies). Increases in temperature are associated with a decrease in yield of 28% in subtropical Queensland from 1967 to 2021. Yields and quality are expected to decline in the future under global warming, in the absence of better-adapted cultivars. Other possible solutions to global warming include earlier times of planting, higher plant densities, shading and the use of protected cropping.
5. Conclusions
The marketable yield and fruit weight of strawberry plants growing in subtropical Queensland varied with the cultivar and year. ‘Sundrench’ had lower yields than the other cultivars, while ‘Suzie’ had the largest fruit. The low productivity of ‘Sundrench’ suggests that this cultivar is not commercially viable in Queensland. Lower yields in the second year were associated with a later planting. Higher rainfall in the second year may have also contributed to a higher incidence of rain damage and fruit rots. The average daily minimum temperature was 3 °C higher than the long-term average, while the average daily maximum temperature was 1 °C higher. Yields are expected to decline in the future under global warming, in the absence of better-adapted cultivars and other mitigating strategies. Further evaluations of cultivars in Queensland are required under different growing practices, including earlier times of planting, higher plant densities, light shade and protected cropping.
Funding
The Queensland Government funded the research through the Department of Primary Industries. The research received funds from the Florida Strawberry Research and Education Foundation (FSREF) to support the project “Sustainable strawberry production in Queensland and Florida under a warming climate” (HF12638).
Data Availability Statement
The original contributions presented in the study are included in the article. Further inquiries can be directed to the author.
Acknowledgments
Many thanks to the farm staff at Nambour for help with growing the strawberry plants. Thanks also to Jodi Hufer, Gary Hopewell, Vicki Lane, Penny Measham and David Innes (DPI), and to Tiffany Dale and Kenneth Parker (Florida Strawberry Growers’ Association).
Conflicts of Interest
The author declares no conflicts of interest.
References
- Symington, H.A.; Glover, B.J. Strawberry varieties differ in pollinator-relevant floral traits. Ecol. Evol. 2024, 14, e10914. [Google Scholar] [CrossRef] [PubMed]
- FAOSTAT. Available online: https://www.fao.org/faostat/en/#home (accessed on 30 October 2024).
- Hernández-Martínez, N.R.; Blanchard, C.; Wells, D.; Salazar-Gutiérrez, M.R. Current state and future perspectives of commercial strawberry production: A review. Sci. Hortic. 2023, 312, 111893. [Google Scholar] [CrossRef]
- Amyotte, B.; Samtani, J. New direction for strawberry research in the 2020s. Int. J. Fruit Sci. 2023, 23, 278–291. [Google Scholar] [CrossRef]
- Holmes, G.J. The California strawberry industry: Current trends and future prospects. Int. J. Fruit Sci. 2024, 24, 115–129. [Google Scholar] [CrossRef]
- Zheng, C.; Abd-Elrahman, A.; Whitaker, V.M.; Wang, X.; Dalid, C.; Shen, K. Strawberry canopy structural parameters estimation and growth analysis from UAV multispectral imagery using a geospatial tool. Comput. Electron. Agric. 2024, 226, 109440. [Google Scholar] [CrossRef]
- Sharif, I.M.; Mohammud, C.H.; Kahar, S.A. Smart environmental control system for production of strawberry in lowland tropics. Acta Hortic. 2006, 710, 457–464. [Google Scholar] [CrossRef]
- Bustomi, M.A.; Indarto, B.; Fatimah, I.; Suyatno, S.; Sudarsono, S.; Pramono, Y.H. Smart greenhouse design for strawberry cultivation in Pandanrejo, Batu City. J. Sos. Hum. 2023, 16, 152–163. [Google Scholar] [CrossRef]
- Cockerton, H.M.; Karlström, A.; Johnson, A.W.; Li, B.; Stavridou, E.; Hopson, K.J.; Whitehouse, A.B.; Harrison, R.J. Genomic informed breeding strategies for strawberry yield and fruit quality traits. Front. Plant Sci. 2021, 12, 724847. [Google Scholar] [CrossRef]
- Fan, Z.; Verma, S.; Lee, H.; Jang, Y.J.; Wang, Y.; Lee, S.; Whitaker, V.M. Strawberry soluble solids QTL with inverse effects on yield. Hortic. Res. 2024, 11, uhad271. [Google Scholar] [CrossRef]
- Feldmann, M.J.; Pincot, D.D.A.; Cole, G.S.; Knapp, S.J. Genetic gains underpinning a little-known strawberry Green Revolution. Nat. Commun. 2024, 15, 2468. [Google Scholar] [CrossRef]
- Verteramo Chiu, L.J.; Nicholson, C.F.; Gómez, M.I.; Mattson, N.S. A meta-analysis of yields and environmental performance of controlled-environment production systems for tomatoes, lettuce and strawberries. J. Clean. Prod. 2024, 469, 143142. [Google Scholar] [CrossRef]
- Hodgdon, E.A.; Conner, D.S.; McDermott, L.G.; Pritts, M.P.; Handley, D.T.; Orde, K.M.; Grube Sideman, R. A current view on strawberry production practices and trends in the Northeastern United States and Canada. HortTechnology 2024, 34, 574–584. [Google Scholar] [CrossRef]
- Garcia, K.; Olimpi, E.M.; M’Gonigle, L.; Karp, D.S.; Wilson-Rankin, E.E.; Kremen, C.; Gonthier, D.J. Semi-natural habitats on organic strawberry farms and in surrounding landscapes promote bird biodiversity and pest control potential. Agric. Ecosyst. Environ. 2023, 347, 108353. [Google Scholar] [CrossRef]
- Menzel, C.M. Effect of global warming on the yields of strawberry in Queensland: A mini-review. Horticulturae 2023, 9, 142. [Google Scholar] [CrossRef]
- Gomez, A.O.; De Faveri, J.; Neal, J.M.; Aitken, E.A.B.; Herrington, M.E. Response of strawberry cultivars inoculated with Macrophomina phaseolina in Australia. Int. J. Fruit Sci. 2020, 20 (Suppl. S2), 164–177. [Google Scholar] [CrossRef]
- Menzel, C.M. Inconsistent quality under global warming dampens strawberry performance in SEQ. Aust. Berry J. 2023, 14, 70–72. [Google Scholar]
- Herrington, M.E.; Chandler, C.K.; Moisander, J.A.; Reid, C.E. ‘Rubygem’ strawberry. HortScience 2007, 42, 1482–1483. [Google Scholar] [CrossRef]
- Herrington, M.; Neal, J.; Woolcock, L.; Paynter, M.; Gomez, A.; De Faveri, J. ‘Red Rhapsody’ strawberry. HortScience 2019, 54, 1641–1643. [Google Scholar] [CrossRef]
- Menzel, C.M. A review of productivity in strawberries: Marketable yield has a linear, but inconsistent relationship with total yield, and cannot be readily predicted from data on total yield. J. Hortic. Sci. Biotechnol. 2021, 96, 135–144. [Google Scholar] [CrossRef]
- Lone, J.M.; Agehara, S.; Abd-Elrahman, A. Intermittent sprinkler irrigation during the establishment of strawberry (Fragaria × ananassa Duch.) bare-root transplants conserves water without loss of yield and fruit quality. Agric. Water Manag. 2024, 306, 109169. [Google Scholar] [CrossRef]
- Menzel, C.M.; Smith, L. Effect of time of planting, plant size and nursery-growing environment on the performance of ‘Festival’ strawberries in a subtropical environment. HortTechnology 2011, 21, 56–66. [Google Scholar] [CrossRef]
- Menzel, C.M.; Smith, L. Effect of time of planting and plant size on the performance of ‘Festival’ and ‘Florida Fortuna’ strawberry plants in a subtropical environment. HortTechnology 2012, 22, 330–337. [Google Scholar] [CrossRef]
- Albregts, E.E.; Howard, C.M. Effect of pre-transplant chilling and planting date on the growth and fruiting response of the ‘Dover’ strawberry. Proc. Florida State Hortic. Soc. 1980, 93, 239–241. [Google Scholar]
- Chandler, C.K.; Albregts, E.E.; Howard, C.M. Planting date affects early season strawberry production in West Central Florida. Proc. Florida State Hortic. Soc. 1991, 104, 227–228. [Google Scholar]
- Albregts, E.E.; Chandler, C.K. Effect of transplant chilling and planting date on fruiting response of 4 strawberry clones. Proc. Florida State Hortic. Soc. 1994, 107, 323–325. [Google Scholar]
- Albregts, E.E.; Chandler, C.K. Planting date and runner tip source affects fruiting response of 3 strawberry cultivars. Proc. Florida State Hortic. Soc. 1995, 108, 351–353. [Google Scholar]
- Xiao, C.L.; Chandler, C.K.; Price, J.F.; Duval, J.R.; Mertely, J.C.; Legard, D.E. Comparison of epidemics of botrytis fruit rot and powdery mildew of strawberry in large plastic tunnel and field production systems. Plant Dis. 2001, 85, 901–909. [Google Scholar] [CrossRef]
- Menzel, C.M.; Smith, L.A.; Moisander, J.A. The productivity of strawberry plants growing under high plastic tunnels in a wet subtropical environment. HortTechnology 2014, 24, 334–342. [Google Scholar] [CrossRef]
- Menzel, C.M.; Gomez, A.O.; Smith, L.A. Control of grey mould and stem-end rot in strawberry plants growing in a subtropical environment. Australas. Plant Pathol. 2016, 45, 489–498. [Google Scholar] [CrossRef]
- Guo, L.; Luo, X.; Li, M.; Joldersma, D.; Plunkert, M.; Liu, Z. Mechanism of fertilization-induced auxin synthesis in the endosperm for seed and fruit development. Nat. Commun. 2022, 13, 3985. [Google Scholar] [CrossRef]
- Osnato, M.; Cota, I.; Nebhnani, P.; Cereijo, U.; Pelaz, S. Photoperiod control of plant growth: Flowering time genes beyond flowering. Front. Plant Sci. 2022, 12, 805635. [Google Scholar] [CrossRef] [PubMed]
- MacKenzie, S.J.; Chandler, C.K. A method to predict weekly strawberry fruit yields from extended season production systems. Agron. J. 2009, 101, 278–287. [Google Scholar] [CrossRef]
- Deschamps, S.S.; Agehara, S. Metalized-striped plastic mulch reduces root-zone temperatures during establishment and increases early-season yields of annual winter strawberry. HortScience 2019, 54, 110–116. [Google Scholar] [CrossRef]
- Diel, M.I.; Sari, B.G.; Krysczun, D.K.; Olivoto, T.; Pinheiro, M.V.M.; Meira, D.; Schmidt, D.; Lúcio, A.D. Nonlinear regression for description of strawberry (Fragaria x ananassa) production. J. Hortic. Sci. Biotechnol. 2018, 94, 259–273. [Google Scholar] [CrossRef]
- Diel, M.I.; Lúcio, A.D.; Schmidt, D.; de Lima Tartaglia, F.; Tischler, A.L.; Lambrecht, D.M. Using nonlinear models to define production, production rate, and precocity of strawberry cultivars. Rev. Ceres 2022, 69, 55–61. [Google Scholar] [CrossRef]
- Diel, M.I.; Lúcio, A.D.C.; Bisognin, D.A.; de Araujo Lopes, G.; dos Santos, V.J. Nonlinear logistic model for describing strawberry fruit production. Agronomy 2024, 14, 1884. [Google Scholar] [CrossRef]
- Pinochet, D.; Agehara, S. Early-season yield fluctuations of strawberry (Fragaria × ananassa Duch.) follow a bimodal Gaussian model. Sci. Hortic. 2024, 336, 113440. [Google Scholar] [CrossRef]
- Menzel, C.M. A review of productivity in strawberry: Do the plants need larger canopies, more flowers, or higher CO2 assimilation for higher yields? J. Hortic. Sci. Biotechnol. 2022, 97, 674–696. [Google Scholar] [CrossRef]
- Menzel, C.M.; Smith, L. The growth and productivity of ‘Festival’ strawberry plants growing in a subtropical environment. New Zealand J. Crop Hortic. Sci. 2014, 42, 60–75. [Google Scholar] [CrossRef]
- Menzel, C.M. No evidence of excessive leaf production by strawberries grown in the subtropics. Agriculture 2019, 9, 197. [Google Scholar] [CrossRef]
- Menzel, C.M. Temperature has a greater effect on fruit growth than defoliation or fruit thinning in strawberries in the subtropics. Agriculture 2019, 9, 127. [Google Scholar] [CrossRef]
- Menzel, C.M. Higher temperatures decrease fruit size in strawberry growing in the subtropics. Horticulturae 2021, 7, 34. [Google Scholar] [CrossRef]
- Cordeiro, G.D.; Dötterl, S. Global warming impairs the olfactory floral signaling in strawberry. BMC Plant Biol. 2023, 23, 549. [Google Scholar] [CrossRef]
- Rodríguez-Aguirre, E.; Badillo-Márquez, A.E.; Aguilar-Lasserre, A.A.; Flores-Asis, R. An agent-based model to evaluate agricultural vulnerability and risk facing climate change in strawberry production. Crop Sci. 2025, 65, e21100. [Google Scholar] [CrossRef]
- Unnikrishnan, P.; Ponnambalam, K.; Karray, F. Influence of regional temperature anomalies on strawberry yield: A study using multivariate Copula Analysis. Sustainability 2024, 16, 3523. [Google Scholar] [CrossRef]
- da Silva, L.R.; Araújo, F.H.V.; Ferreira, S.R.; dos Santos, J.C.B.; de Abreu, C.M.; Siqueira da Silva, R.; Regina da Costa, M. Strawberries in a warming world: Examining the ecological niche of Fragaria × ananassa Duch. – Across different climate scenarios. J. Berry Res. 2024, 14, 193–208. [Google Scholar] [CrossRef]
- Ramos, G.; Goldman, P.; Sharrett, J.; Sacher, G.O.; Pennerman, K.K.; Dilla-Ermita, C.J.; Jaime, J.H.; Steele, M.E.; Hewavitharana, S.S.; Holmes, G.J.; et al. Geospatial analysis of California strawberry fields reveals regional differences in crop rotation patterns and the potential for lengthened rotations at current levels of production. Front. Sustain. Food Syst. 2024, 8, 1341782. [Google Scholar] [CrossRef]
- Zeneli, F.; Ventura, V.; Frisio, D.G. Sustainable fresh strawberry consumption: Environmental, genetically modified food, and climate concerns in Europe and North Africa. Front. Sustain. Food Syst. 2024, 8, 1442074. [Google Scholar] [CrossRef]

Disclaimer/Publisher’s Note: The statements, opinions and data contained in all publications are solely those of the individual author(s) and contributor(s) and not of MDPI and/or the editor(s). MDPI and/or the editor(s) disclaim responsibility for any injury to people or property resulting from any ideas, methods, instructions or products referred to in the content. |
© 2025 by the author. Licensee MDPI, Basel, Switzerland. This article is an open access article distributed under the terms and conditions of the Creative Commons Attribution (CC BY) license (https://creativecommons.org/licenses/by/4.0/).