Article

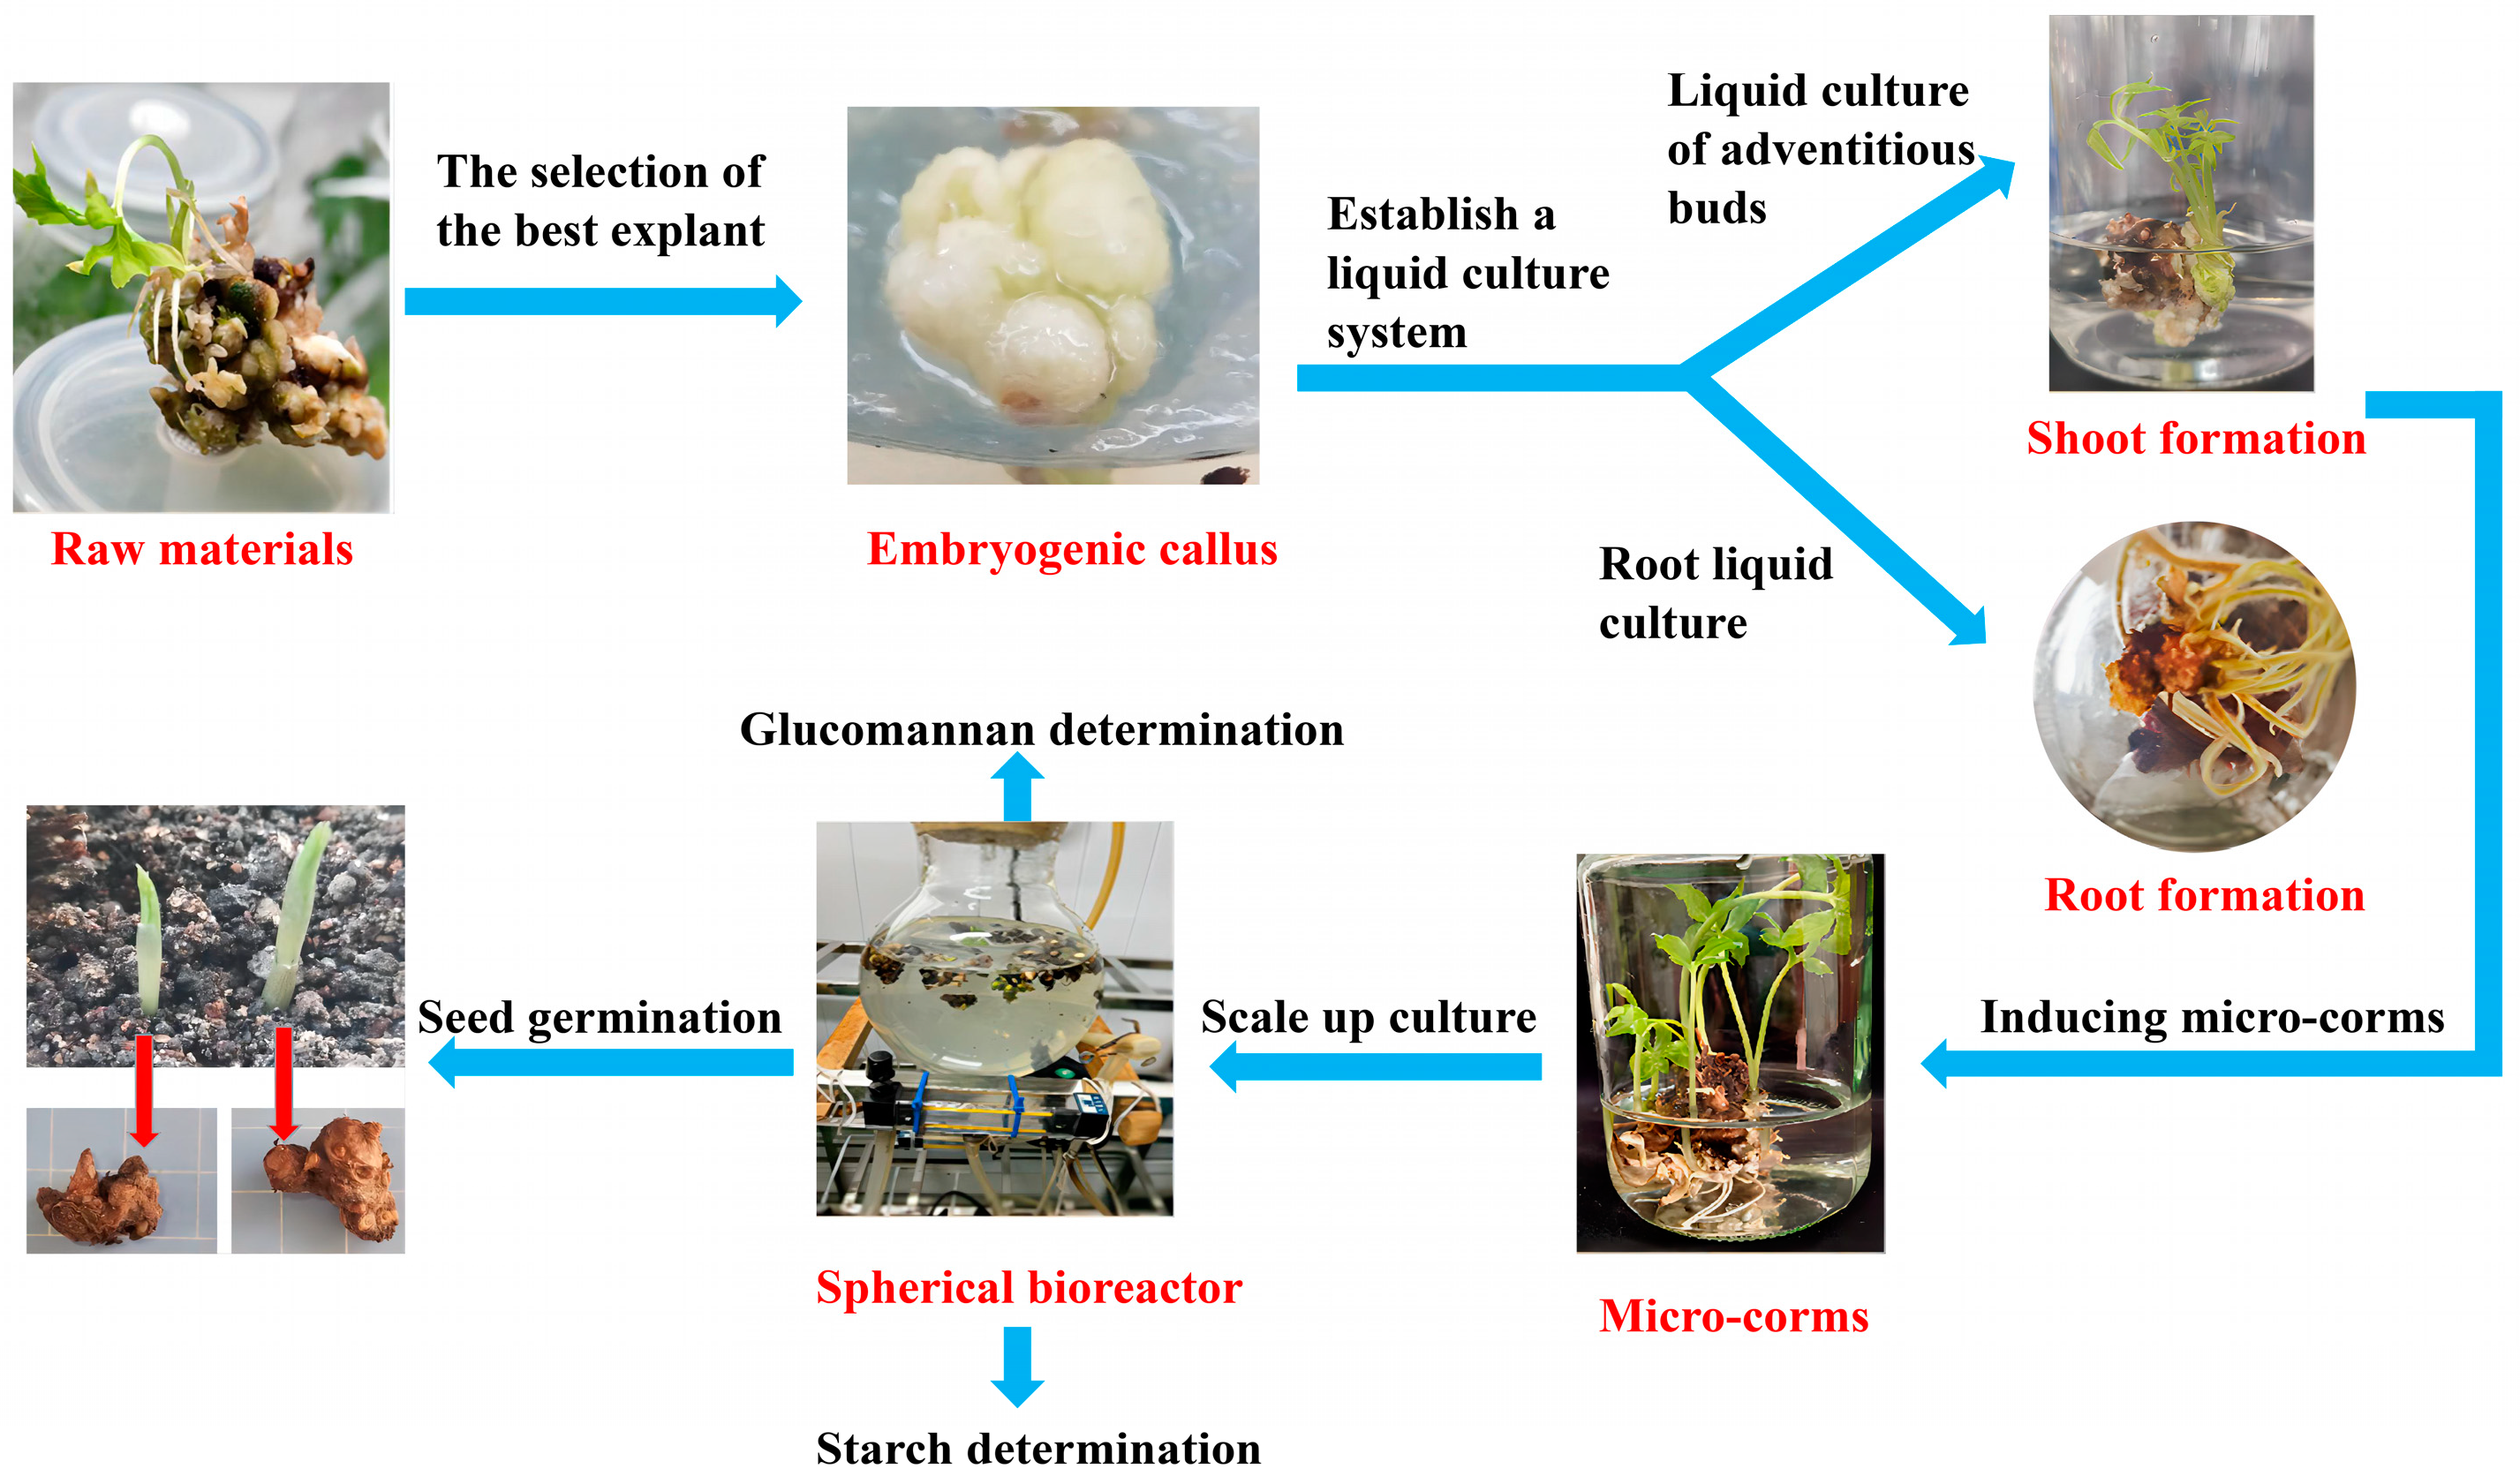
Bioreactor-Based Liquid Culture and Production of Konjac Micro-Corm

1
Laboratory of Pharmaceutical Plant Cell Culture Research, School of Biological Engineering, Dalian Polytechnic University, Dalian 116034, China
2
Guangdong Provincial Key Laboratory of Silviculture Protection and Utilization, Guangdong Academy of Forestry, Guangzhou 510520, China
*
Author to whom correspondence should be addressed.
Horticulturae 2025, 11(3), 235; https://doi.org/10.3390/horticulturae11030235
Submission received: 5 December 2024 / Revised: 3 January 2025 / Accepted: 11 January 2025 / Published: 22 February 2025
(This article belongs to the Special Issue Tissue Culture and Micropropagation Techniques of Horticultural Crops)

Abstract

:
Konjac (Amorphophallus konjac K. Koch) has numerous health benefits, but traditional propagation is hindered by long growth periods and soil-borne diseases. This study developed a novel cell liquid culture system to directly produce micro-corms of konjac for large-scale production. The results demonstrated significant improvements in bud induction and rooting compared to solid culture. Under MS + 1.0 mg/L 6-BA + 0.5 mg/L NAA, the induced buds per culture vessel and final fresh weight were 24.87 ± 0.06 and 6.64 ± 0.12 g, respectively, 1.95 and 1.67 times higher than those in solid culture. Rooting experiments showed that 1/2 MS + 0.5 mg/L IBA + 1.0 mg/L NAA resulted in a root length of 25.23 ± 0.04 cm and 18.12 ± 0.01 roots per vessel. Using a 5 L bioreactor for micro-corm induction led to a 2.51-fold increase in fresh weight (52.67 ± 0.01 g) after 31 days, with glucomannan production reaching 0.48 g/g (fresh weight). The optimized culture system also significantly reduced the propagation time and increased the yield of healthy micro-corms. Bioreactor-based cultivation effectively enhances konjac induction efficiency and shortens breeding time, making it a promising approach for commercial production of konjac micro-corms and potentially improving the economic viability of konjac farming.

1. Introduction

Konjac (Amorphophallus konjac K. Koch), a perennial herbaceous plant of the Araceae family, is widely distributed in Asian countries such as China and Japan [1]. Its underground corms are rich in glucomannan, alkaloids, and polyphenol oxidase, giving it various pharmacological activities such as blood sugar reduction, lipid-lowering, and anti-inflammatory properties. Recently, konjac has been utilized extensively in the food industry, especially as a low-calorie food for weight loss, which has been recognized by the World Health Organization as one of the top ten health products [2,3]. With the continuous expansion of the konjac industry chain, the planting area of konjac has been increasing in recent years. However, konjac is primarily produced by its micro-corms (also named konjac seeds), which are generally sourced from field farming and exhibit typical germplasm degradation characteristics such as virus infection, yield decline, and quality degradation. These propagation methods cannot fulfill the needs of the rapid increase in the cultivation area of konjac [4]. The use of cell engineering technologies is expected to achieve an efficient technology for konjac micro-corm production, which might promote the vigorous development of the whole konjac industry chain.
Compared to traditional cell tissue culture on solid media, the pathway of liquid culture has garnered widespread attention due to its advantages such as minimal material requirements, shorter growth cycles, and higher proliferation rates. It has already been demonstrated that liquid culture technology can efficiently increase the cell density of cowpeas in a short period, emphasizing the role of precise control over culture conditions in improving production efficiency [5]. The most effective combination of plant growth regulators for somatic embryogenesis of oil palm seeds on MS (Murashige and Skoog) medium through liquid culture methods has been identified [6]. In addition, bioreactors can further scale up the cultivation of plant cells or other culture types based on liquid culture, not only promoting plant growth but also increasing the synthesis of plant secondary metabolites, which is beneficial for the mode of industrial production [7,8,9]. However, there is a scarcity of research on liquid culture technology for the propagation of konjac corms. Most studies have focused on solid culture methods or only on the liquid culture of the sprouting process, lacking advancements in large-scale liquid culture for konjac seeds [10,11]. This gap has hindered the development of effective propagation strategies for konjac plantlets. In contrast, our research pioneers liquid culture techniques for konjac micro-corms, aimed at producing high-quality konjac seeds.
The spherical bioreactor was selected for its unique advantages in the large-scale production of konjac micro-corms. Its design ensures uniform mixing and oxygen transfer, which are critical for the efficient growth and development of micro-corms in liquid culture [12]. The bubble-driven circulation mechanism promotes liquid flow and nutrient distribution, reducing the need for mechanical agitation and minimizing shear stress on delicate tissues, which is particularly important for konjac micro-corms [13]. These features collectively make the spherical bioreactor an optimal choice for plant tissue mass propagation, laying a solid foundation for the large-scale commercial production of konjac micro-corms.
The objective of this study is to establish a rapid and effective method for generating konjac micro-corms using a bioreactor-based liquid culture system (Figure 1). It is expected to determine the optimal nutritional and environmental conditions for a konjac liquid culture system, thereby optimizing the cultivation process to yield more konjac micro-corms. In this study, we mainly focused on the induction of adventitious shoots within the liquid culture system, the induction of roots, and the conditions necessary for the growth of micro-corms. By measuring the number and fresh weight of adventitious buds, the number and length of roots, and the number and fresh weight of micro-corms, we can select the most suitable hormone ratios, sucrose concentrations, and photoperiods. The optimal factors identified through this screening process will then be used to establish the cultural conditions. Bioreactors will be employed to induce the proliferation of konjac, aiming to obtain high-yielding konjac plants, and the main storage substances of these plants will be identified. This research could more efficiently provide seeds for the field cultivation of konjac plants, address the issue of seed shortage in traditional planting, and provide technical support for subsequent industrial scale-up cultivation.

2. Materials and Methods

2.1. Plant Materials

Embryogenic callus of A. konjac was induced from petiole explants of tissue-cultured konjac seedlings, following the procedures described in a previous study by Li et al. [10]. The konjac callus was then cultured on MS solid medium, supplemented with 1.2 mg/L 6-BA (6-Benzylaminopurine), 1.2 mg/L NAA (1-Naphthaleneacetic acid), and 1.0 mg/L 2,4-D (2,4-Dichlorophenoxyacetic acid), and containing 30 g/L sucrose and 5 g/L agar at pH 5.8. The cultures were incubated in the dark at 25 °C, and the medium was refreshed every two weeks.

2.2. Liquid Culture for Adventitious Shoot Inductions

Konjac callus that exhibited loose texture without browning was selected for further liquid culture. Approximately 1 g of fresh callus was chopped and transferred to 250 mL Erlenmeyer flasks, each containing 100 mL of liquid culture medium. To achieve optimal phytohormone combination for inducing adventitious shoots in konjac, the MS-based culture medium (pH 6.2) was supplemented with varying concentrations of 6-BA (0.5–3.0 mg/L) and NAA (0.5–1.5 mg/L). The treatment with the lowest concentrations of 6-BA (0.5 mg/L) and NAA (0.5 mg/L) was used as the control group, serving as the baseline for evaluating the effects of increased hormone concentrations. Based on the above-mentioned results, single-factor experiments were conducted with different sucrose concentrations (10–50 g/L) and inoculation amounts (1–6 g). For each experimental group, 60 bottles were used and placed on a shaker set at 25 ± 1 °C, with a light intensity of 2500 Lx, a photoperiod of 12 h/d, and a rotation speed of 70 rpm. Each experiment was repeated three times. After 31 days of liquid culture, the number and rate of adventitious shoot induction were determined and are as follows:
Induction rate = (Number of explants with shoot points)/(Number of total explants) × 100%
The optimal culture media formula (MS + 2.0 mg/L 6-BA + 0.5 mg/L NAA + 30 g/L sucrose; pH 6.2) was used to compare adventitious shoot induction in liquid culture and solid culture (with the addition of 5 g/L agar). Each culture group was inoculated with approximately 2 g of callus. The liquid culture was conducted under the same conditions as previously described. The solid medium cultures were maintained at 25 ± 1 °C, with an illumination intensity of 2500 Lx for 12 h each day. The number of shoots, fresh weight, and relative growth rate (RGR) were determined at 6, 12, 18, 24, and 30 days of culture as follows:
R G R ( g / g ) = ln W 2 ln W 1 t 1
where t represented the culture duration; W1 and W2 indicated the initial and final fresh weight of konjac explants, respectively.

2.3. Liquid Culture for Adventitious Root Formation

The individual konjac bud with callus at the base was then aseptically isolated to serve as the initial experimental material for adventitious root formation. Approximately 3 g of fresh weight of these materials was transferred to 100 mL of MS-based liquid culture medium containing 30 g/L sucrose (pH 6.2). Different treatment groups with IBA (indole-3-butyric acid) (0.1–0.9 mg/L), NAA (0.5–2.5 mg/L), and inorganic salts (1/2 MS to full MS strength) were established for single-factor experiments. The treatment with the lowest concentration of IBA (0.1 mg/L), NAA (0.5 mg/L), and MS strength was designated as the control group. Based on these treatments, a three-factor, three-level orthogonal experimental design was used to evaluate the effects of IBA, NAA, and inorganic salts on adventitious root formation (Table 1). The liquid culture conditions were the same as those described previously. Observations of root growth and induction were made, and the root length and number of roots were recorded after 31 days of culture.

2.4. Liquid Culture for Micro-Corm Generations

Rooted callus with adventitious shoots was collected as the experimental material for micro-corm formation. Approximately 1 g of fresh weight of the material was transferred to an MS-based liquid culture medium (pH 6.2), with various treatment groups of 6-BA (0.5–3.0 mg/L), NAA (0.5–3.0 mg/L), KT (Kinetin) (0.2–1.4 mg/L), and sucrose (10–50 g/L). The treatment with the lowest concentrations of 6-BA (0.5 mg/L), NAA (0.5 mg/L), KT (0.2 mg/L), and 30 g/L sucrose was designated as the control group. A three-factor, three-level orthogonal experiment was conducted to assess the effects of 6-BA, NAA, and KT on micro-corm formation (Table 2). Subsequently, the optimal culture medium (MS + 2.0 mg/L 6-BA + 1.5 mg/L NAA + 0.6 mg/L KT + 40 g/L sucrose; pH 6.2) was used to conduct further single-factor experiments on micro-corm formation, including inoculation size (2–7 g), photoperiod (4–24 h/d), and shaker rotational speed (50–100 rpm). The experiment investigated the effects of nitrogen and phosphorus concentrations on the induction of micro-corms (Table 3). The MS medium with standard concentrations of NH4NO3 (20.6 mmol/L), KNO3 (18.8 mmol/L), and KH2PO4 (1.25 mmol/L) was used as the control treatment to evaluate the effects of varying concentrations of these components on the fresh weight and relative growth rate of konjac micro-corms. An orthogonal experiment on the concentrations of nitrogen and phosphorus was also conducted (Table 4). The liquid culture conditions were the same as previously described. After 31 days of cultivation, the growth morphology was observed, and the fresh weight and number of micro-corms were determined.

2.5. Bioreactor-Based Scale-Up Culture of Micro-Corms

A 5 L spherical bioreactor was used to scale up the culture of konjac micro-corms. The culture medium was prepared with MS medium supplemented with 2.0 mg/L 6-BA, 1.5 mg/L NAA, 0.6 mg/L KT, and 40 g/L sucrose (pH 6.2). Different volumes of culture liquid (2.0–3.5 L) were added to the bioreactor. The micro-corms were divided into small corms of approximately 0.5 g each and inoculated into the culture medium at a density of 5 g/L. The aeration rate was set to 200 cm3/min. The liquid culture conditions were the same as previously described. The fresh weights of the micro-corms were measured after 31 days of cultivation, and the main bioactive compounds were identified.

2.6. Determination of Glucomannan Content

Konjac micro-corms, devoid of skins and adventitious buds, were oven-dried and ground into powder. A mixture of 1 g of micro-corm powder and 25 mL of distilled water was prepared, dissolved overnight, and continuously stirred at 35 °C in a water bath. The glucomannan content in the micro-corms was determined using the dinitrosalicylic acid (DNS) method as described by Chua [14]. The wavelength for the absorbance measurement was set at 540 nm.

2.7. Statistical Analyses

The experiment was repeated three times. Results are presented as mean values ± standard error (SE). All data were analyzed using Microsoft Excel 2013 and IBM SPSS Statistics 25. For data obtained from a one-factor experimental design, one-way analysis of variance (ANOVA) was applied to assess the significant differences in the mean values of the indicators; for data obtained from a multi-factor experimental design, multivariate analysis of variance (MANOVA) was used to determine the significant differences in the mean values of multiple factors. Post hoc comparisons were conducted using the Duncan test to identify specific differences between groups.

3. Results

3.1. The Induction of Adventitious Shoots Under Liquid Culture

The key role of phytohormones in adventitious shoot induction of Amorphophallus was first explored. As shown in Figure 2a,b and Table 5, konjac adventitious shoots exhibited the maximum induction rate and fresh weight at a 6-BA concentration of 1.0 mg/L (98.7 ± 0.02% and 2.09 ± 0.03 g, respectively), with 8 ± 0.02 buds per culture vessel. Although the group treated with 0.5 mg/L 6-BA produced the most buds (10 ± 0.12 per culture vessel), its induction rate was significantly lower. Therefore, the 6-BA concentration of 1.0 mg/L was chosen as the best condition for further analysis. Combinations of hormones (1.0 mg/L 6-BA with various NAA concentrations) were also tested in experiments. Interestingly, all treatment groups exhibited a 100% induction rate of adventitious shoots (Figure 2c and Table 5). Among these, the combination of 1.0 mg/L 6-BA and 0.5 mg/L NAA resulted in pink and slightly expanded bracts and the highest bud number and fresh weight, which increased by 3.5 and 1.96 times, respectively, compared to the single application of 1.0 mg/L 6-BA (Figure 2c and Table 5).
Further research was conducted to investigate the effects of sucrose concentration and inoculation amount on adventitious shoot induction in konjac (Figure 2d–g). As sucrose concentration increased, the number of buds and fresh weight initially increased and then subsequently decreased (Figure 2f). The highest bud number and fresh weight were observed at a sucrose concentration of 30 g/L (30.06 ± 0.05 and 6.34 ± 0.02 g per culture vessel, respectively), which were 2.09 and 1.73 times higher, respectively, than those at a sucrose concentration of 10 g/L (Figure 2f). Additionally, an inoculation amount of 2 g/L was identified as the optimal condition for maximizing fresh weight (Figure 2g). In summary, the MS-based medium supplemented with 1.0 mg/L 6-BA, 0.5 mg/L NAA, and 30 g/L sucrose, with an inoculation amount of 2 g/L of callus, was the best combination for inducing adventitious shoots in konjac callus liquid culture.
To investigate the effects of different culture methods on the induction and growth of konjac adventitious shoots, their development processes in solid and liquid culture were studied further. As demonstrated in Figure 3, the relative growth rate in solid culture increased more rapidly than in liquid culture within 12 days, but then decreased drastically between 12 and 30 days. In solid culture, small bud tips with noticeable browning phenomena were detected, and no visible micro-corm development was observed (Figure 3a). However, when cultured in liquid, konjac seedling formation was found clearly on the surface of the tissue, some of which had expanded to form the body of the micro-corm, and the browning phenomenon was significantly reduced or inhibited (Figure 3a). The number (24.87 ± 0.06) and final fresh weight (6.64 ± 0.12 g) of adventitious buds per culture vessel in liquid cultures were 1.95 and 1.67 times higher, respectively, than those in solid culture (Figure 3b). These findings showed that liquid culture clearly has a positive impact on the initiation and development of konjac adventitious shoots.

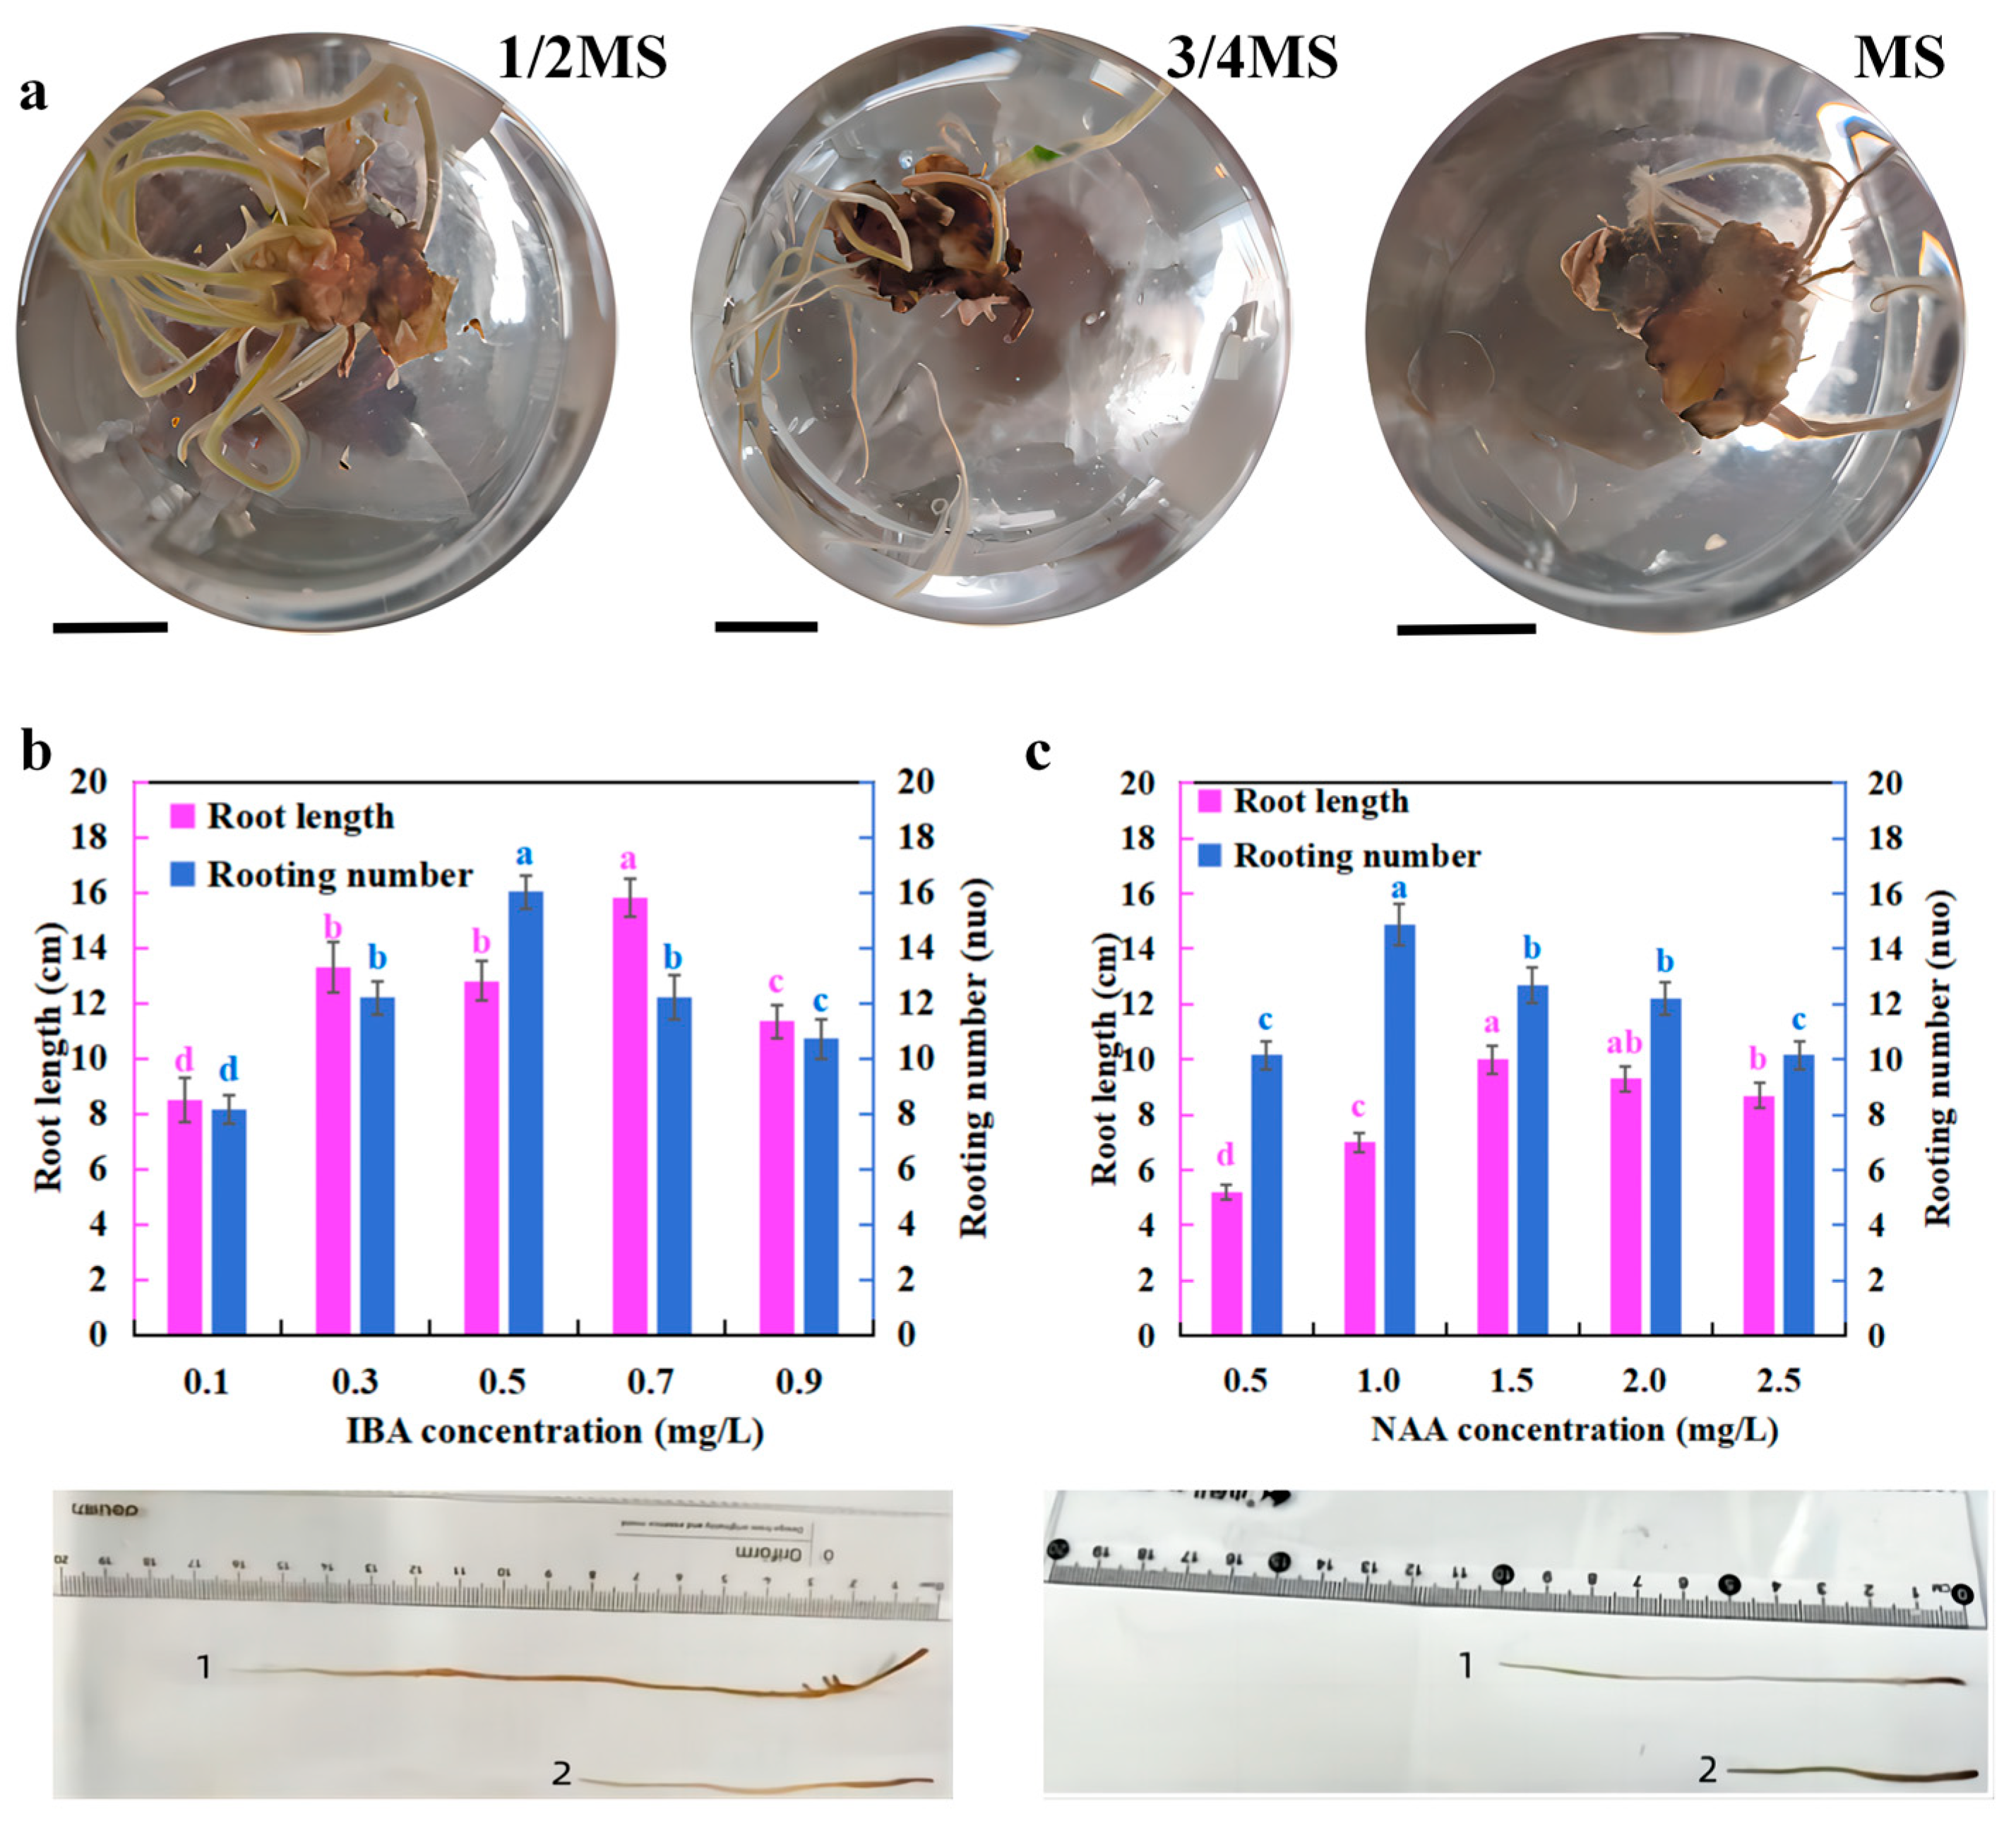
3.2. The Formation of Adventitious Roots in Liquid Culture

The effects of inorganic salts (ranging from 1/2 MS to full MS strength), IBA (0.1–0.9 mg/L), and NAA (0.5–2.5 mg/L) on rooting induction were studied in konjac. As shown in Figure 4a, the optimal rooting effect was observed at the 1/2 MS inorganic salt concentration, characterized by the thickest and longest roots. Both excessively high and low levels of IBA and NAA were unfavorable for the formation of konjac roots (Figure 4b,c). For the single-factor test of IBA, the highest rooting number was observed at a concentration of 0.5 mg/L, which was 1.96 times higher than that at 0.1 mg/L IBA (Figure 4b). Although the group treated with 0.7 mg/L IBA exhibited the longest root length, the number of roots was significantly lower (Figure 4b). For the single-factor test of NAA, the maximum number of induced roots was 10.32 ± 0.09 roots per culture vessel at an NAA concentration of 1.0 mg/L, representing a 1.47-fold increase compared to that at 0.5 mg/L NAA (Figure 4c). Through orthogonal experimental design and analysis, the concentration of inorganic salts was identified as the main factor affecting rooting length, while the concentrations of IBA and NAA significantly affected the rooting number (roots per culture vessel) (Table 6 and Table 7). In summary, the optimal culture condition for adventitious root formation in konjac was determined to be a 1/2 MS medium supplemented with 0.5 mg/L IBA and 1.0 mg/L NAA.

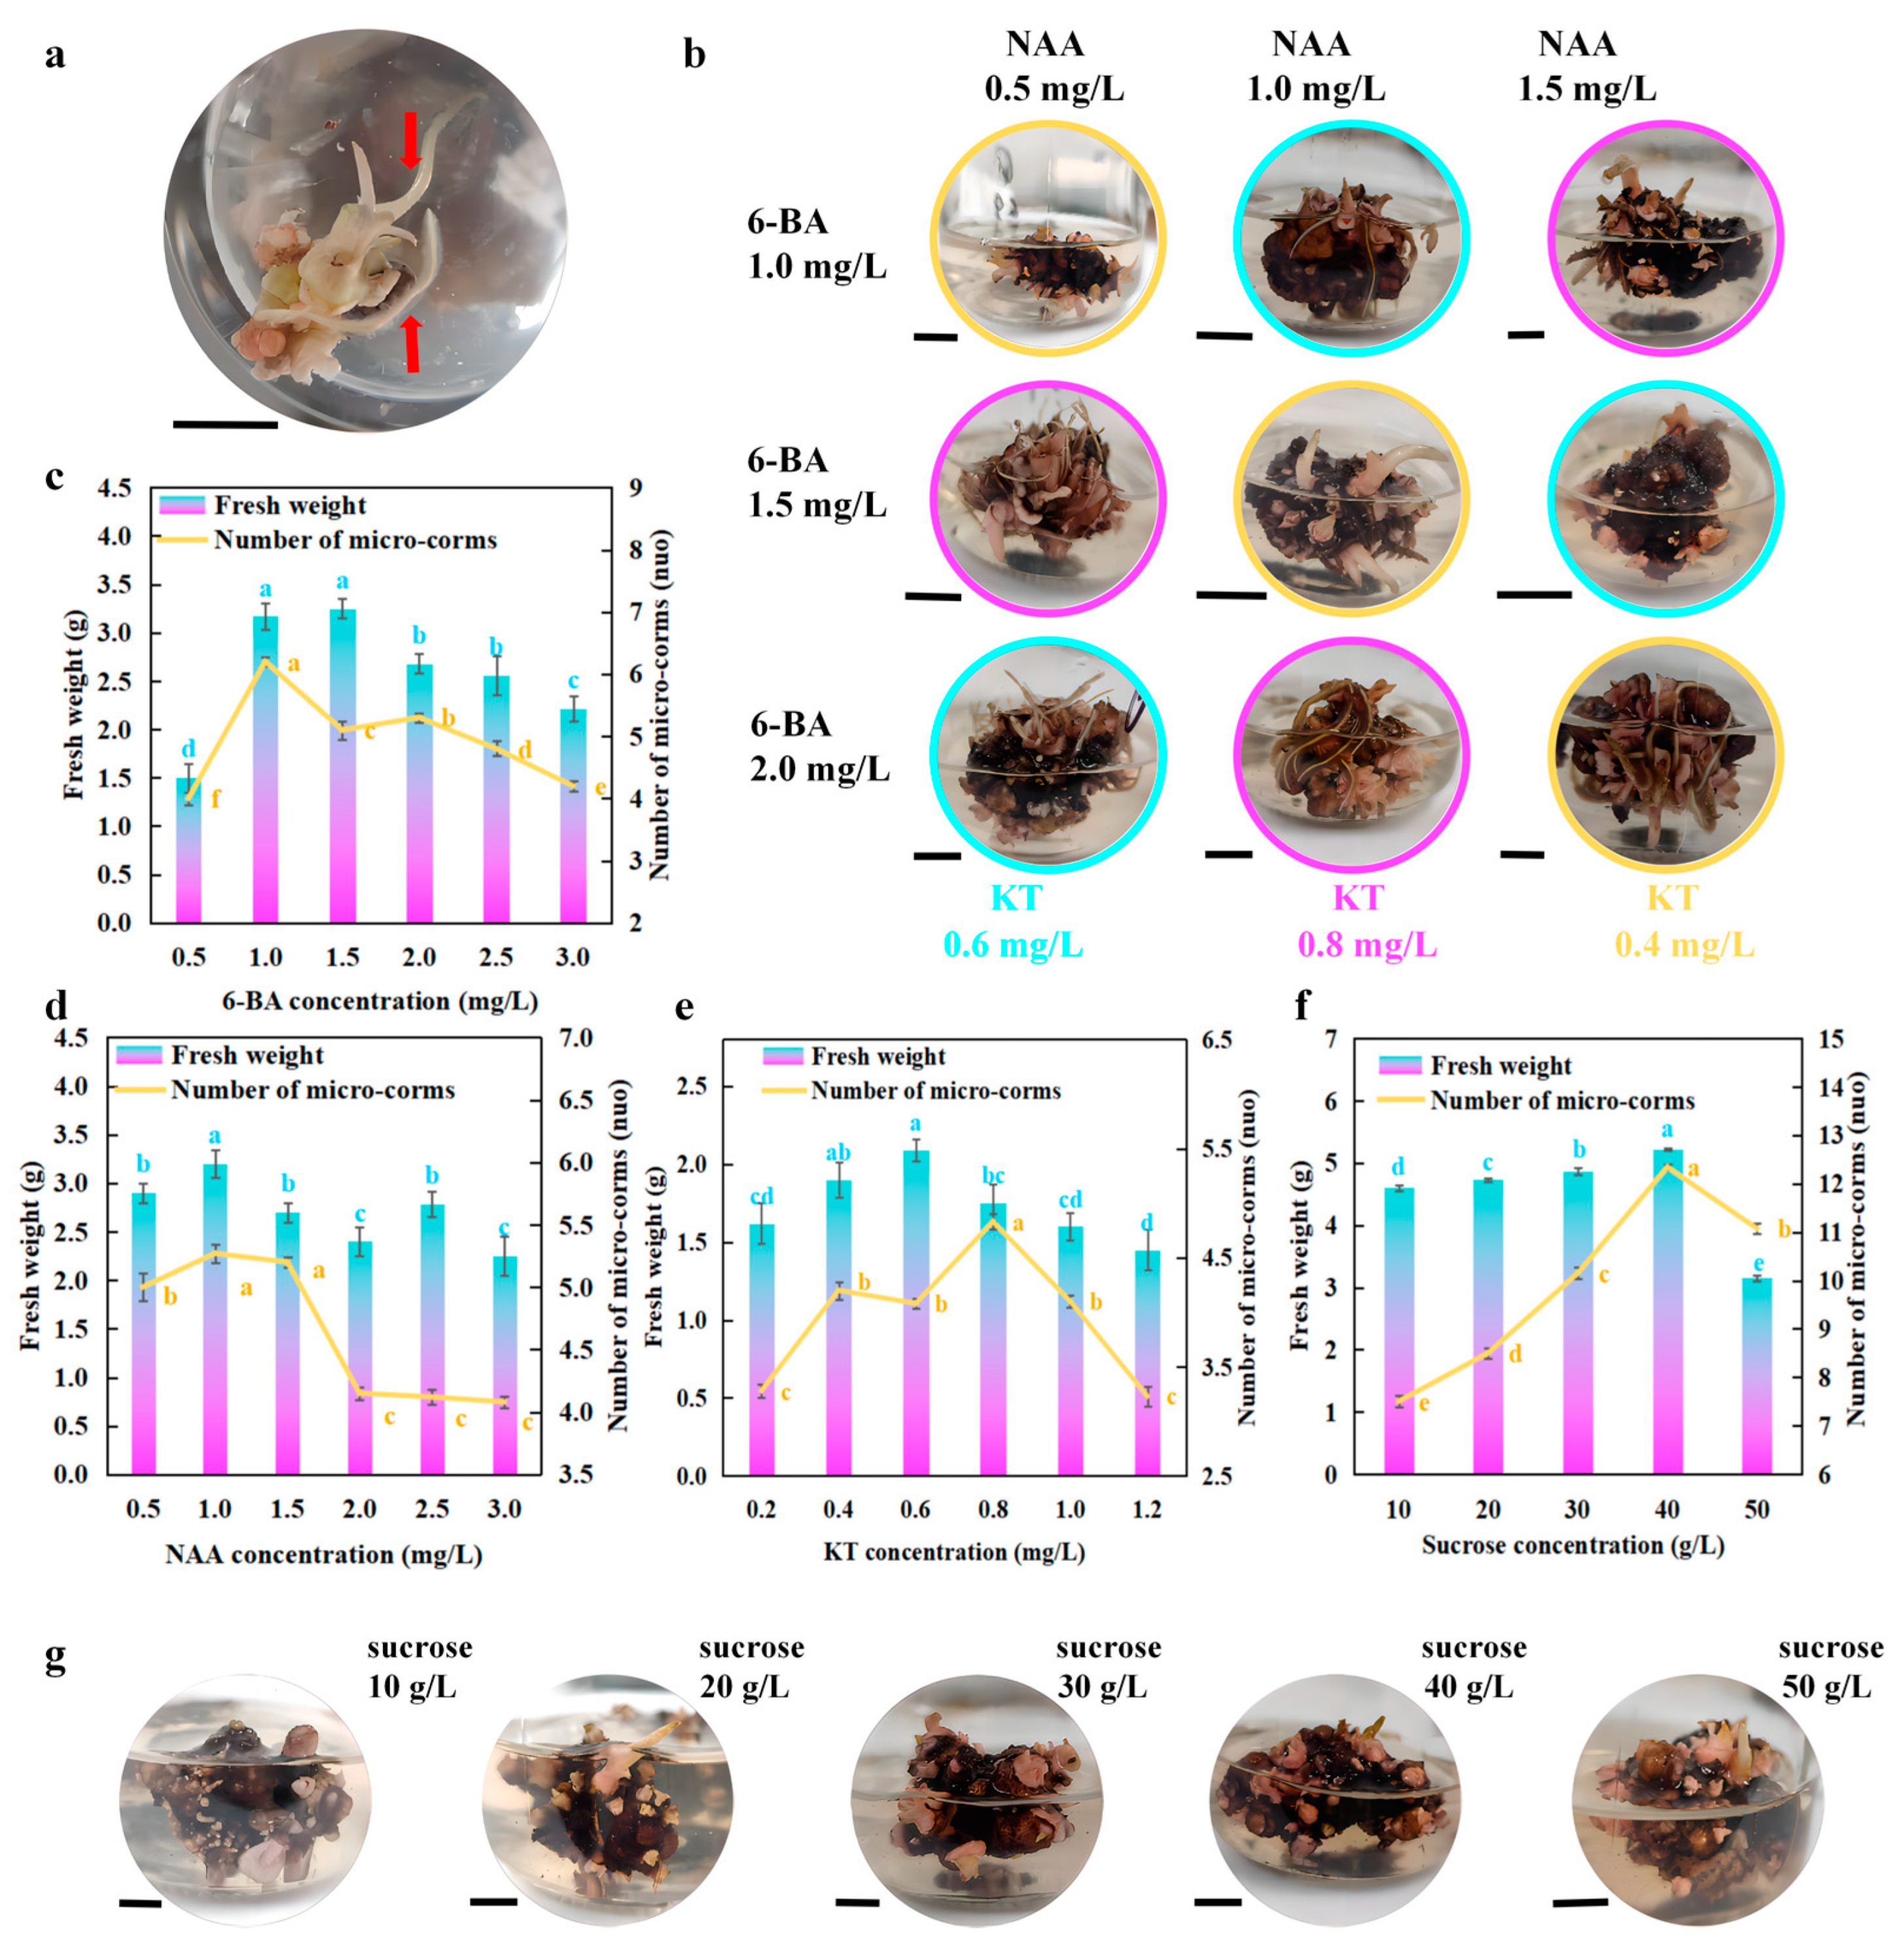
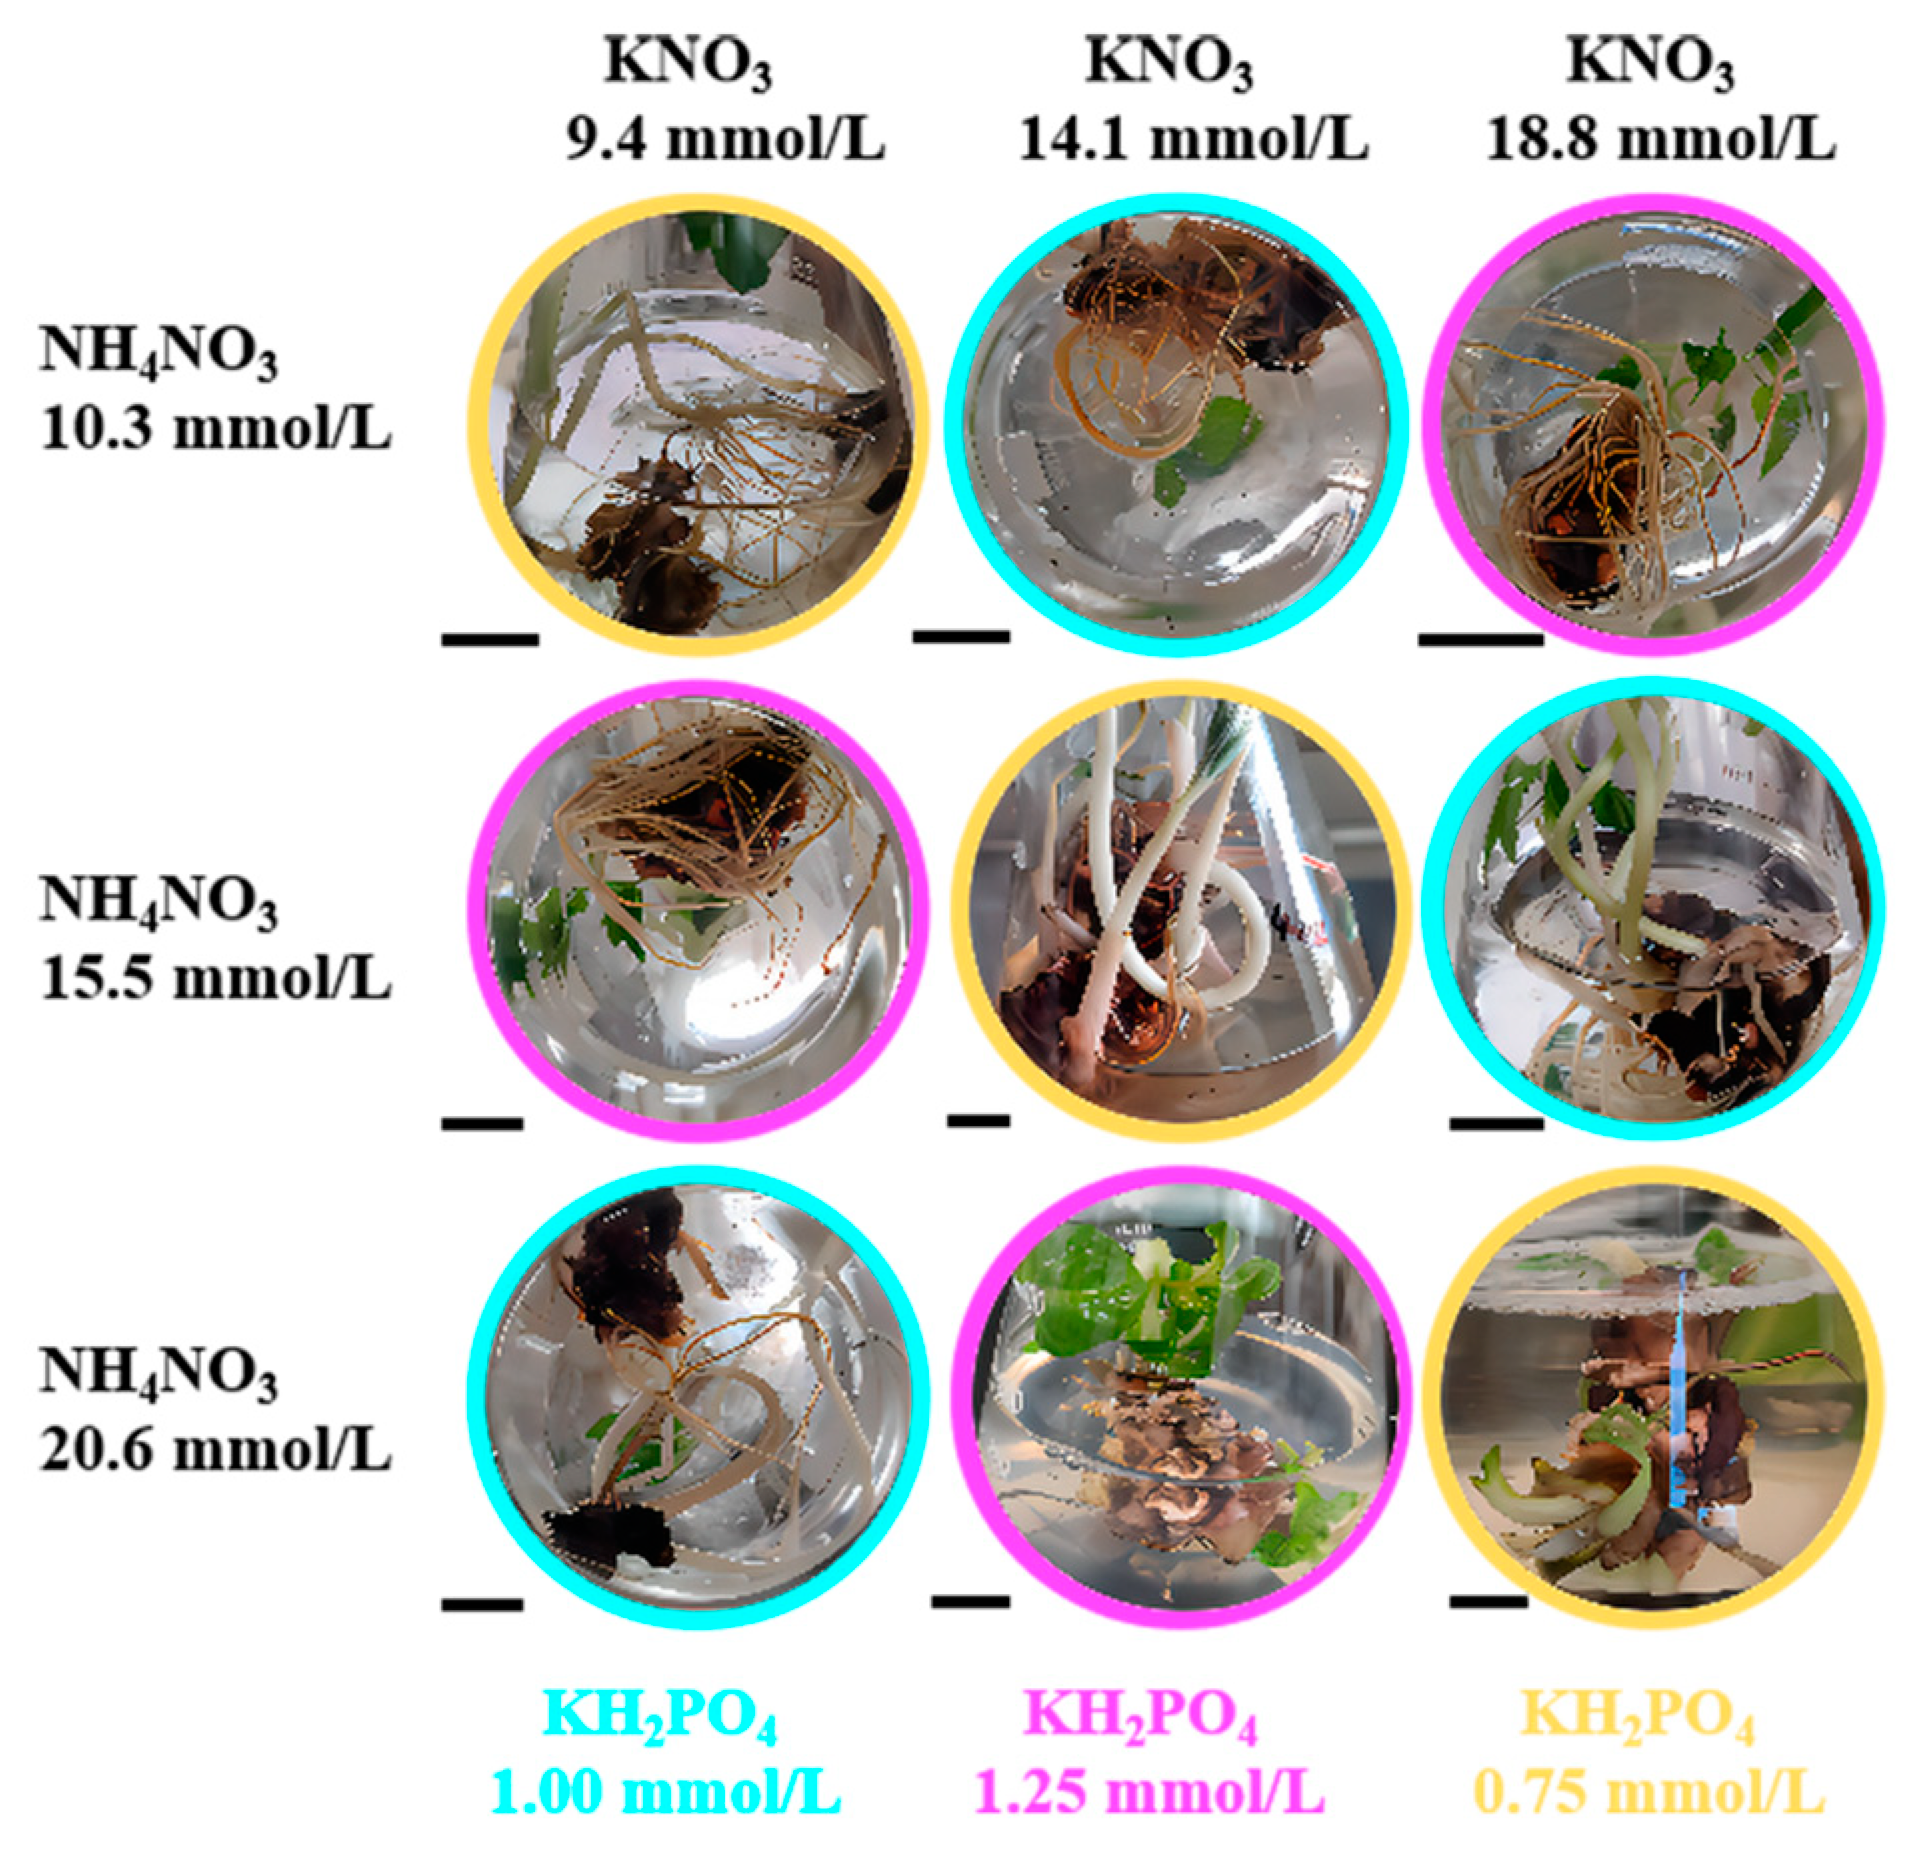
3.3. Konjac Micro-Corm Induction and Growth Under Liquid Culture

In this study, the effects of 6-BA, NAA, and KT on konjac micro-corm induction were investigated, and it was found that hormone concentration significantly affected the fresh weight and quantity of konjac micro-corms. In Figure 5a, the morphological characteristics of adventitious buds and roots are shown. At a concentration of 1.5 mg/L 6-BA, the fresh weight of micro-corms per culture vessel reached a maximum of 3.25 g, and at 1.0 mg/L, the maximum number of micro-corms per culture vessel was 6.34 ± 0.21 (Figure 5c). The increase in NAA concentration had little effect on the fresh weight of micro-corms, but when the concentration reached 2.0 mg/L, the number of micro-corms significantly decreased, being only 0.77 times that at an NAA concentration of 1.5 mg/L, indicating that high NAA concentrations inhibit micro-corm induction (Figure 5d). The maximum fresh weight of micro-corms per culture vessel induced by KT was 2.12 ± 0.16 g at 0.6 mg/L, and the maximum number of micro-corms per culture vessel was 4.8 ± 0.11 at 0.8 mg/L (Figure 5e). The orthogonal experimental design and analysis further confirmed the interactions between the hormones. The range analysis results in Table 8 showed that for fresh weight, the influence of each factor was NAA > 6-BA > KT, which differed from the single-factor experiment results due to interactions among hormones. In terms of the number of micro-corms, the influence of the factors was A > C > B, with A3B3C2 being the best combination. According to the analysis of variance of fresh weight in Table 9, the effects of 6-BA and NAA on fresh weight were significant, while that of KT was not, indicating that factors A and B are at 3 levels. In the quantitative variance analysis of micro-corms, the effect of NAA was significant at the B3 level, while the effects of 6-BA and KT were not significant (Table 9). Considering cost-effectiveness, the best hormone combination for micro-corm induction was determined to be A3B3C2, namely 2.0 mg/L 6-BA, 1.5 mg/L NAA, and 0.6 mg/L KT. Additionally, testing the effect of different sucrose concentrations on micro-corm induction revealed that the fresh weight and quantity of micro-corms per culture vessel were optimal at a sucrose concentration of 40 g/L, with the number of micro-corms per culture vessel being 12.56 ± 0.07, which was 1.66 times higher than that at 10 g/L sucrose (Figure 5g).
This study deeply explored the key factors affecting the induction efficiency of konjac micro-corms and was devoted to optimizing the induction process through accurately adjusting the experimental conditions to achieve efficient reproduction of konjac.
As shown in Figure 6a,b, the number of induced micro-corms per culture vessel was 8.78 ± 0.02 with an inoculation amount of 3 g, which was 12.81% less than that with an inoculation amount of 7 g, but the fresh weight was 3.59 times higher; thus, an inoculation amount of 3 g was determined to be optimal. Moreover, the RGR and fresh weight of micro-corms increased initially and then decreased with increasing photoperiod, reaching their highest values at a light duration of 12 h/d (0.031 and 7.67 ± 0.12 g, respectively) (Figure 6c,d). At a light duration of 16 h/d, the RGR and fresh weight were 0.03 and 7.36 ± 0.09 g, respectively. Considering that the growth morphology under 16 h/d light was much better than that under 12 h/d, and the subculture effect was more favorable, this study determined that the optimal light duration is 16 h/d. The induction of micro-corms cannot occur without oxygen, and an appropriate oxygen concentration facilitates efficient micro-corm induction. At a rotation speed of 70 rpm, the fresh weight per culture vessel is maximized at 8.72 ± 0.03 g, and the relative growth rate is 0.036 g/d (Figure 6e,f).
As a key component of proteins and nucleic acids, nitrogen source is very important for the growth of plants. It showed that the fresh weight of induced micro-corms initially increases and then decreases with increasing nitrogen source concentration (Table 3). When the total nitrogen source concentration reaches 90 mmol/L, the fresh weight per culture vessel increase reaches 6.31 ± 0.04 g, which was 1.06 times that of the control group. Under the condition of a fixed total nitrogen source concentration at 90 mmol/L, the ratio of nitrate to ammonium nitrogen varies in the media, and then check the growth of micro-corms. The results are presented in Table 3. As the ratio of nitrate to ammonium nitrogen increases, the fresh weight of induced micro-corms initially increases and then decreases. When the ratio is 2:1, the fresh weight of micro-corms is maximized at 7.21 ± 0.03 g. Phosphorus, one of the three major nutrients essential for plant growth, primarily exists in the form of KH2PO4 in the culture medium. To explore whether different concentrations of phosphorus affect the induction of micro-corms, the concentration of KH2PO4 was modified in this study. The objective was to determine the concentration of phosphorus that would achieve the experimental purpose. As the concentration of KH2PO4 increases, the fresh weight of micro-corms initially increases and then decreases; when the concentration is 1.0 mmol/L, the fresh weight increase in micro-corms is 7.01 ± 0.27 g, and the relative growth rate is 0.029 g/d (Table 3). Compared to the control group, it increased by 0.12 g per vessel and 0.001 g/d, respectively.
Different concentrations of nitrogen and phosphorus had a significant impact on the induction of micro-corms. This study designed an L9(34) orthogonal experiment. The nine sets of experimental results indicate that different concentrations of nitrogen and phosphorus, when interacting, promote seedling growth to varying degrees (Figure 7). More adventitious roots were observed in experiments 3 and 4; however, the growth of seedlings in experiment 6 was found to be the best. The seedlings in experiment 8 were relatively robust, and the induced micro-corms were tender. The micro-corms in experiments 1 and 9 were smaller in size. In terms of the fresh weight of induced micro-corms, all three factors were significant, with the order of priority being KNO3 > NH4NO3 > KH2PO4. The optimal combination was A2B2C1, which corresponds to NH4NO3 at 15.5 mmol/L, KNO3 at 14.1 mmol/L, and KH2PO4 at 0.75 mmol/L (Table 10 and Table 11).

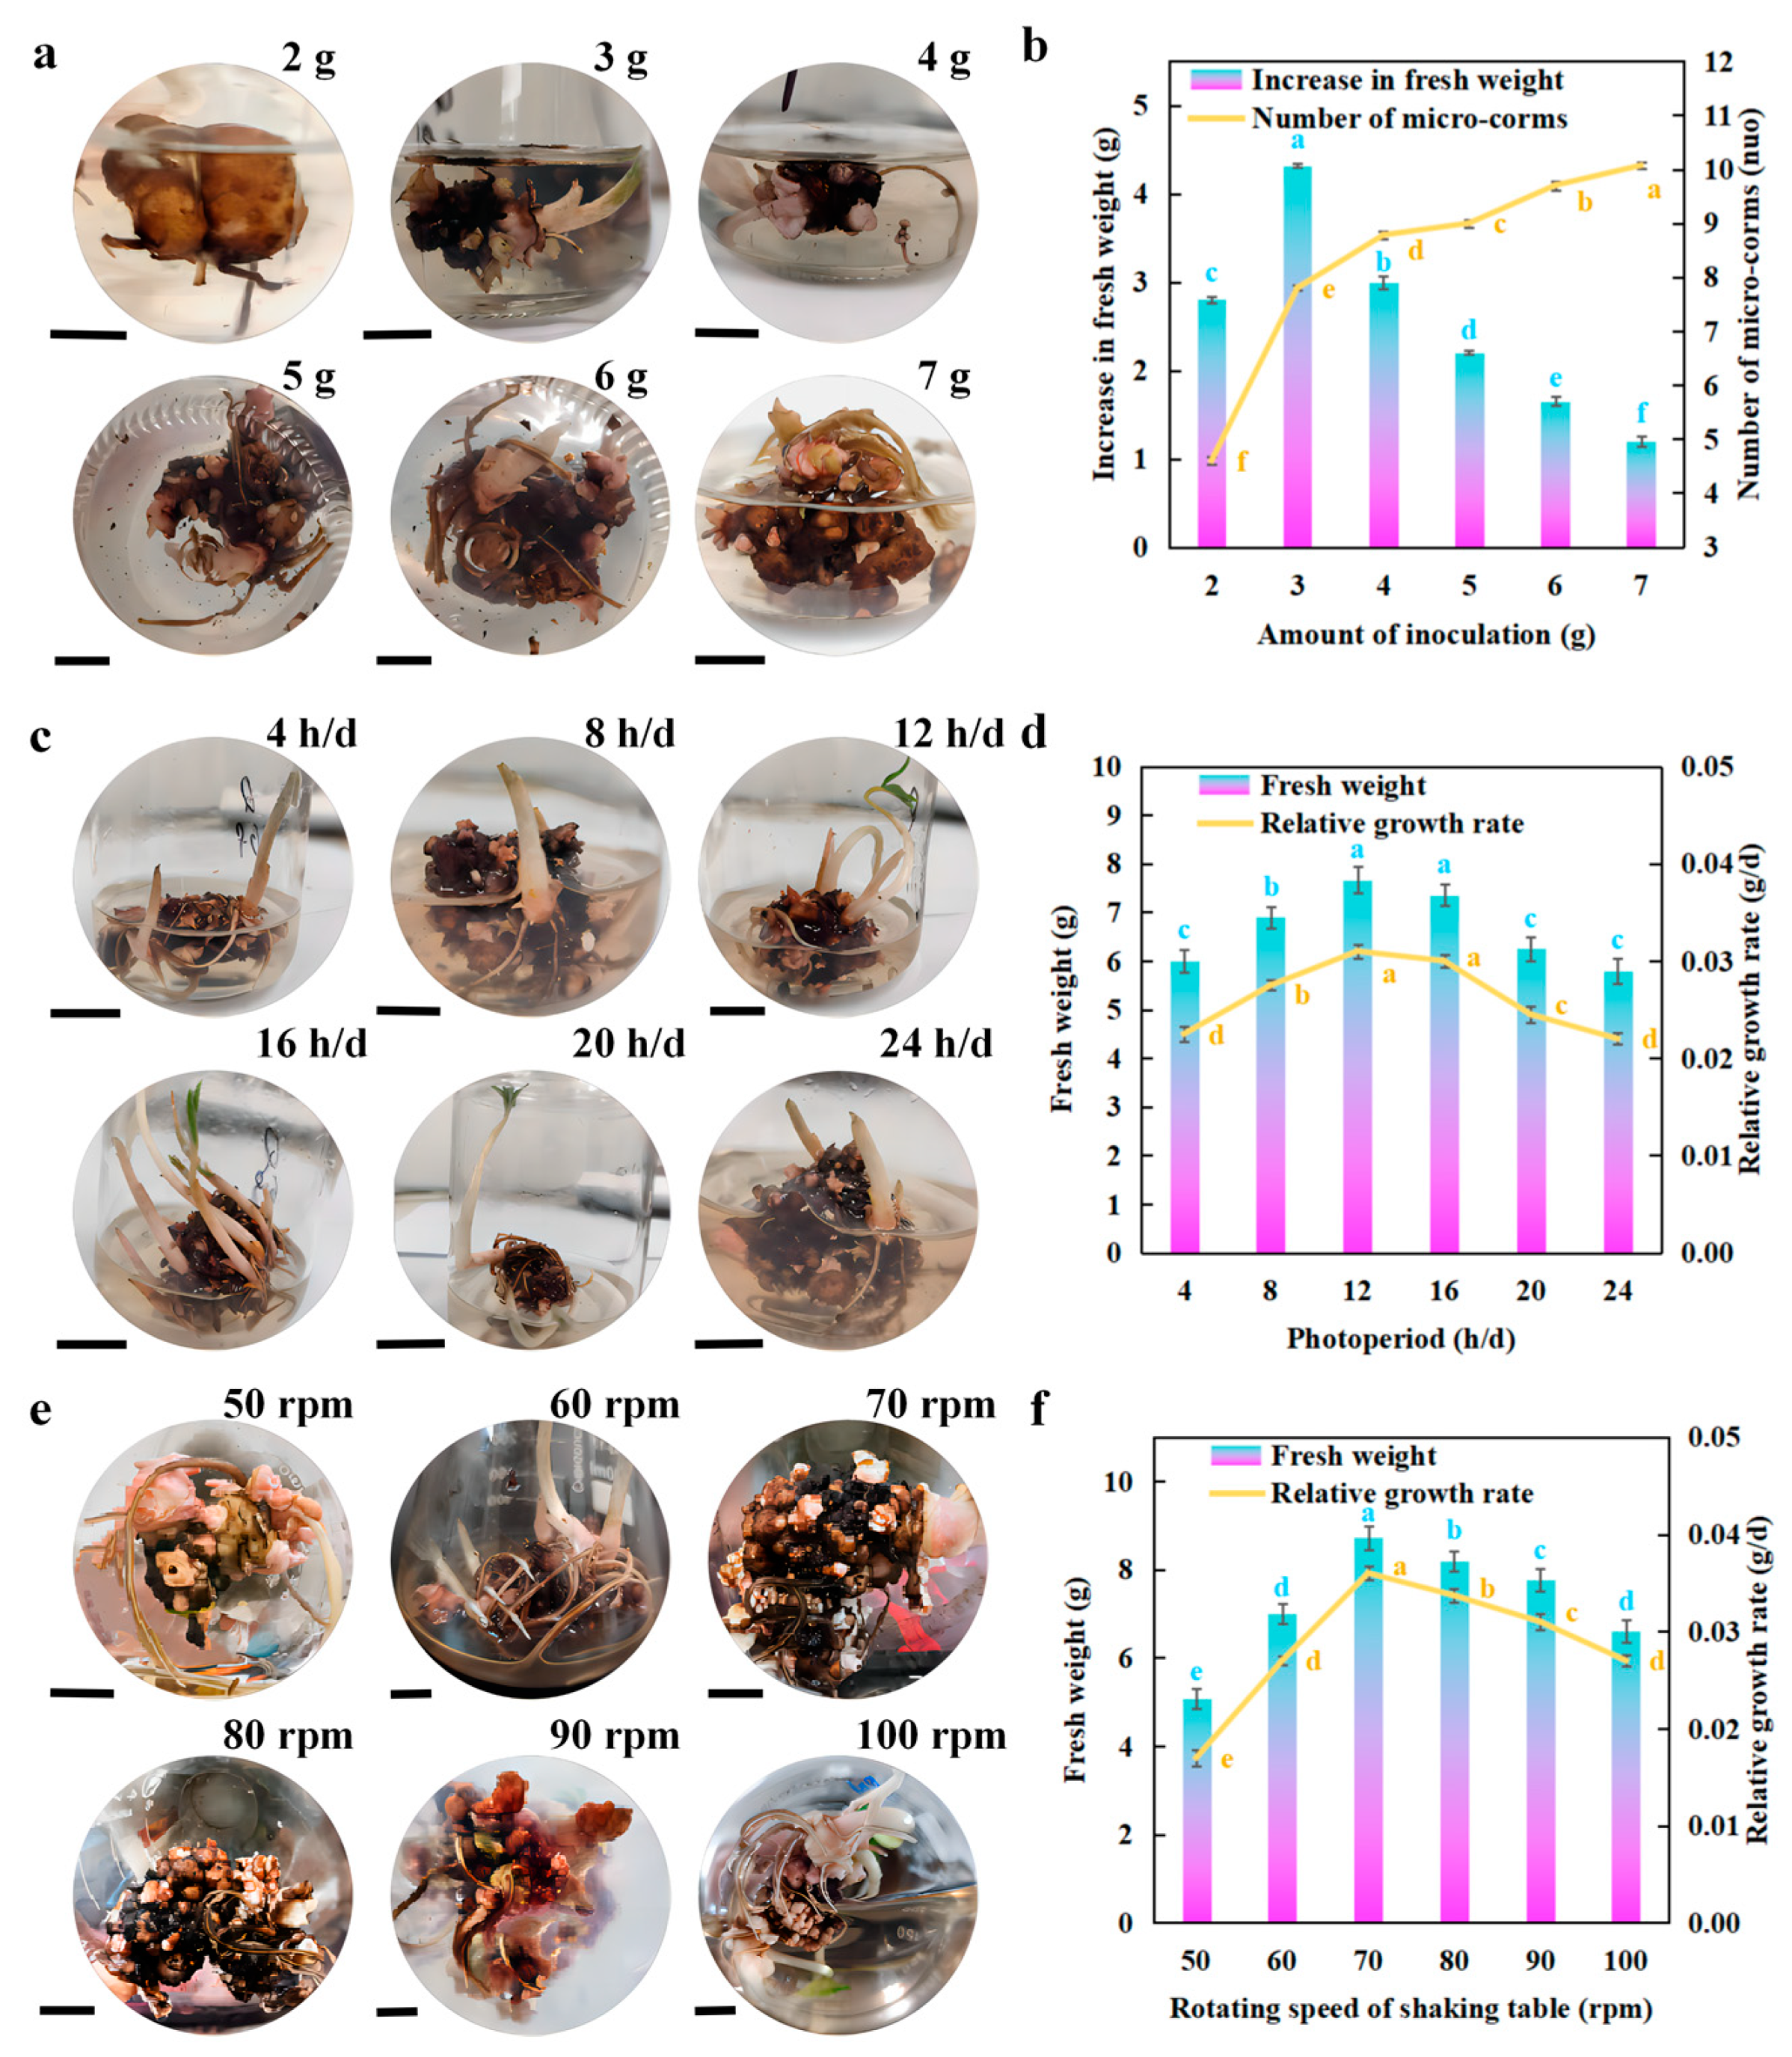
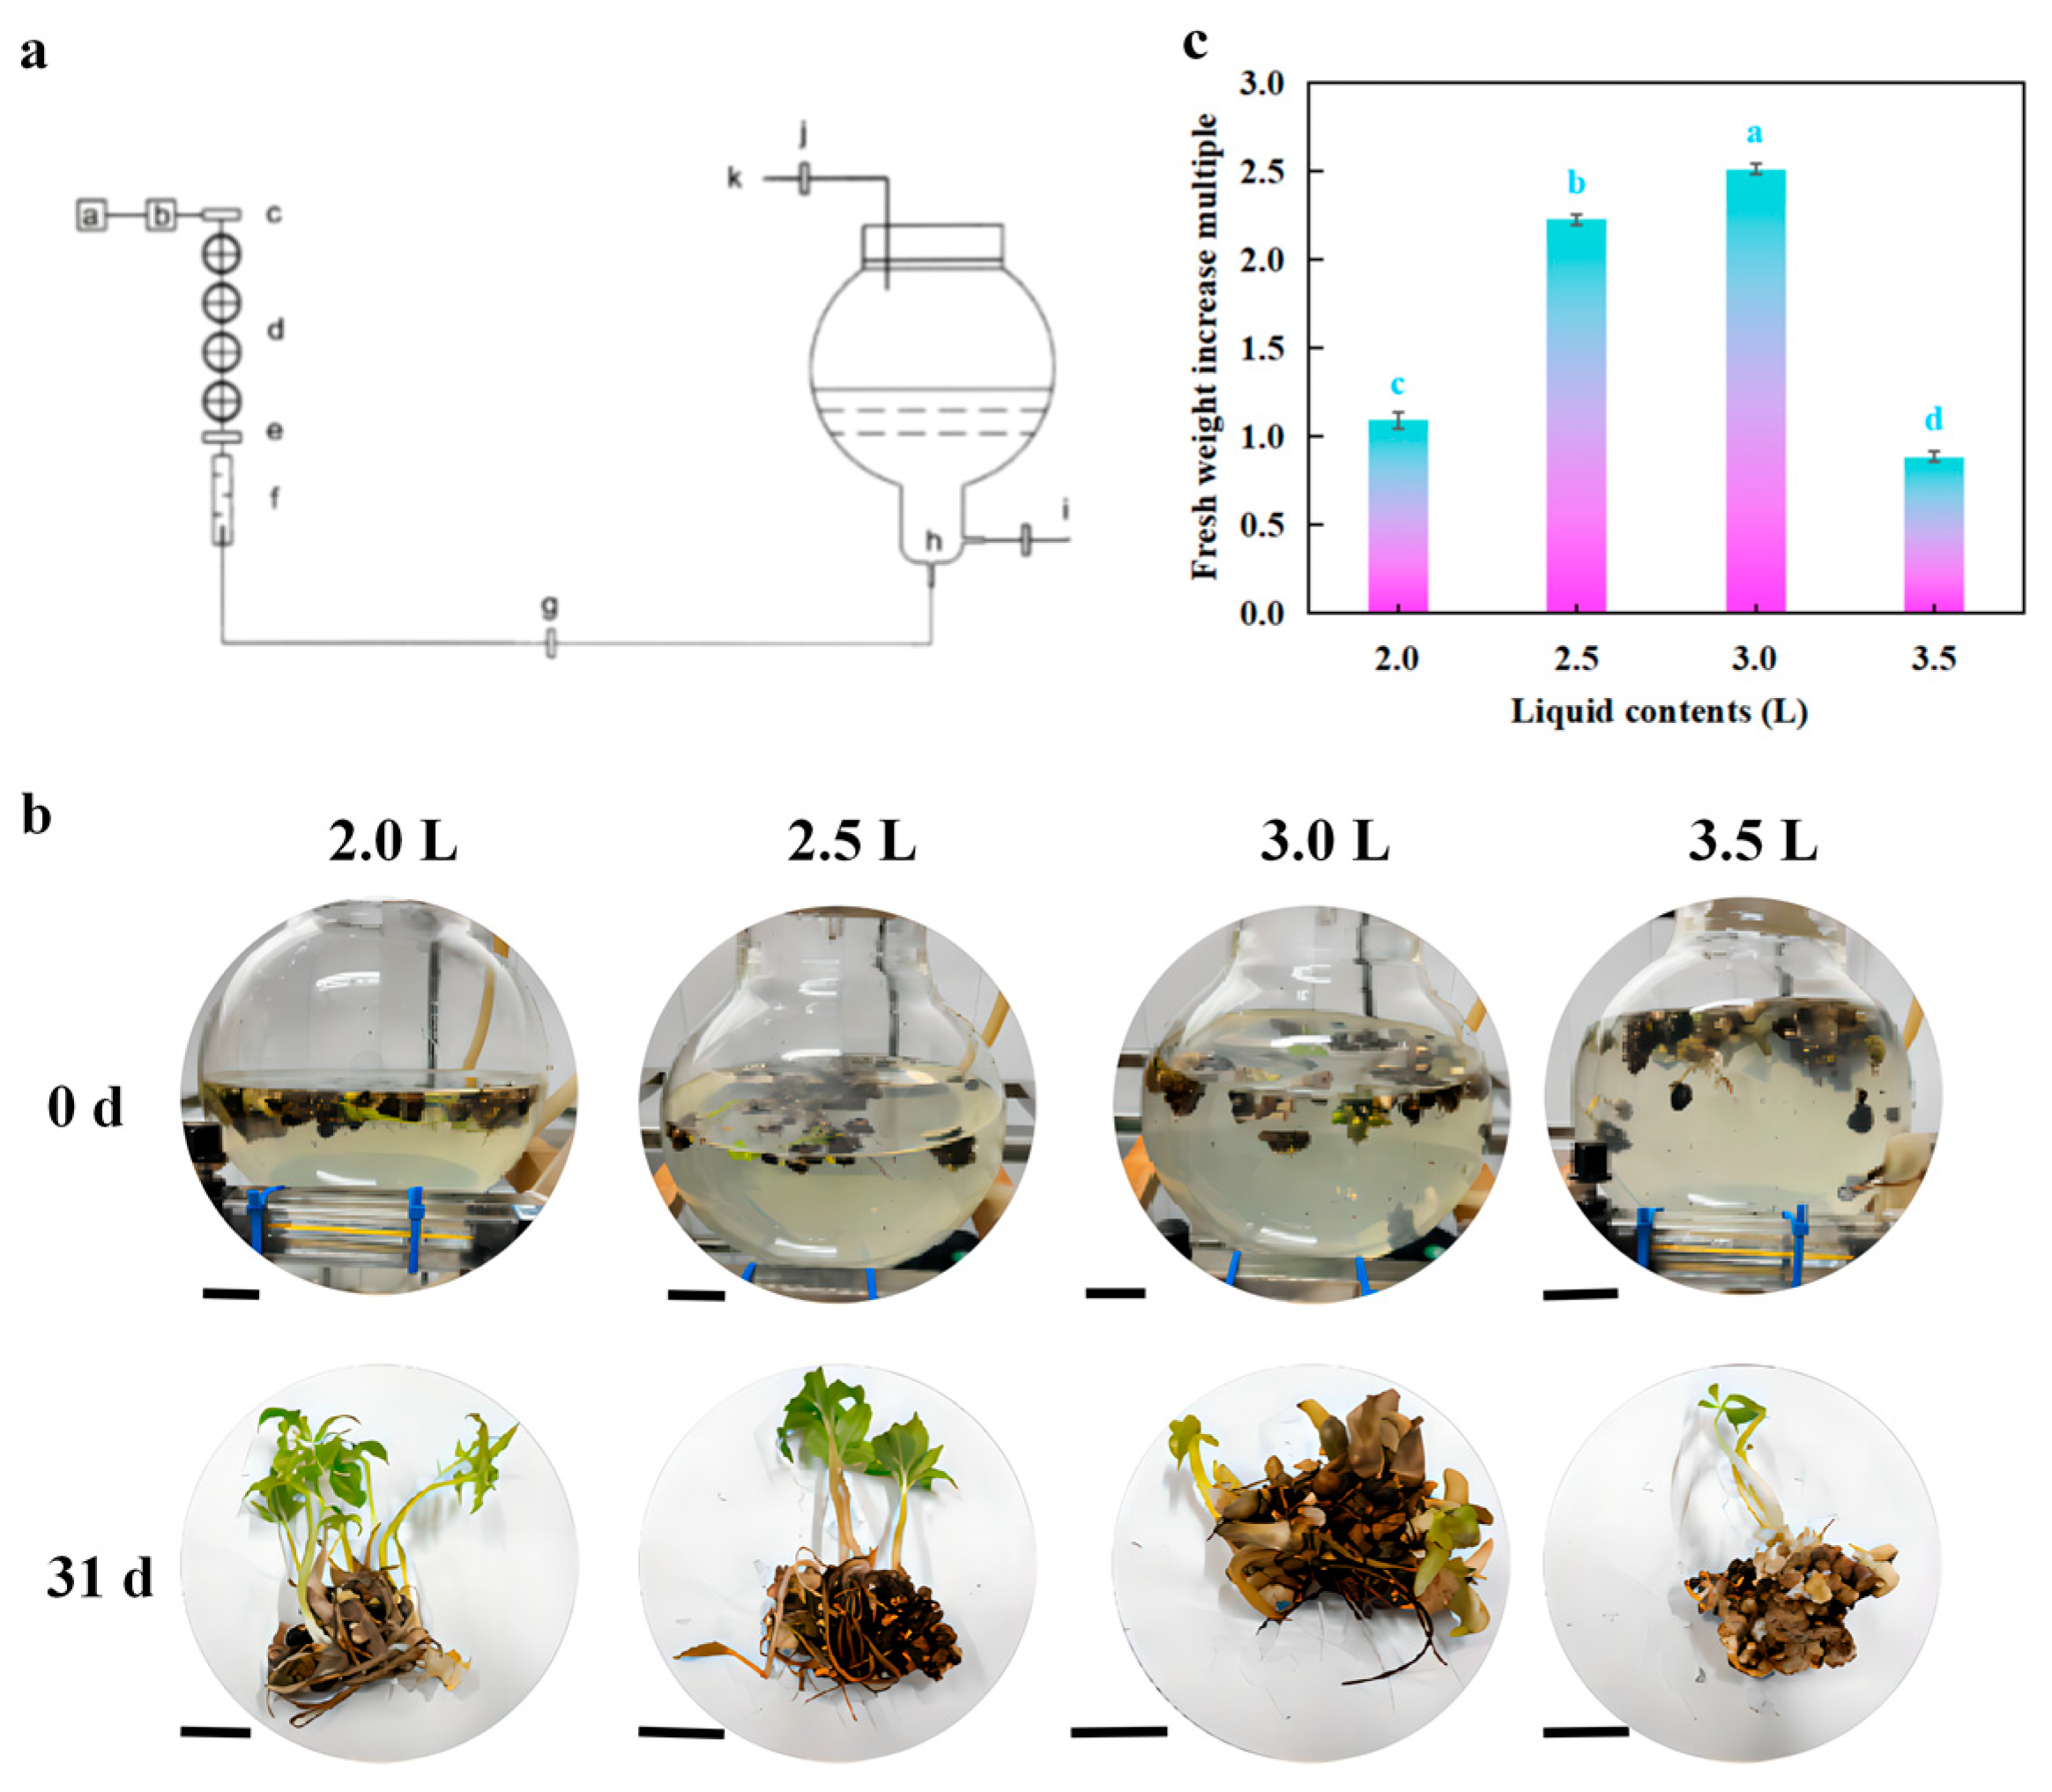
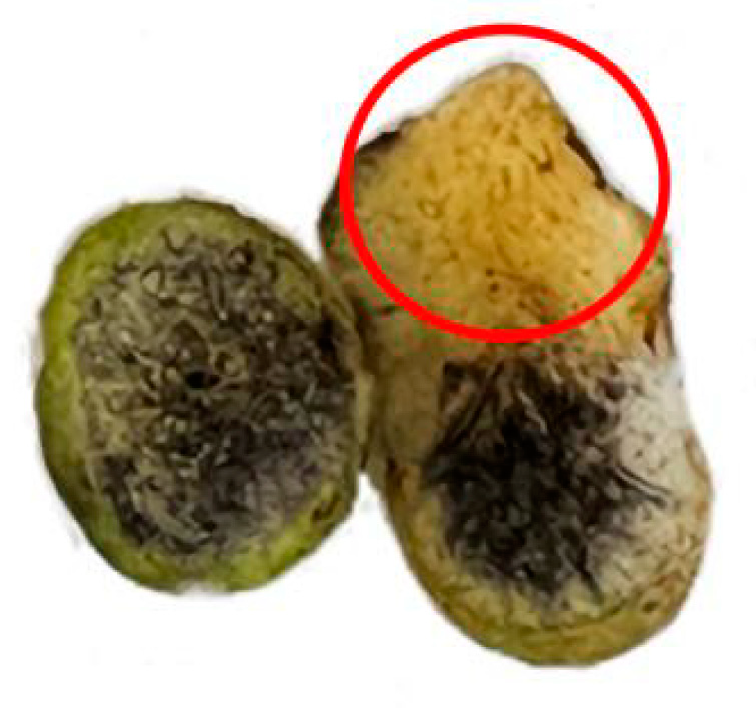
3.4. Scale-Up Culture of Micro-Corms in Spherical Bioreactor and Identification of Main Storage Substances

Micro-corms were enlarged and cultured to explore the effects of different liquid filling volumes on induction. All experiments were carried out in spherical bioreactors (Figure 8a). When the liquid volume was 3 L, the fresh weight of micro-corms per culture vessel was the largest, approximately 52.67 ± 0.01 g, and the fresh weight increased by a factor of 5.21. Using the glucose standard curve y = 1.0514x−0.039 with R^2 = 0.9955, the glucomannan content in the harvested micro-corms was determined to be 48.26%. In the starch color development experiment, the newly induced part turned blue upon exposure to the iodine solution, while the original material part (encircled in red) showed no change in color (Figure 9).

4. Discussion

4.1. Liquid Culture of Adventitious Bud Induction

In this text, it has been found that the induction of adventitious buds is a process influenced by multiple factors, including explants, plant growth regulators, and culture media. Plant growth regulators play a significant role in regulating cell differentiation and in vitro culture. Leveraging the totipotency of plant cells, the appropriate combination of growth regulators can induce the formation of adventitious buds. This study shows that the ratio of hormones plays a key role in the induction of konjac adventitious buds, with the balance between auxin and cytokinin being crucial for bud formation. Li et al. [10] found that supplementing the MS medium with 6-BA at 2.0 mg/L, NAA at 0.5 mg/L, gibberellin at 0.1 mg/L, and sucrose at 30 g/L can induce seedling formation in one step, with an average of 6 ± 2 regenerated buds per explant. When the dosage ratio of 6-BA to NAA was 2:1, the number of buds was the highest, reaching 28.01 ± 0.05, which is consistent with the findings of Li et al. [10]. This indicates that appropriate concentrations of 6-BA and NAA are beneficial for the induction of konjac adventitious buds.
Liquid culture systems have been widely recognized for their advantages in plant tissue culture, including rapid cell proliferation, efficient nutrient utilization, and reduced issues such as browning and nutrient depletion compared to solid culture systems [15,16,17]. Previous studies have demonstrated that optimizing liquid culture conditions and bioreactor structures can significantly enhance the proliferation rate of plant cells and the synthesis efficiency of secondary metabolites, especially in medicinal plants [18]. In this study, the liquid culture system significantly improved the induction efficiency and growth quality of konjac adventitious buds, resulting in healthier morphology and less browning compared to solid culture. These improvements are likely attributed to the enhanced nutrient availability and oxygen exchange in liquid systems, which support more vigorous metabolic activity and reduce oxidative stress in explants. These findings align with previous reports on other plant species, such as Malus domestica and Musa sp., where liquid culture improved tissue growth and reduced browning issues [15,18]. Therefore, liquid culture exhibits unique advantages in addressing browning and nutrient depletion commonly observed in solid culture systems, providing technical support for the efficient propagation of konjac.

4.2. Liquid Culture for Induced Rooting

Inorganic salt strength plays a crucial role in the rooting culture process of konjac, as plant growth depends on adequate hydration and nutrition of minerals [19,20]. In this study, the rooting of konjac explants was significantly influenced by the optimization of inorganic salt strength. The results revealed that the 1/2 MS medium combined with 1.0 mg/L IBA and 0.5 mg/L NAA was most effective in promoting root induction. These findings are consistent with previous studies on other plant species, such as Pongamia pinnata and hybrid Cymbidium, where lower salt concentrations promoted better rooting performance [21,22].
High concentrations of plant growth regulators (PGRs), however, negatively impacted root length and number [23]. Studies have shown that high concentrations of auxin can disrupt the balance between cell division and elongation near the root apex in Camellia sinensis, leading to excessive cell proliferation, impaired cell elongation, and ultimately inhibiting root tip elongation [24]. In addition, high concentrations of plant growth regulators may lead to the accumulation of H2O2, which damages cellular structures, inhibits root cell elongation, and ultimately suppresses root growth [24]. This study found that high concentrations of IBA and NAA were detrimental to the growth of root number and length in konjac micro-corms, which is consistent with the findings of Ivanchenko et al. [25].

4.3. Liquid Culture Induced by Micro-Corms

During the in vitro culture of plantlets, organs, tissues, or cells, it is necessary and important for these cultures to absorb the nutrients from the culture medium, where sucrose serves as the most important nutrient and energy source [26]. A sucrose concentration that is too low can lead to insufficient plant growth due to inadequate nutrient absorption. An excessively high sucrose concentration will inhibit plant growth [27,28]. High sucrose concentrations can elevate the osmotic potential of the medium, reducing water uptake by tissues and hindering cell expansion and division, thereby decreasing bud numbers and fresh weight. Moreover, excessive sucrose may disrupt metabolic balance, leading to carbon overload that favors the accumulation of storage compounds rather than active growth [29]. Oxidative stress induced by high sucrose levels, due to the overproduction of reactive oxygen species (ROS), may further damage cellular structures, impair metabolic functions, and reduce tissue vitality. Through the study on the effects of different carbon sources on the biomass of Hancornia speciosa (Gomes), it was found that 30 g/L sucrose promotes the growth of Hancornia speciosa (Gomes) [29]. Furthermore, sucrose concentration also significantly influences the plant’s metabolic products. Using response surface methodology to optimize the sucrose concentration, stirring speed, and naphthalene acetic acid concentration in the callus cell liquid culture of Hibiscus cannabinus, it was found that these three factors significantly affected the biomass of callus [30]. In this study, the optimal culture conditions for inducing A. konjac were an MS medium supplemented with 2.0 mg/L 6-BA, 1.5 mg/L NAA, 0.6 mg/L KT, and 40 g/L sucrose. The optimal sucrose concentration for micro-corms in this study differs, possibly because micro-corms synthesize a large amount of glucomannan during their growth process, requiring a substantial amount of carbon sources [31,32]. However, sucrose concentrations exceeding this optimal level likely impose osmotic and oxidative stress, ultimately reducing bud numbers and fresh weight.
Light, as an environmental signal, significantly influences plant growth and development [33,34,35]. Light can influence the induction rate during plant growth, but insufficient light duration can reduce this rate [36]. Excessive light duration can lead to sunburn diseases, making it essential to select the appropriate light exposure [37]. It has been shown that long-day treatments often promote an increase in the dry weight of plants originally grown under short-day conditions [38]. In the present study, culturing with a specific dark period, compared to continuous light, resulted in greater micro-corm biomass and improved morphology. Interestingly, the optimal illumination time for inducing micro-corms under liquid culture in this study is 16 h, indicating a dependency on light for micro-corm induction, consistent with previous findings [38]. Konjac seedlings under 12 h/d and 16 h/d illumination can produce a large number of seedlings in a single subculture, indicating their ability to use photosynthesis to provide additional nutrients for konjac growth.
In a series of studies in recent years, the importance of nitrogen and phosphorus in plant tissue culture has garnered extensive attention and has been widely verified. These elements have been shown to play vital roles in plant cell proliferation, differentiation, and the synthesis of secondary metabolites [39,40]. By precisely controlling the supply of these key nutrients, the efficiency and quality of plant tissue culture can be significantly improved, thereby promoting plant growth and development and increasing the production of bioactive compounds. In Leucojum aestivum shoot culture, the production of galantamine was optimized by applying different concentrations of sucrose, NO3, NH4+, and PO43− [41]. Yang et al. [42] studied the effects of carbon and nitrogen sources on biomass accumulation and flavonoid formation in licorice callus and found that nitrate nitrogen was beneficial to the growth of licorice callus and the accumulation of flavonoids. When the NO3/NH4+ concentration ratio was 2:1, the sum of the five flavonoids in the licorice callus reached its maximum value of 151.47 μg·g−1. This study shows that a NO3/NH4+ concentration ratio of 2:1 is most beneficial to the liquid culture of micro-corms. The results of this experiment align with those of Yang et al. [42], indicating a similar beneficial effect of the nitrate-to-ammonium ratio on plant growth and metabolism. Interestingly, the added amounts of NH4NO3, KNO3, and KH2PO4 obtained in this experiment are all less than those in MS medium, suggesting that during the growth and development of micro-corms, large amounts of nitrogen and phosphorus elements are not required to maintain cell proliferation, differentiation, and the synthesis of secondary metabolites. This study successfully optimized the culture conditions for the induction of Amorphophallus konjac through precise control of hormone concentration, inoculum volume, light duration, shaker speed, and nitrogen–phosphorus nutrient ratio, providing a scientific basis for the efficient propagation of Amorphophallus konjac and also for its efficient reproduction. It provides an important reference for the further development of plant tissue culture technology.

4.4. Scale-Up Culture of Micro-Corms in Spherical Bioreactor and Identification of Main Storage Substances

The scarcity of seed sources has prompted the exploration of faster plant seed production methods. Bioreactors offer a potential solution to this issue, providing an optimal growth environment with a uniform nutrient and oxygen supply and controllable environmental conditions. These conditions promote plant morphology, biomass, and the synthesis of plant secondary metabolites [43,44,45]. Furthermore, their scalability supports efficient mass production and significantly increases productivity. In the micropropagation of Pennisetum × advenaRubrum”, Pożoga et al. used a temporary immersion system with MS medium containing 1 mg/L BAP, obtaining over 90% of new plants in half the time compared to agar culture, with no signs of vitrification [46]. In this study, the fresh weight of micro-corms cultured in a spherical bioreactor increased by 1.05 times compared to that of the 3 g culture in an Erlenmeyer flask, indicating the significant role of the bioreactor in micro-corm growth.

5. Conclusions

This research is dedicated to developing konjac seed breeding technology based on bioreactors, with the aim of establishing a konjac cell engineering seed breeding system for efficient and low-cost production of seeds, thereby promoting the rapid development of the konjac industry. Through an in-depth exploration of the optimal conditions for micro-corm induction, we have completed the scale-up culture in bioreactors and identified the main storage substances. Future research can further explore the effects of hormone ratios and culture conditions on other physiological characteristics of konjac, as well as how to further improve the quality and yield of konjac seeds, potentially opening up new directions for the development of tissue culture technology for konjac and other plants.

Author Contributions

Conceptualization, Z.Z. and L.S.; data curation, Y.S. and X.S.; formal analysis, Y.P and Y.S.; funding acquisition, Z.Z.; investigation and methodology, Y.P., C.L. and Y.S.; project administration, Z.Z.; software, Y.S. and Y.P.; supervision, L.S. and Z.Z.; writing—original draft, Y.P., C.L. and Y.S.; writing—review and editing, Z.Z. and L.S. All authors have read and agreed to the published version of the manuscript.

Funding

This work was supported by Dalian’s Science and Technology Innovation Fund (grant no. 2020JJ27SN107).

Data Availability Statement

The data will be made available upon request.

Acknowledgments

We thank all colleagues at our lab for providing valuable discussions and technical assistance.

Conflicts of Interest

The authors declare no conflicts of interest.

Abbreviations

6-BA6-Benzylaminopurine
2,4-D2,4-Dichlorophenoxyacetic acid
IBAIndole-3-butyric acid
MSMurashige and Skoog
NAA1-Naphthaleneacetic acid
KTKinetin
PGRsPlant growth regulators

References

  1. Chotigamas, T.; Sirisansaneeyakul, S.; Sripaoraya, S.; Gateprasert, M.; Vanichsriratana, W. Process development for konjac (Amorphophallus oncophyllus) glucomannan production using cell suspension culture technique. Mitochondrial DNA Part B Resour. 2024, 9, 522–526. [Google Scholar]
  2. Gao, Y.; Yin, S. Assembly and analysis of the chloroplast genome of Amorphophallus kachinensis engler & gehrmann (Araceae) from Southwestern China: Implications for conservation and utilization. Mitochondrial DNA Part B Resour. 2024, 9, 452–456. [Google Scholar] [CrossRef]
  3. Sun, L.; Xiao, Q.L.; Zhang, T.; Fan, J.Q.; Deng, L.G.; Shen, Y.F.; Liu, X. First report of Fusarium tricinctum causing leaf blight on Amorphophallus konjac in hunan province of China. Plant Dis. 2023, 108, 228. [Google Scholar] [CrossRef]
  4. Oksel, C.; Avin, F.A.; Liyanapathiranage, P.; Shreckhise, J.; Baysal-Gurel, F. First report of Achromobacter xylosoxidans causing bacterial stem and leaf blight on Cyrilla arida in Tennessee and the United States. Plant Dis. 2024, 108, 1094. [Google Scholar] [CrossRef] [PubMed]
  5. Al-Qasab, G.H.; Rasheed, J.H. Regeneration of cowpea Vigna radiata L. plant from cell suspension. J. Res. Appl. Sci. Biotechnol. 2023, 2, 179–185. [Google Scholar] [CrossRef]
  6. Panggabean, N.H.; Panggabean, N.H.; Nurwahyuni, I.; Elimasni; Basyuni, M. Somatic embryogenesis of oil palm (Elaeis guineensis jacq.) from bud explants using suspension culture. OnLine J. Biol. Sci. 2023, 23, 236–242. [Google Scholar] [CrossRef]
  7. Makowski, W.; Królicka, A.; Tokarz, B.; Szopa, A.; Ekiert, H.; Tokarz, K.M. Temporary immersion bioreactors as a useful tool for obtaining high productivity of phenolic compounds with strong antioxidant properties from Pontechium maculatum. Plant Cell Tissue Organ Cult. 2023, 153, 525–537. [Google Scholar] [CrossRef]
  8. Kim, J.-H.; Han, J.-E.; Murthy, H.N.; Kim, J.-Y.; Kim, M.-J.; Jeong, T.-K.; Park, S.-Y. Production of secondary metabolites from cell cultures of Sageretia thea (osbeck) M.C. Johnst. using balloon-type bubble bioreactors. Plants 2023, 12, 1390. [Google Scholar] [CrossRef] [PubMed]
  9. Kochan, E.; Szymańska, G.; Kwiatkowski, P.; Sienkiewicz, M. Linalool as a novel natural factor enhancing ginsenoside production in hairy root cultures of American ginseng. Plant Cell Tiss Organ Cult. 2023, 153, 285–293. [Google Scholar] [CrossRef]
  10. Li, D.; Mohammadi, M.A.; Qin, Y.; Zhang, Z. Somatic embryogenesis and indirect in vitro plant regeneration in Amorphophallus konjac K. Koch by one-step seedling formation. Horticulturae 2021, 7, 497. [Google Scholar] [CrossRef]
  11. Oktavia, G.A.E.; Junairiah, J.; Manuhara, Y.S.W. Amorphophallus muelleri blume shoot induction on different media types and plant growth regulator combinations. AGRIVITA J. Agric. Sci. 2024, 46, 458–469. [Google Scholar] [CrossRef]
  12. Krasniqi, D.L.; Kocaoğlu, B.; İşleyen, K.; Uras, D.; Yılmaz, E.; Ünek, C.; Nikerel, E.; Özdemir, B.S. Scaling up plant molecular farming via bioprocessing of plant cell suspension culture. In Applications of Plant Molecular Farming; Springer: Singapore, 2024; pp. 163–189. [Google Scholar]
  13. Huiban, F.A.; Roberta, T.M.; Camen, D.D.; Camelia, T. Bioreactors–a new biotechnological tool for standardized production of plant bioactive compounds. J. Hortic. For. Biotechnol. 2023, 27, 93–98. [Google Scholar]
  14. Chua, M.; Chan, K.; Hocking, T.J.; Williams, P.A.; Perry, C.J.; Baldwin, T.C. Methodologies for the extraction and analysis of konjac glucomannan from corms of Amorphophallus konjac K. Koch. Carbohydr. Polym. 2012, 87, 2202–2210. [Google Scholar] [CrossRef]
  15. Murthy, H.N.; Joseph, K.S.; Paek, K.Y.; Park, S.Y. Bioreactor systems for micropropagation of plants: Present scenario and future prospects. Front. Plant Sci. 2023, 14, 1159588. [Google Scholar] [CrossRef]
  16. Hwang, H.-D.; Kwon, S.-H.; Murthy, H.N.; Yun, S.-W.; Pyo, S.-S.; Park, S.-Y. Temporary immersion bioreactor system as an efficient method for mass production of in vitro plants in horticulture and medicinal plants. Agronomy 2022, 12, 346. [Google Scholar] [CrossRef]
  17. De Carlo, A.; Tarraf, W.; Lambardi, M.; Benelli, C. Temporary immersion system for production of biomass and bioactive compounds from medicinal plants. Agronomy 2021, 11, 2414. [Google Scholar] [CrossRef]
  18. Ozyigit, I.I.; Dogan, I.; Hocaoglu-Ozyigit, A.; Yalcin, B.; Erdogan, A.; Yalcin, I.E.; Cabi, E.; Kaya, Y. Production of secondary metabolites using tissue culture-based biotechnological applications. Front. Plant Sci. 2023, 14, 1132555. [Google Scholar] [CrossRef]
  19. Yaganza, E.S.; Tweddell, R.J.; Arul, J. Postharvest application of organic and inorganic salts to control potato (Solanum tuberosum L.) storage soft rot: Plant tissue-salt physicochemical interactions. J. Agric. Food Chem. 2014, 62, 9223–9231. [Google Scholar] [CrossRef]
  20. Nie, J.; Pan, Y.; Shi, J.; Guo, Y.; Yan, Z.; Duan, X.; Xu, M. A comparative study on the uptake and toxicity of nickel added in the form of different salts to maize seedlings. Int. J. Environ. Res. Public Health 2015, 12, 15075–15087. [Google Scholar] [CrossRef]
  21. Ansari, S.A.; Singh, S.; Rani, A. Inorganic salts influence IAA ionization and adventitious rhizogenesis in Pongamia pinnata. J. Plant Physiol. 2004, 161, 117–120. [Google Scholar] [CrossRef]
  22. Lukatkin, A.; Mokshin, E.; Bolshakova, E.; Da Silva, J. Effects of inorganic salts concentration and alternative plant growth regulators on the in vitro organogenesis of a new hybrid Cymbidium. BTA 2019, 100, 279–288. [Google Scholar] [CrossRef]
  23. Gaspar, T.; Kevers, C.; Penel, C.; Greppin, H.; Reid, D.M.; Thorpe, T.A. Plant hormones and plant growth regulators in plant tissue culture. In Vitro Cell. Dev. Biol.-Plant 1996, 32, 272–289. [Google Scholar] [CrossRef]
  24. Wei, K.; Ruan, L.; Wang, L.; Cheng, H. Auxin-induced adventitious root formation in nodal cuttings of Camellia sinensis. IJMS 2019, 20, 4817. [Google Scholar] [CrossRef]
  25. Ivanchenko, M.G.; Den Os, D.; Monshausen, G.B.; Dubrovsky, J.G.; Bednářová, A.; Krishnan, N. Auxin increases the hydrogen peroxide (H2O2) concentration in tomato (Solanum Lycopersicum) root tips while inhibiting root growth. Ann. Bot. 2013, 112, 1107–1116. [Google Scholar] [CrossRef]
  26. Parrotta, L.; Faleri, C.; Del Duca, S.; Cai, G. Depletion of sucrose induces changes in the tip growth mechanism of tobacco pollen tubes. Ann. Bot. 2018, 122, 23–43. [Google Scholar] [CrossRef] [PubMed]
  27. Cheng, S.; Liu, Y.; Su, L.; Liu, X.; Chu, Q.; He, Z.; Zhou, X.; Lu, W.; Jiang, C.; Zheng, W. Physiological, anatomical and quality indexes of root tuber formation and development in chayote (Sechium edule). BMC Plant Biol. 2023, 23, 413. [Google Scholar] [CrossRef] [PubMed]
  28. Castillo, S.E.; Tovar, J.C.; Shamin, A.; Gutirerrez, J.; Pearson, P.; Gehan, M.A. A protocol for Chenopodium quinoa pollen germination. Plant Methods 2022, 18, 65. [Google Scholar] [CrossRef]
  29. La, D.; Psa, F.; Bmm, D.; Alm, A.; Fg, S.; Rg, A.; Ps, P.; Ar, N. The impact of carbon source on cell growth and the production of bioactive compounds in cell suspensions of Hancornia speciosa Gomes. Sci. Rep. 2021, 11, 24315. [Google Scholar] [CrossRef]
  30. ‘Aizat Norhisham, D.; Md Saad, N.; Ahmad Usuldin, S.R.; Vayabari, D.A.G.; Ilham, Z.; Ibrahim, M.F.; Show, P.-L.; Wan-Mohtar, W.A.A.Q.I. Performance of Malaysian kenaf Hibiscus cannabinus callus biomass and exopolysaccharide production in a novel liquid culture. Bioengineered 2023, 14, 2262203. [Google Scholar] [CrossRef]
  31. Waresindo, W.X.; Priyanto, A.; Sihombing, Y.A.; Hapidin, D.A.; Edikresnha, D.; Aimon, A.H.; Suciati, T.; Khairurrijal, K. Konjac glucomannan-based hydrogels with health-promoting effects for potential edible electronics applications: A mini-review. Int. J. Biol. Macromol. 2023, 248, 125888. [Google Scholar] [CrossRef]
  32. Ueno, H.; Haraguchi, N.; Azuma, M.; Shiiya, T.; Noda, T.; Ebihara, E.; Uehira, Y.; Uchida, T.; Sasaba, K.; Nakamura, M.; et al. Active consumption of konjac and konjac products improves blood glucose control in patients with type 2 diabetes mellitus. J. Am. Nutr. Assoc. 2023, 42, 123–129. [Google Scholar] [CrossRef]
  33. Sakamoto, A.; Uzuhashi, S.; Hoshi, H.; Kubota, M.; Horie, H.; Kakishima, M. First report of rust caused by Puccinia paullula on Monstera deliciosa and M. adansonii in Japan. Plant Dis. 2023, 107, 570. [Google Scholar] [CrossRef]
  34. Pereira, J.; Mouazen, A.M.; Foo, M.; Ahmed, H. A framework of artificial light management for optimal plant development for smart greenhouse application. PLoS ONE. 2021, 16, e0261281. [Google Scholar] [CrossRef] [PubMed]
  35. Meng, L.; Van Labeke, M.-C.; Höfte, M. Timing of light quality affects susceptibility to Botrytis cinerea in strawberry leaves. J. Photochem. Photobiol. B Biol. 2020, 211, 111988. [Google Scholar] [CrossRef]
  36. Yan, A.; Chen, Z. The control of seed dormancy and germination by temperature, light and nitrate. Bot. Rev. 2020, 86, 39–75. [Google Scholar] [CrossRef]
  37. Maurya, J.P.; Bhalerao, R.P. Photoperiod- and temperature-mediated control of growth cessation and dormancy in trees: A molecular perspective. Ann. Bot. 2017, 120, 351–360. [Google Scholar] [CrossRef]
  38. Adams, S.R.; Langton, F.A. Photoperiod and plant growth: A review. J. Hortic. Sci. Biotechnol. 2005, 80, 2–10. [Google Scholar] [CrossRef]
  39. Ochieno, D.M.W. Soil microbes determine outcomes of pathogenic interactions between Radopholus similis and Fusarium oxysporum V5w2 in tissue culture banana rhizospheres starved of nitrogen, phosphorus, and potassium. Front. Sustain. Food Syst. 2022, 6, 706072. [Google Scholar] [CrossRef]
  40. Hanrahan-Tan, D.G.; Henderson, L.; Kertesz, M.A.; Lilje, O. The effects of nitrogen and phosphorus on colony growth and zoospore characteristics of soil chytridiomycota. J. Fungi 2022, 8, 341. [Google Scholar] [CrossRef] [PubMed]
  41. Georgiev, V.; Berkov, S.; Georgiev, M.; Burrus, M.; Codina, C.; Bastida, J.; Ilieva, M.; Pavlov, A. Optimized nutrient medium for galanthamine production in Leucojum aestivum L. in vitro shoot system. Z. Naturforschung C 2009, 64, 219–224. [Google Scholar] [CrossRef]
  42. Yang, S.; Tao, J.; Liu, X.; Guo, D.; Zheng, J. Effects of carbon source and nitrogen source on callus growth and flavonoid content in Glycyrrhiza uralensis. Chin. J. Chin. Mater. Med. 2006, 31, 1857–1859. [Google Scholar]
  43. García-Ramírez, Y. Temporary immersion system for biomass production of Salvia spp.: A mini-review. Methods Mol. Biol. 2024, 2759, 217–225. [Google Scholar] [CrossRef] [PubMed]
  44. Pérez-Caselles, C.; Burgos, L.; Sánchez-Balibrea, I.; Egea, J.A.; Faize, L.; Martín-Valmaseda, M.; Bogdanchikova, N.; Pestryakov, A.; Alburquerque, N. The effect of silver nanoparticle addition on micropropagation of apricot cultivars (Prunus armeniaca L.) in semisolid and liquid media. Plants 2023, 12, 1547. [Google Scholar] [CrossRef]
  45. Motolinía-Alcántara, E.A.; Castillo-Araiza, C.O.; Rodríguez-Monroy, M.; Román-Guerrero, A.; Cruz-Sosa, F. Engineering considerations to produce bioactive compounds from plant cell suspension culture in bioreactors. Plants 2021, 10, 2762. [Google Scholar] [CrossRef] [PubMed]
  46. Pożoga, M.; Olewnicki, D.; Wójcik-Gront, E.; Latocha, P. An Efficient method of Pennisetum × advena “Rubrum” plantlets production using the temporary immersion bioreactor systems and agar cultures. Plants 2023, 12, 1534. [Google Scholar] [CrossRef]
Figure 1. Work model of konjac micro-corm production by liquid and bioreactor culture.
Horticulturae 11 00235 g001
Figure 2. Effects of hormones, sucrose, and inoculation amounts on the adventitious shoot induction from konjac callus. (ae) The morphology characteristics of induced adventitious shoots under different 6-BA (a,b), NAA (c) (The red arrow points to the konjac micro-corm), and sucrose (d) concentrations, and inoculation amounts (e). The scale bars beside each figure represented 1 cm. (f,g) The effect of sucrose concentration (f) and inoculation amounts (g) on the number of adventitious shoots (buds per culture vessel, columns) and fresh weight (yellow line charts) of adventitious shoots. Data represent the mean values ± SE. The blue letters in the figure indicate significant differences in the bar chart (p < 0.05), while the yellow letters indicate significant differences in the line chart (p < 0.05).
Horticulturae 11 00235 g002
Figure 3. Comparison of solid and liquid culture processes in the induction of adventitious shoots from konjac callus. (a) The morphology characteristics of induced adventitious shoots under solid (upper line) and liquid (bottom line) culture at 0, 6, 12, 18, 24, and 30 days. The scale bars beside each figure represented 1 cm. (b) The relative growth rate of induced adventitious shoots under solid (pink line) and liquid (blue line) culture at 0, 6, 12, 18, 24, and 30 days. Data represent the mean values ± SE. The pink letters represent significant differences in the relative growth rate of solid culture (p < 0.05), while the blue letters represent significant differences in the relative growth rate of liquid culture (p < 0.05).
Horticulturae 11 00235 g003
Figure 4. Effects of hormones and inorganic salt concentration on the adventitious root formation of konjac. (a) The morphology characteristics of induced adventitious roots under different inorganic salt concentrations (medium supplemented with 1.0 mg/L 6-BA and 0.5 mg/L NAA). The scale bars beside each figure represented 1 cm. (b,c) The effect of IBA (b) and NAA (c) on the length (pink columns) and number (roots per culture vessel, blue columns) of adventitious roots. Data represent the mean values ± SE. The pink letters represent significant differences in root length (p < 0.05), while the blue letters represent significant differences in root number (p < 0.05). The morphology characteristics of longest (1) and shortest (2) roots under IBA (b) and NAA (c) treatments.
Horticulturae 11 00235 g004
Figure 5. Effects of hormones and sucrose concentration on the micro-corm generation of konjac. (a) The morphology characteristics of the adventitious shoot and root (indicated by the upper and lower red arrows, respectively). The scale bars beside each figure represented 1 cm. (b,g) The morphology characteristics of induced micro-corms under different hormone ratios (b) and sucrose (g). The scale bars beside each figure represented 1 cm. (cf): Effect of 6-BA (c), NAA (d), KT (e), and sucrose (f) concentration on the fresh weight and number of induced micro-corms. Data represent the mean values ± SE. The blue letters in the figure indicate significant differences in the bar chart (p < 0.05), while the yellow letters indicate significant differences in the line chart (p < 0.05).
Horticulturae 11 00235 g005
Figure 6. Effects of inoculation amounts, photoperiod, and shaker speed on the micro-corm generation of konjac. (a,c,e) The morphology characteristics of induced micro-corms under different inoculation amounts (a), photoperiods (c), and shaker speeds (e). The scale bars beside each figure represented 1 cm. (b,d,f) Effect of inoculation amount (a), photoperiod (c), and shaker speed (e) on the fresh weight and relative growth rate of induced micro-corms. Data represent the mean values ± SE. The blue letters in the figure indicate significant differences in the bar chart (p < 0.05), while the yellow letters indicate significant differences in the line chart (p < 0.05).
Horticulturae 11 00235 g006
Figure 7. Effect of nitrogen and phosphorus ratio on the morphology of induced micro-corms. The scale bars beside each figure represent 1 cm.
Horticulturae 11 00235 g007
Figure 8. Bioreactor-based scale-up culture of micro-corms. (a) A diagram of a spherical bioreactor (a: air compressor, b: air reservoir, c: air cooling device, d: air filter system, e: air dryer, f: air flow meter, g: membrane filter, h: air intake, i: vent, j: pre-filter, and k: vent). (b) The morphology characteristics of micro-corms under different liquid volumes at the initial (0 d) and final (31 d) stages of bioreactor-based inoculation. The scale bars beside each figure represent 1 cm. (c) Effects of liquid volumes on fresh weight of konjac. Data represent the mean values ± SE. The blue letters in the figure indicate significant differences in the bar chart (p < 0.05).
Horticulturae 11 00235 g008
Figure 9. Starch staining experiment. The red circle highlights the original material.
Horticulturae 11 00235 g009
Table 1. The design of inorganic salt concentration, IBA concentration, and NAA concentration level.
LevelIBA (mg/L)NAA (mg/L)Inorganic Salt (mg/L)
10.31.01/2MS
20.51.53/4MS
30.72.0MS
Table 2. The 6-BA, NAA and KT concentration level design.
Level6-BA (mg/L)NAA (mg/L)KT (mg/L)
11.00.50.4
21.51.00.6
32.01.50.8
Table 3. Effects of nitrogen and phosphorus concentrations on micro-corm induction.
GroupLevelFactor Concentration (mmol/L)Increase in Fresh Weight (g)Relative Growth Rate (g/d)
NH4NO3KNO3Nitrogen
Nitrogen15.24.7153.13 ± 0.02 f0.001
210.39.4304.54 ± 0.06 d0.0138
315.514.1455.62 ± 0.01 c0.021
420.618.8605.98 ± 0.05 b0.023
530.928.2906.31 ± 0.04 a0.025
641.237.61204.03 ± 0.03 e0.010
NO3/NH4+11:14.78 ± 0.02 e0.016
22:17.21 ± 0.03 a0.029
33:16.31 ± 0.12 b0.025
44:16.02 ± 0.16 c0.023
55:15.70 ± 0.04 d0.021
690:01.81 ± 0.09 f−0.020
KH2PO410.252.19 ± 0.09 d−0.010
20.53.20 ± 0.03 c0.002
30.755.23 ± 0.05 b0.019
41.07.01 ± 0.27 a0.029
51.256.89 ± 0.15 a0.028
61.54.91 ± 0.31 b0.016
Data represent the mean values ± SE. Different letters indicate significant differences (p < 0.05).
Table 4. The nitrogen and phosphorus concentration orthogonal design.
LevelNH4NO3 (mmol/L)KNO3 (mmol/L)KH2PO4 (mmol/L)
110.39.40.75
215.514.11.0
320.618.81.25
Table 5. The impact of 6-BA and NAA concentration on bud and fresh weight in bud induction.
6-BA
(mg/L)
NAA
(mg/L)
Induction Rate
(%)
Number of Bud (nuo)Fresh Weight
(g)
Bud Morphology
0.5 91.0 ± 0.07 e10 ± 0.12 a1.67 ± 0.10 cA higher number of bud spots, tender, with no obvious micro-corm formation
1.0 98.7 ± 0.02 a8 ± 0.02 b2.09 ± 0.03 aThe number of bud spots is moderate, but the bud spots are generally more mature, conducive to the next step of differentiation.
1.5 93.8 ± 0.02 d3 ± 0.04 e1.88 ± 0.03 bThe number of bud spots is relatively low, and the growth is slow.
2.0 95.2 ± 0.04 c2 ± 0.14 f1.45 ± 0.02 deFew bud spots, and the buds are immature.
2.5 96.4 ± 0.01 b5 ± 0.05 b1.52 ± 0.11 dNumerous bud spots with obvious micro-corm growth, exhibiting signs of aging.
3.0 90.3 ± 0.03 f6 ± 0.07 c1.36 ± 0.06 eSmall and numerous bud spots, with no obvious micro-corm formation.
10.510028.01 ± 0.05 a4.09 ± 0.09 aMany bud spots, and there is obvious konjac formation below the bud spots
11.01006.00 ± 0.21 c2.78 ± 0.15 cFew bud spots, but the Amorphophallus are larger and more pronounced.
11.510016.53 ± 0.16 b3.32 ± 0.14 bNumerous bud spots, but no obvious formation of konjac.
Data represent the mean values ± SE. Different letters indicate significant differences (p < 0.05).
Table 6. Orthogonal table range analysis of inorganic salt concentration, IBA concentration, and NAA concentration.
Experiment NumberIBA
A
NAA
B
Inorganic Salt
C
Root Length
(cm)
Number of Roots
(nuo)
111121.2120.17
212215.3215.54
31336.3510.75
42138.5218.01
522124.1916.45
623217.2812.38
731213.7414.83
83234.638.96
933120.789.15
Root length
K142.8843.4766.18
K249.9944.1446.32
K332.9444.4119.50
R3.610.3115.56
Primary and secondary factorsC > A > B
Optimal combinationA2B3C1
Number of roots
K146.4653.0145.77
K246.8446.8242.75
K342.9432.3837.72
R1.36.882.68
Primary and secondary factorsB > C > A
Optimal combinationA2B1C1
Table 7. Variance analysis of root length and root number results of inorganic salt concentration, IBA concentration, and NAA concentration.
GroupSourceSum of SquaresdfMean SquareFSig.Significance
Root lengthA15.90627.95335.4610.118
B0.08620.0430.1910.850
C236.2732118.136526.7670.031*
Error0.22410.224
Total1891.4588
Total corrected344.6667
Number of rootsA41.794220.897176.1470.006**
B72.261236.130304.5540.003**
C11.02525.51246.4660.021*
Error0.23720.119
Total1896.0439
Total corrected125.3178
* and ** indicate the significant (p < 0.05 and p < 0.01) relationships, respectively.
Table 8. Orthogonal table range analysis of 6-BA concentration, NAA concentration, and KT concentration.
Experiment Number6-BA
A
NAA
B
KT
C
Fresh Weight
(g)
Number of Micro-Corm
(nuo)
11117.317.23
21226.288.79
31339.527.09
42138.6712.41
52217.9010.53
623210.5415.87
73129.3219.90
83239.6518.16
933111.4219.66
Fresh weight
K123.1125.3026.63
K227.1123.8326.14
K330.3931.4827.84
R2.432.550.57
Primary and secondary factorsB > A > C
Optimal combinationA3B3C3
Number of micro-corms
K123.1139.5437.42
K238.8137.4844.56
K357.7242.6237.66
R11.531.712.38
Primary and secondary factorsA > C > B
Optimal combinationA3B3C2
Table 9. Variance analysis of fresh weight and number of micro-corms of 6-BA concentration, NAA concentration and KT concentration.
GroupSourceSum of SquaresdfMean SquareFSig.Significance
Fresh weightA10.98625.49349.6510.020*
B8.86224.43140.0510.024*
C0.51020.2552.3070.302
Error0.22120.111
Total742.5779
Total corrected20.5808
Number of micro-cormsA4.46122.2311.5870.387
B200.2142100.10771.2140.014*
C10.96125.4803.8990.204
Error2.81121.406
Total1808.8629
Total corrected218.4488
* Indicates the significant (p < 0.05) relationships.
Table 10. Orthogonal table range analysis of nitrogen and phosphorus.
Experiment NumberNH4NO3
A
KNO3
B
KH2PO4
C
Increase in Fresh Weight (g)
11118.34
21227.39
31336.54
421310.32
522111.10
62327.09
73126.13
83239.21
93316.64
Increase in fresh weight
K122.2724.7926.08
K228.5127.7020.61
K321.9820.2726.07
R2.182.481.82
Primary and secondary factorsB > A > C
Optimal combinationA2B2C1
Table 11. Variance analysis of the increase in fresh weight of nitrogen and phosphorus.
SourceSum of SquaresdfMean SquareFSig.Significance
A9.07424.53769.3580.014*
B9.34524.67271.4310.014*
C6.63723.31850.7330.019*
Error0.13120.065
Total613.4109
Total corrected25.1868
* Indicates the significant (p < 0.05) relationships.
Disclaimer/Publisher’s Note: The statements, opinions and data contained in all publications are solely those of the individual author(s) and contributor(s) and not of MDPI and/or the editor(s). MDPI and/or the editor(s) disclaim responsibility for any injury to people or property resulting from any ideas, methods, instructions or products referred to in the content.

