Abstract
The drip emitter is a fundamental component of the drip irrigation system, and its performance directly influences the efficiency of water–fertilizer–gas (WFG) coupling irrigation. However, the precise mechanism through which WFG coupling affects emitter clogging and system uniformity remains unclear. To address this, this study conducted a hydraulic performance test of the drip irrigation system based on micro-nano aerated drip irrigation technology. The clogging patterns of emitters and system uniformity were compared and analyzed under non-aerated drip irrigation and WFG coupling drip irrigation conditions. The results indicate that WFG coupling significantly alters the micromorphological structure and microbial diversity of clogged emitters. This change reduces clogging and can delay the clogging process of different types of emitters, thereby extending their service life by up to 29%. Additionally, it effectively improves the uniformity of the drip irrigation system. These findings highlight the potential of WFG coupling as an effective strategy to mitigate emitter clogging and optimize drip irrigation system performance.
1. Introduction
As technology advances and the needs of irrigated agriculture evolve, modern agricultural water use is shifting from a reliance on single water-saving techniques to an integrated approach. This approach encompasses a variety of agricultural technologies and the holistic management of multiple factors, including water, fertilizer, and air. WFG coupling drip irrigation represents a novel approach to water conservation in agricultural applications. This method aims to provide optimal conditions for crop growth, modulating the rhizosphere soil environment, thereby enhancing the synergistic effects of water, fertilizer, gas, and soil throughout the crop growth process [1]. Research indicates that this method could not only enhance the dissolved oxygen content in irrigation water, ameliorate water quality, and improve soil permeability [2] but also enhances the fertilizer use efficiency [3] and facilitates water and yield conservation in crops [4,5]. Additionally, it removes suspended particles from irrigation water, reduces surface chemical precipitation, and alters the microbial diversity of clogging materials [6], demonstrating clear technical advantages and promising application prospects.
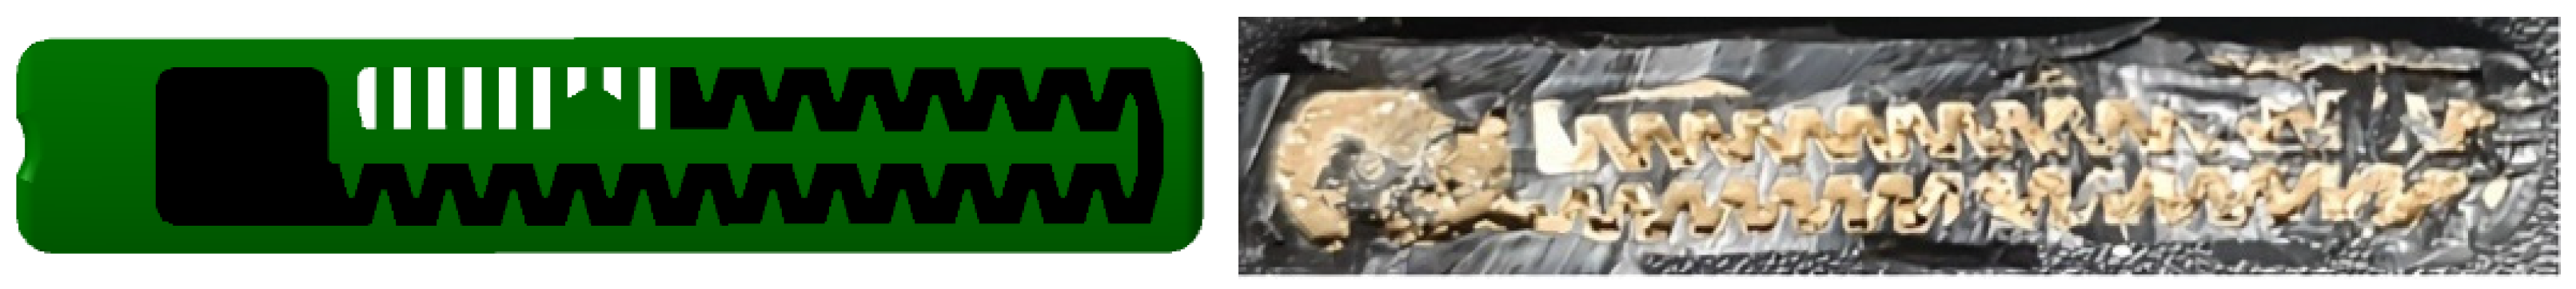
Emitters, which are integral to the drip irrigation system, are associated with the system’s overall performance. To facilitate energy dissipation, the internal flow channels of emitters are typically relatively constricted, with a range of 0.5 to 1.2 mm [7]. Emitters of drip irrigation systems become clogged with suspended particles, chemical precipitates, and microbial byproducts, resulting in non-uniformity in the irrigation process and adversely affecting the overall efficiency and service life of the entire system [8]. Emitter clogging primarily manifests in three forms—physical, chemical, and biological—with the biological form often initiating the others [7,8]. To address this, numerous scholars have conducted extensive research in areas such as configuring filtration equipment, the chlorination and acidification of irrigation water, and improving the structure of emitters [9,10], achieving certain results. However, the chlorination and acidification of irrigation water can have impacts on the ecological environment, and the improvement of emitter structures cannot avoid the relatively narrow flow channels required within the emitters. Therefore, there is an urgent need to seek green, efficient, and feasible anti-clogging technologies and methods for emitters. The schematic diagram of the emitter structure and actual photos of clogging are shown in Figure 1.
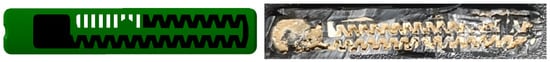
Figure 1.
Schematic diagram of the emitter structure and actual photos of clogging.
Micro-nanobubbles, with diameters ranging from 200 nm to 50 μm, possess characteristics such as strong oxidizing properties, high stability, and strong adsorption capacity [11]. When introduced into the drip irrigation system for aeration, they can delay emitter clogging [12], providing a new perspective for addressing this issue. Under WFG coupling, the introduction of gas into the drip irrigation system causes disturbances in water flow and generates two-phase gas–liquid flow, which significantly alters the viscosity of the water [13]. Additionally, the addition of fertilizer to the drip irrigation system changes water quality parameters and the concentration of suspended particles, which affects both the emitter clogging and entire system’s operation [14]. Consequently, under WFG coupling, the simultaneous presence of micro-bubbles and fertilizers makes the operation of the drip irrigation system and the mechanism of emitter clogging more complex. Against the backdrop of global climate change and resource scarcity [15], in-depth research on the performance of emitters under WFG coupling is of significant importance for improving irrigation efficiency, reducing resource waste, and protecting the environment. Therefore, based on micro-nanobubble aeration technology, this study thoroughly investigates the performance of emitters under water–fertilizer–gas coupling and its impacts on drip irrigation systems. It focuses on analyzing the clogging patterns of emitters, system uniformity, and characteristics of clogging materials, and explores the potential of micro-nanobubble aeration in preventing emitter clogging, thereby providing a theoretical basis for enhancing the performance of water–fertilizer–gas coupled drip irrigation systems.
2. Materials and Methods
2.1. The Selection of Emitters
For this study, five common emitters (A–E) were chosen from the market. To avoid the influence of the emitters’ quality on the experimental results, the flow–pressure relationship and coefficient of variation of all the emitters were tested according to the ISO standard before the experiments [16]. The flow–pressure relationship of the emitters is described below:
The symbols in this formula are defined as follows:
- : emitter discharge rate, L/h;
- P: working pressure, MPa;
- : discharge coefficient;
- : behavior index.
The coefficient of variation Cv (%) for the emitters can be expressed by
The symbols in this formula are defined as follows:
- : The standard deviation of the emitter discharge rate, L/h;
- : The average of the emitter discharge rate, L/h.
The structures and performance metrics (0.1 ± 0.01 MPa) of the five test emitters are detailed in Table 1. An analysis of the data explains that emitters B and D exhibit specific pressure-compensating capabilities. Additionally, the flow regime exponents for emitters A, C, and E fall within the range of 0.46 to 0.48. In accordance with the quality grading criteria for emitters, as stipulated in the performance of all tested emitters, they are deemed to be of “excellent” quality [16].

Table 1.
Structure and performance index of test emitters.
2.2. Test Equipment
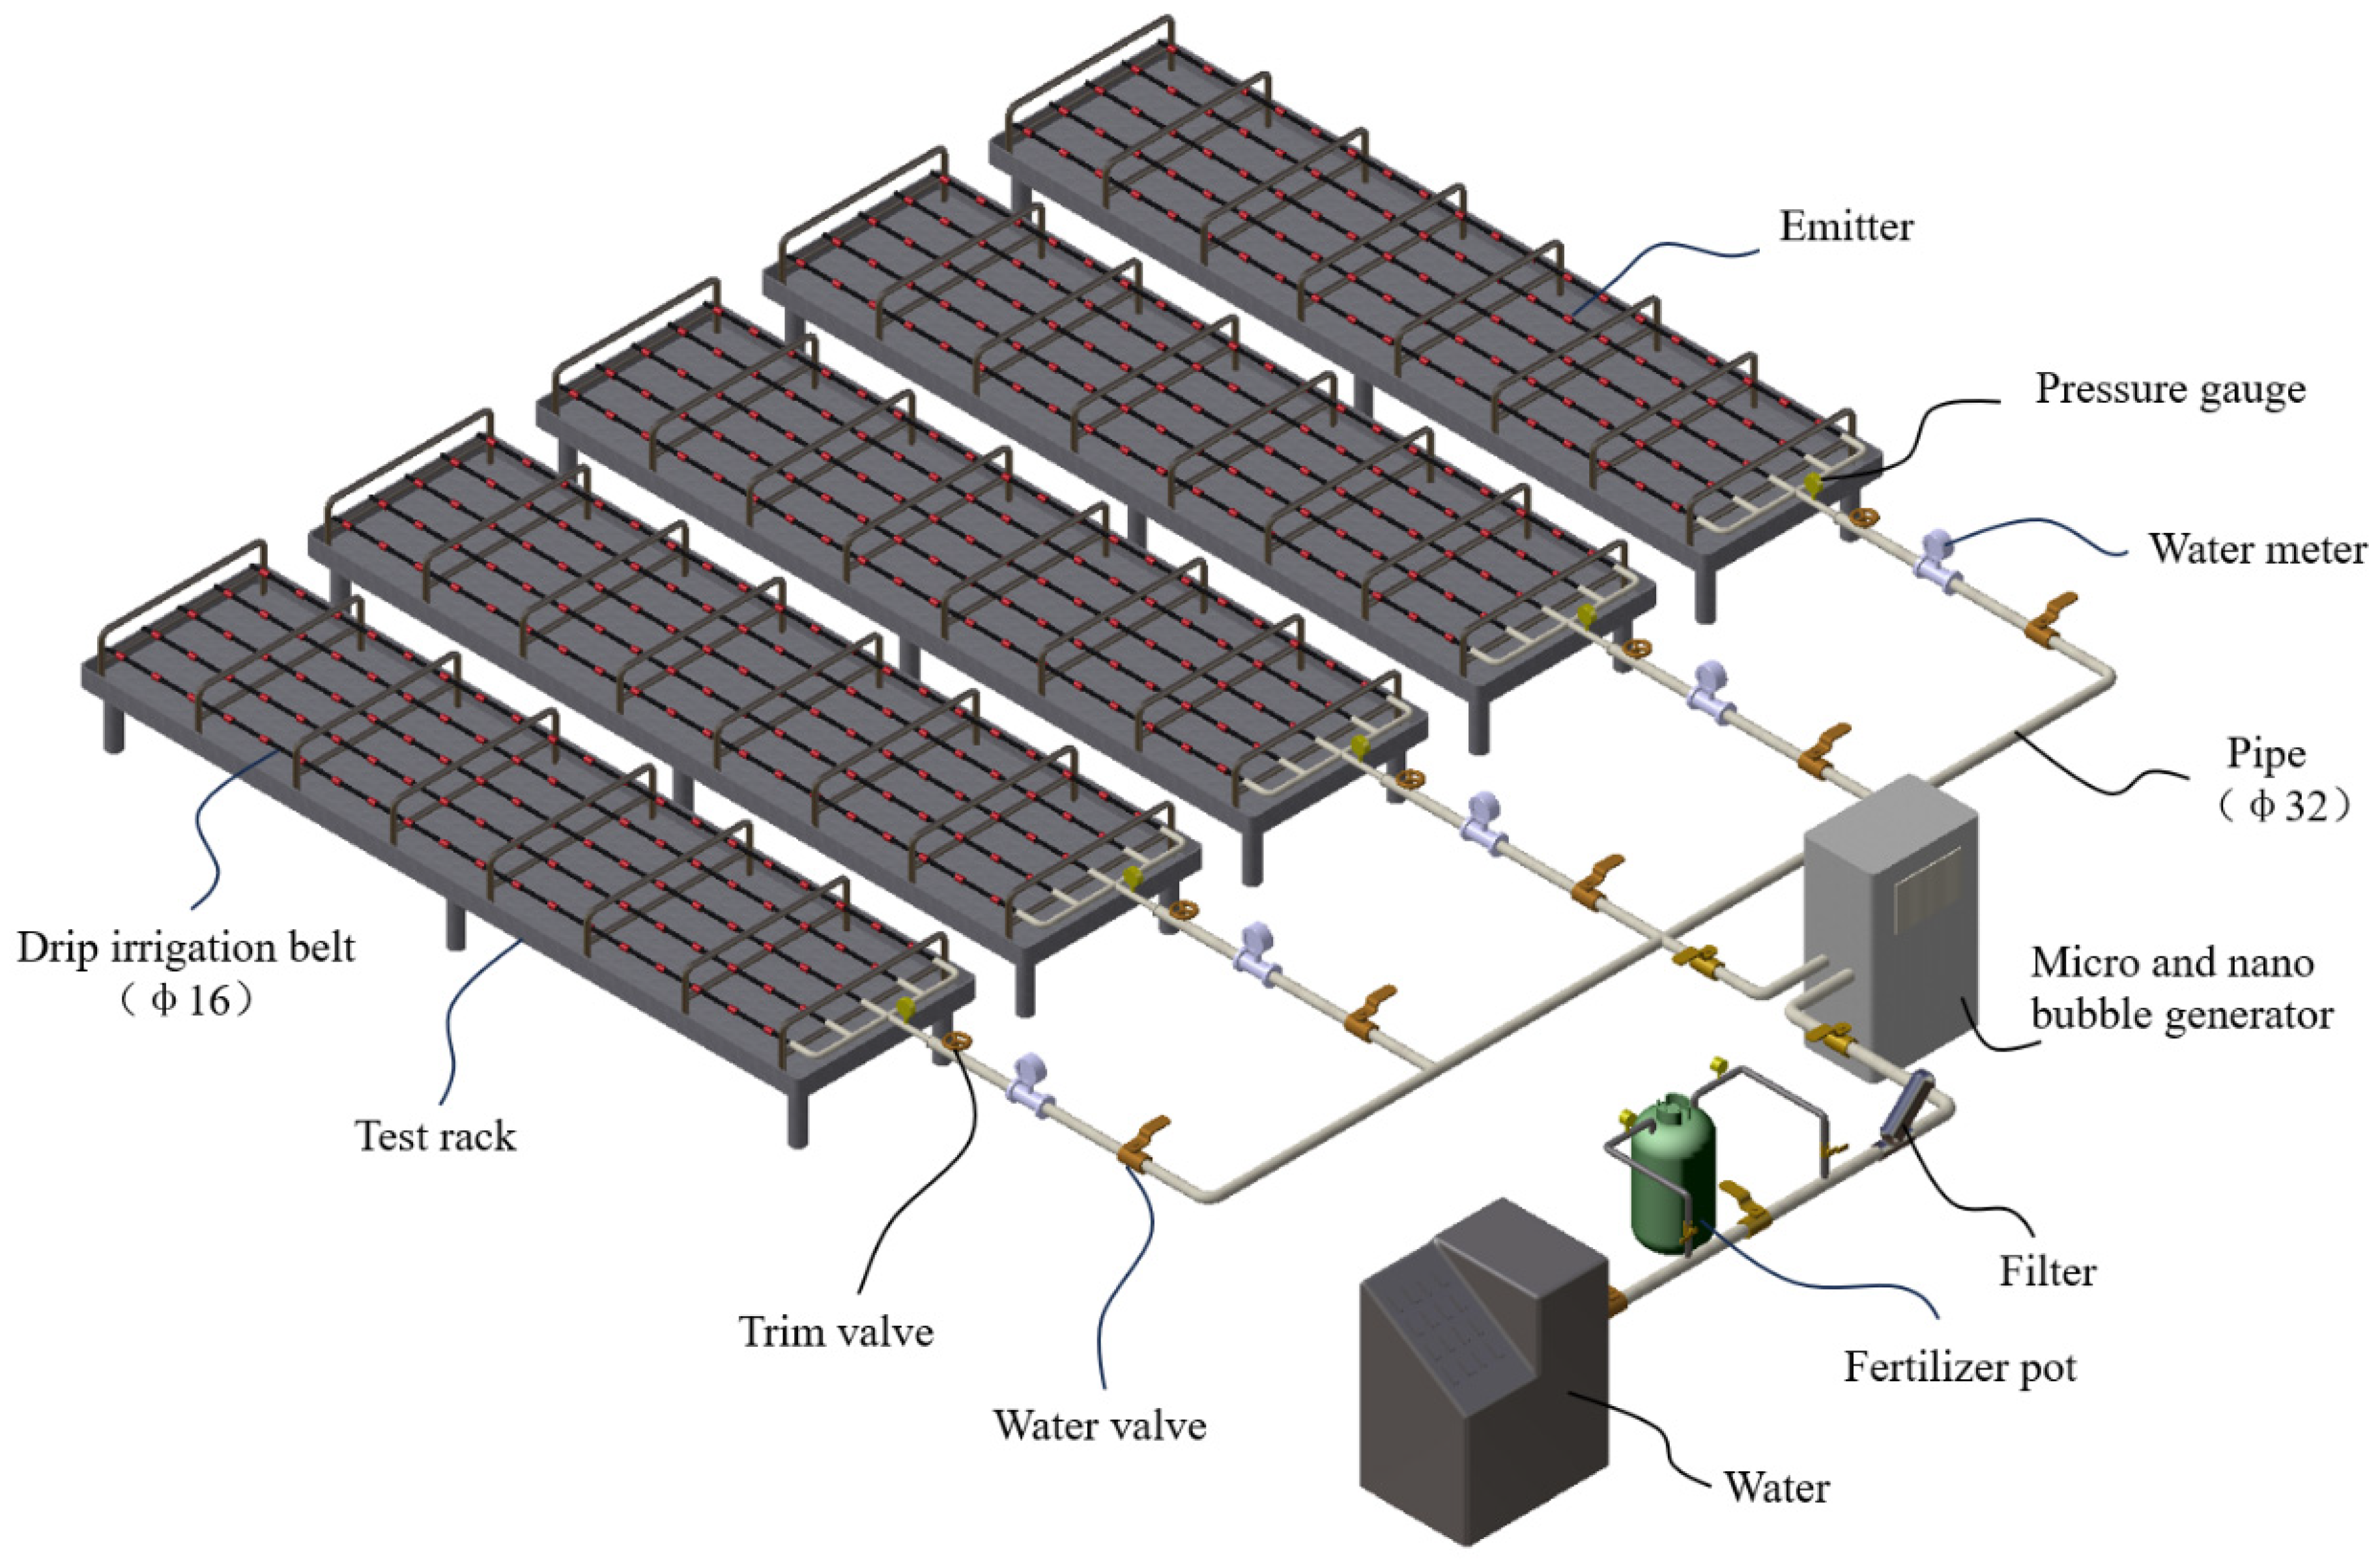
The experiment was conducted at the center of Water Saving Irrigation Equipment Testing, Institute of Agricultural-water saving, Chinese Academy of Agricultural Sciences, Xinxiang, China. To ensure the accuracy of the experimental results, an intelligent variable-frequency, constant-temperature, and constant-pressure water tank (Hebei Kedao Testing Machine Technology Co., Ltd., Xingtai, China) was used as the experimental power water source; U-PVC pipes were used as the experimental pipeline system; a turbine flowmeter (China National Instrument Co., Ltd., Beijing, China, accuracy 1.0, range 3–30 m3/h) was employed to monitor the experimental irrigation flow rate; a differential pressure fertilizer tank of 30 L (Shandong Toyota Water-saving Equipment Co., Ltd., Laiwu, China) was used for the fertilization of the drip irrigation system; to prevent impurities in the water and undissolved fertilizer particles from entering the pipeline system, a mesh filter (AZUD, 120 mesh, Murcia, Spain) was installed on the main pipeline after the fertilizer tank to avoid unrelated factors affecting the blockage of the experimental emitters; a micro-nanobubble generator (Yunnan Xia Zhi Chun Environmental Technology Co., Ltd., Kunming, China) was selected as the gas injection device. During the experiment, both the gas injection device and the fertilization device were connected to the main pipeline. When conducting the WFG coupling experiment, the gas injection device was opened for gas treatment, and when conducting the non-gas fertilization drip irrigation experiment, the gas injection device was closed; each emitter type used 5 drip irrigation tapes (each was 100 m long, with a spacing of 0.5 m between adjacent tapes) laid out in the north–south direction as the experimental pipeline network. Before the experiment, according to the principle of uniform sampling, 19 sampling points were set on each drip irrigation tape, with a total of 95 sampling points for each emitter type, and the experiment was repeated three times; the analysis was conducted by taking the average values. The schematic diagram of the water–fertilizer–gas coupling emitter performance test device is shown in Figure 2.
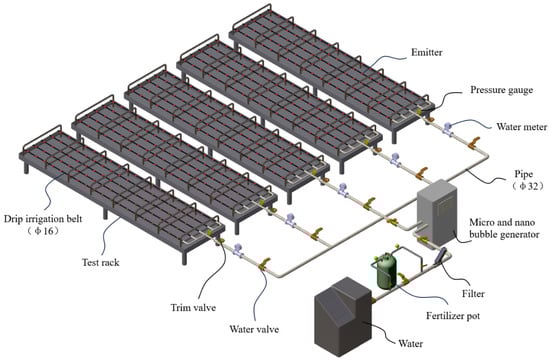
Figure 2.
Schematic diagram of water–fertilizer–gas coupling emitter performance test device.
To ensure the accuracy and applicability of the experimental results, all experiments utilized groundwater from the experimental site, and water quality parameters were monitored during the experiments, as shown in Table 2; the gas source for the experiment was air; to avoid the impact of chlorine elements in the fertilizer on the blockage of the emitters, potassium sulfate (K2SO4, potassium content ≥99%, Tianjin Fengchuan, China) was selected as the fertilizer for the WFG coupling experiment. During the experiment, a conductivity meter (SX-650, Shanghai Sanxin, China) was used to monitor the conductivity of the solution during the experiment.
Table 2.
Tested water quality parameters.
2.3. Experimental Methods
2.3.1. Experimental Design
The objective of this experiment was to investigate how WFG coupling affects the performance of various irrigation emitters. Two experimental groups were established: one with WFG coupling, and the other as a control group (conventional drip irrigation without aeration treatment). Considering the application scenarios of crop irrigation, the working pressure of the drip irrigation system for each emitter and the pressure differential at the fertilizer tank’s inlet and outlet were set at 0.1 MPa. The fertilizer amount was set at 1 kg, and the gas addition rate was 3 L/min. To monitor the clogging process in each emitter, the flow rates were measured after three-day intervals. Prior to each flow measurement, each emitter’s drip irrigation system was allowed to operate stably at the rated pressure for 30 min. Subsequently, measuring cups were positioned directly below each measurement point, and readings were taken after every five-second interval. The measuring cups were then removed in the reverse order of placement, and the volume of water in the measuring cups was measured using a measuring cylinder. Each flow measurement was repeated three times, and the average value was taken for data analysis.
2.3.2. Fertilization and Irrigation Time
The concentration of the fertilizer solution and its electrical conductivity (EC) were calibrated on a daily basis using a quadratic regression method [17]. In order to establish a mapping relationship between fertilizer concentration and EC, which was then used to calculate the fertilizer content, the time required for the pressure difference fertilizer tank to complete a fertilization process was measured prior to the commencement of the experiment. The EC of the experimental water source was initially measured, after which a 30 L solution of K2SO4 was prepared. The solution was stirred to dissolve and evenly mix the solute, and the EC was measured as the initial experimental condition. Then, the experiment was conducted, and samples were taken at the sampling port of the fertilizer tank at 0.5 min intervals, and the EC was measured, respectively. The fertilization process was considered to have ended when the EC of the sample was the same as or very close to that of the pure water. The experimental results demonstrated that the fertilization time of the fertilizer tank for different emitters did not exceed 8.5 min. The experiment was conducted for a total of 330 h, spanning 10 h per day (8:00 to 18:00). The system working pressure was maintained at 0.1 MPa.
2.3.3. Emitter Uniformity Analysis
Discharge Ratio Variation
The degree of clogging of each emitter type under the WFG coupling was calculated by the discharge ratio variation, Dra (%):
The symbols in this formula are defined as follows:
- : the i-th emitter discharge rate in blockage test, L/h;
- : the average emitter discharge rate before the test, L/h;
- n: the count of emitters under test.
The average flow rate ratio of the emitters indicates the degree of reduction in the average flow rate; the smaller the value, the greater the degree of flow rate reduction and the more severe the blockage of the emitters. Typically, a ratio of 75% or less is defined as the occurrence of a blockage in the drip emitters. The average flow rate ratio was used to represent different degrees of blockage in the emitters. When the average flow rate ratio is 95% or greater, it is defined as unblocked; from 75% to less than 95%, it is defined as slightly blocked; from 50% to less than 75%, it is defined as blocked; from 20% to less than 50%, it is defined as severely blocked; and below 20%, it is completely blocked [18].
Christiansen Uniformity Coefficient and Statistical Uniformity Coefficient
The Christiansen uniformity coefficient () and the statistical uniformity coefficient () were used to evaluate the uniformity of the drip irrigation system for each emitter type.
(1) The Christiansen uniformity coefficient:
In the formula, : Christiansen uniformity coefficient, (%); : observation value of water output for the i-th emitter, (mL); : the average of the sample; N: count of measurement points.
(2) Statistical uniformity:
In the formula, : the statistical uniformity coefficient (%); : the standard deviation of the observed values for the sample.
Sample Collection of Emitters
At the end of the clogging experiment, one clogged emitter was selected as a test sample from the same region of the front, middle, and back of three transversal lines corresponding to five types of emitters in the drip irrigation system. The samples were analyzed for the micromorphological structure of the clogging material and microbial diversity. Each sample selected from the drip line was considered a replicate, and three replicates were performed for each type of emitter under different test conditions. The samples were grouped according to the aerated and fertilized (AF) and unaerated and fertilized (NAF) drip irrigation test groups and according to the type of emitter (A–E). For example, AFA-1 indicates the first test sample of emitter A in the aeration test group. During sampling, the emitter samples were cut with sterile scissors, immediately placed in sterile bags, sealed, and stored in dry ice and a −80 °C refrigerator.
2.3.4. Micromorphological Structure and Microbial Diversity Analysis of Emitter Clogging Material
(1) A scanning electron microscope (Oxford, UK) was used to observe the clogging material of the emitters and to analyze the effect of aeration and fertilization on the micromorphological structure of different emitter clogging materials. First, the selected clogged emitters were classified and the clogging material from each emitter was extracted using the same method. The clogging materials from the front, middle, and rear emitters of each drip line were mixed as one observation object. After fixing the extracted clogging material with glutaraldehyde solution (2.5% mass fraction, electron microscopy specific, Qiao brand) for 24 h, it was washed with sterile ultrapure water. The clogging material was dehydrated with ethanol in a gradient, followed by CO2 critical point drying. After drying, the clogging material was sputtered with gold and observed with a scanning electron microscope to analyze the micromorphological structure of the clogging material from each emitter. When observed with a scanning electron microscope, several parts of the clogging material were captured; three photos were taken each time to accurately analyze the micromorphological structure of the clogging material from each emitter.
(2) The Illumina MiSeq high-throughput sequencing platform was used to analyze the microbial diversity of the emitter plug material. The clogging material was extracted synchronously with the sampling of the micromorphological structure of the emitter clogging material. The genomic DNA of the microorganisms in the clogging material was extracted using a DNA extraction kit, and the extracted DNA was detected using agarose gel electrophoresis and NanoDrop-2000. To facilitate the study of the diversity of the microbial community and species composition in the emitter clogging material, the effective sequences of DNA were clustered, and the vSEARCH software (2.0.3) [19] was used to classify sequences into multiple OTUs (Operational Taxonomic Units) based on sequence similarity. The QIIME software (2 2020.2) package was used to select representative sequences from each OTU, and all representative sequences were compared with the database to obtain the results of the microbial diversity analysis of the emitter clogging material [20].
3. Results and Analysis
3.1. Emitter Clogging Process
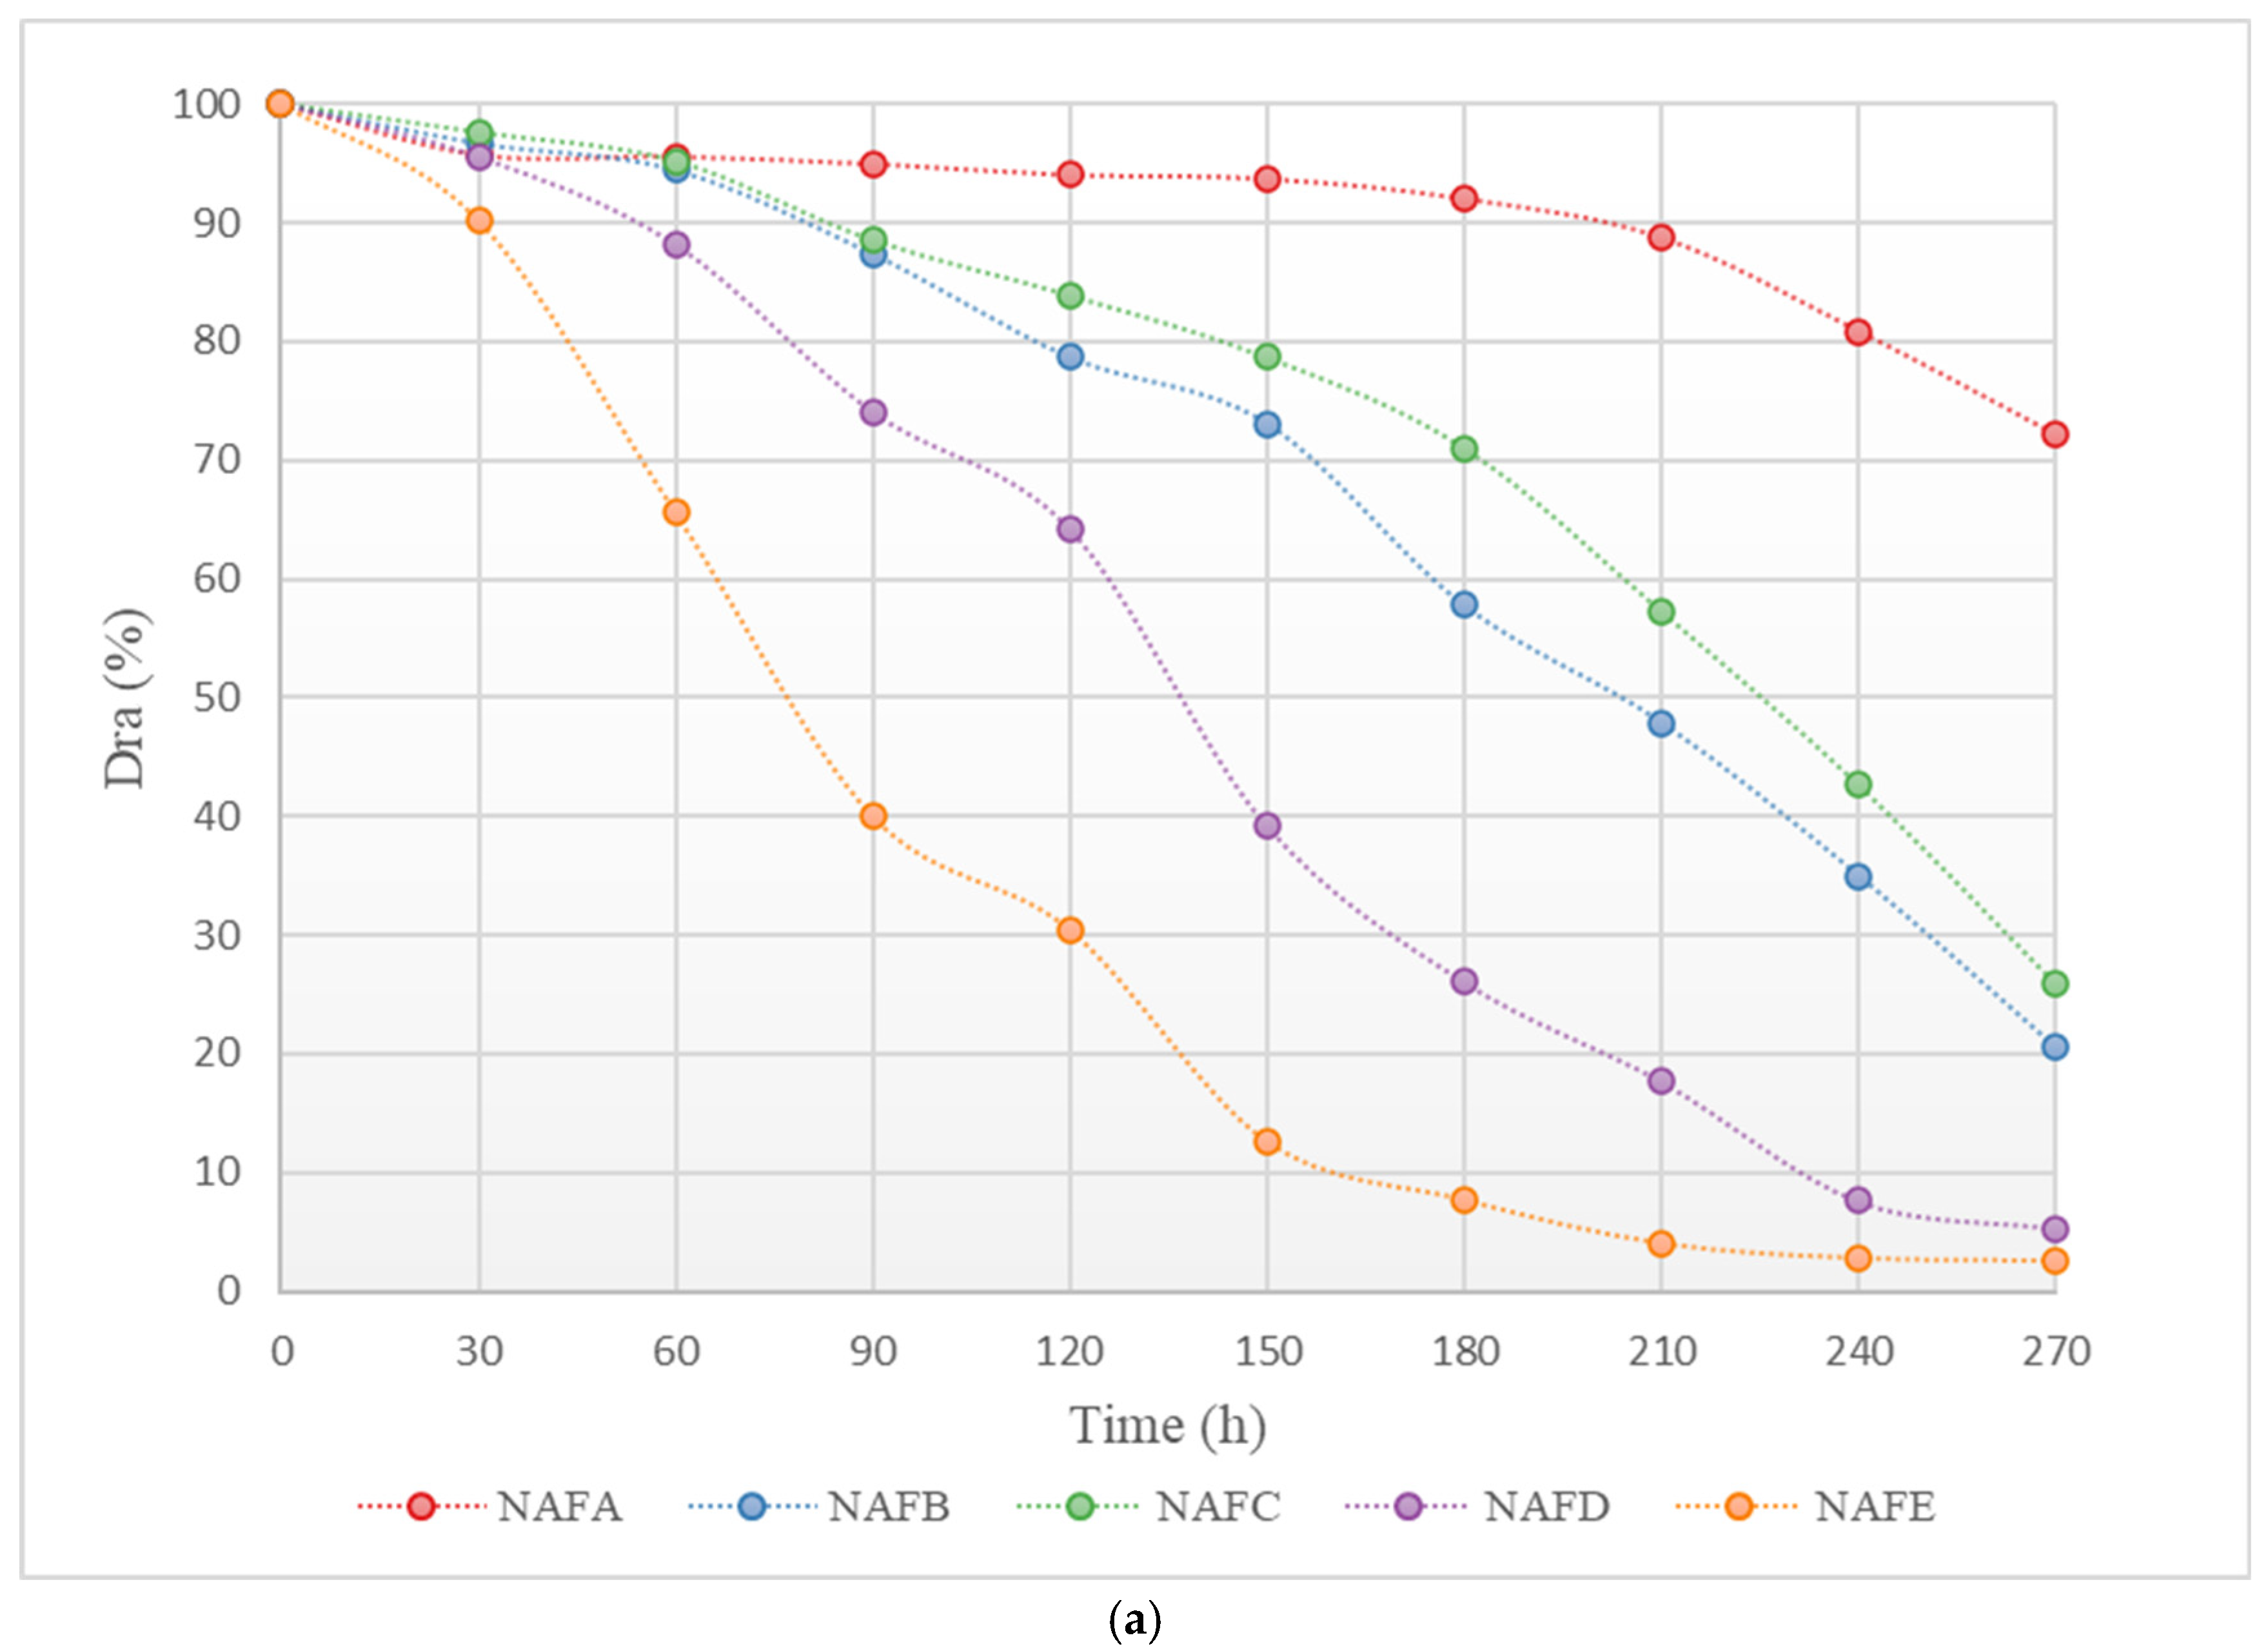
Figure 3 shows the changes in the average discharge ratio variation (Dra) of each emitter in the aerated and fertilized drip irrigation test group and the unaerated drip irrigation-fertilized test group over the experimental period. As illustrated in Figure 3, the trend of change in Dra for each emitter in both the aerated and fertilized drip irrigation test group and the unaerated drip irrigation-fertilized test group is similar: at the beginning of the experiment, the Dra of each emitter was greater than 95%, with no emitters experiencing clogging, and the decline in Dra was slight. As the Dra dropped below 95%, the emitters in both drip irrigation systems began to experience slight clogging. As the irrigation time increased, the Dra curves of each emitter gradually declined, with different rates.
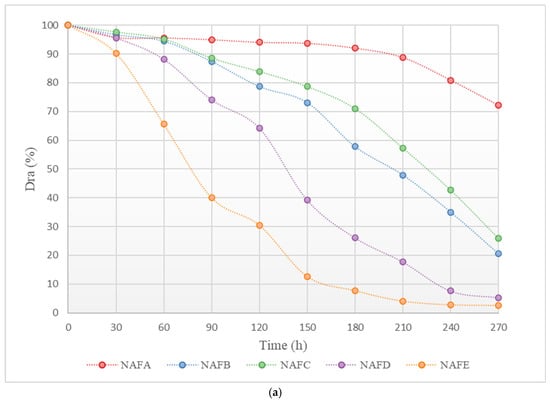
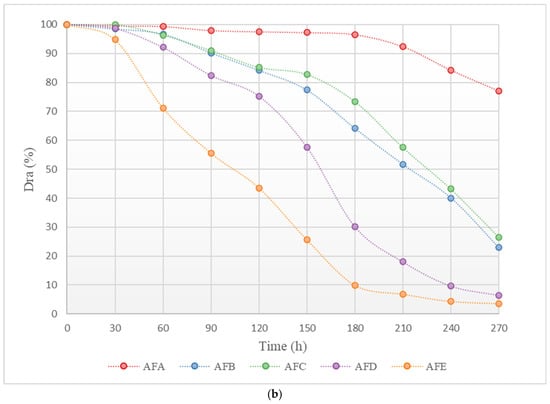
Figure 3.
Curve of the average Dra (discharge ratio variation) of the emitter as a function of test time. (a) Dra curve for each emitter in the non-aerated drip irrigation fertilizer application experimental group. (b) Dra curve for each emitter in the WFG coupling experimental group.
Under the same conditions, the clogging process of each emitter shows significant differences. Among them, the clogging process of the in-line pressure-compensating emitter A is the slowest, while the cylindrical emitter E has a relatively faster clogging process. As shown in Figure 3, the Dra curve of emitter A declines gently, and even in the later stages of the experiment, the corresponding drip irrigation system only shows slight clogging, whereas the Dra curve of emitter E declines very rapidly, and the corresponding drip irrigation system shows complete clogging in the middle of the experiment.
3.2. Regression Analysis of Emitter Dra
To quantitatively analyze the statistical relationship between the average flow rate ratio (Dra) of different emitters and the duration of the experiment (T), a linear regression analysis was conducted on the relevant factors using the data analysis software SPSS 22.0, resulting in regression equations for each type of emitter under both the aerated fertilizer drip irrigation and non-aerated drip irrigation fertilization test groups.
The regression equations for the non-aerated drip irrigation fertilization test group for each emitter are as follows:
Dra NAFA = −0.000803T + 1.0401 (R2 = 0.7739, p < 0.001);
Dra NAFB = −0.002977T + 1.1827 (R2 = 0.9545, p < 0.001);
Dra NAFC = −0.002623T + 1.1737 (R2 = 0.9134, p < 0.001);
Dra NAFD = −0.00402T + 1.181 (R2 = 0.9743, p < 0.001);
Dra NAFE = −0.003863T + 0.9933 (R2 = 0.8825, p < 0.001).
The regression equations for the WFG coupling test group for each emitter are as follows:
Dra AFA = −0.000713T + 1.0594 (R2 = 0.7196, p < 0.001);
Dra AFB = −0.002853T + 1.1967 (R2 = 0.9299, p < 0.001);
Dra AFC = −0.002643T + 1.192 (R2 = 0.8956, p < 0.001);
Dra AFD = −0.004063T + 1.2408 (R2 = 0.9537, p < 0.001);
Dra AFE = −0.004T + 1.0748 (R2 = 0.9396, p < 0.001).
In the regression analysis, the coefficient of determination, R2, for each experimental group is greater than 0.7, indicating that the regression equations have a good fit to the data.
From the regression equations, when Dra = 75%, the experimental durations for each emitter in both the non-aerated drip irrigation fertilization test group and the aerated fertilizer drip irrigation test group are presented in Table 3.
Table 3.
Working time of each emitter when Dra = 75%.
As shown in Table 3, the use of WFG coupling can effectively mitigate emitter clogging and significantly extend the lifespan of all emitters, with a maximum potential increase of 29% in the service life of the irrigation devices.
3.3. Emitter Clogging Patterns
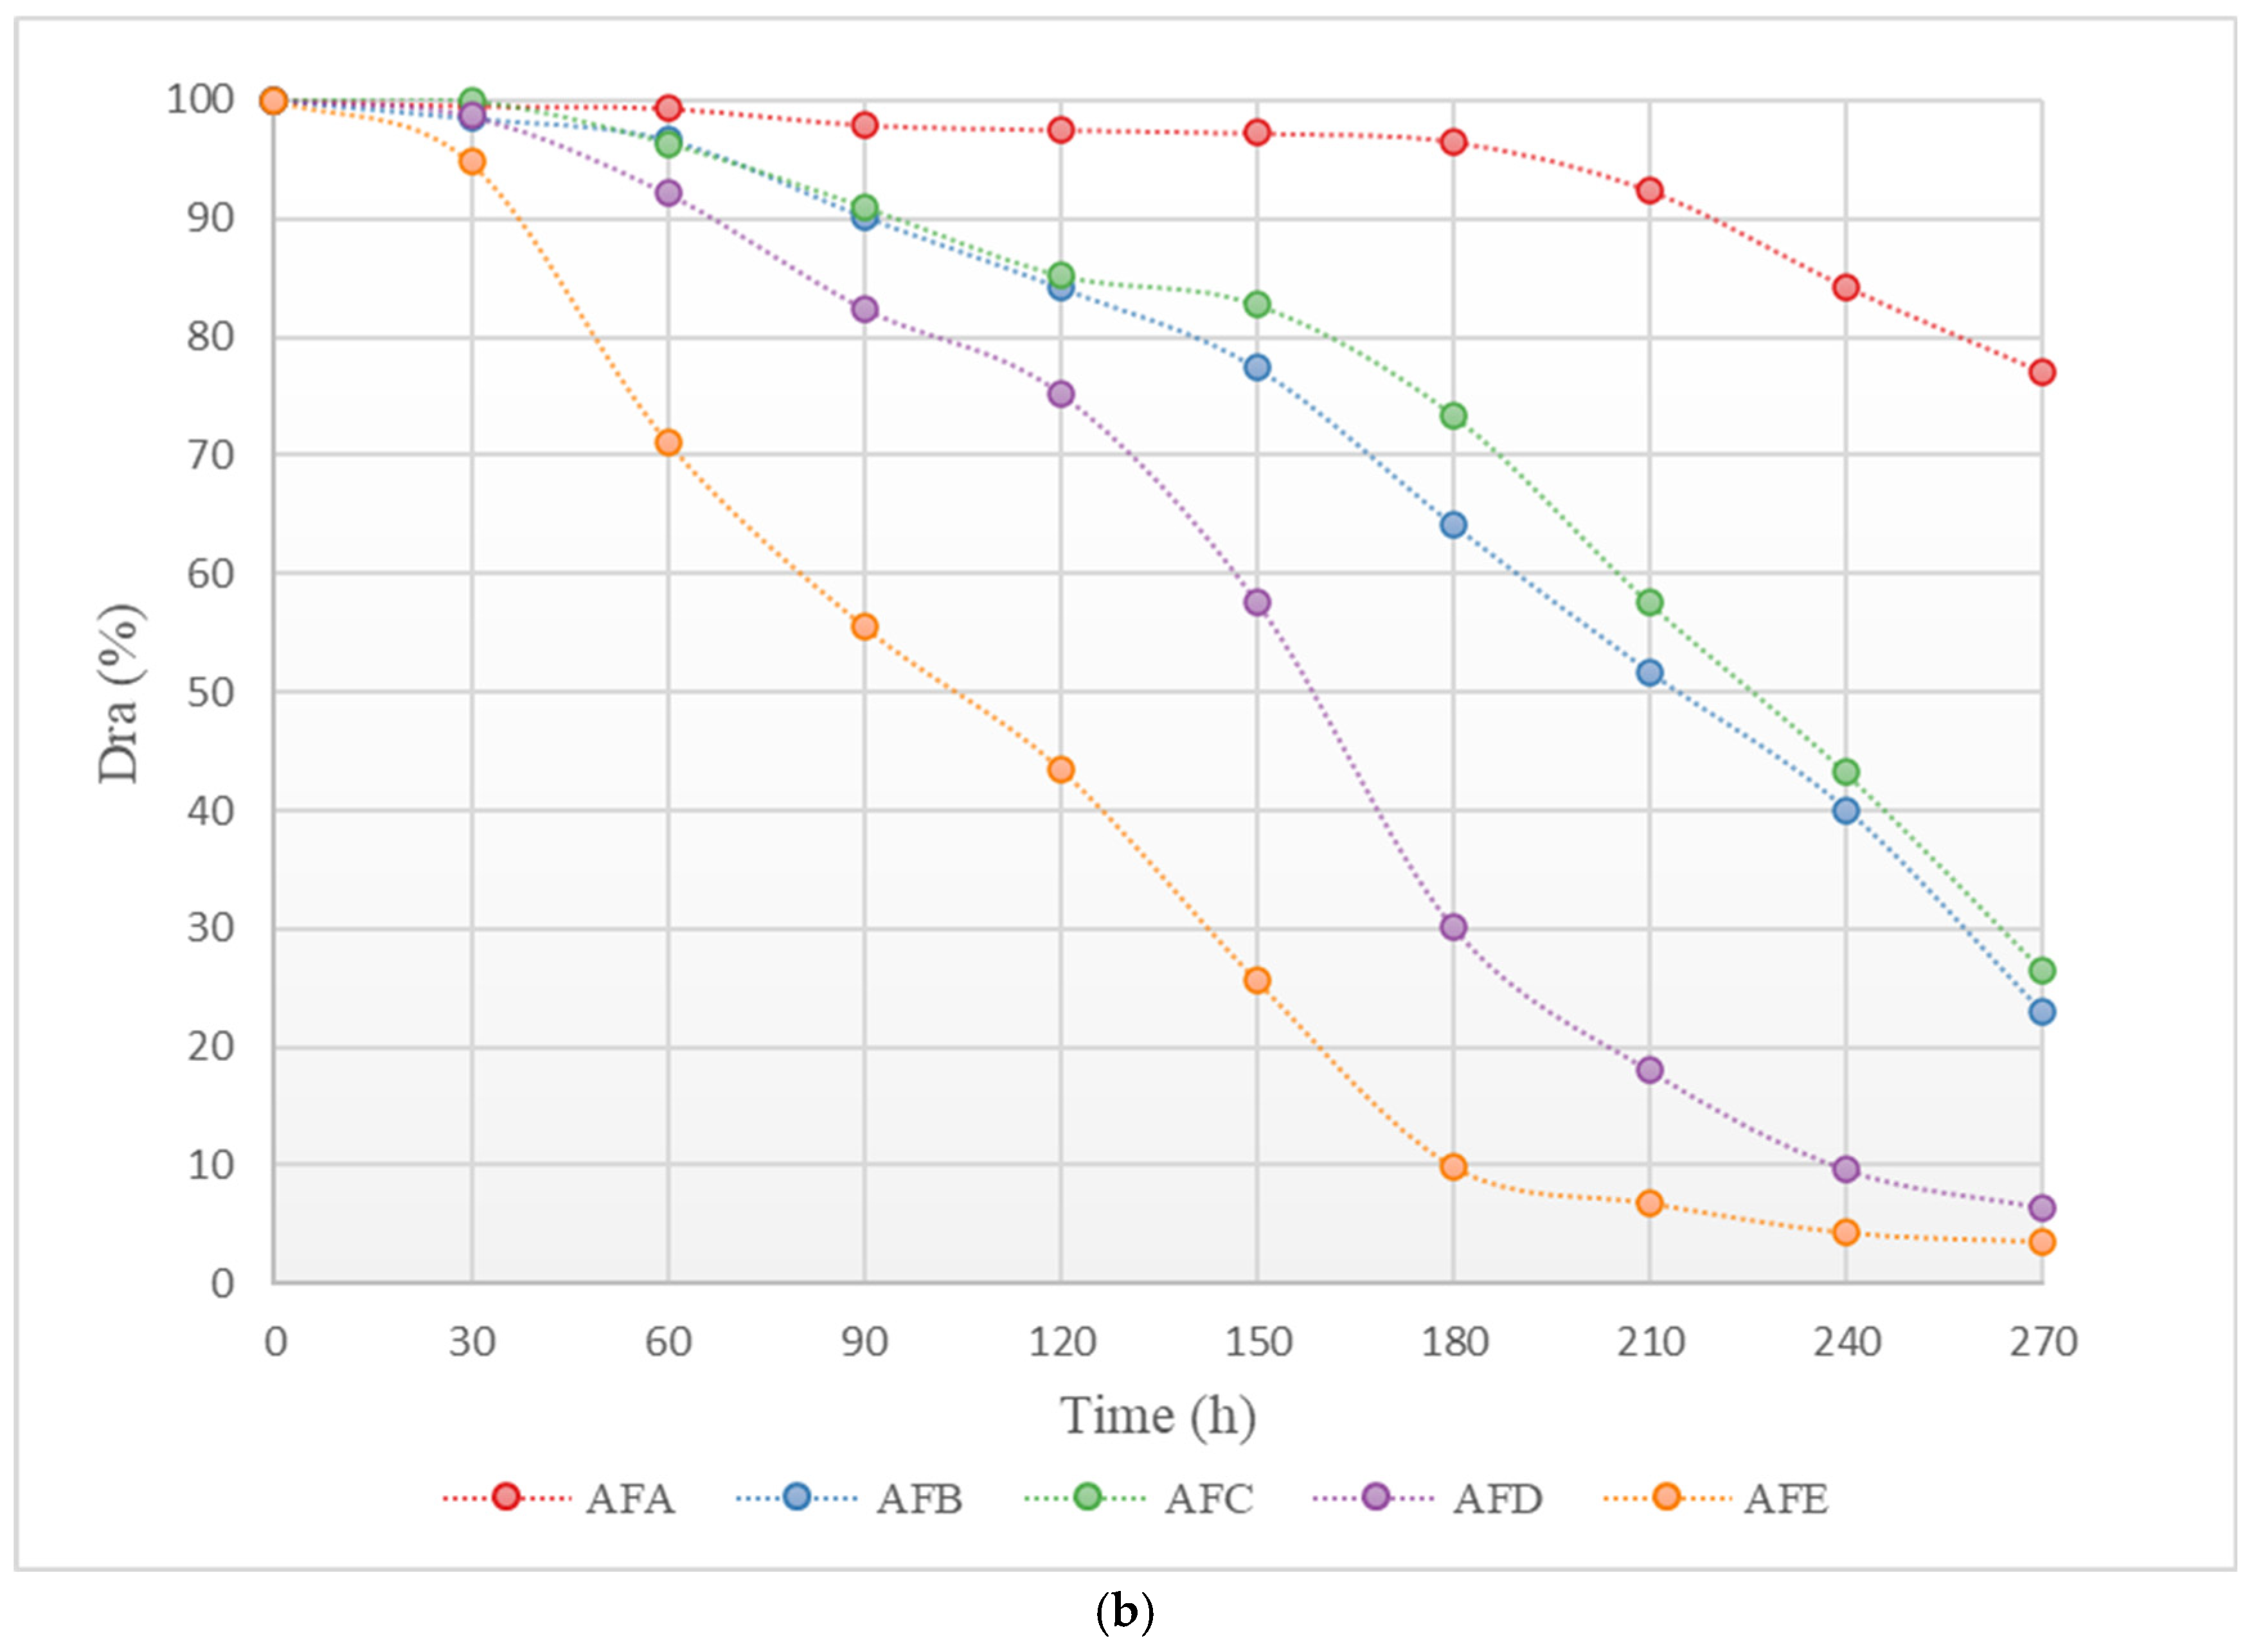
In order to further elucidate the dynamic patterns of emitter clogging under WFG coupling and non-aerated drip irrigation and fertigation conditions, a study was conducted to examine the dynamic changes in the clogging of emitters at different positions along the drip tape in the drip irrigation system. A heatmap of the dynamic changes in the average flow ratio of emitters at different positions along the drip tape under each treatment was created, as illustrated in Figure 4. The horizontal axis of the figure represents the experimental running time, the vertical axis represents the position number of the emitter along the drip tape direction, and the color of the heatmap indicates the size of the emitter’s Dra. As presented in Figure 4, the degree of blockage for all of the emitters gradually intensifies with the progress of the experiment, showing different patterns of clogging change. The time until blockage for the emitters in all the WFG coupling trial groups is later than that for the same type of emitter in the non-aerated drip irrigation and fertigation trial group. Furthermore, the number of blocked emitters is significantly less within the same time frame. A comparison of the positions of the blocked emitters on the drip tape at each time point reveals that the distribution of blocked emitters in the WFG coupling trial group is more uniform along the measured drip tape.
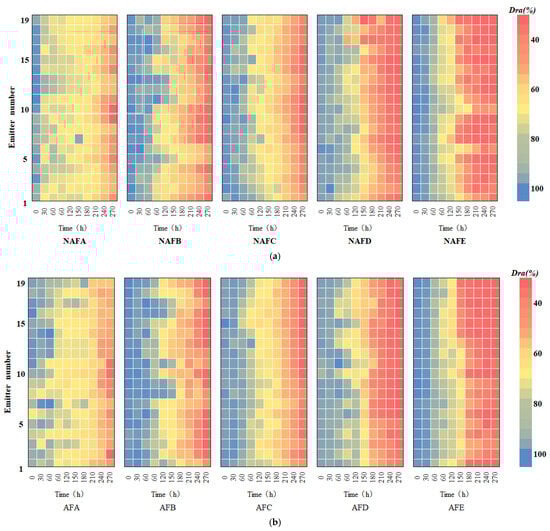
Figure 4.
Histogram of the degree of clogging of the emitter along the direction of the drip tape as a function of test time. (a) Non-aerated control group. (b) Water–fertilizer–gas coupling experiment group.
3.4. Pattern of Change in Emitter Uniformity Coefficient
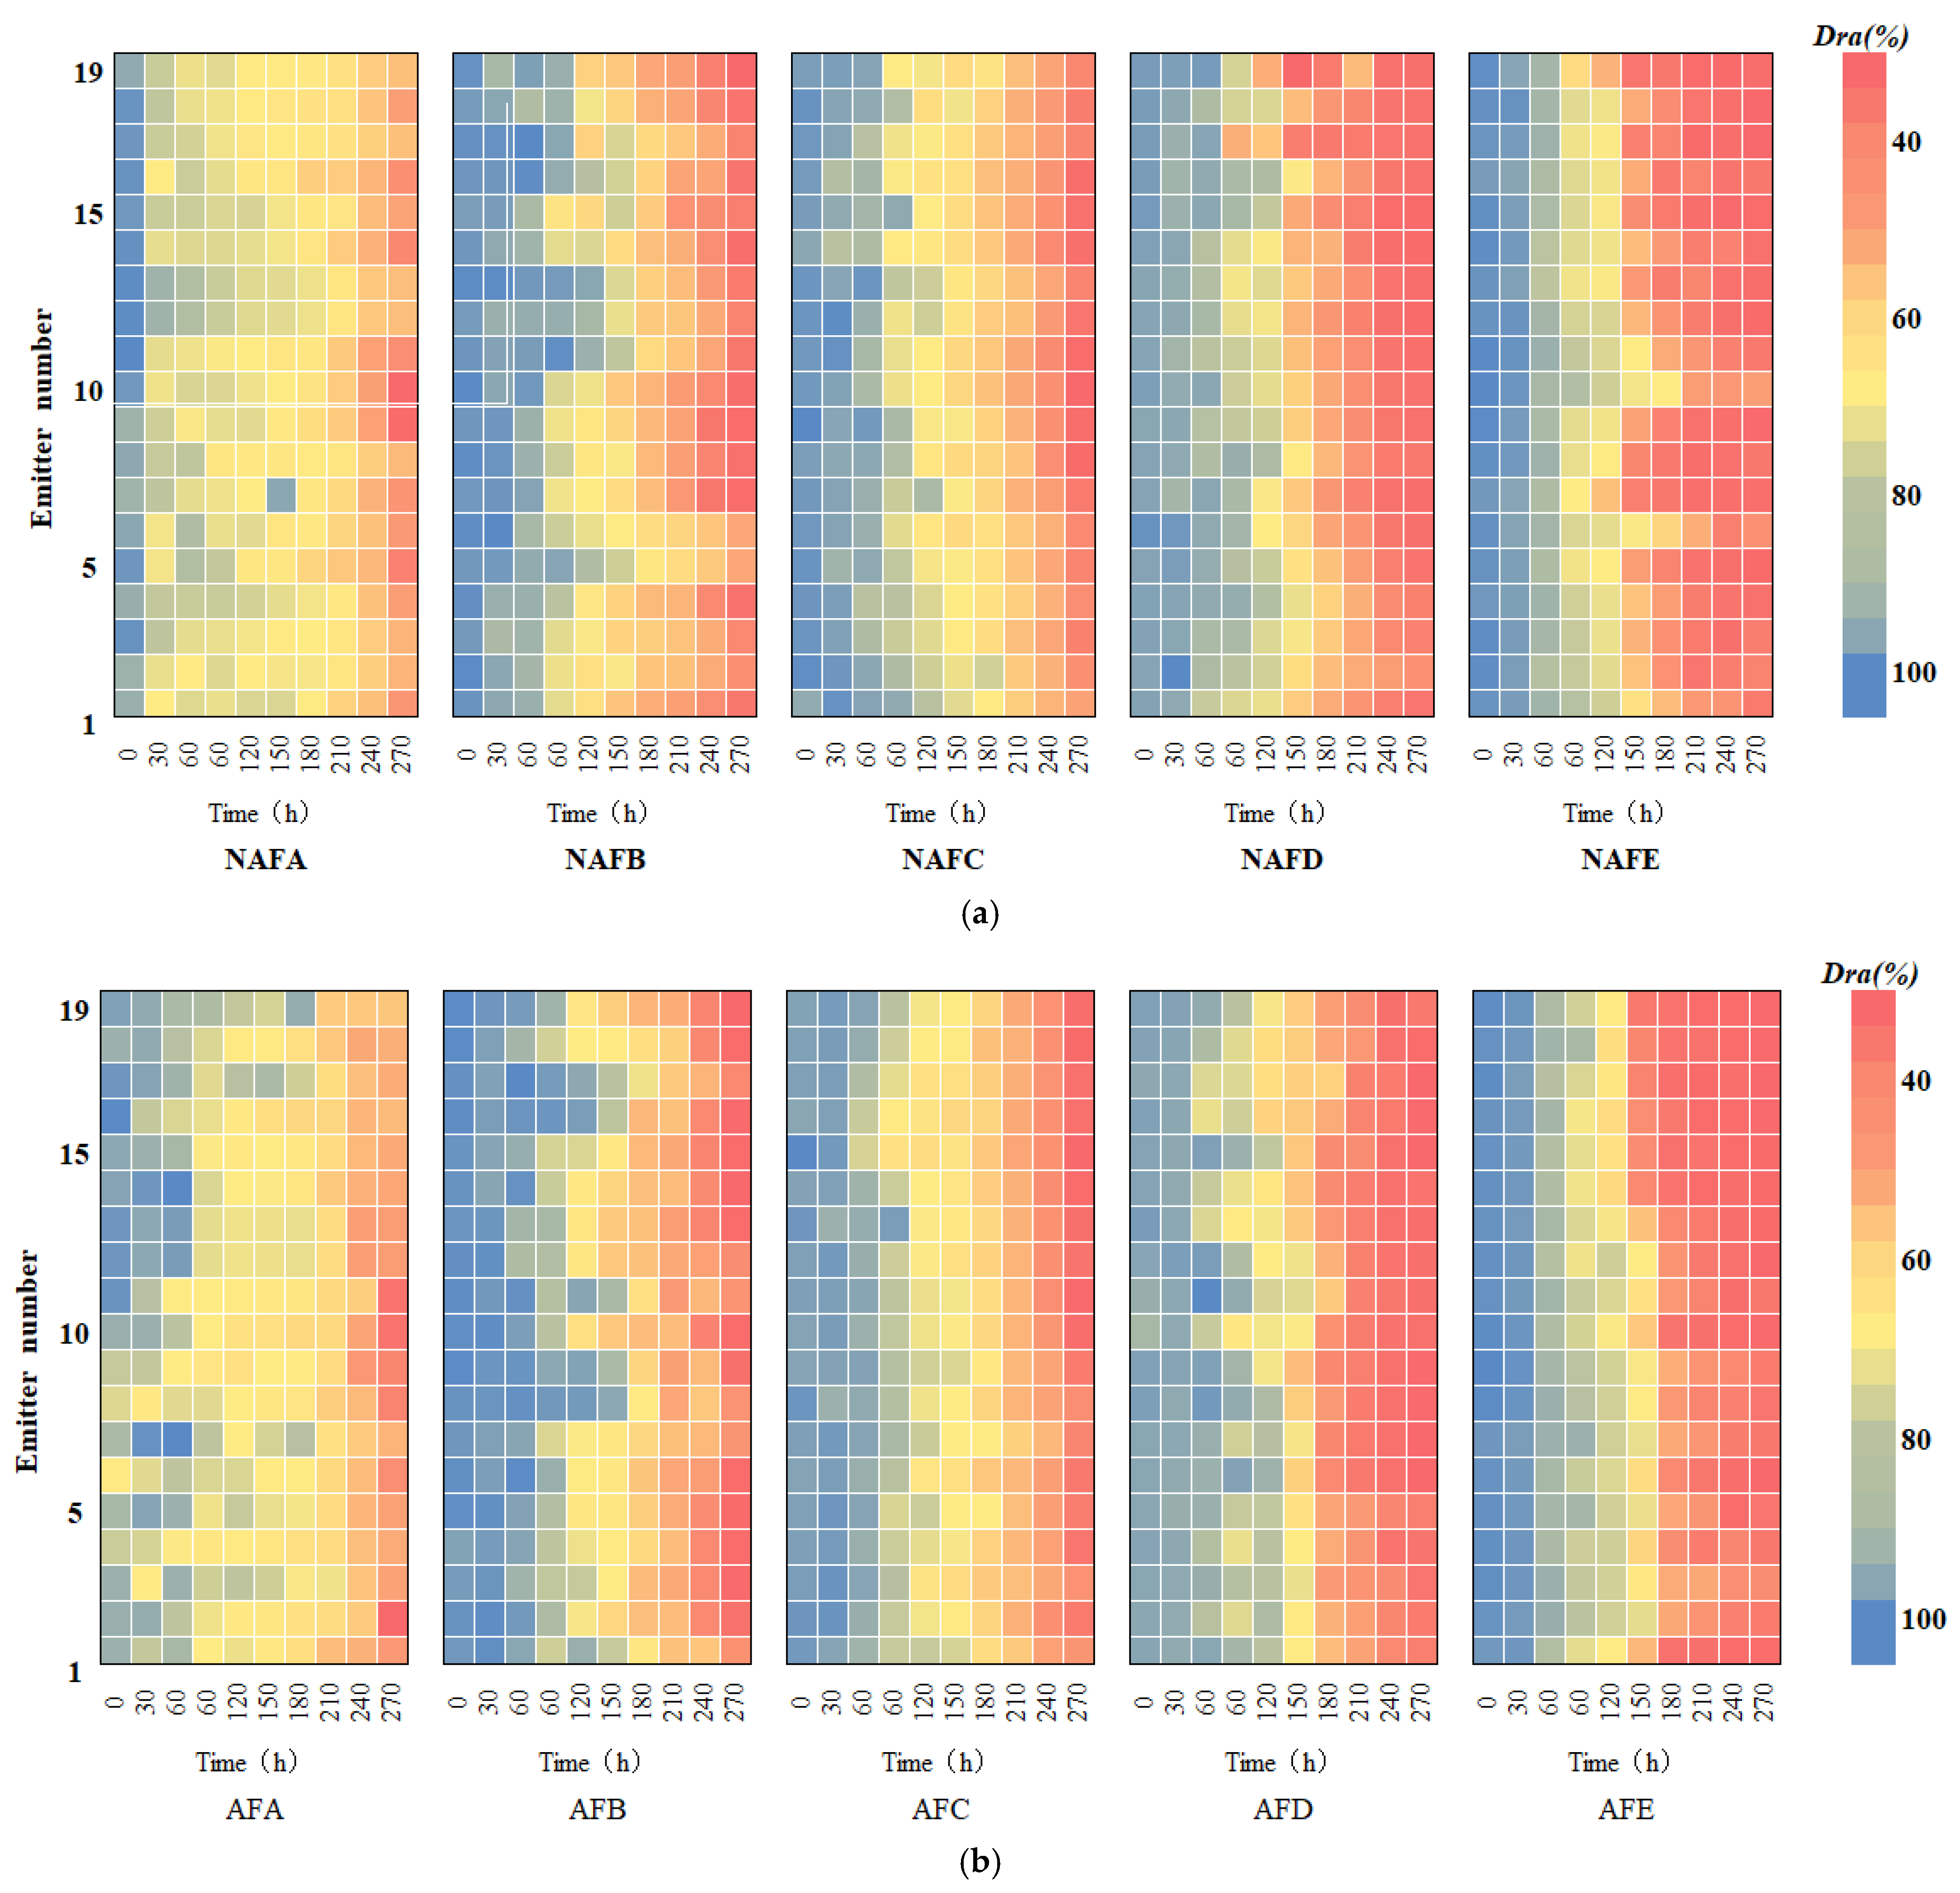
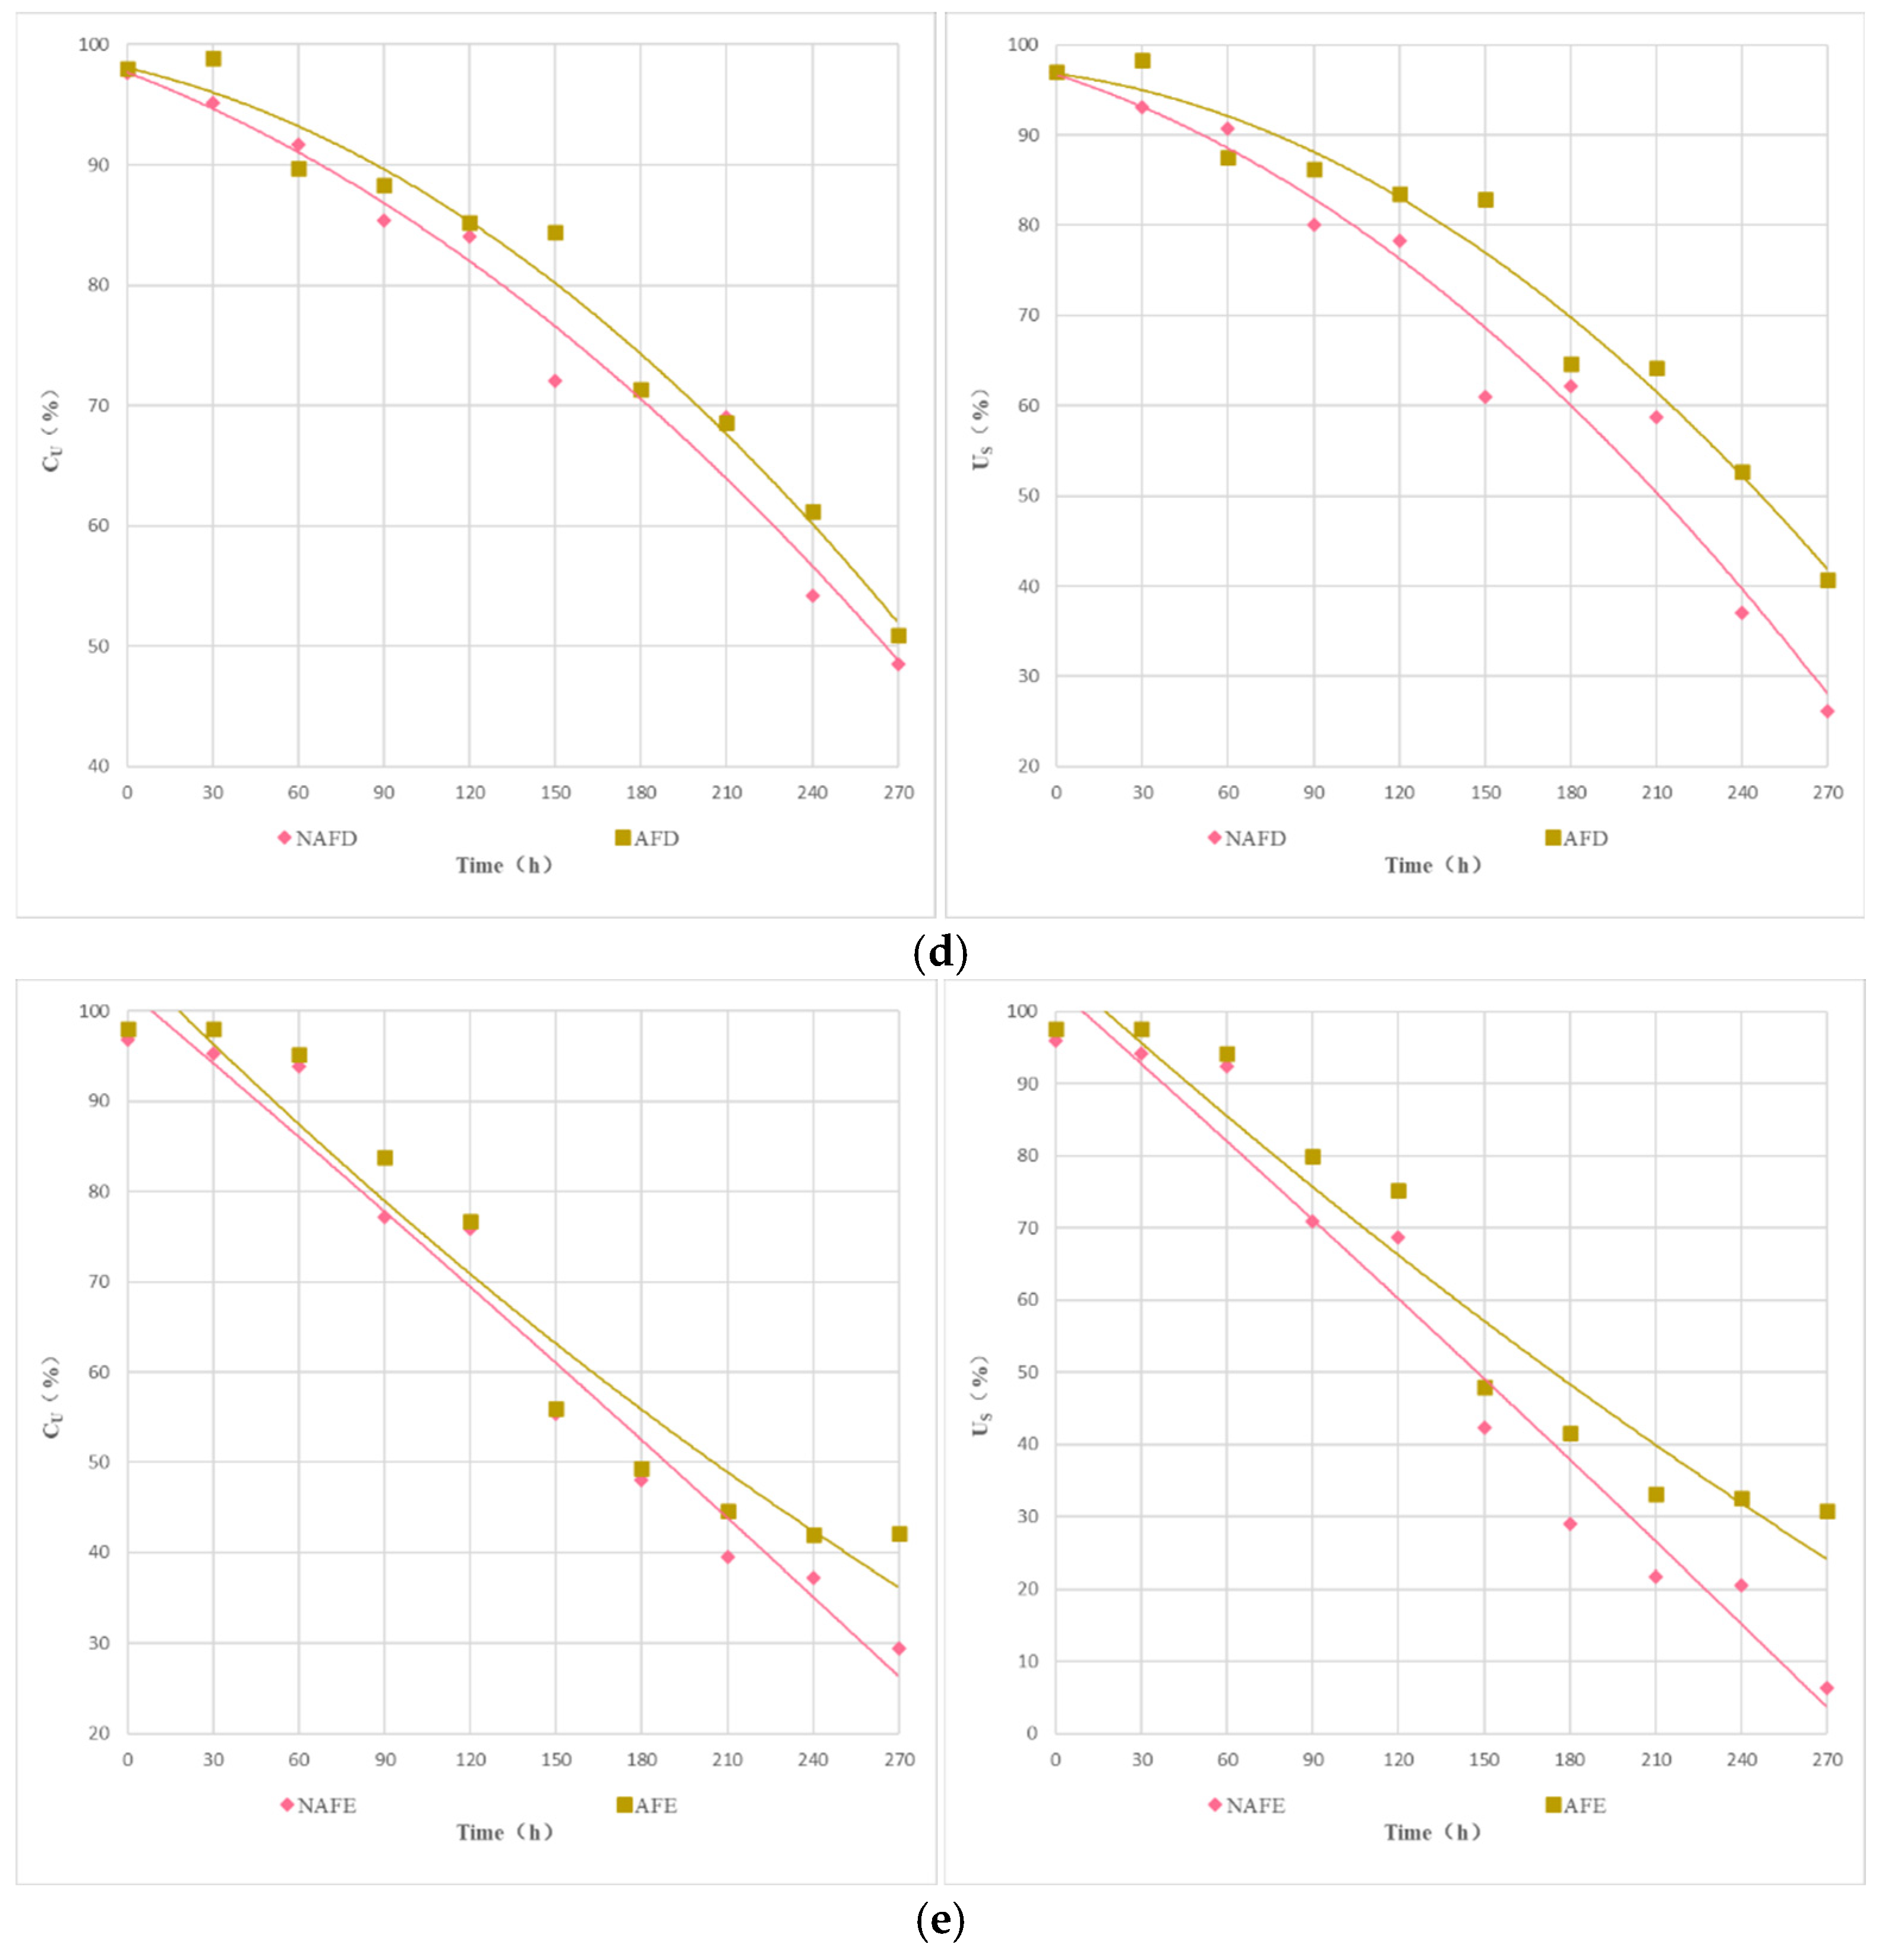
The Christiansen uniformity coefficient () and the statistical uniformity coefficient () of the emitters in both the WFG coupling trial group and the non-aerated drip irrigation and fertigation trial group were subjected to analysis in order to study the impact of WGF coupling on the uniformity of the drip irrigation systems of various emitters. Figure 5 illustrates the variation curves of the and the of each emitter over the course of the experiment. As shown in Figure 5, the trajectory of alteration in the and the of the drip irrigation systems of each emitter with respect to the experimental time exhibits a parallelism with the process of alteration in the Dra. In both trial groups, the uniformity coefficients ( and ) of each emitter type exhibited a decline with the progression of the experimental period. Among the emitter types within a given trial group, the pattern of change in the uniformity coefficient varied, with the overall rate of decline being A < C < B < D < E. In comparison to the column emitters, all of the interior embedded patches emitters demonstrated superior uniformity within the drip irrigation system. For in-line flap emitters, the non-pressure-compensated emitters exhibited enhanced uniformity, and the emitter flow rate had a minimal impact on the uniformity of the drip irrigation system. For a given emitter type, both and were higher in the WFG coupling trial group than in the non-aerated drip irrigation and fertigation trial group. This suggests that the integration of water, fertilizer, and gas within the drip irrigation system is advantageous for maintaining optimal uniformity and extending the system’s operational lifespan.
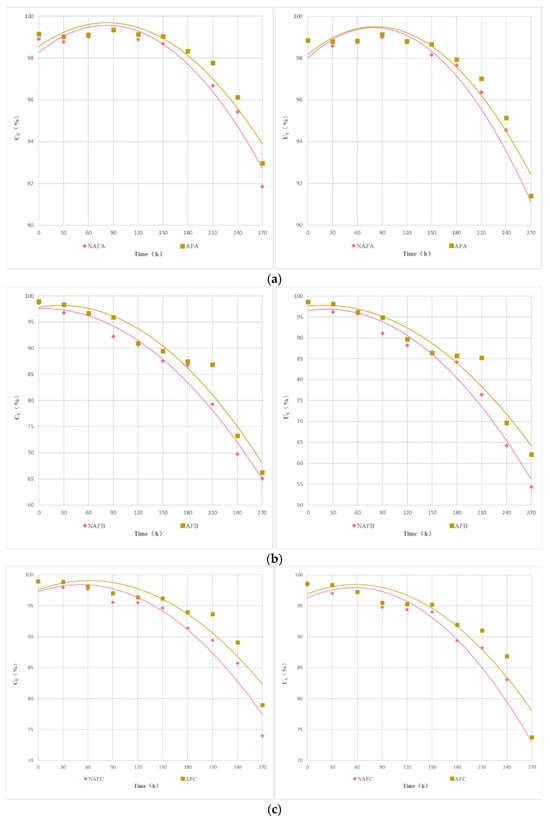
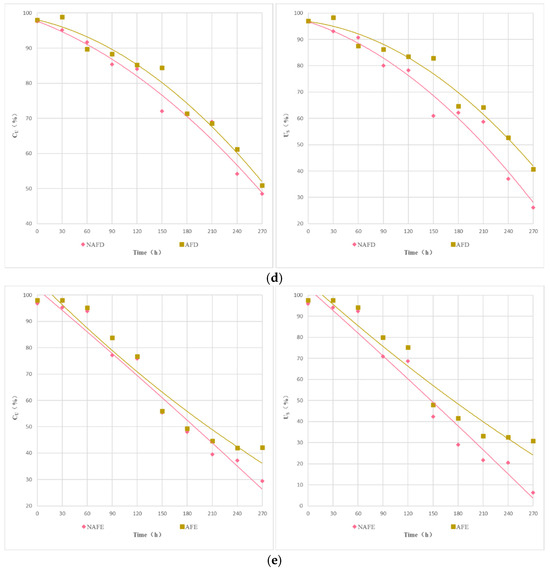
Figure 5.
Curve of and of each emitter of test time. (a) Emitter A. (b) Emitter B. (c) Emitter C. (d) Emitter D. (e) Emitter E.
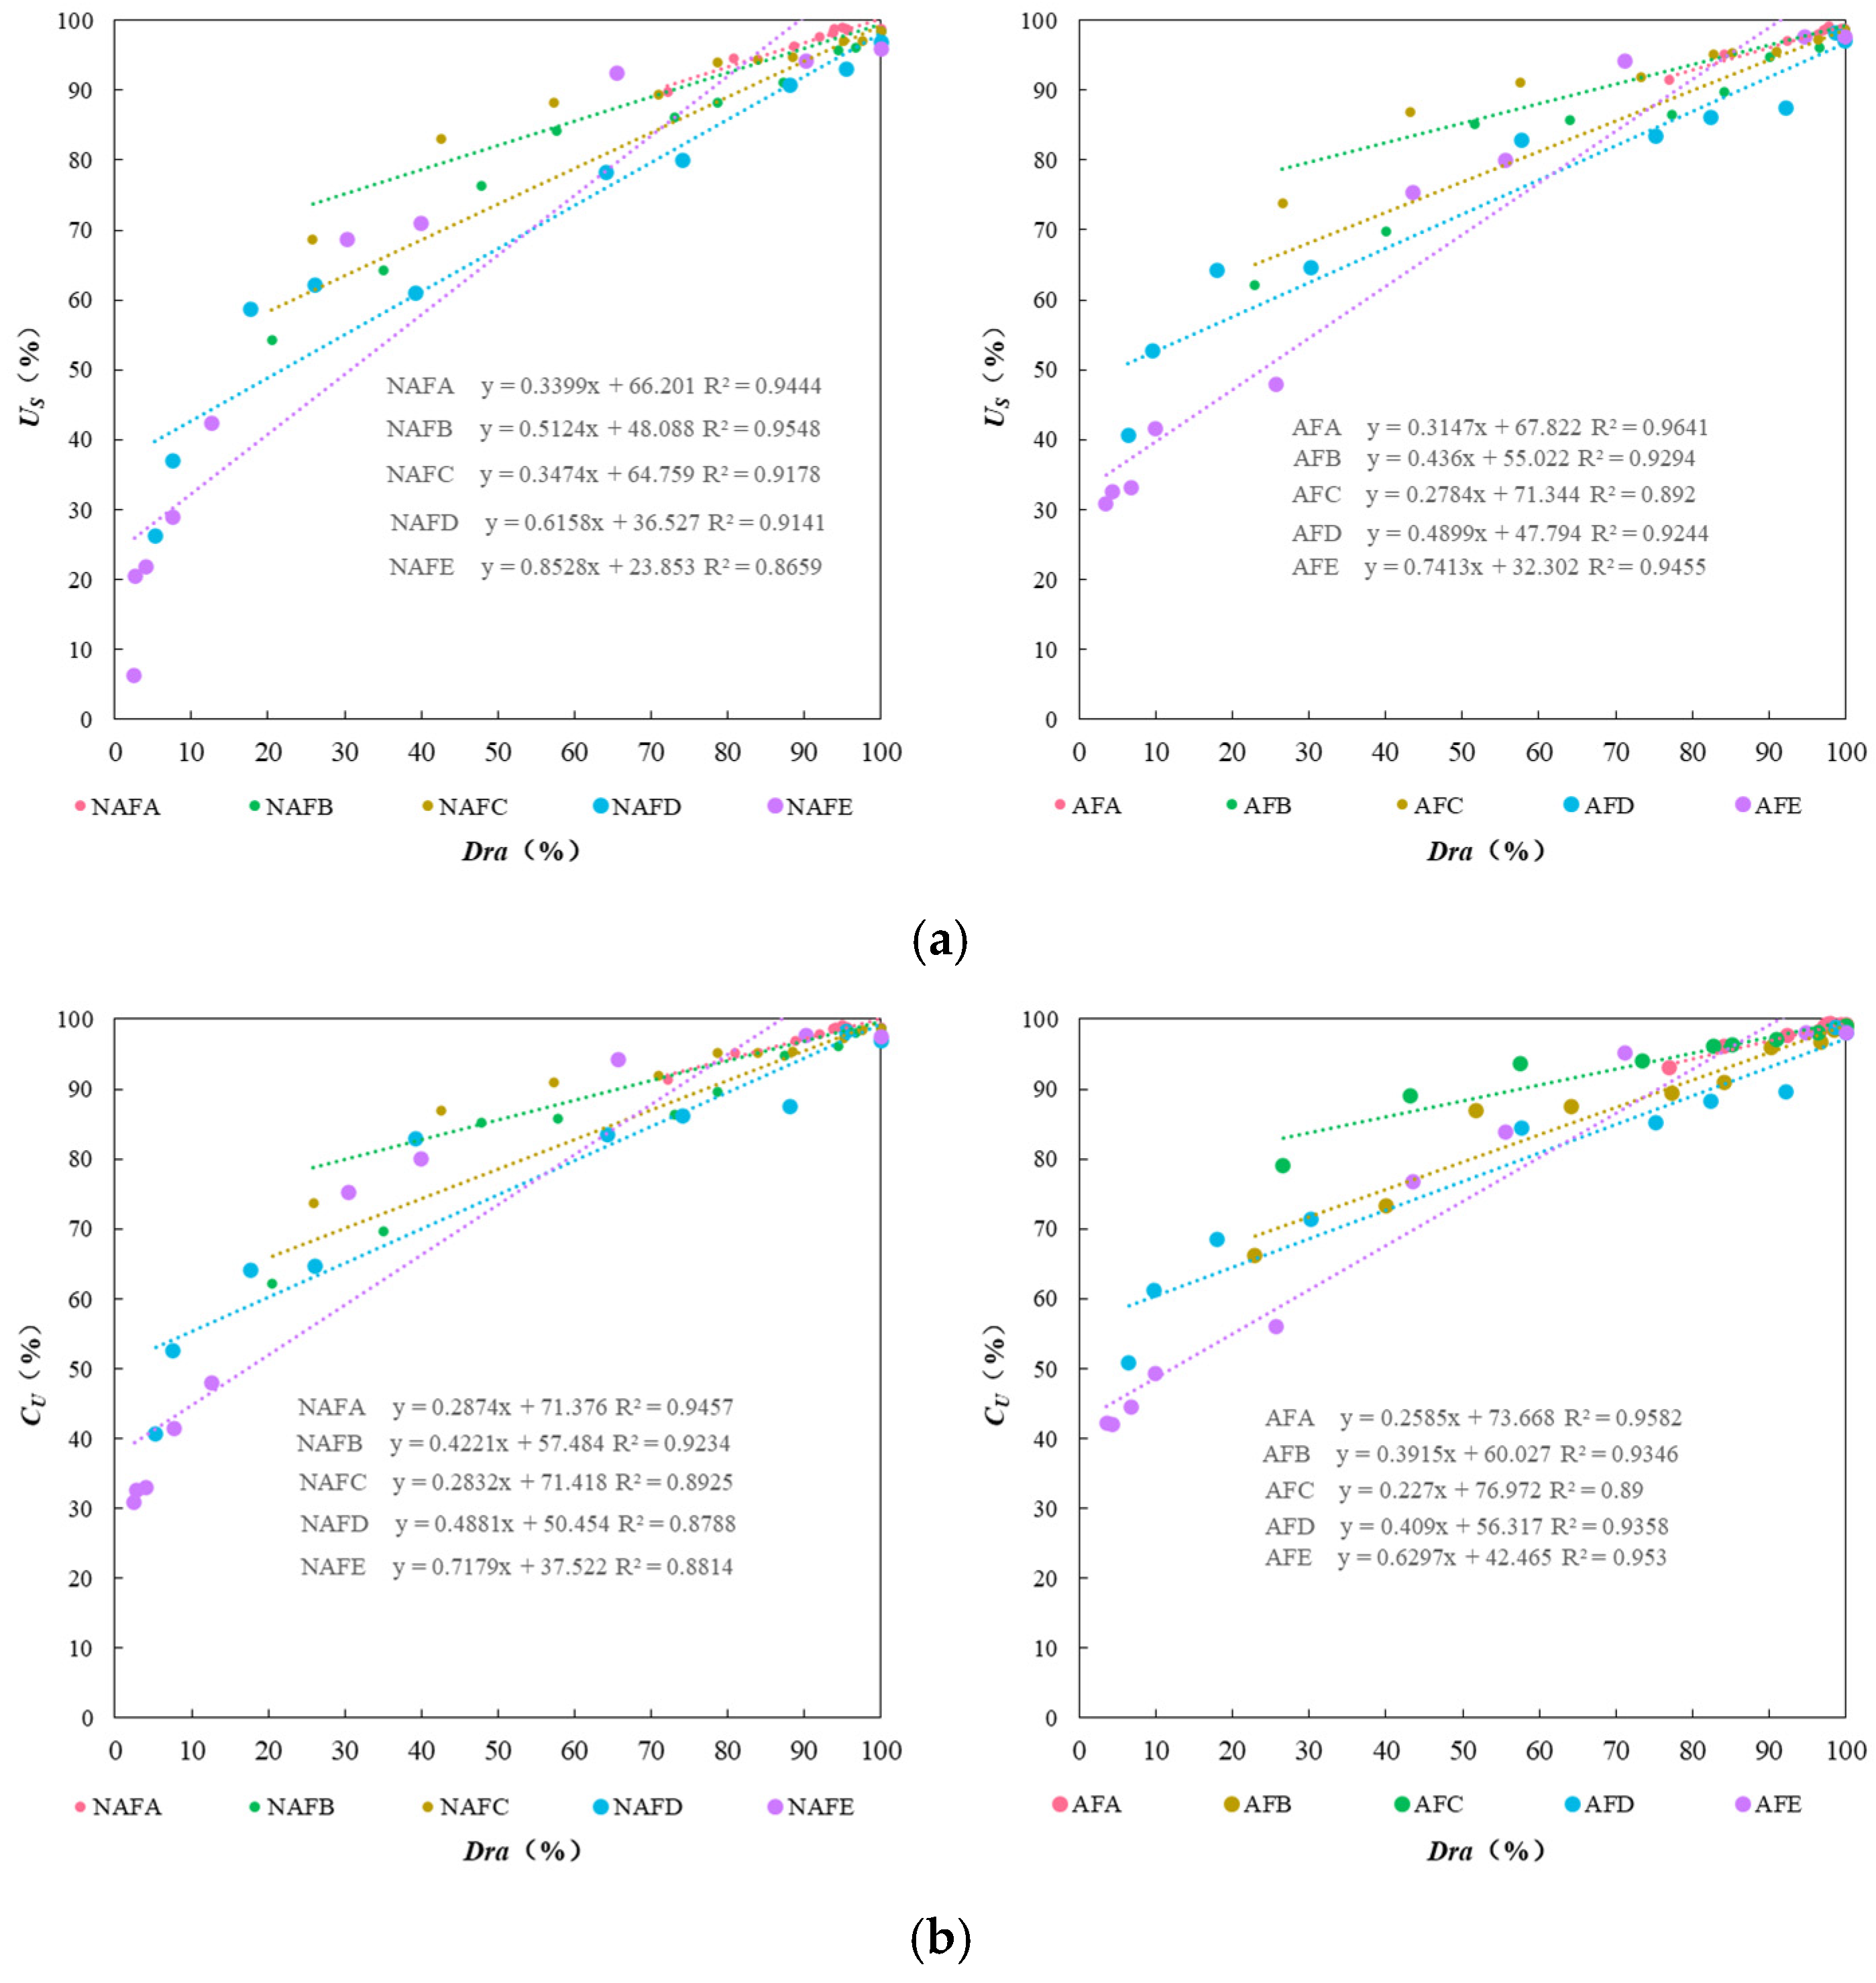
Figure 6 illustrates the relationship between the , the , and the Dra of the drip irrigation systems of each emitter under the WFG coupling trial group and the non-aerated drip irrigation and fertigation trial group. As shown in Figure 6, under different experimental conditions, there is a good linear relationship between Dra, , and for each emitter. Under the same conditions of Dra in the drip irrigation system, the impact of WFG coupling on and show significant differences. Overall, the and of the WFG coupling trial group are superior to those of the non-aerated drip irrigation and fertigation trial group. As Dra decreases, the positive impact of WFG coupling on and becomes more pronounced, indicating that WFG coupling can reduce the sensitivity of and to changes in Dra for each emitter drip irrigation system. It also suggests that WFG coupling can not only delay emitter clogging but also make the degree of clogging more uniform among emitters, thereby mitigating the impact of partial emitter clogging on the uniformity of the drip irrigation system.
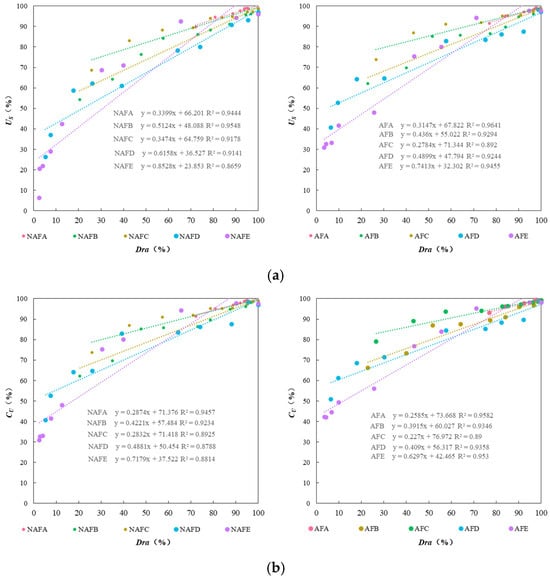
Figure 6.
The relationship between the uniformity coefficients and Dra. (a) The relationship between (statistical uniformity coefficient) and Dra. (b) The relationship between (Christiansen uniformity coefficient) and Dra.
3.5. Microscopic Morphology and Microbial Diversity of Emitter Clogging Materials
3.5.1. Microscopic Morphology of Clogging Materials
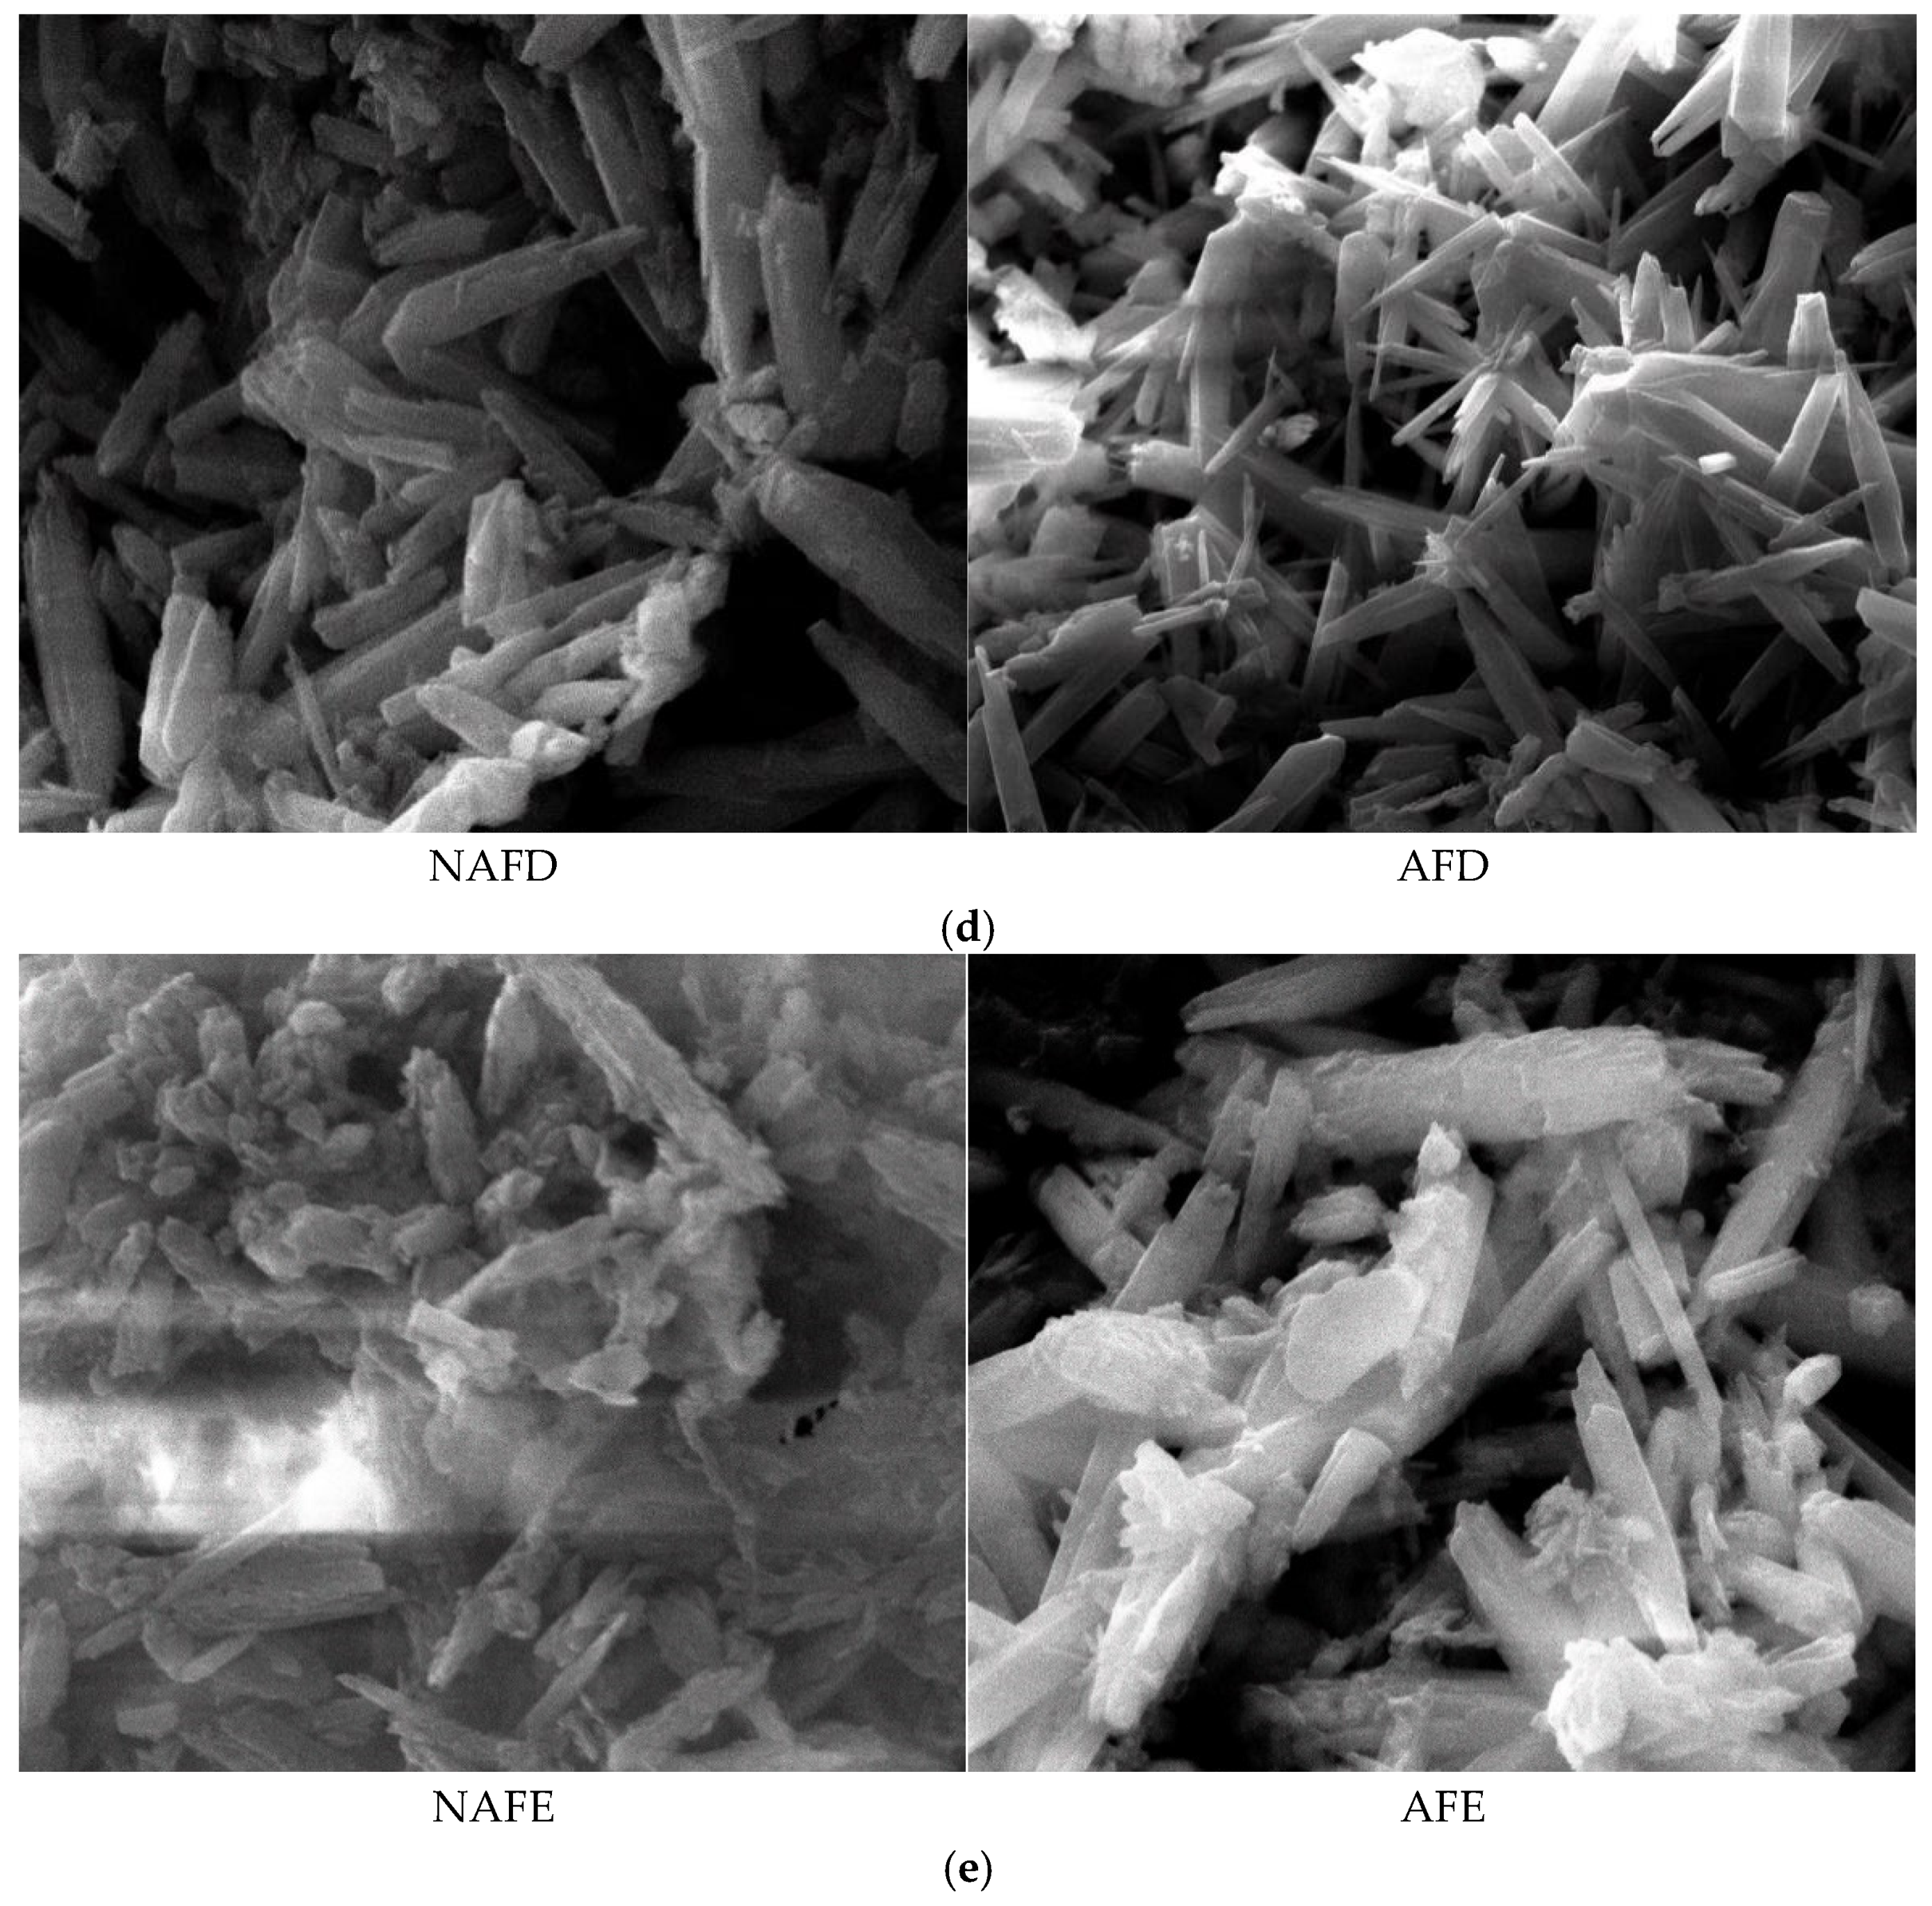
The formation of emitter clogging materials is the result of the combined effects of physical, chemical, and biological factors. The microscopic morphology of these materials directly reflects the impact of these different factors on the clogging outcomes. To elucidate the mechanism by which WFG coupling affects emitter clogging, an analysis of the microscopic morphology of the clogging materials from the emitters in the drip irrigation systems corresponding to both the WFG coupling trial group and the non-aerated drip irrigation and fertigation trial group was conducted using a scanning electron microscope. The microscopic morphology of the clogging materials from each emitter is provided in Figure 7 (×5000).
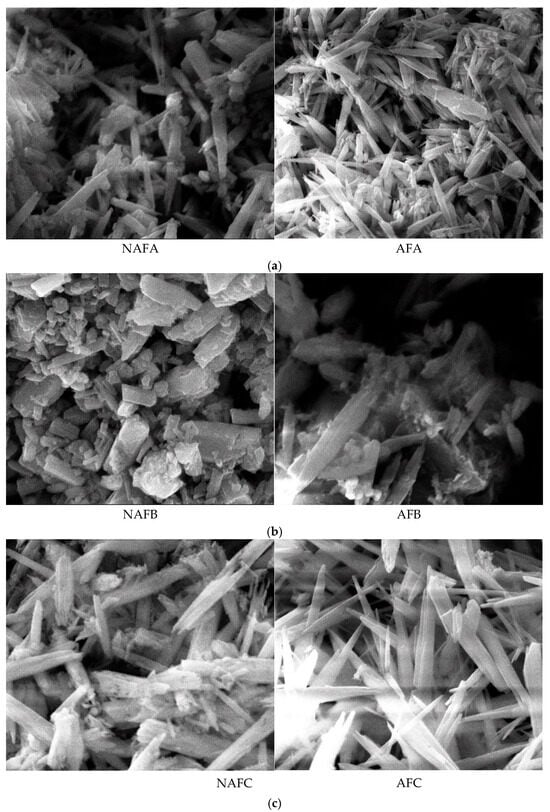

Figure 7.
Micromorphological structure of the clogged material in each emitter. (a) Emitter A. (b) Emitter B. (c) Emitter C. (d) Emitter D. (e) Emitter E.
The emitter clogging materials are irregularly shaped and sized cylindrical crystals, which are clustered, tightly packed, and exhibit agglomeration phenomena, as demonstrated in Figure 8. Furthermore, the surfaces of these clogging materials are coated with varying degrees of adhesive and lump-like substances. A comparison of the microscopic morphological structures of the clogging materials from the emitters in both the WFG coupling trial group and the non-aerated drip irrigation and fertigation trial group reveals that emitter A has relatively smooth and flat surfaces with fewer surface adherents in both treatment conditions. In contrast, emitter E demonstrates pronounced adhesion and agglomeration in all treatment conditions, with the degree of adhesion and agglomeration on the surface of the clogging materials following the order A < C < B < D < E, which aligns with the pattern of Dra changes observed for each emitter. A comparison of the microscopic morphological structures of the same type of emitter in the WFG coupling trial group and the non-aerated drip irrigation and fertigation trial group reveals that the thickness and density of the clogging materials under WFG coupling are lower, with less adhesion and accumulation of organic matter. In the non-aerated drip irrigation and fertigation trial group, the clogging materials of the emitters are relatively thicker and denser, which is consistent with the hypothesis that the co-application of water and fertilizer can slow down the rate of decrease in emitter Dra. Additionally, it is evident that emitters A and E, which exhibit the most pronounced alterations in Dra, also demonstrate substantial discrepancies in the microscopic morphological composition of their clogging materials subsequent to WFG co-application. These discrepancies are accompanied by discernible enhancements in surface adhesion and agglomeration, which align with the conclusion that WFG coupling effectively prolongs the clogging time of emitters A and E.

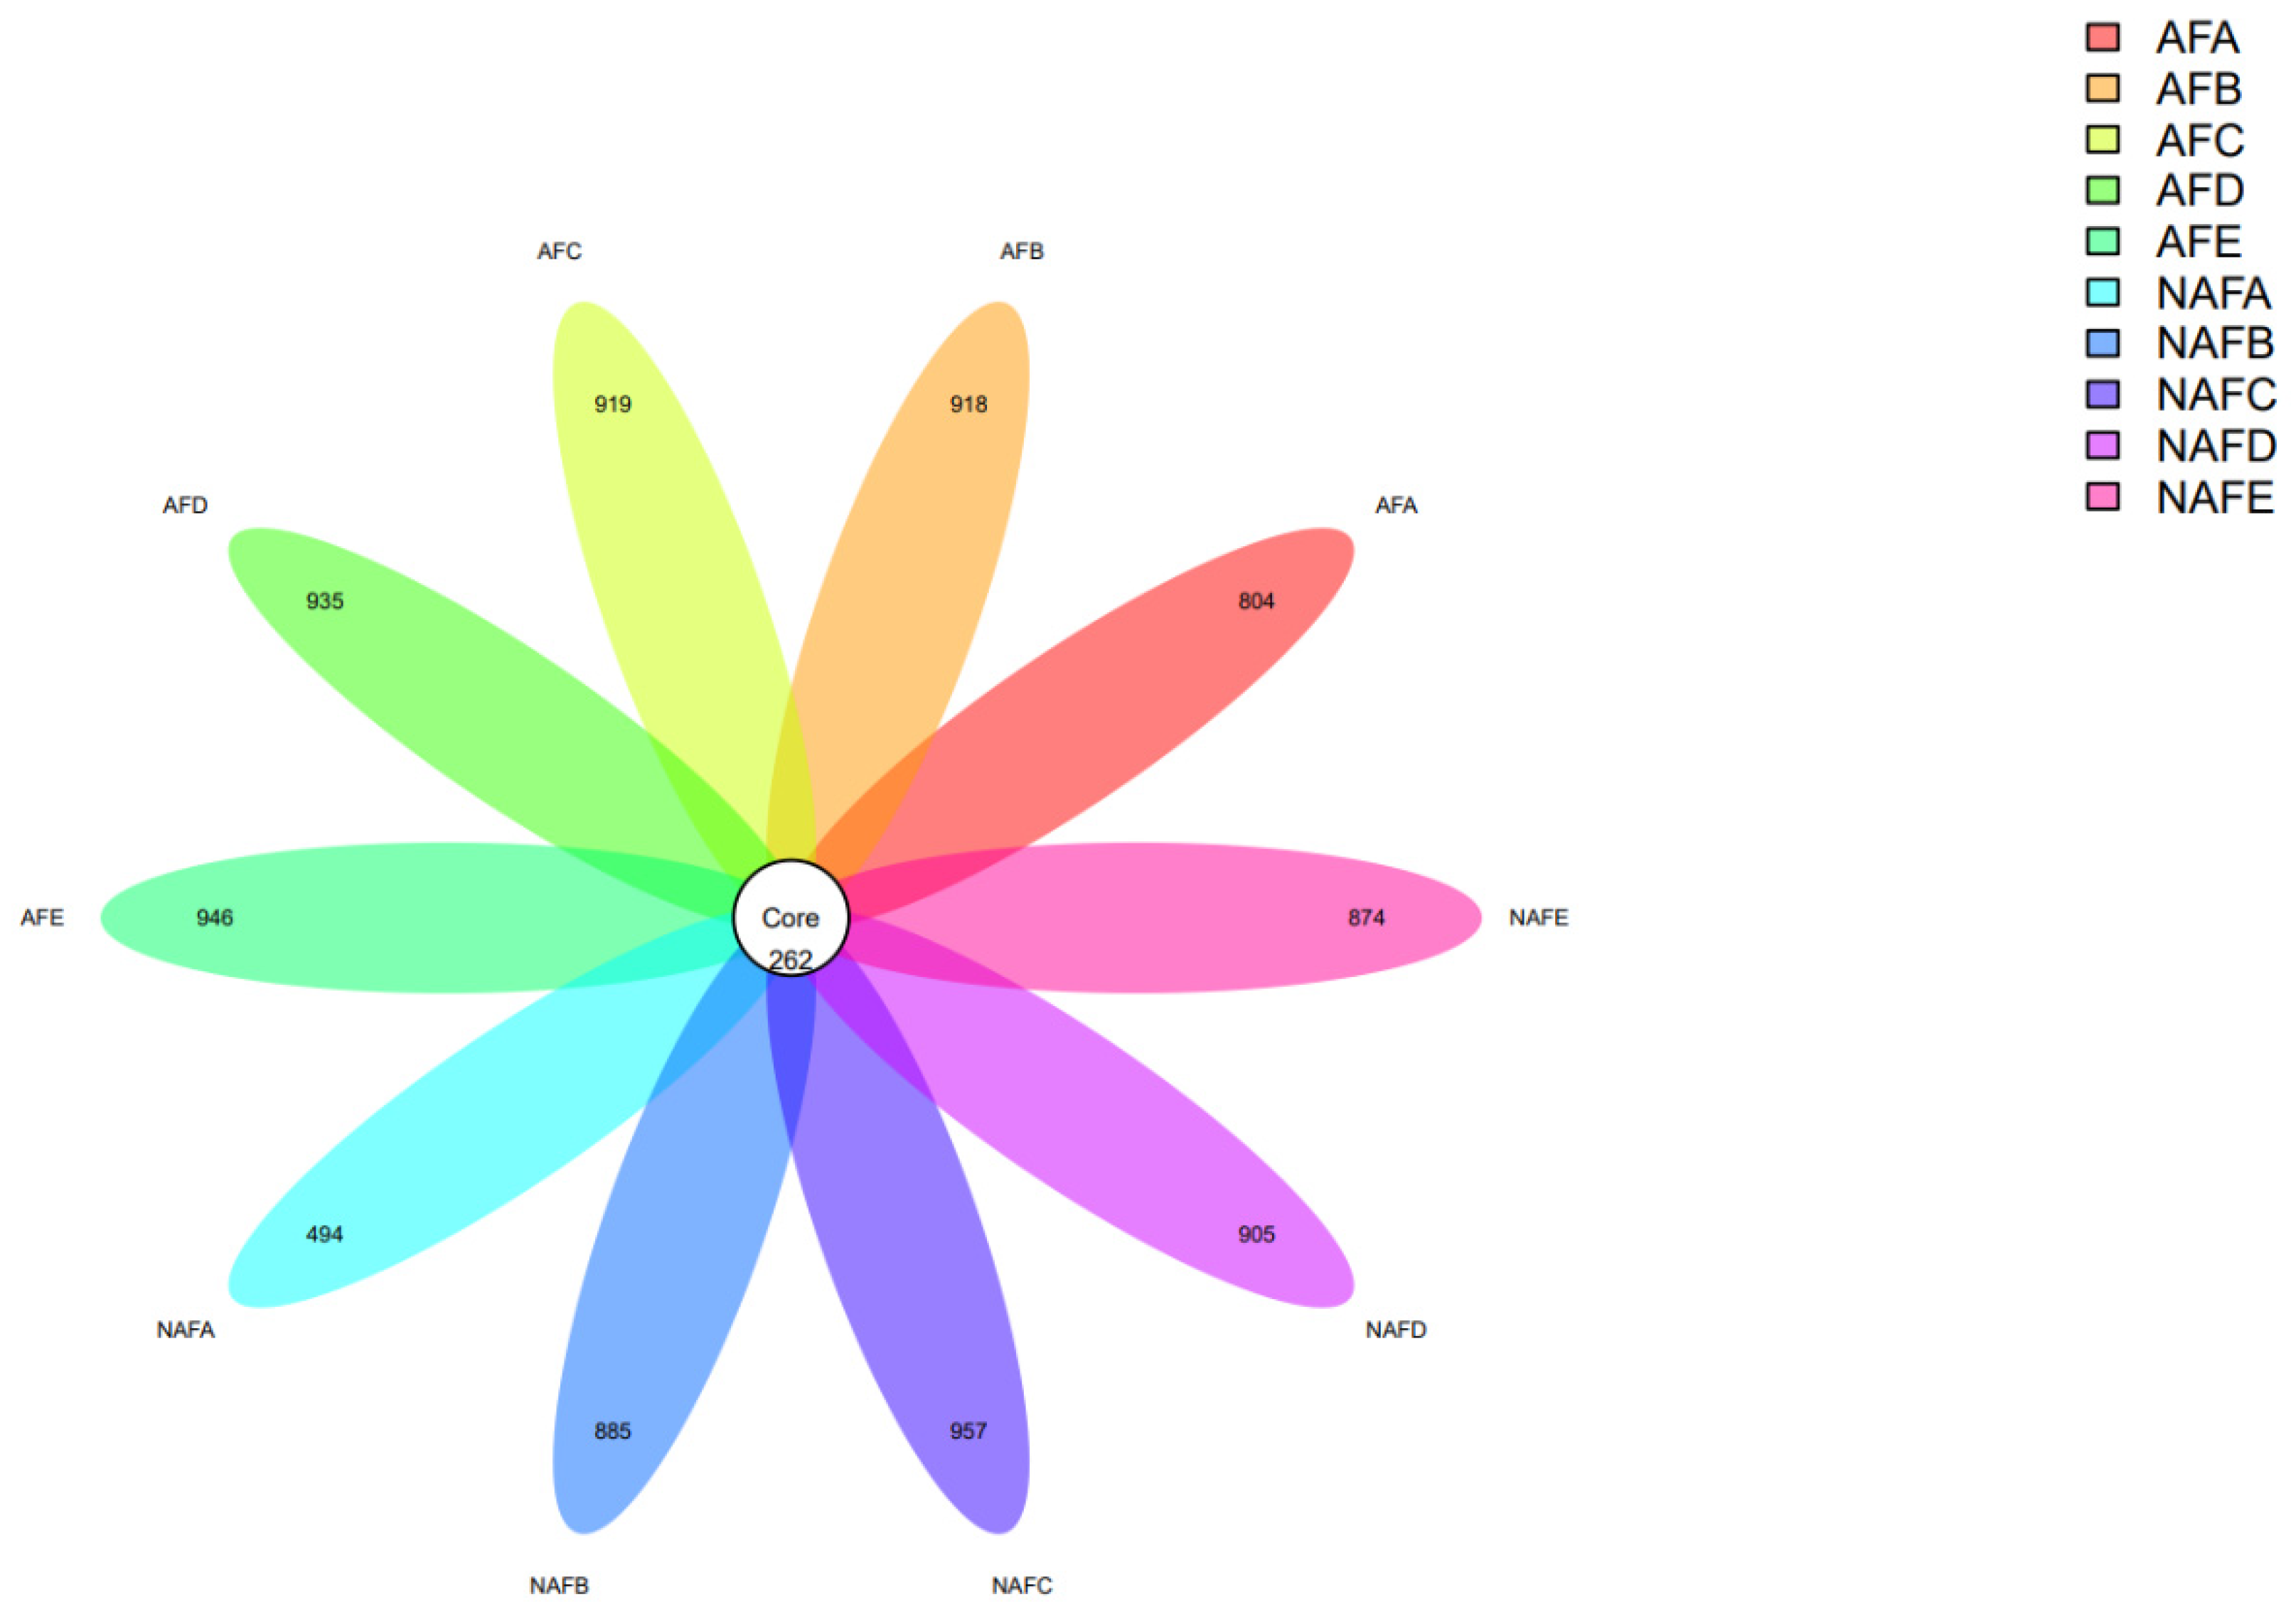
Figure 8.
Petal plot of distribution of clogging OTUs by emitter.
3.5.2. Analysis of Microbial Abundance in Clogging Materials
After the experiment concluded, a microbial diversity analysis was conducted on the clogging materials from the drip irrigation systems corresponding to each emitter. The average data from three clogging materials corresponding to each emitter were used as one sample for comparative analysis. There were five samples from both the WFG co-application trial group and the non-aerated drip irrigation and fertigation trial group. After quality control, the number of Operational Taxonomic Units (OTUs) in each sample ranged from 750 to 1300.
Firstly, we conducted an analysis of the OTUs, and the OTU results for each sample are as follows (Figure 8).
The numbers in the Core represent the total number of shared Operational Taxonomic Units (OTUs) among the samples (i.e., Core OTUs), and the numbers on the petals represent the count of OTUs in each sample minus the shared OTUs. The OTU results from each sample indicated that, in both the WFG coupling trial group and the non-aerated drip irrigation and fertigation trial group, the number of shared OTUs among the emitter samples is significantly less than the number of unique OTUs in each sample. That is, the common microbial count is less than 50% of the total microbial count in each sample, indicating a large variation in microbial species within the clogging materials of the emitters.
The OTU distribution among the emitters shows that in the non-aerated drip irrigation and fertigation trial group, the total number of OTUs for emitter C is slightly higher than in the WFG co-application trial group. In contrast, the total number of OTUs for emitters A/B/D/E in the non-aerated drip irrigation and fertigation trial group is less than that in the corresponding emitters in the WFG coupling trial group. The total number of OTUs for emitter A in the WFG coupling trial group increased 63% due to the aeration, suggesting that WFG coupling can increase the microbial count in the main emitter clogging materials.
3.5.3. Analysis of Microbial Community Structure in Clogging Materials
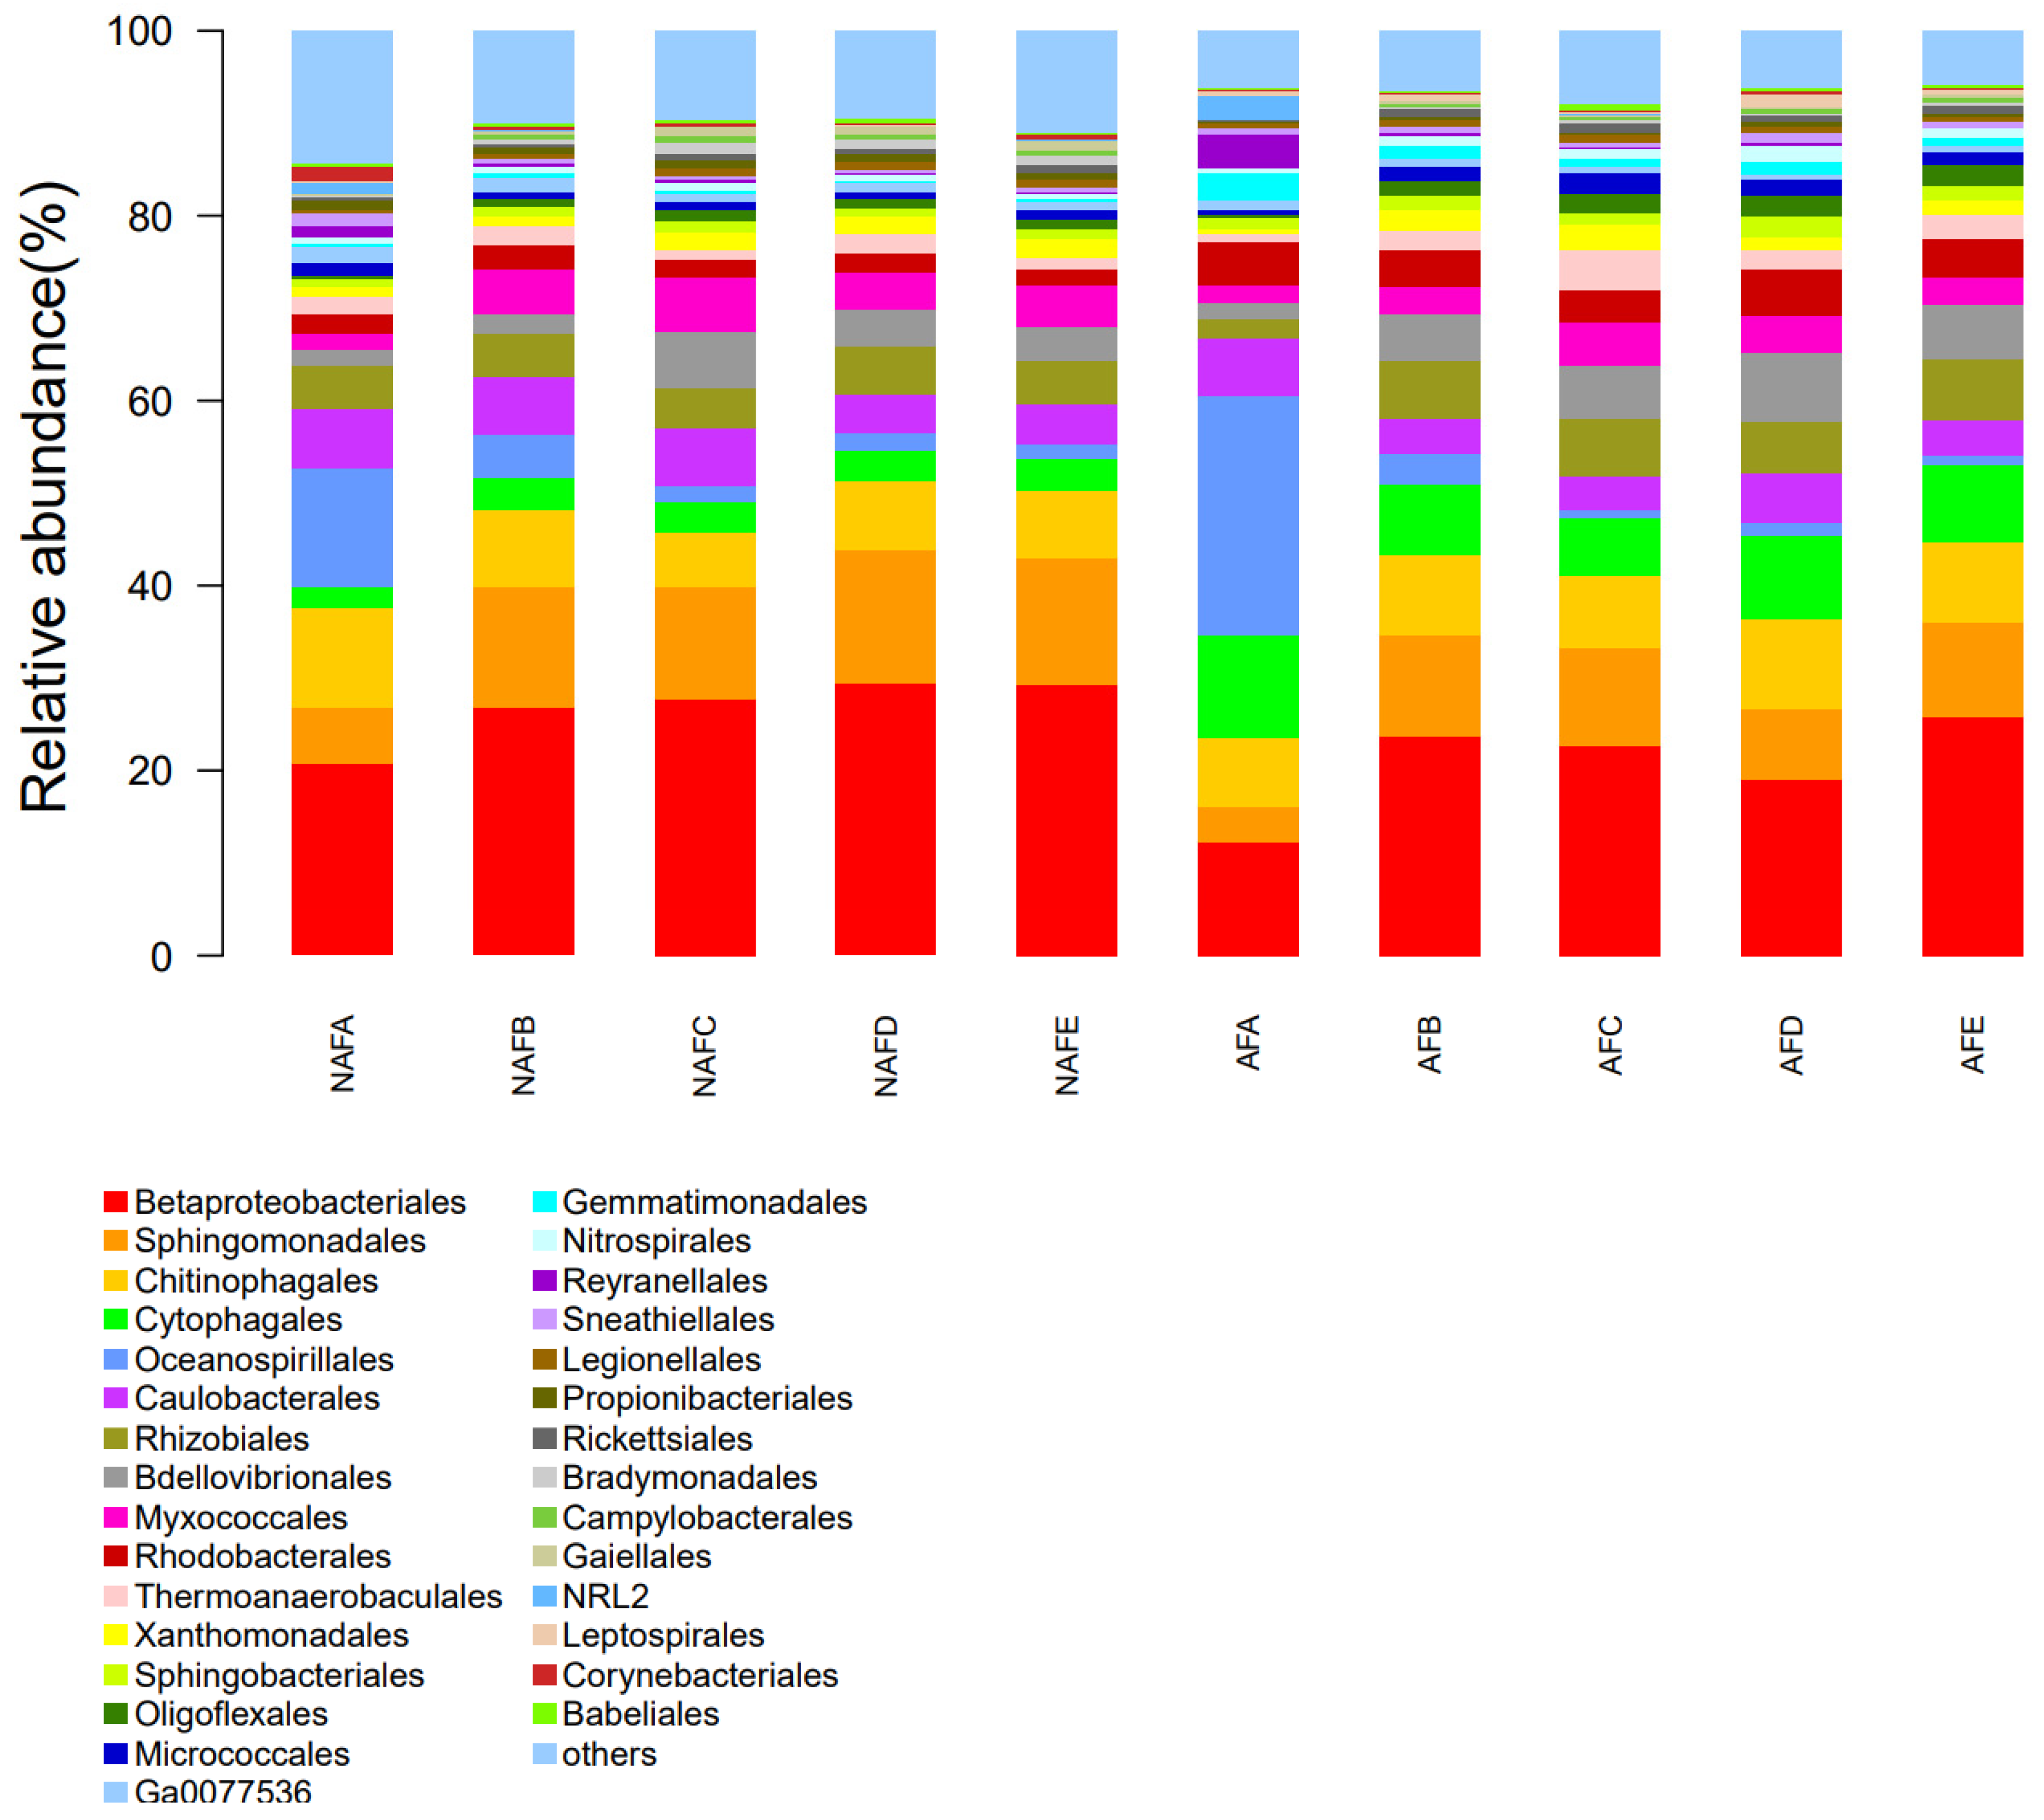
In a microbial community, a variety of groups engage in interactions with one another and coexist in a regular pattern, exhibiting distinct nutritional and metabolic characteristics. An analysis of the microbial community structure can facilitate a more profound comprehension of the microbial diversity present in emitter clogging materials. To further elucidate the impact of WFG coupling on the microbial diversity of emitter clogging materials, we conducted an analysis of the microbial community structure of the clogging materials from the emitters in the drip irrigation systems corresponding to both trial groups. During the analysis, the number of microbial communities present in the clogging materials of each emitter corresponding to the drip irrigation system was determined. The top 30 microbial communities in terms of quantity were then subjected to further analysis and the remaining unique microbial communities were represented as ’other’. Figure 9 illustrates the relative abundance of microbial communities in the clogging materials of the emitters corresponding to the drip irrigation systems for both the WFG coupling trial group and the non-aerated drip irrigation trial group.
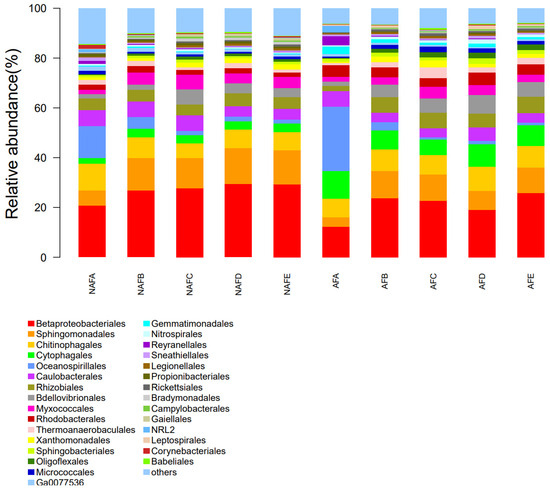
Figure 9.
Micromorphological structure of the clogged material in each irrigator (microbiological communities with the top 30 microbiological counts in the sample).
Figure 9 presents a notable disparity in the distribution of microbial communities within the clogging materials of each emitter. In conjunction with the pattern of Dra changes observed in each emitter, no discernible microbial community has been identified as a primary driver of emitter clogging. The relative abundance of microbes in the clogging materials within the emitters under both WFG coupling and non-aerated drip irrigation conditions demonstrates notable differences, indicating that microbial activity in the clogging materials also undergoes a complex process during the clogging of emitters. An examination of the distribution patterns of microbial communities in the clogging materials within the emitters in both the WFG coupling trial group and the non-aerated drip irrigation trial group reveals that under WFG coupling, a notable decrease was observed in the populations of Betaproteobacteriales, Chitinophagales, and Myxococcales, while those of Cytophagales, Babeliales, and Gemmatimonadales exhibited a significant increase.
4. Discussion
4.1. Emitter Clogging Patterns Under Water–Fertilizer–Gas Coupling
Emitter clogging represents a critical determinant of the overall performance of drip irrigation systems, exerting a pronounced influence on their service life [21]. The experimental results indicated that in both the WFG co-application trial group and the non-aerated drip irrigation and fertigation trial group, the Dra of the drip irrigation systems corresponding to each emitter gradually decreased with increasing experimental time. This finding is consistent with the results reported by Feng [22] and Li [23]. This phenomenon occurs due to the accumulation of clogging materials within the emitters over time, which directly reduces the emitter performance [24,25]. Among the five types of emitters in both trial groups, the rate of decrease in Dra is in the following order of emitters: A < C < B < D < E. When the emitter structure is analogous, the anti-clogging performance is positively correlated with the filtration area. Consequently, the larger the filtration area, the more optimal the anti-clogging performance. The clogging process of an emitter can be defined as the gradual deposition of clogging materials within the internal flow channels. The larger the filtration area, the longer it takes for clogging materials to deposit and cause blockages under the same water pressure [26]. High-flow emitters (A) have superior anti-clogging performance compared to low-flow emitters (C), which is consistent with the findings of Zheng Jian [27] and Zheng Jie [28]. In-line flap emitters demonstrate superior long-term performance compared to traditional cylindrical emitters, exhibiting an enhanced capacity to prevent internal clogging. This is attributed to their ability to effectively prevent the entry of particulate matter under drip fertigation conditions [29]. Pressure-compensated emitters are capable of maintaining a more stable flow output in the face of varying water pressure. However, in situations where water, fertilizer, and gas are in circulation, the intricate internal structure of these emitters may elevate the probability of clogging, as particulate matter is more prone to deposition within the tortuous flow channels [30]. In contrast, the non-pressure-compensated emitters demonstrated superior reliability under WFG coupling conditions, attributed to their streamlined design that effectively mitigates the accumulation of particulate matter. A comparison of the clogging processes and patterns of the same emitters in both trial groups revealed that the clogging time in the former was longer than in the latter. Notably, emitters A and E exhibited a more than 20% increase in clogging time under WFG coupling, suggesting that all emitters demonstrate enhanced anti-clogging capabilities under this configuration. Notably, this happens because when micro- and nanobubbles enter the drip irrigation system under WFG coupling, they are capable of altering the hydraulic characteristics within the system. This results in a reduction in the transport resistance of the wall to impurities in the water, thereby effectively improving the transport efficiency of impurities, which in turn slows down sedimentation [31]. For emitters of the same structure, the anti-clogging performance under the water–fertilizer–gas (WFG) coupling condition is superior to that of the non-aerated drip irrigation and fertigation trial group.
4.2. Uniformity of Drip Irrigation Systems Under Water–Fertilizer–Gas Coupling
The Christiansen uniformity coefficient ( and the statistical uniformity coefficient () of the drip irrigation systems corresponding to each emitter in both the WFG coupling and the non-aerated drip irrigation trial group demonstrate a comparable trend to the Dra, exhibiting a gradual decline over the experimental period. In both experimental treatments, the and of the drip irrigation systems for each emitter follow the order A < C < B < D < E, which is consistent with the performance of the emitters’ anti-clogging properties. An analysis of the and for the same emitter’s corresponding drip irrigation system under the two experimental treatments indicated that each emitter exhibits superior system uniformity in the WFG coupling trial group. The distribution pattern of clogged emitters also indicated that, in contrast to the non-aerated drip irrigation and fertigation trial group, where clogged emitters are primarily distributed in the front section of the drip tape, the distribution of clogged emitters along the drip tape is more uniform in the WFG coupling trial group. This occurs because, in the non-aerated drip irrigation and fertigation trial group, the clogging materials in the drip irrigation systems settle first in the front section due to the effect of gravity. Concurrently, under the non-aerated drip irrigation and fertigation treatment, oxygen and nutrients are predominantly concentrated in the front section of the drip tape, resulting in heightened microbial activity in this region. This is accompanied by the formation of a greater quantity of biofilm and clogging materials in the front section, which ultimately leads to the premature clogging of emitters situated at the forefront of the drip irrigation system [15]. Additionally, in the WFG coupling trial group, the introduction of micro- and nanobubbles, which adsorb surface-active substances, enhances the mobility of clogging materials through the drag force between the gas and liquid phases, aggregating at the tail of the bubbles [32]. The formation, contraction, and disappearance of micro- and nanobubbles facilitate the weakening of the hydrogen bonding network of water, thereby accelerating the mobility of water molecules and forming a “barrier” between the emitter flow channels and impurities in the water. This barrier prevents contact between impurities and emitter flow channels, and it slows down the deposition of clogging materials inside the emitters [33]. Concurrently, micro- and nanobubbles can generate a robust long-range hydrophobic force throughout the bridging process, augmenting the adhesion of clogging materials to the bubbles [34], reducing the probability of their detachment, and facilitating the transport of impurities and other materials that readily form clogging in emitters by water flow. This results in an enhanced uniformity of the drip irrigation system. Furthermore, in a WFG coupling system, the large specific surface area and long transmission distance of micro- and nanobubbles facilitate the uniform distribution of oxygen and nutrients throughout the drip irrigation system [35,36]. This results in more uniform microbial activity across the drip tape, which in turn reduces the local accumulation of organic matter and the subsequent distribution of clogging materials along the drip tape. It can thus be concluded that the drip irrigation systems of each emitter under WFG coupling exhibit enhanced uniformity.
4.3. Micromorphology and Microbial Diversity of Clogging Materials Under Water–Fertilizer–Gas Coupling
The micromorphology of the clogging materials indicates that all emitter clogging substances exhibit aggregation phenomena, with surfaces adhering to varying degrees of sticky and lump-like substances. The adhesion and aggregation on the surface of the clogging materials serve to exacerbate the clogging of the emitters [37]. In comparison to the non-aerated drip irrigation and fertilization experimental group, the surfaces of the clogging materials in the drip irrigation system emitters under WFG coupling are observed to be relatively smooth and flat, with less surface adhesion. This indicates that WFG coupling can significantly alter the surface characteristics of emitter clogging materials, including biofilms, precipitates, and organic matter. This is due to the fact that WFG coupling is capable of effectively increasing the dissolved oxygen content in water [38], promoting the oxidation of organic matter, and causing the clogging materials to loosen [39]. This results in a change to the micromorphological structure of the emitter clogging material surface, rendering it more susceptible to flushing away by water flow or mechanical removal, thereby alleviating emitter clogging. The WFG coupling can also result in a notable alteration of the microbial community structure within water sources. This phenomenon has been observed to facilitate the proliferation of aerobic bacteria while simultaneously inhibiting the reproduction of anaerobic bacteria [40]. The analysis of microbial diversity in the internal clogging materials of the emitters in the drip irrigation systems reveals that under WFG coupling, the Betaproteobacteriales, Chitinophagales, and Myxococcales are significantly reduced, while the Cytophagales, Babeliales, and Gemmatimonadales have significantly increased. This may be due to the fact that Cytophagales, Babeliales, and Gemmatimonadales are primarily adapted to aerobic environments [41,42] and exhibit higher aerobic activity [43]. Additionally, fertilization increases the organic matter and nutrients in the water, which are more conducive to the growth of diverse microbial groups, particularly aerobic bacteria [44]. This, in turn, increases the number of microorganisms. Concomitantly, alterations in the microbial community of the emitter’s internal clogging materials also influence the micromorphology of the clogging materials and their anti-clogging capabilities. Betaproteo bacteriales has been observed to promote the growth of biofilms [45], while Myxococcales has been shown to secrete polysaccharide mucus, producing extracellular polymeric substances (EPS), which further accelerates the formation of biofilms [46]. There is no research indicating that Chitinophagales is more prone to forming biofilms or producing EPS as part of the microbial community. However, they may engage in biofilm formation with other microorganisms, potentially increasing the likelihood of emitter clogging. Cytophagales, Babeliales, and Gemmatimonadales exhibit elevated metabolic activity in aerobic environments and demonstrate effective organic matter degradation capabilities [47]. In particular, Babeliales, as intracellular parasites, exhibit robust cell decomposition abilities [48], which can diminish the organic content of clogging materials and the formation of EPS. Concurrently, under aerobic conditions, EPS undergoes accelerated degradation [49], consequently reducing the viscosity and thickness of the biofilm. Consequently, in the context of WFG coupling, the micromorphology of the emitter clogging materials is relatively smooth and flat, exhibiting a reduction in surface adherents, an increase in microbial numbers, and an enhancement in anti-clogging performance.
Currently, the efficient anti-clogging methods for drip emitters mainly rely on the addition of chlorine or acid, which not only affect the lifespan of the drip irrigation system but also have adverse impacts on soil ecology and crop growth. This study investigates the clogging processes, system uniformity, micromorphology of clogging materials, and microbial diversity of drip irrigation systems with different emitters under water–fertilizer–gas (WFG) coupling and non-aerated drip irrigation and fertilization treatments. The results show that compared to conventional drip irrigation systems, WFG coupling drip irrigation can alter the micromorphological structure of clogging materials and microbial diversity, effectively enhancing the anti-clogging performance of the drip irrigation system. This approach is characterized by being green, safe, and efficient, and can meet the irrigation needs of different crops, offering broad application prospects.
5. Conclusions
This study aimed to investigate the effects and mechanisms of water–fertilizer–gas (WFG) coupling on the clogging characteristics of different emitter structures and the uniformity of drip irrigation systems under controlled experimental conditions. The results demonstrated that WFG coupling can significantly enhance the anti-clogging performance of emitters and improve the uniformity of the drip irrigation system. Specifically, the interior embedded non-pressure-compensated emitters exhibited a superior anti-clogging performance under WFG coupling conditions. Additionally, WFG coupling was found to alter the microbial diversity of emitter clogging materials and affect their micromorphological structure, thereby improving the overall anti-clogging performance of the emitters.
These findings provide valuable insights into the optimization of drip irrigation systems and offer a theoretical basis for the application of WFG coupling technology. The utilization of interior embedded non-pressure-compensated emitters in WFG coupling drip irrigation systems can effectively mitigate emitter clogging and extend the operational lifespan of these systems.
However, it is important to acknowledge that emitter clogging is a complex and dynamic process influenced by multiple factors, including the irrigation water source, system configuration, and crop type. While the controlled experimental conditions allowed for precise measurement and analysis, they may not fully reflect the complexities of real-world applications, such as variations in water quality, drip irrigation system configurations, and crop irrigation regimes. Future research should focus on exploring the long-term ecological and economic impacts of WFG coupling drip irrigation technology in specific agricultural settings. A comprehensive and in-depth investigation of WFG coupling drip irrigation technology will further validate its practical applicability and promote its widespread adoption in agricultural production.
Author Contributions
Conceptualization, X.W.; Methodology, A.R.J.; Validation, K.C.; Investigation, J.L.; Data curation, C.Z.; Writing—review & editing, P.L. and H.L. All authors have read and agreed to the published version of the manuscript.
Funding
This research was funded by the National Natural Science Fund of China (52479041), the Scientific and Technological Project of Henan Province (242102110226), and the Basic research Project of Farmland Irrigation Research Institute (FIRI) of Chinese Academy of Agricultural Sciences (CAAS) (IFI2024-25/IFI2024-18).
Data Availability Statement
The original contributions presented in this study are included in the article. Further inquiries can be directed to the corresponding author.
Acknowledgments
We are grateful for the National Natural Science Fund of China (52479041), the Scientific and Technological Project of Henan Province (242102110226), and the Basic research Project of Farmland Irrigation Research Institute (FIRI) of Chinese Academy of Agricultural Sciences (CAAS) (IFI2024-25/IFI2024-18).
Conflicts of Interest
The authors declare no conflict of interest.
References
- Lei, H.; Xiao, Z.; Zhang, Z.; Yang, H.; Liu, X.; Pan, H. Improving soil aeration and water and nitrogen utilization of tomato in greenhouse by coupled drip irrigation. J. Irrig. Drain. 2020, 39, 8–16. [Google Scholar] [CrossRef]
- Ben-Noah, I.; Nitsan, I.; Cohen, B.; Kaplan, G.; Friedman, S.P. Soil aeration using air injection in a citrus orchard with shallow groundwater. Agric. Water Manag. 2021, 245, 106664. [Google Scholar] [CrossRef]
- Du, Y.D.; Niu, W.Q.; Gu, X.B.; Zhang, Q.; Cui, B.J.; Zhao, Y. Crop yield and water use efficiency under aerated irrigation: A meta-analysis. Agric. Water Manag. 2018, 210, 158–164. [Google Scholar] [CrossRef]
- Pendergast, L.; Bhattarai, S.P.; Midmore, D.J. Evaluation of aerated subsurface drip irrigation on yield, dry weight partitioning and water use efficiency of a broad-acre chickpea (Cicer arietinum, L.) in a vertosol. Agric. Water Manag. 2019, 217, 38–46. [Google Scholar] [CrossRef]
- Han, M.; Wang, Z.; Zhu, Y.; Wen, Y. Effects of aeration on photosynthesis and water use efficiency of cotton under membrane drip irrigation in Northwest arid region. J. Drain. Irrig. Mach. Eng. 2024, 42, 64–70. [Google Scholar] [CrossRef]
- Nazari, S.; Shafaei, S.Z.; Gharabaghi, M.; Ahmadi, R.; Shahbazi, B.; Shahbazi, B.; Maoming, F. Effects of nanobubble and hydrodynamic parameters on coarse quartz flotation. Int. J. Min. Sci. Technol. 2019, 29, 289–295. [Google Scholar] [CrossRef]
- Li, Y.; Zhou, B.; Yang, P. Research progress on mechanism and control methods of irrigator clogging in drip irrigation system. J. Hydraul. Eng. 2018, 49, 103–114. [Google Scholar] [CrossRef]
- Pereira, D.J.D.; Lavanholi, R.; de Araújo, A.C.S.; de Camargo, A.P.; Ait-Mouheb, N.; Frizzone, J.A.; Midmore, D.J. Evaluating sensitivity to clogging by solid particles in irrigation emitters: Assessment of a laboratory protocol. J. Irrig. Drain. Eng. 2020, 146, 04020033. [Google Scholar] [CrossRef]
- Li, J.; Li, Y.; Wang, J.; Wang, Z.; Zhao, W. Micro-irrigation in China: History, present situation and future. J. Hydraul. Eng. 2016, 47, 372–381. [Google Scholar] [CrossRef]
- Wang, H.; Ling, G.; Wang, W.; Hu, X.; Gao, X.J. A Prediction Model of Labyrinth Emitter Service Duration (ESD) under Low-Quality (Sand-Laden Water) Irrigation. Water 2022, 14, 1690. [Google Scholar] [CrossRef]
- Huang, Q.; Liu, A.; Zhang, L. Properties of micro-nano bubbles and their application to soil environment improvement. Chin. J. Environ. Eng. Technol. 2022, 12, 1324–1332. [Google Scholar] [CrossRef]
- Li, H.; Li, H.; Han, Q.; Huang, X.; Jiang, Y.; Sun, H.; Li, H. Influence of micro/nanobubbles on clogging in drip irrigation systems. RSC Adv. 2020, 10, 42338. [Google Scholar] [CrossRef] [PubMed]
- Wu, H.; Wu, W.; Chen, K. Research Progress of bubble drag reduction in ships. Shipbuild. China 2019, 60, 212–227. [Google Scholar]
- Liu, L.; Niu, W.; Wu, Z.; Guan, Y.; Li, Y. Risk and induced mechanism of dropper clogging in accelerated fertilizer drip irrigation. Trans. Chin. Soc. Agric. Mach. 2017, 48, 228–236. [Google Scholar] [CrossRef]
- Diogo, A.F.; Resende, R.A.; Oliveira, A.L. Optimised selection of water supply and irrigation sources—A case study on surface and underground water, desalination, and wastewater reuse in a Sahelian coastal arid region. Sustainability 2021, 13, 12696. [Google Scholar] [CrossRef]
- EP405.1 FEB03; Design and Installation of Microirrigation Systems. ASAE Standards: St. Joseph, MI, USA, 2003.
- Dai, J.; Fan, X.; Liang, Y.; Sun, L. Verification of standard curve for determination of concentration of fertilizer solution by conductivity method. Phosphate Compd. Fertil. 2005, 4, 15–17. [Google Scholar] [CrossRef]
- ISO 9261; Agricultural Irrigation Equipment. Emitters and Emitting Pipe. Specification and Test Methods. International Organization for Standardization: Geneva, Switzerland, 2004.
- Caporaso, J.G.; Kuczynski, J.; Stombaugh, J.; Bittinger, K.; Bushman, F.D.; Costello, E.K. Qiime allows analysis of high-throughput community sequencing data. Nat. Methods 2010, 7, 335–336. [Google Scholar] [CrossRef] [PubMed]
- Rognes, T.; Flouri, T.; Nichols, B.; Quince, C.; Mahé, F. VSEARCH: A versatile open source tool for metagenomics. PeerJ 2016, 4, e2584. [Google Scholar] [CrossRef]
- Reinders, F.; Van Niekerk, A. Technology smart approach to keep drip irrigation systems functional. Irrig. Drain. 2018, 67, 82–88. [Google Scholar] [CrossRef]
- Feng, J.; Li, Y.; Liu, Z.; Muhammad, T.; Wu, R. Composite clogging characteristics of emitters in drip irrigation systems. Irrig. Sci. 2019, 37, 105–122. [Google Scholar] [CrossRef]
- Li, H.; Ma, Z.; Zhang, G.; Chen, J.; Lu, Y.; Li, P. Performance of a Drip Irrigation System under the Co-Application of Water, Fertilizer, and Air. Horticulturae 2023, 10, 6. [Google Scholar] [CrossRef]
- Shen, Y.; Puig-Bargués, J.; Li, M.; Xiao, Y.; Li, Q.; Li, Y. Physical, chemical and biological emitter clogging behaviors in drip irrigation systems using high-sediment loaded water. Agric. Water Manag. 2022, 270, 107738. [Google Scholar] [CrossRef]
- Xiao, Y.; Ma, C.; Li, M.; Zhangzhong, L.; Song, P.; Li, Y. Interaction and Adaptation of Phosphorus Fertilizer and Calcium Ion in Drip Irrigation Systems: The Perspective of Emitter Clogging. Agric. Water Manag. 2023, 282, 108269. [Google Scholar] [CrossRef]
- Tan, S.; Shen, Y.; Liu, Y.; Wang, X.; Xiao, Y.; Li, Y. Anti-clogging effect and mechanism of nano-bubbles on irrigators in biogas slurry drip irrigation system. Trans. Chin. Soc. Agric. Eng. 2022, 38, 79–87. [Google Scholar] [CrossRef]
- Zheng, J.; Zhao, Y.; Chen, Y. Plugging characteristics of different types of irrigators under biogas drip irrigation. Water Sav. Irrig. 2024, 8, 110–116. [Google Scholar] [CrossRef]
- Zheng, J.; Chen, H.; Meng, L.; Li, S.; Ma, L. Influence of different types of irrigator drops on plugging resistance of biogas slurry. Chin. J. Agric. Sci. Technol. 2022, 24, 108–116. [Google Scholar] [CrossRef]
- Hou, P.; Xiao, Y.; Wu, N.; Wang, H.; Ma, Y.; Li, Y. A study on the relationship between irrigator structure-silting-clogging behavior in the Yellow River drip irrigation system. J. Hydraul. Eng. 2020, 51, 1372–1382. [Google Scholar] [CrossRef]
- Hou, J.; Zhang, E.; Sun, Y.; Zhang, L.; Zhou, K. Structural optimization and Performance analysis of button-type pressure compensation irrigator. Trans. Chin. Soc. Agric. Eng. 2022, 38, 100–108. [Google Scholar] [CrossRef]
- Tanaka, S.; Kastens, S.; Fujioka, S.; Schlüter, M.; Terasaka, K. Mass transfer from freely rising microbubbles in aqueous solutions of surfactant or salt. Chem. Eng. J. 2020, 387, 121246. [Google Scholar] [CrossRef]
- Li, C.; Cui, Y.; Shi, X.; Gao, J.; Lan, X. Direct numerical simulation of mass transfer process of single free rising microbubbles under the influence of surface active materials. Process Eng. J. 2021, 21, 877–886. [Google Scholar]
- Zhu, J.; An, H.; Alheshibri, M.; Liu, L.; Terpstra, P.M.; Liu, G.; Craig, V.S. Cleaning with bulk nanobubbles. Langmuir 2016, 32, 11203–11211. [Google Scholar] [CrossRef] [PubMed]
- Han, F.; Liu, A.; Fan, M. Effect of micro-nano bubbles on the flotation of coarse coal. Min. Res. Dev. 2020, 40, 111–116. [Google Scholar] [CrossRef]
- Bhattarai, S.P.; Balsys, R.J.; Eichler, P.; Midmore, D.J.; Wassink, D. Dynamic changes in bubble profile due to surfactant and tape orientation of emitters in drip tape during aerated water irrigation. Int. J. Multiph. Flow 2015, 75, 137–143. [Google Scholar] [CrossRef]
- Temesgen, T.; Bui, T.T.; Han, M.; Kim, T.I.; Park, H. Micro and nanobubble technologies as a new horizon for water-treatment techniques: A review. Adv. Colloid Interface Sci. 2017, 246, 40–51. [Google Scholar] [CrossRef]
- Wang, W.; Xu, F.; Zhou, B.; Feng, J.; Li, Y. Structural and fractal characteristics of biofilm attached on surfaces of sediments in yellow river for drip irrigation. J. Drain. Irrig. Mach. Eng. 2014, 32, 914–920. [Google Scholar] [CrossRef]
- Liu, Y.; Wang, G.; Wang, C.; Zhang, X.; Li, H.; Si, B. Bubble transport characteristics and influencing factors in micro-nano aerated drip irrigation systems. Trans. Chin. Soc. Agric. Eng. 2023, 39, 88–96. [Google Scholar] [CrossRef]
- Liu, C.; She, C.; Su, Y.; Zhang, T.; Huang, Z.; Lin, Y. Effects of micro-nano aeration on bacterial and phosphorus-functional bacteria communities in reservoir sediments. J. Environ. Eng. 2022, 16, 1340–1352. [Google Scholar]
- Wang, S.; Liu, Y.; Li, P. Effects of micro-nano bubbles on aerobic microbial communities in small and micro water bodies. China Water Supply Drain. 2020, 36, 29–34. [Google Scholar] [CrossRef]
- Song, X.; Sun, S.; Zhou, L.; Gao, Y.; Tang, M.; Jiang, C.; Chen, J. Inoculation of aerobic granular sludge to achieve granulation under high dissolved oxygen and the associated mechanisms. J. Water Process Eng. 2021, 42, 102168. [Google Scholar] [CrossRef]
- Rosas-Echeverría, K.; Fall, C.; Gutiérrez-Segura, E.; Romero-Camacho, M.P.; Ba, K.M. Mechanisms of persistence and impact of ordinary heterotrophic organisms in aerobic granular sludge. Bioresour. Technol. 2023, 384, 129346. [Google Scholar] [CrossRef]
- Fujii, N.; Kuroda, K.; Narihiro, T.; Aoi, Y.; Ozaki, N.; Ohashi, A.; Kindaichi, T. Metabolic potential of the superphylum Patescibacteria reconstructed from activated sludge samples from a municipal wastewater treatment plant. Microbes Environ. 2022, 37, ME22012. [Google Scholar] [CrossRef]
- Xiao, Q.; Wang, Q.; Wu, L.; Cai, A.; Wang, C.; Zhang, W.; Xu, M. Integrated analysis of effects of fertilization on soil microbial community structure and enzyme activity in farmland in China. Plant Nutr. Fertil. J. 2018, 24, 1598–1609. [Google Scholar] [CrossRef]
- Van der Kooij, D.; Veenendaal, H.R.; Italiaander, R.; Van der Mark, E.J.; Dignum, M. Primary colonizing Betaproteobacteriales play a key role in the growth of Legionella pneumophila in biofilms on surfaces exposed to drinking water treated by slow sand filtration. Appl. Environ. Microbiol. 2018, 84, e01732-18. [Google Scholar] [CrossRef] [PubMed]
- Wang, C.; Feng, G.; Yao, Q.; Li, A.; Zhu, H. Advances in Myxobacterium genomics. Bull. Microbiol. 2019, 46, 2394–2403. [Google Scholar] [CrossRef]
- Daims, H.; Lebedeva, E.V.; Pjevac, P.; Han, P.; Herbold, C.; Albertsen, M.; Wagner, M. Complete nitrification by Nitrospira bacteria. Nature 2015, 528, 504–509. [Google Scholar] [CrossRef] [PubMed]
- Pagnier, I.; Yutin, N.; Croce, O.; Makarova, K.S.; Wolf, Y.I.; Benamar, S.; La Scola, B. Babela massiliensis, a representative of a widespread bacterial phylum with unusual adaptations to parasitism in amoebae. Biol. Direct 2015, 10, 1–17. [Google Scholar] [CrossRef]
- Xu, R.; Fu, Y.; Xu, Y.; Zheng, X.; Huang, Y.; Meng, F. Comparing biotransformation of extracellular polymeric substances (EPS) under aerobic and anoxic conditions: Reactivities, components, and bacterial responses. Chemosphere 2022, 296, 133996. [Google Scholar] [CrossRef]

Disclaimer/Publisher’s Note: The statements, opinions and data contained in all publications are solely those of the individual author(s) and contributor(s) and not of MDPI and/or the editor(s). MDPI and/or the editor(s) disclaim responsibility for any injury to people or property resulting from any ideas, methods, instructions or products referred to in the content. |
© 2025 by the authors. Licensee MDPI, Basel, Switzerland. This article is an open access article distributed under the terms and conditions of the Creative Commons Attribution (CC BY) license (https://creativecommons.org/licenses/by/4.0/).