Article

Interspecies Conservation of Gene Expression Patterns in Brassica Reproductive Organs Unveiled by Comparative Transcriptomics

1
State Key Laboratory of Crop Genetics & Germplasm Enhancement, Key Laboratory of Biology and Genetic Improvement of Horticultural Crops (East China), Ministry of Agriculture and Rural Affairs of the P. R. China, Engineering Research Center of Germplasm Enhancement and Utilization of Horticultural Crop, Ministry of Education of the P. R. China, College of Horticulture, Nanjing Agricultural University, Nanjing 210095, China
2
State Key Laboratory of Vegetable Biobreeding, Institute of Vegetables and Flowers, Chinese Academy of Agricultural Sciences, Beijing 100081, China
*
Authors to whom correspondence should be addressed.
Horticulturae 2025, 11(4), 427; https://doi.org/10.3390/horticulturae11040427
Submission received: 3 March 2025 / Revised: 14 April 2025 / Accepted: 15 April 2025 / Published: 16 April 2025
(This article belongs to the Section Genetics, Genomics, Breeding, and Biotechnology (G2B2))

Abstract

:
Brassica species evolved through recurrent polyploidization and chromosomal rearrangements, forming diploid progenitors that hybridize into allopolyploids. These plants exhibit remarkable morphological diversity, with specialized edible organs including leaf-, stem-, root-, and oil-type cultivars, yet cross-species multi-organ transcriptomic studies elucidating their gene expression similarities and divergences remain lacking. To address this gap, we analyzed publicly available transcriptomes (downloaded from NCBI SRA) from eight organs (embryo, seed coat, silique, root, stem, leaf, flower and seedling) across six U’s Triangle species (Brassica rapa, B. nigra, B. oleracea, B. juncea, B. napus, B. carinata), revealing that (1) reproductive organs show higher gene expression conservation (GEC), particularly embryos (p < 0.05); (2) lineage-specific subgenome dominance patterns (BnaC/BjuB/BcaC) persist across organs; and (3) ancestral subgenomes functionally specialize, with MF2-subgenome transcription factors (YABBY/GRF) regulating embryogenesis and LF/MF1-subgenome MYBs controlling seed coat development. Comparative analyses demonstrate floral GEC exceeds that of the Arabidopsis thaliana homologs, while also exhibiting seed-specific divergence patterns. This study establishes a comprehensive Brassica multispecies expression atlas, elucidating organ-specific evolutionary conservation principles and providing molecular insights into subgenome functional partitioning, which offers valuable perspectives for understanding Brassica evolutionary mechanisms and crop improvement strategies.

1. Introduction

The Brassica genus, encompassing globally significant vegetable and oilseed crops, serves as a premier model for studying polyploid genome evolution [1]. Central to this system is U’s Triangle [2], comprising three diploid mesopolyploids—Brassica rapa (AA), B. nigra (BB), and B. oleracea (CC)—that generate three amphidiploids through interspecific hybridization: B. juncea (AABB), B. napus (AACC), and B. carinata (BBCC). Recent advances in pan-genome sequencing have resolved the genomic architectures of all six species [3,4,5,6,7,8,9,10,11], revealing critical insights into their post-polyploidization evolution. Following a whole-genome triplication event (13–17 MYA) [12,13,14], Brassica species exhibit asymmetric subgenome retention patterns (LF/MF1/MF2) with differential gene expression dominance—a phenomenon termed “subgenome dominance” [14,15,16].
The remarkable organ diversity of Brassica crop, spanning roots (turnip, kohlrabi and rutabaga), stems (Chinese kale and stem mustard), leaves (Chinese cabbage, cabbage and potherb mustard), and floral shoots (broccolini and Caixin), reflects organ-specific adaptations, critical for agronomic productivity under diverse stress conditions [17]. Whole-transcriptome sequencing has emerged as a pivotal tool for dissecting these traits, enabling systematic comparisons of gene expression networks governing stress resilience [18] and flowering regulation [19]. However, convergent evolution in organ morphology is observed between B. rapa and B. oleracea, leading us to hypothesize that orthologous organs exhibit gene expression conservation (GEC) across Brassica species.
Despite progress in reference-based and de novo transcriptomic approaches [20,21,22,23,24,25,26,27,28,29,30], two unresolved questions remain: (1) how GEC varies in multi-species organ systems; (2) whether subgenomes differentially regulate organ-specific programs. To resolve these gaps, we constructed the first multispecies Brassica organ expression atlas, integrating 112 RNA-seq datasets spanning eight organs (embryo, seed coat, silique, root, stem, leaf, flower, and seedling) across U’s Triangle species and A. thaliana.
Our systematic analysis reveals three evolutionary signatures: (1) hierarchical GEC (embryo > flower > seed coat > silique > vegetative organs), maintained across ancestral karyotype subgenomes (ABC/tPCK) [31]; (2) similar conservation patterns, seen in comparisons of Brassica and A. thaliana; (3) subgenome functional specialization, with MF2-enriched YABBY/GRF (GROWTH-REGULATING FACTOR) transcription factors governing embryogenesis versus LF/MF1-driven MYB networks controlling seed coat development. These findings establish a framework for understanding polyploid evolution through the lens of organ-specific expression conservation.

2. Materials and Methods

2.1. Transcriptome and Reference Genome Data Collection

We established a comparative transcriptomic framework encompassing six Brassica species: three diploid progenitors (B. rapa [AA], B. nigra [BB], B. oleracea [CC]) and their derived amphidiploids (B. juncea [AABB], B. napus [AACC], B. carinata [BBCC]). A total of 112 RNA sequencing datasets were compiled from NCBI, covering eight organ systems (embryo, seed coat, silique, root, stem, leaf, flower and seedling) of the above six Brassica species and A. thaliana (Table S1).
Sequence and annotation information for the genomes were obtained from the BRAD V3.0 database [32] for genome versions Brara_Chiifu_V3.5, Brani_Ni100_V2, Braol_JZS_V2.0, Braju_tum_V2.0, Brana_ZS_HZAU_V1.0, Braca_zd1_V1.0 and Ath_TAIR_V10.1.

2.2. RNA-Seq Data Processing

The raw reads were filtered using fastp v0.20.1 [33], and then the filtered reads were compared to the corresponding reference genomes using HISAT2 v2.2.1 [34], with transcript abundance quantified as TPM (transcripts per million) values [35]. TPM values with multiple biological replicates were averaged for subsequent analysis. Post-normalization, biological replicates and developmental stages were averaged, followed by the removal of low-expression genes (TPM < 2 across all organs), yielding species-specific expression matrices.

2.3. Organ Specific Genes (SPM Genes) Identification

To identify organ specific genes, we calculated a specificity measure (SPM) for each gene, which ranged from 0 (not expressed in an organ) to 1 (expressed only in an organ) [36]. We used four thresholds to capture organ-specific genes, and we first ranked the SPM values of each gene in descending order, and then extracted the genes with the top 2%, 5%, 10%, and 20% of SPM values, respectively. For ABC subgenomes, we distinguished SPM genes from total SPM genes based on gene annotation file. For tPCK subgenomes, we distinguished SPM genes from total SPM genes based on the syntenic gene list in BRAD V3.0 [32].

2.4. Calculation of Jaccard Coefficients (JCCs) Between Organs of Different Genomes and Subgenomes

Based on the list of syntenic genes in BRAD V3.0 [32], we calculated the JCCs of organs by using the syntenic gene pairs in the SPM gene set of each organ of the different genomes and subgenomes as intersections. The JCCs ranged from 0 (none of the SPM genes in both organs were syntenic genes) to 1 (both SPM genes in both organs were syntenic genes).

2.5. Enrichment Analysis of Gene Regulatory Pathways and TFs

Gene regulatory pathways and TFs were annotated for each gene using Mercator4 v7.0 [37] and PlantTFDB v5.0 [38], respectively. The number of each pathway and TF was calculated, and then multiple tests were performed via the Benjamini–Hochberg correction method using Python v3.8.13 scripts, with a p-value < 0.05 as the criterion for enrichment. An ANOVA significance [39] of difference test was performed for the overall significance of differences, Tukey’s HSD multiple comparisons [39] were taken between the different data, and the significance of the differences was labeled using an alphabetical scale.

2.6. Phylogenetic Analysis of TF Families

The sequences of TF family proteins were integrated into a fasta file. MUSCLE v3.8.31 [40] was used to perform multiple sequence alignment, and the alignment results were then processed to construct a phylogenetic tree using IQ-TREE v2.0.3 [41] with parameters of -b 1000 -redo -alrt 1000 -m MFP -nt AUTO.

2.7. Image Plotting

The phylogenetic tree was visualized and landscaped using iTOL v6 [42] and Adobe Illustrator 2024, and all tables in Supplementary Materials were visualized using Python v3.8.13 + Matplotlib v 3.7.5 and then landscaped using Adobe Illustrator 2024.

3. Results

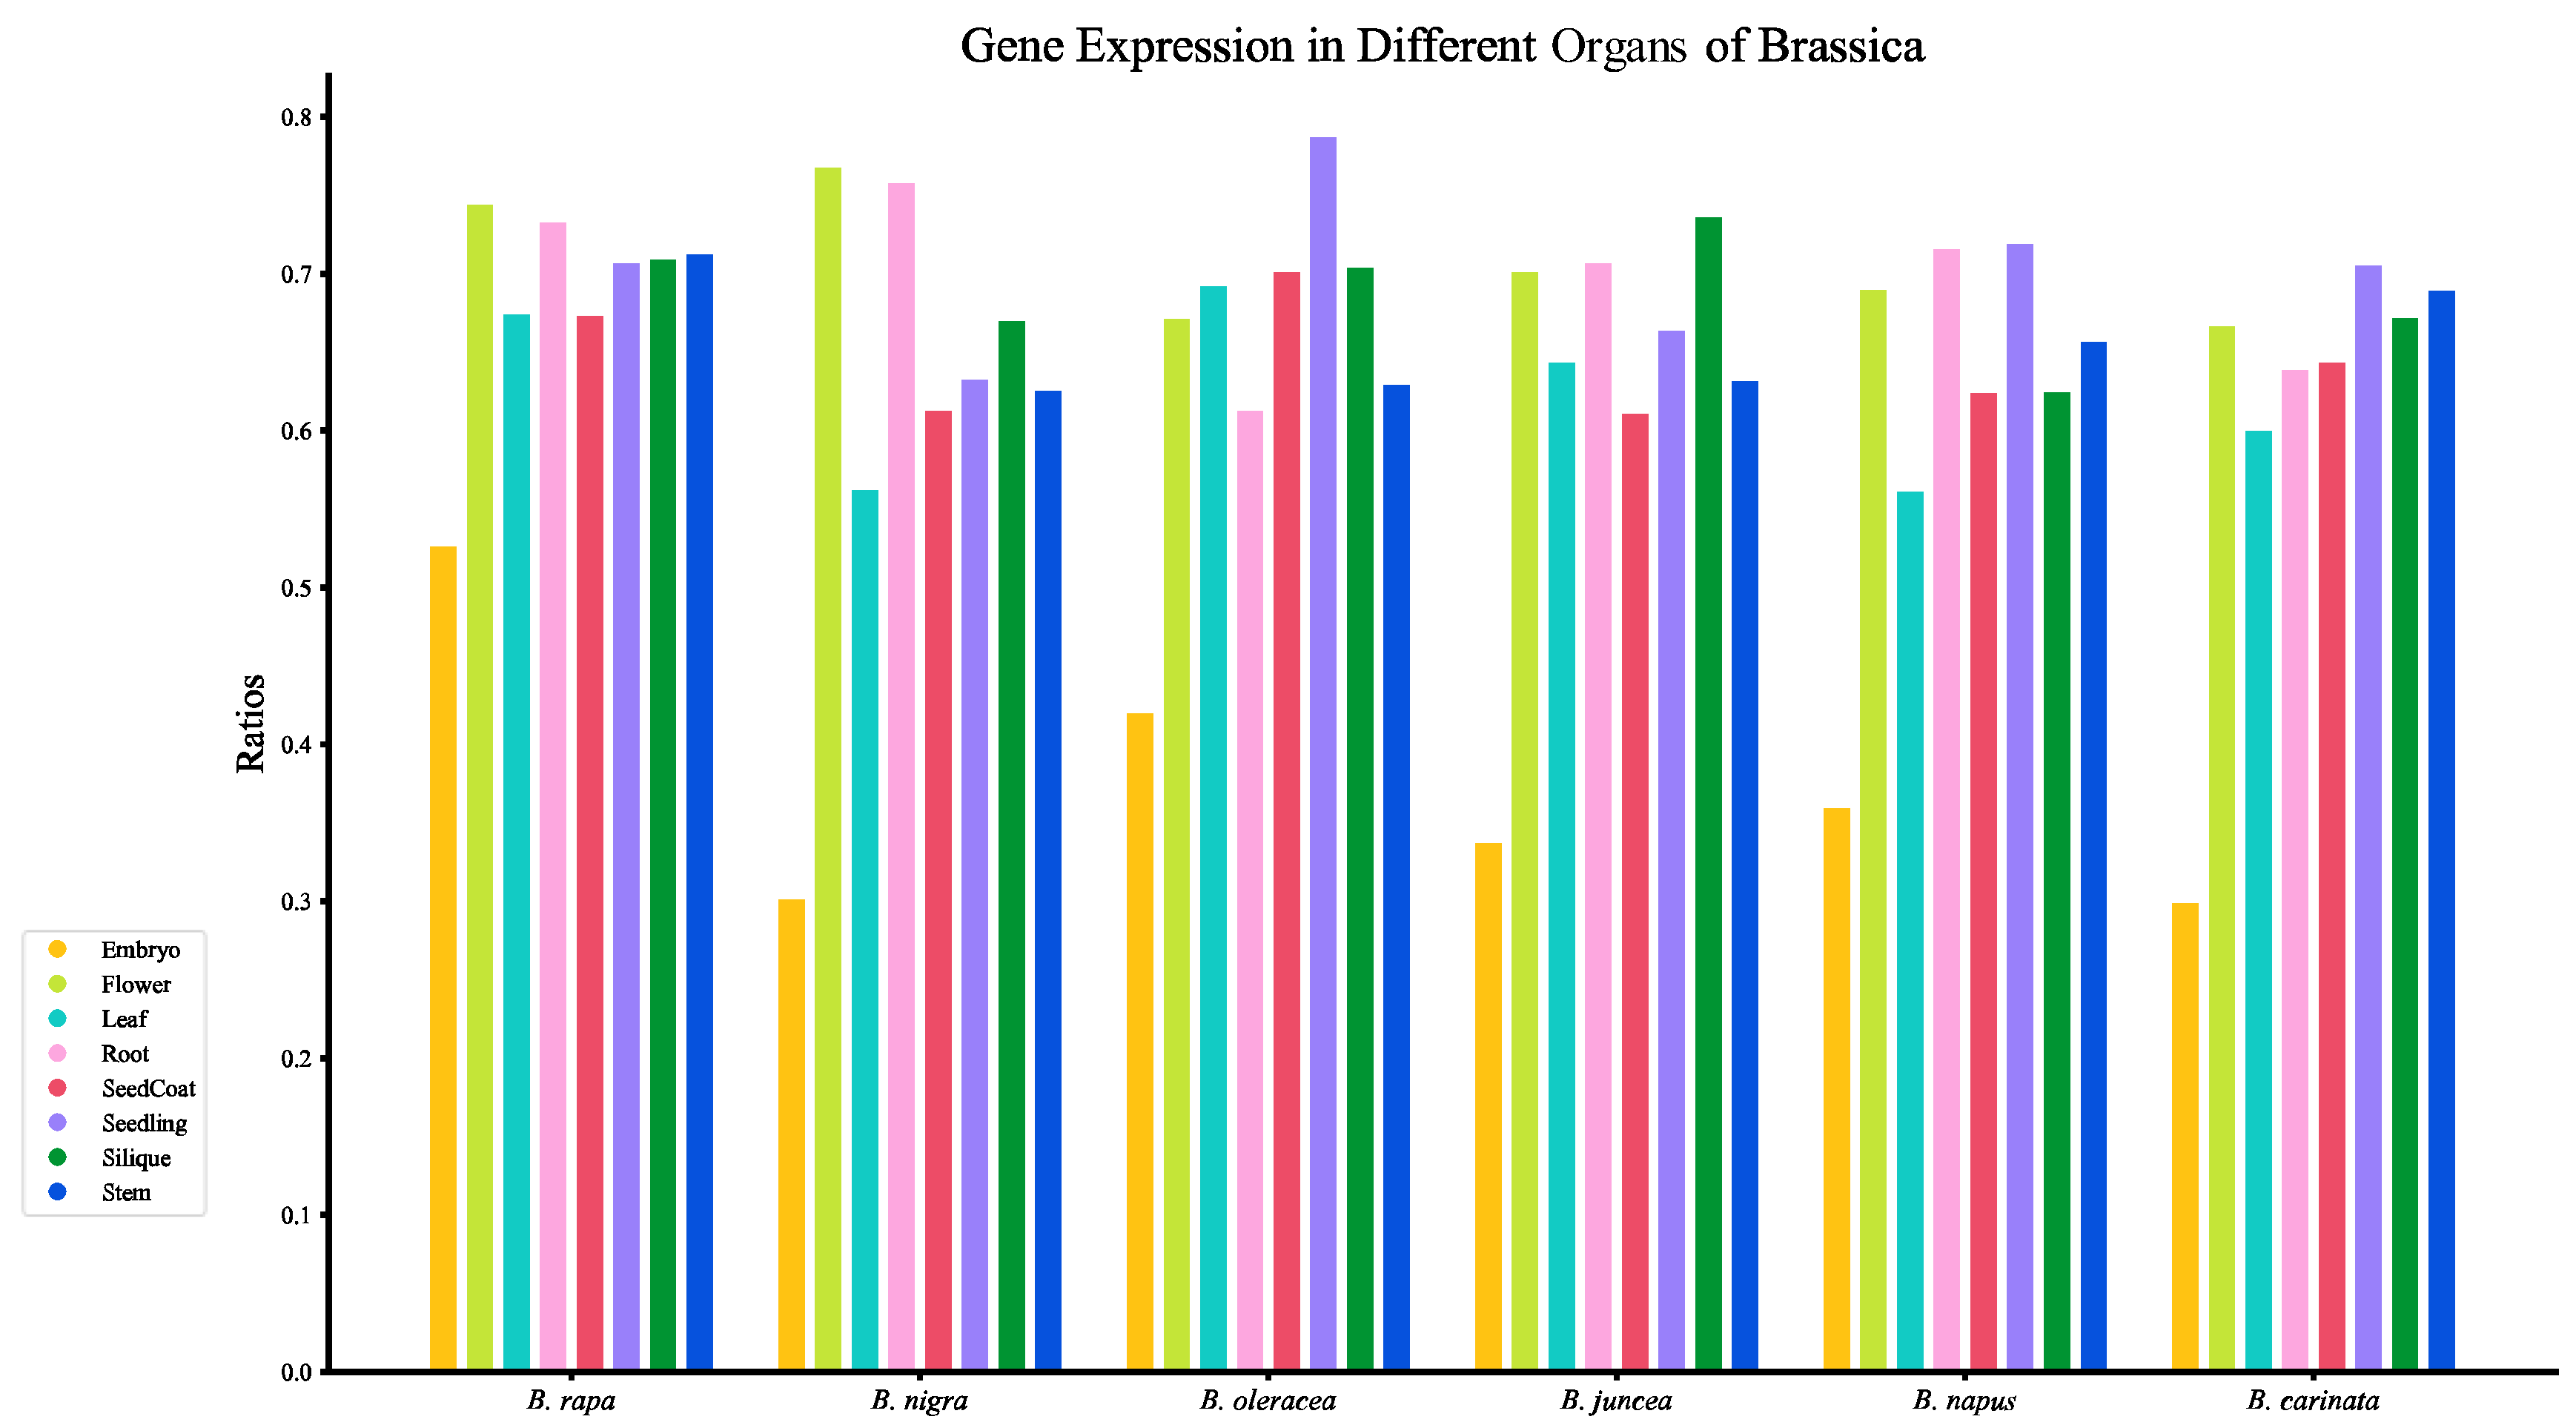
3.1. Multi-Organ Gene Expression Atlas of 6 Brassica Species

We filtered and compared the collected raw data to the reference genome and then calculated TPM, performing filtering and integration to obtain Table S2. Among the analyzed species, diploid Brassica accessions (B. rapa, B. nigra, and B. oleracea) exhibited 31,088, 34,820, and 32,656 expressed genes in at least one organ, representing 65.80%, 58.18%, and 55.29% of their respective genomes. Notably, the polyploid species (B. juncea, B. napus, and B. carinata) demonstrated higher absolute counts, with 61,005, 61,322, and 53,141 expressed genes, corresponding to 60.50%, 60.76%, and 54.70% of their total gene complements. There were 20,242 genes expressed in Arabidopsis, accounting for 81.852% of the total number of genes.
We quantified gene expression patterns in organs by calculating the proportion of expressed genes relative to the total gene repertoire in Brassica species and A. thaliana (Table S3). In Brassica organs, the expression proportions ranged from 29.858% to 78.678%, with embryos showing the lowest expression level (mean 37.35%), while other organs maintained proportions above 60% (Figure 1). In contrast, A. thaliana exhibited significantly higher expression activity across all organs, with proportions ranging from 71.693% to 86.202%.
Through the systematic mapping of expressed genes to corresponding subgenomes, we quantified subgenome-specific expression profiles across all organs (Table S3). The analysis revealed distinct dominance patterns: BnaC emerged as the dominant subgenome in B. napus, BjuB emerged as the dominant subgenome in B. juncea, and BcaC emerged as the dominant subgenome in B. carinata. Notably, the LF subgenome consistently maintained transcriptional dominance across all examined organs, demonstrating the evolutionary conservation of subgenome bias that aligns with established genomic divergence patterns in Brassica species [10,15,43,44].

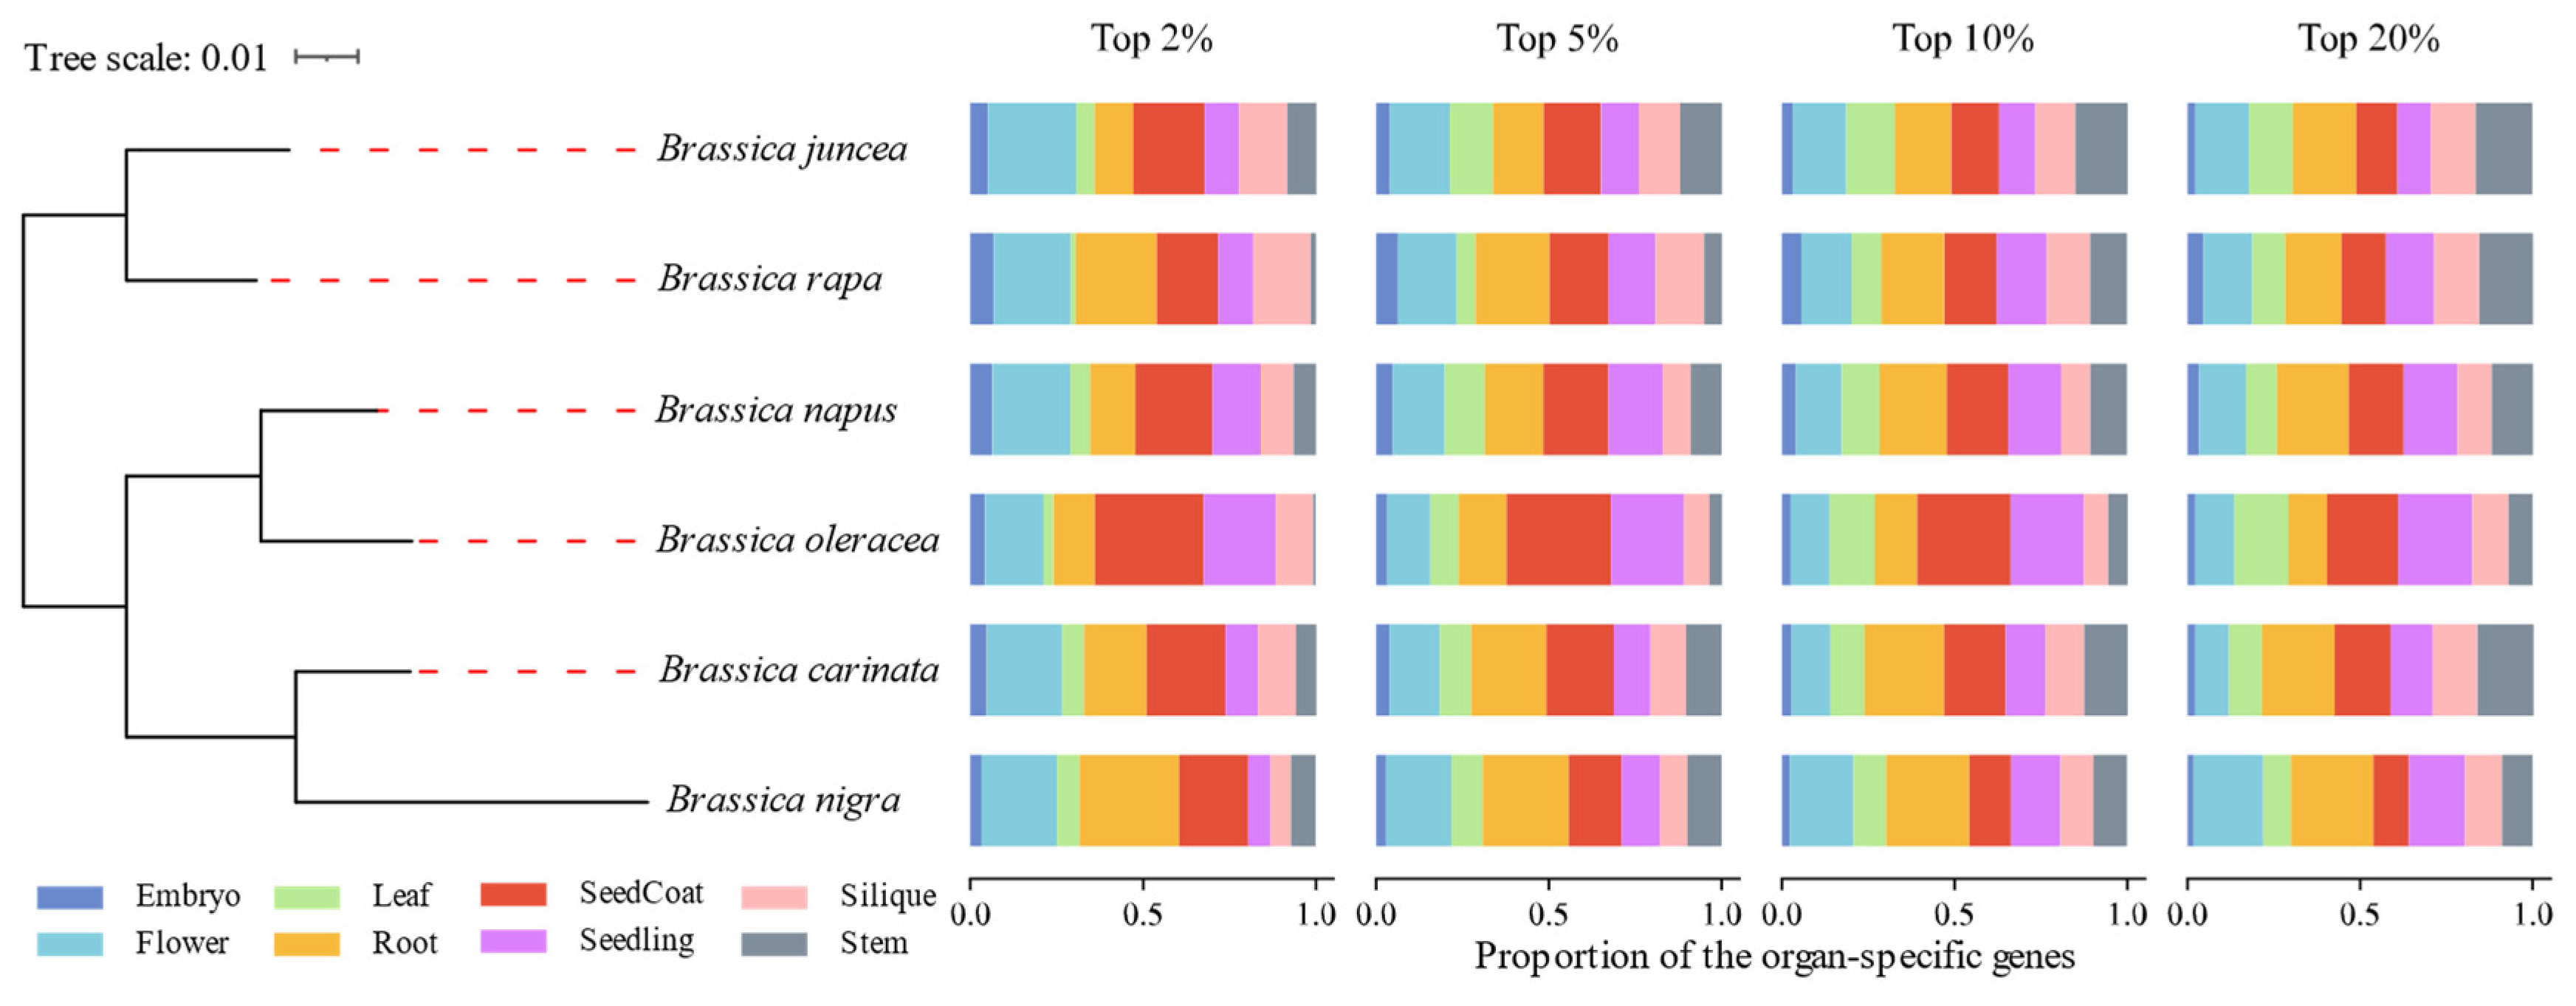
3.2. Conserved SPM Genes Allocation Patterns

We calculated the SPM genes in every genome and every organ, and matched them to the subgenomes to obtain a set of SPM gene lists under each threshold (Supplementary zip 1); we then further calculated the proportions of SPM genes (Tables S4 and S5). The results showed that at the 2% threshold, the top 3 organs with the proportions of SPM genes in all species genomes, ABC subgenomes, and tPCK karyotypic subgenomes related to flower and seed coat (except for the seed coat of the Bra_LF subgenome) (Figure 2 and Figures S1 and S2); at the 5% threshold, the top 3 organs with the proportions of SPM genes in all species genomes, ABC subgenomes, and tPCK karyotypic subgenomes related to root and seed coat (BjuA_MF2 and BnaA_MF1 with the exception of the seed coat). No clear pattern was evident in the first 3 organs of SPM gene ratios for all species when the thresholds were expanded to 10% and 20%.

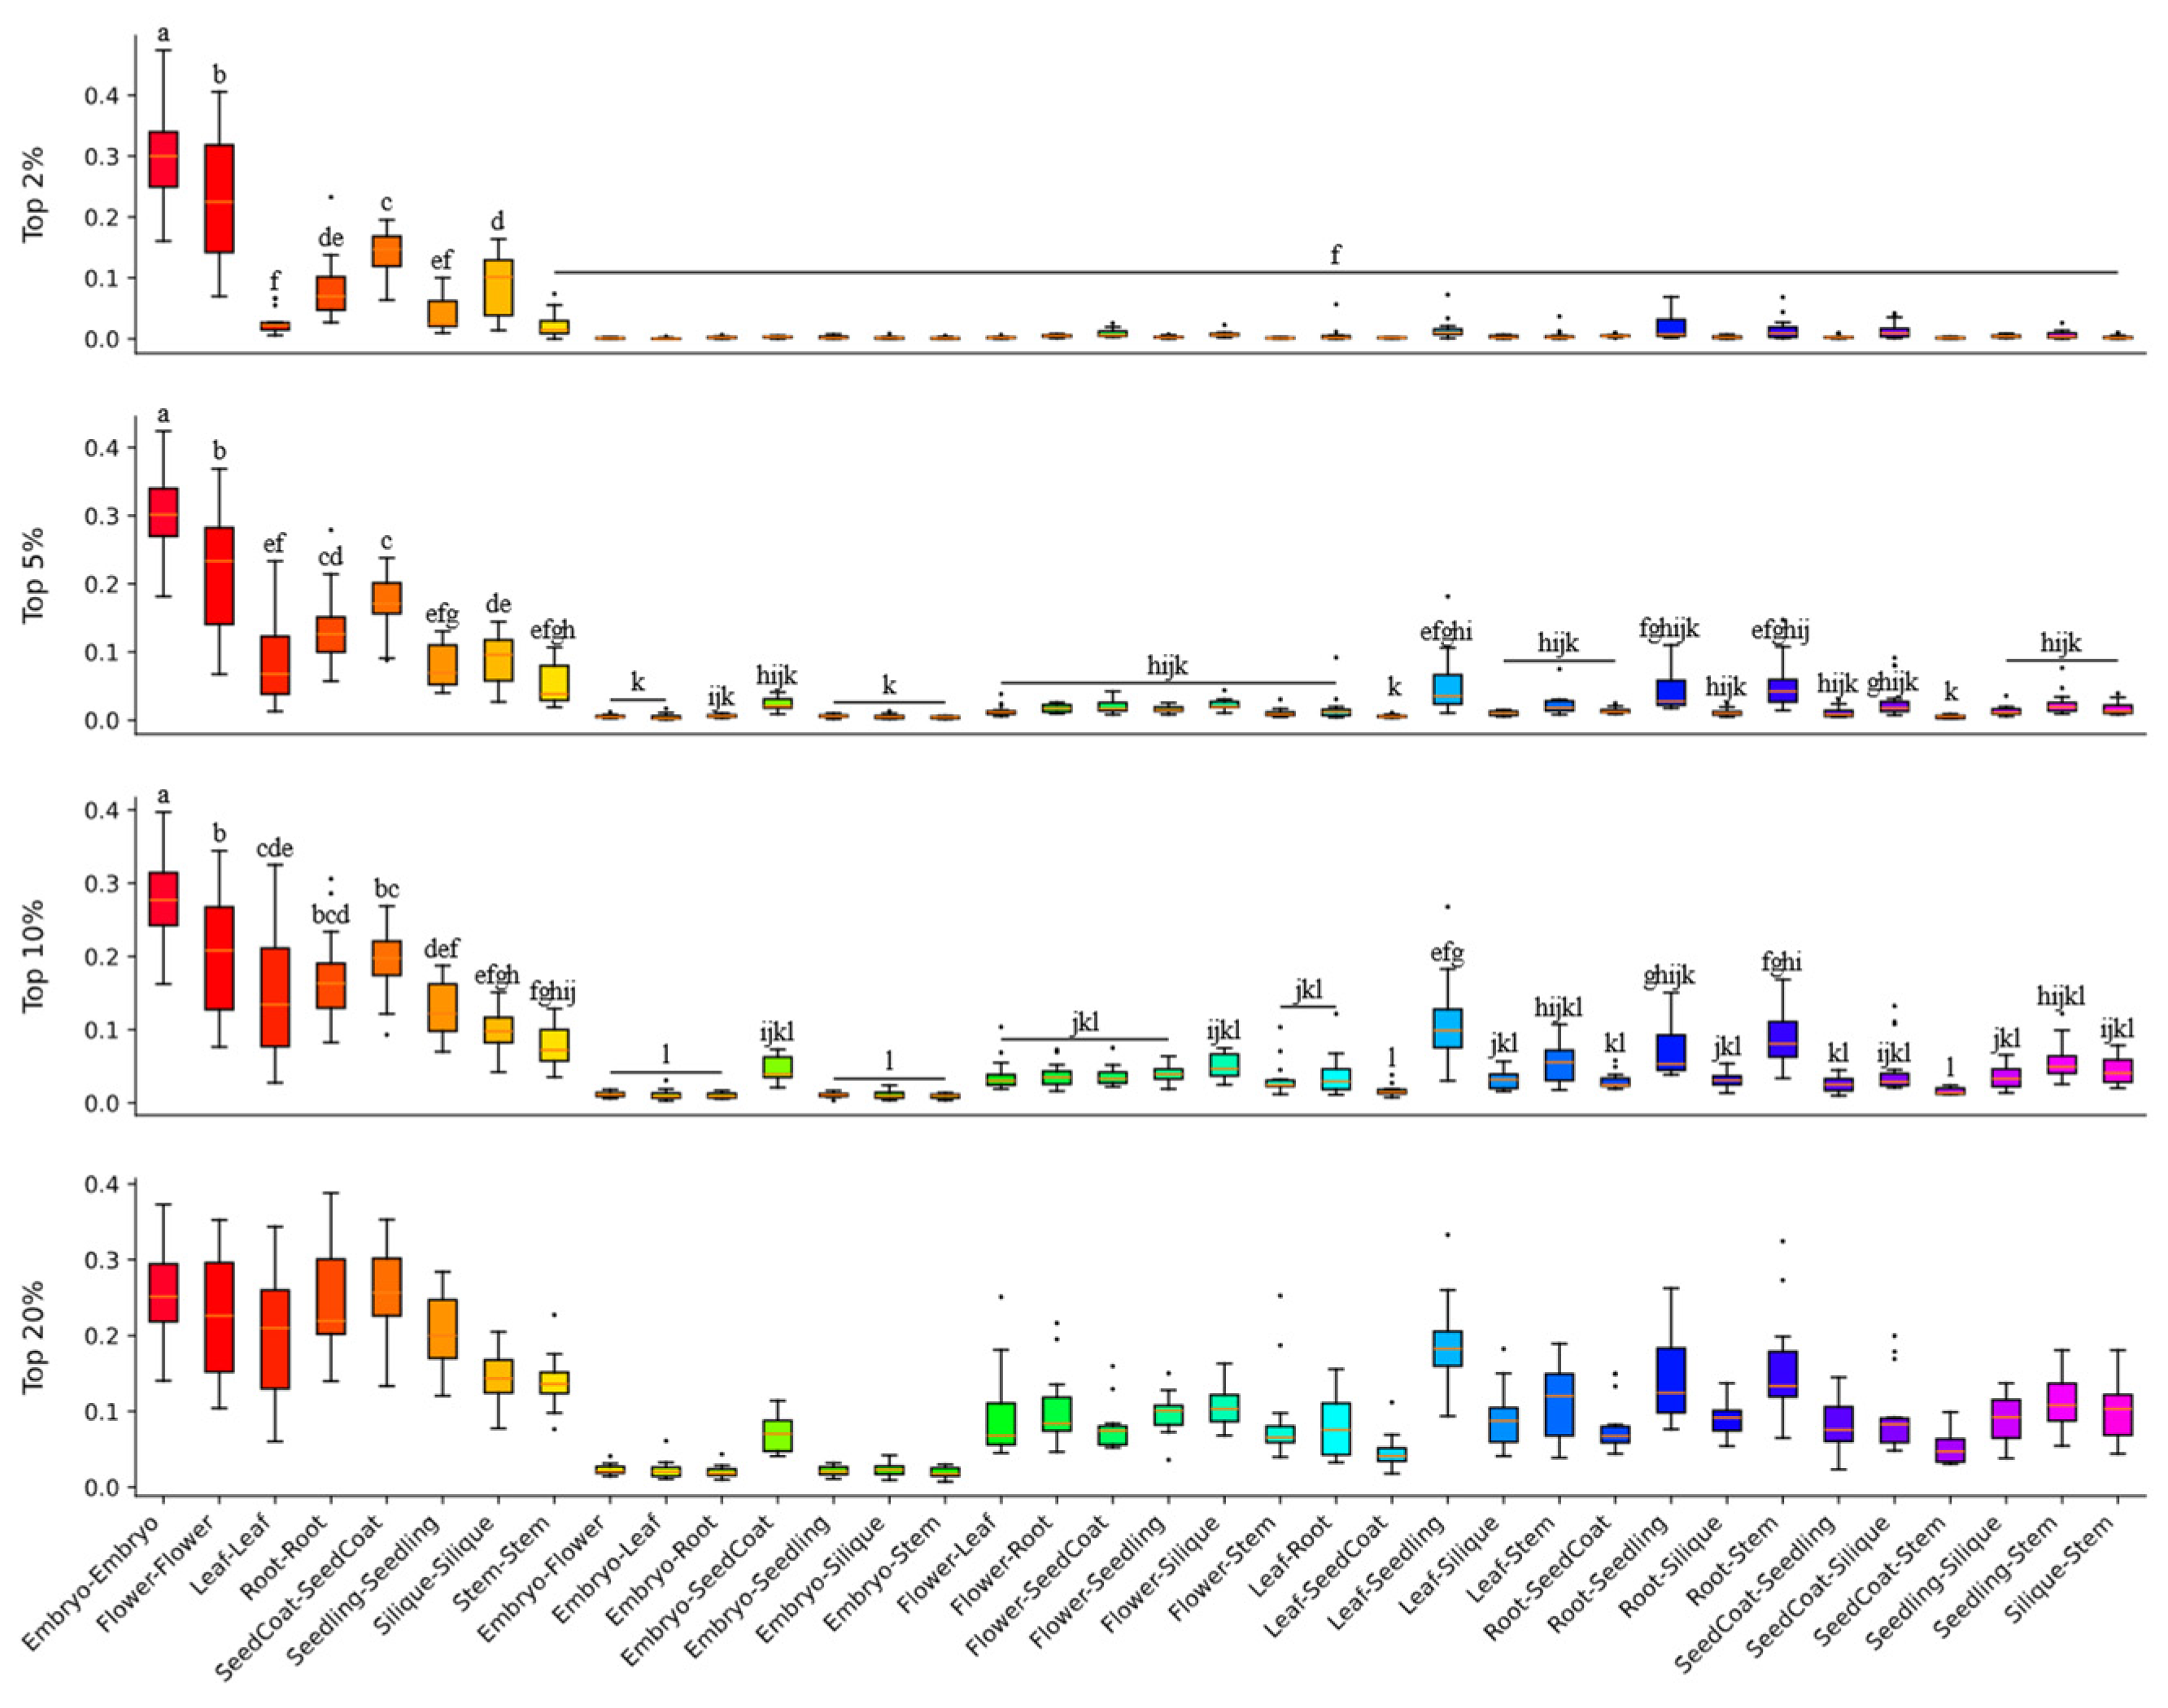
3.3. Prominent GEC in the Reproductive Organs of Brassica

With the JCC values calculated between the SPM gene sets of different genomic organs at different thresholds, we found that reproductive organs were significantly more conserved than vegetative organs.

3.3.1. Significant GEC in Reproductive Organs Across Brassica Genomes

Our analyses demonstrated pronounced GEC patterns among SPM genes across developmental thresholds (Figure 3, Table S6). At the 2% threshold, embryo–embryo, flower–flower, seed coat–seed coat, and silique–silique comparisons exhibited the highest Jaccard similarity coefficients (JCCs), establishing reproductive organs as evolutionary hotspots for SPM gene conservation. Intra-organ GEC significantly surpassed inter-organ conservation (p < 0.05), except in leaf and seedling comparisons. Threshold elevation to 5% maintained maximal JCCs in embryo, flower, and seed coat self-comparisons, with root–root comparisons emerging as secondary conservation nodes (JCCmean = 0.1345). This hierarchy persisted at 10% thresholds.
Notably, when the threshold is relaxed to 20%, the closer the organs are spatially, the higher their JCC values and the more similar their gene expression. This is caused by intercellular RNA transport. The 20% threshold reveals a complex pattern of interactions beyond simple hierarchical relationships, and therefore statistical annotations are omitted from Figure 3.

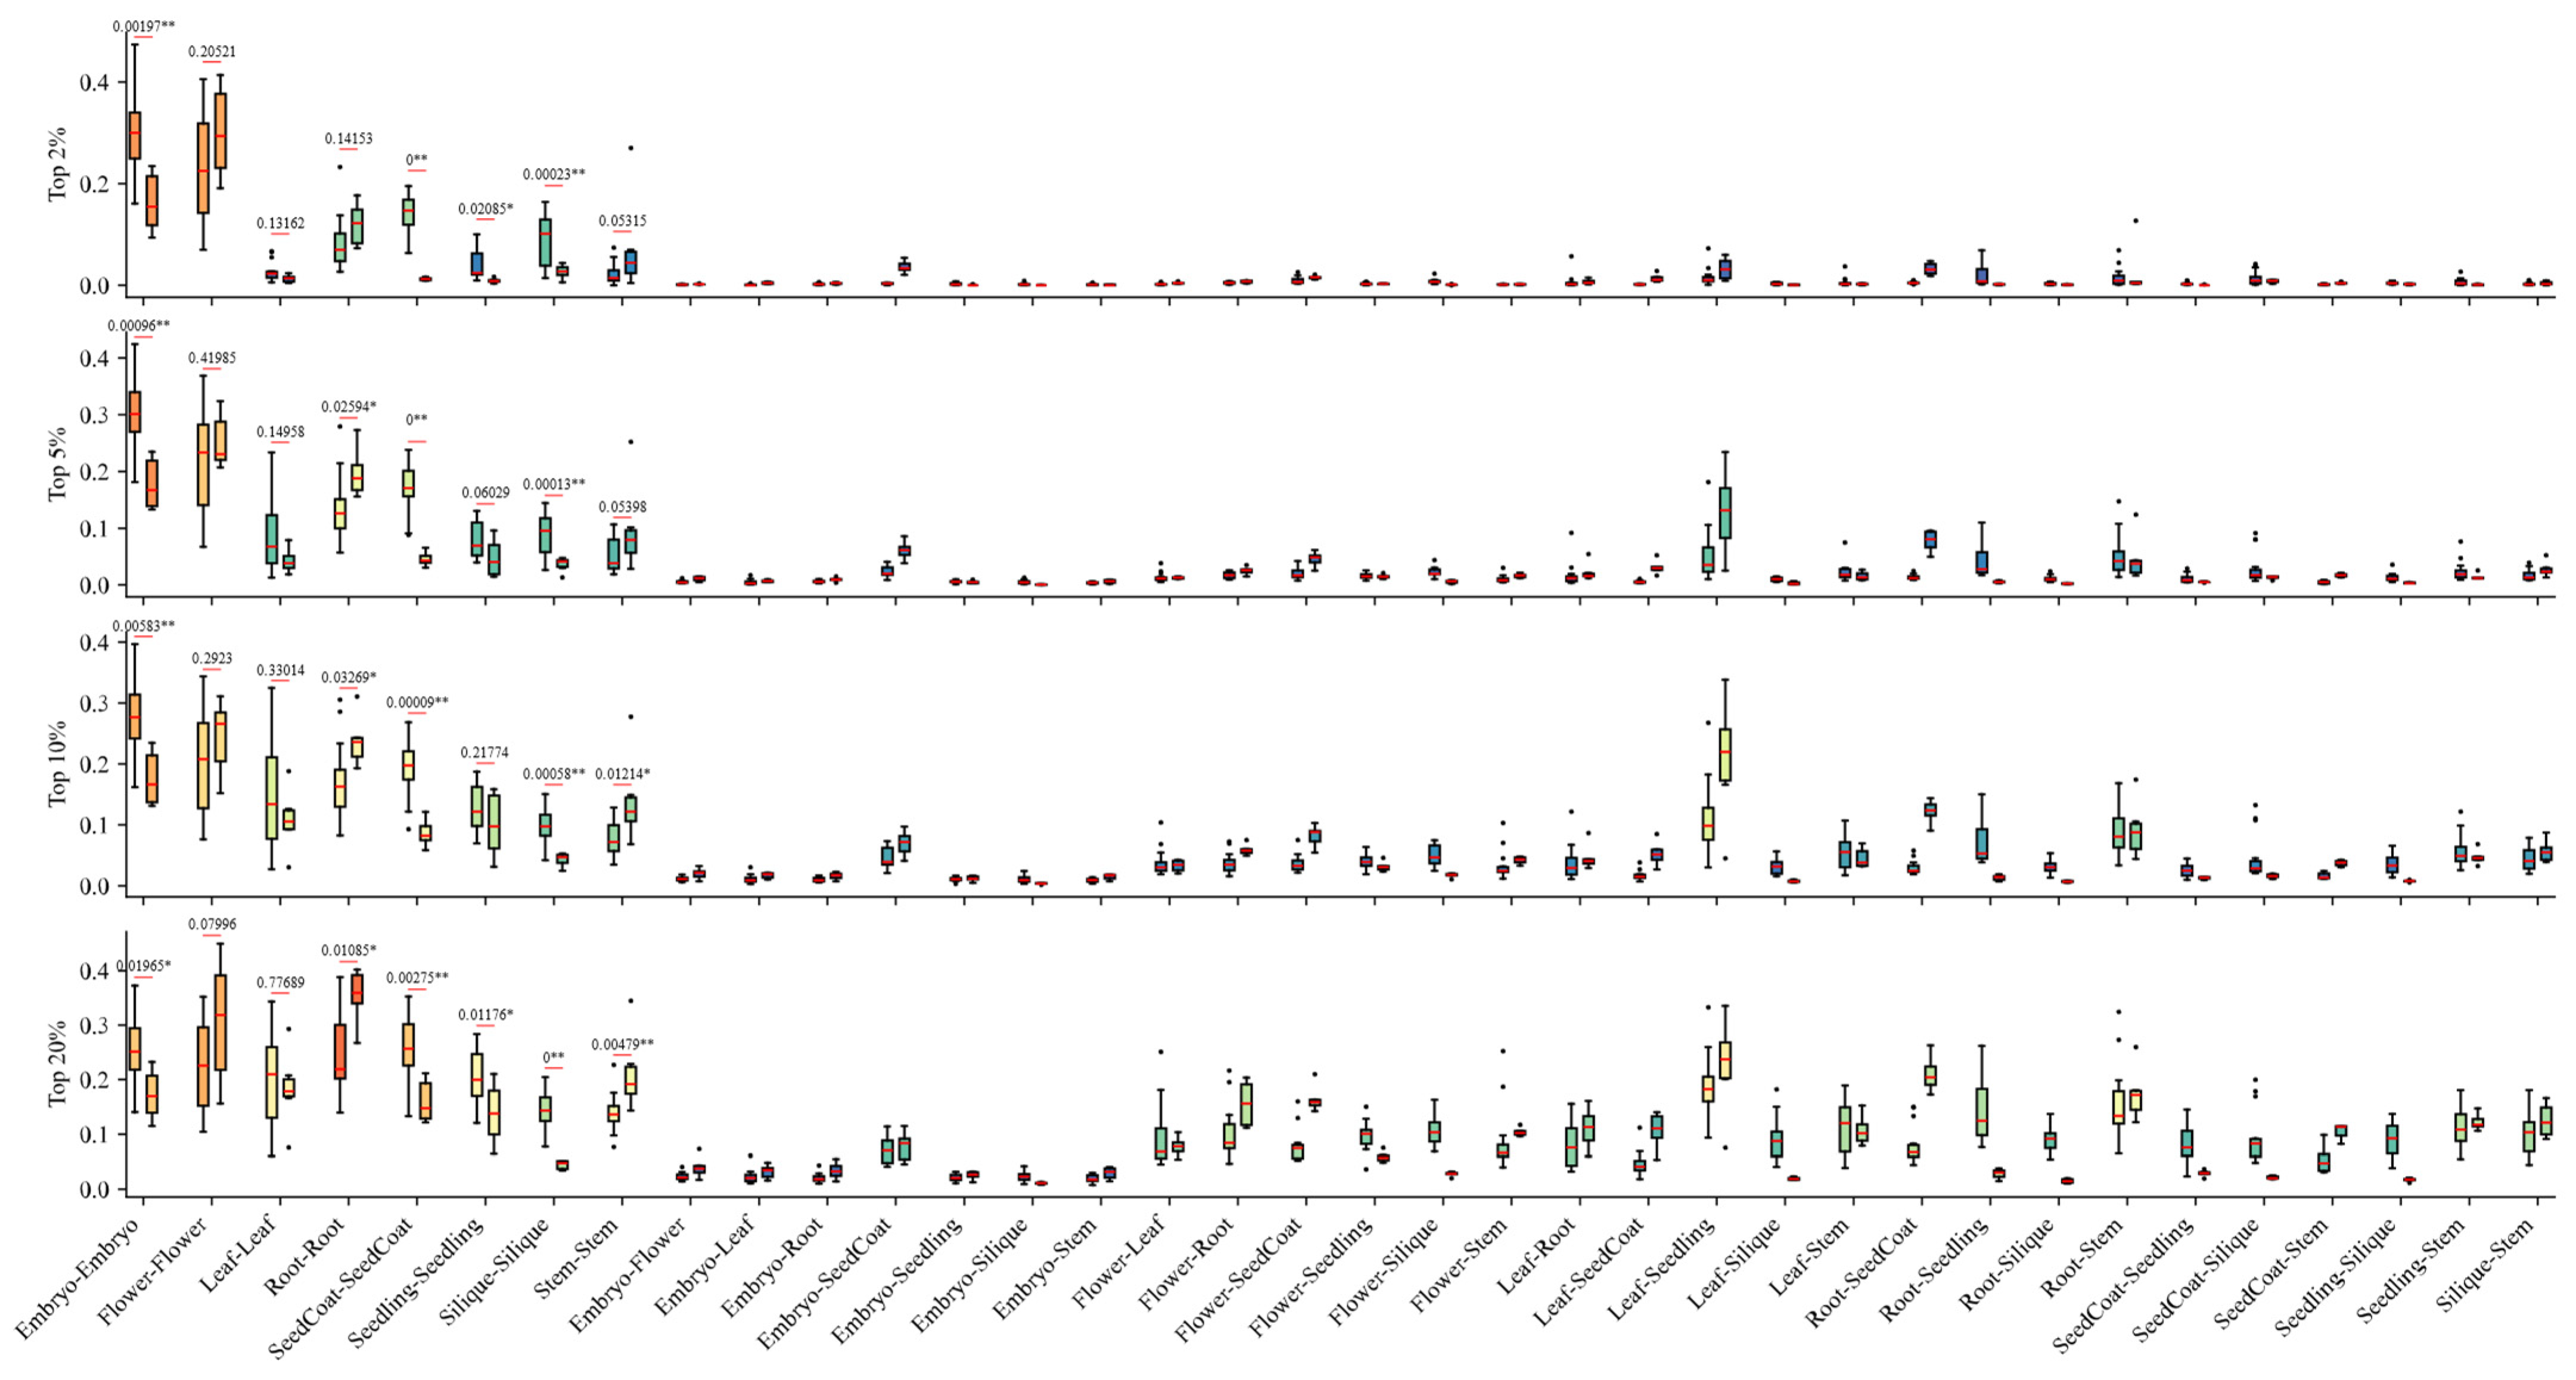
3.3.2. Significant GEC in Reproductive Organs Across Brassica Subgenomes

We calculated JCC values across four comparative frameworks: (1) intra-subgenome pairs (A-A, B-B, C-C), (2) inter-subgenome pairs (A-B, A-C, B-C), (3) intra-tPCK-subgenome pairs (LF-LF, MF1-MF1, MF2-MF2), and (4) inter-tPCK-subgenome pairs (LF-MF1, LF-MF2, MF1-MF2). Detailed results are provided in Tables S7 and S8. Strikingly, A-A subgenome pairs consistently exhibited higher JCC values than B-B and C-C pairs across embryo, seed coat, and root tissues at all thresholds (Figure S3), indicating higher GEC in the A subgenome within these organs. Notably, A-C subgenome pairs showed elevated JCC values relative to A-B and B-C pairs in embryo and silique tissues (Figure S4), suggesting preferential GEC between A and C subgenomes in these organs. Intriguingly, no significant JCC differences emerged among intra-tPCK-subgenome pairs (LF-LF vs. MF1-MF1 vs. MF2-MF2) across all organs (Figure S5), demonstrating stable GEC within individual karyotypic lineages. By contrast, LF-MF2 inter- tPCK-subgenome pairs displayed significantly higher JCC values than LF-MF1 and MF1-MF2 pairs in embryos (Figure S6), highlighting unique regulatory coherence between LF and MF2 karyotypes during embryogenesis.

3.4. Significant GEC in Reproductive Organs Between Brassica and A. thaliana

Additionally, we calculated GEC between Brassica species and A. thaliana organs using our previously established methodology. By performing Student’s t-tests to evaluate the significance of differences between intra-Brassica GEC and Brassica-A. thaliana GEC, we obtained the results presented in Table S6 and Figure 4. The results showed that the GEC of reproductive organs was still relatively high, but the GEC of embryos, seed coat and seed pods differed from those of Brassica. With the exception of the embryo at the 20% threshold, extremely significant differences (p < 0.01) were observed in JCC values for the embryo, seed coat, and silique. In contrast, no significant differences were detected in JCC values for flowers at any threshold. This indicates that gene expression conservation is higher in the Brassica-A. thaliana flower and lower in the embryo, seed coat, and silique.

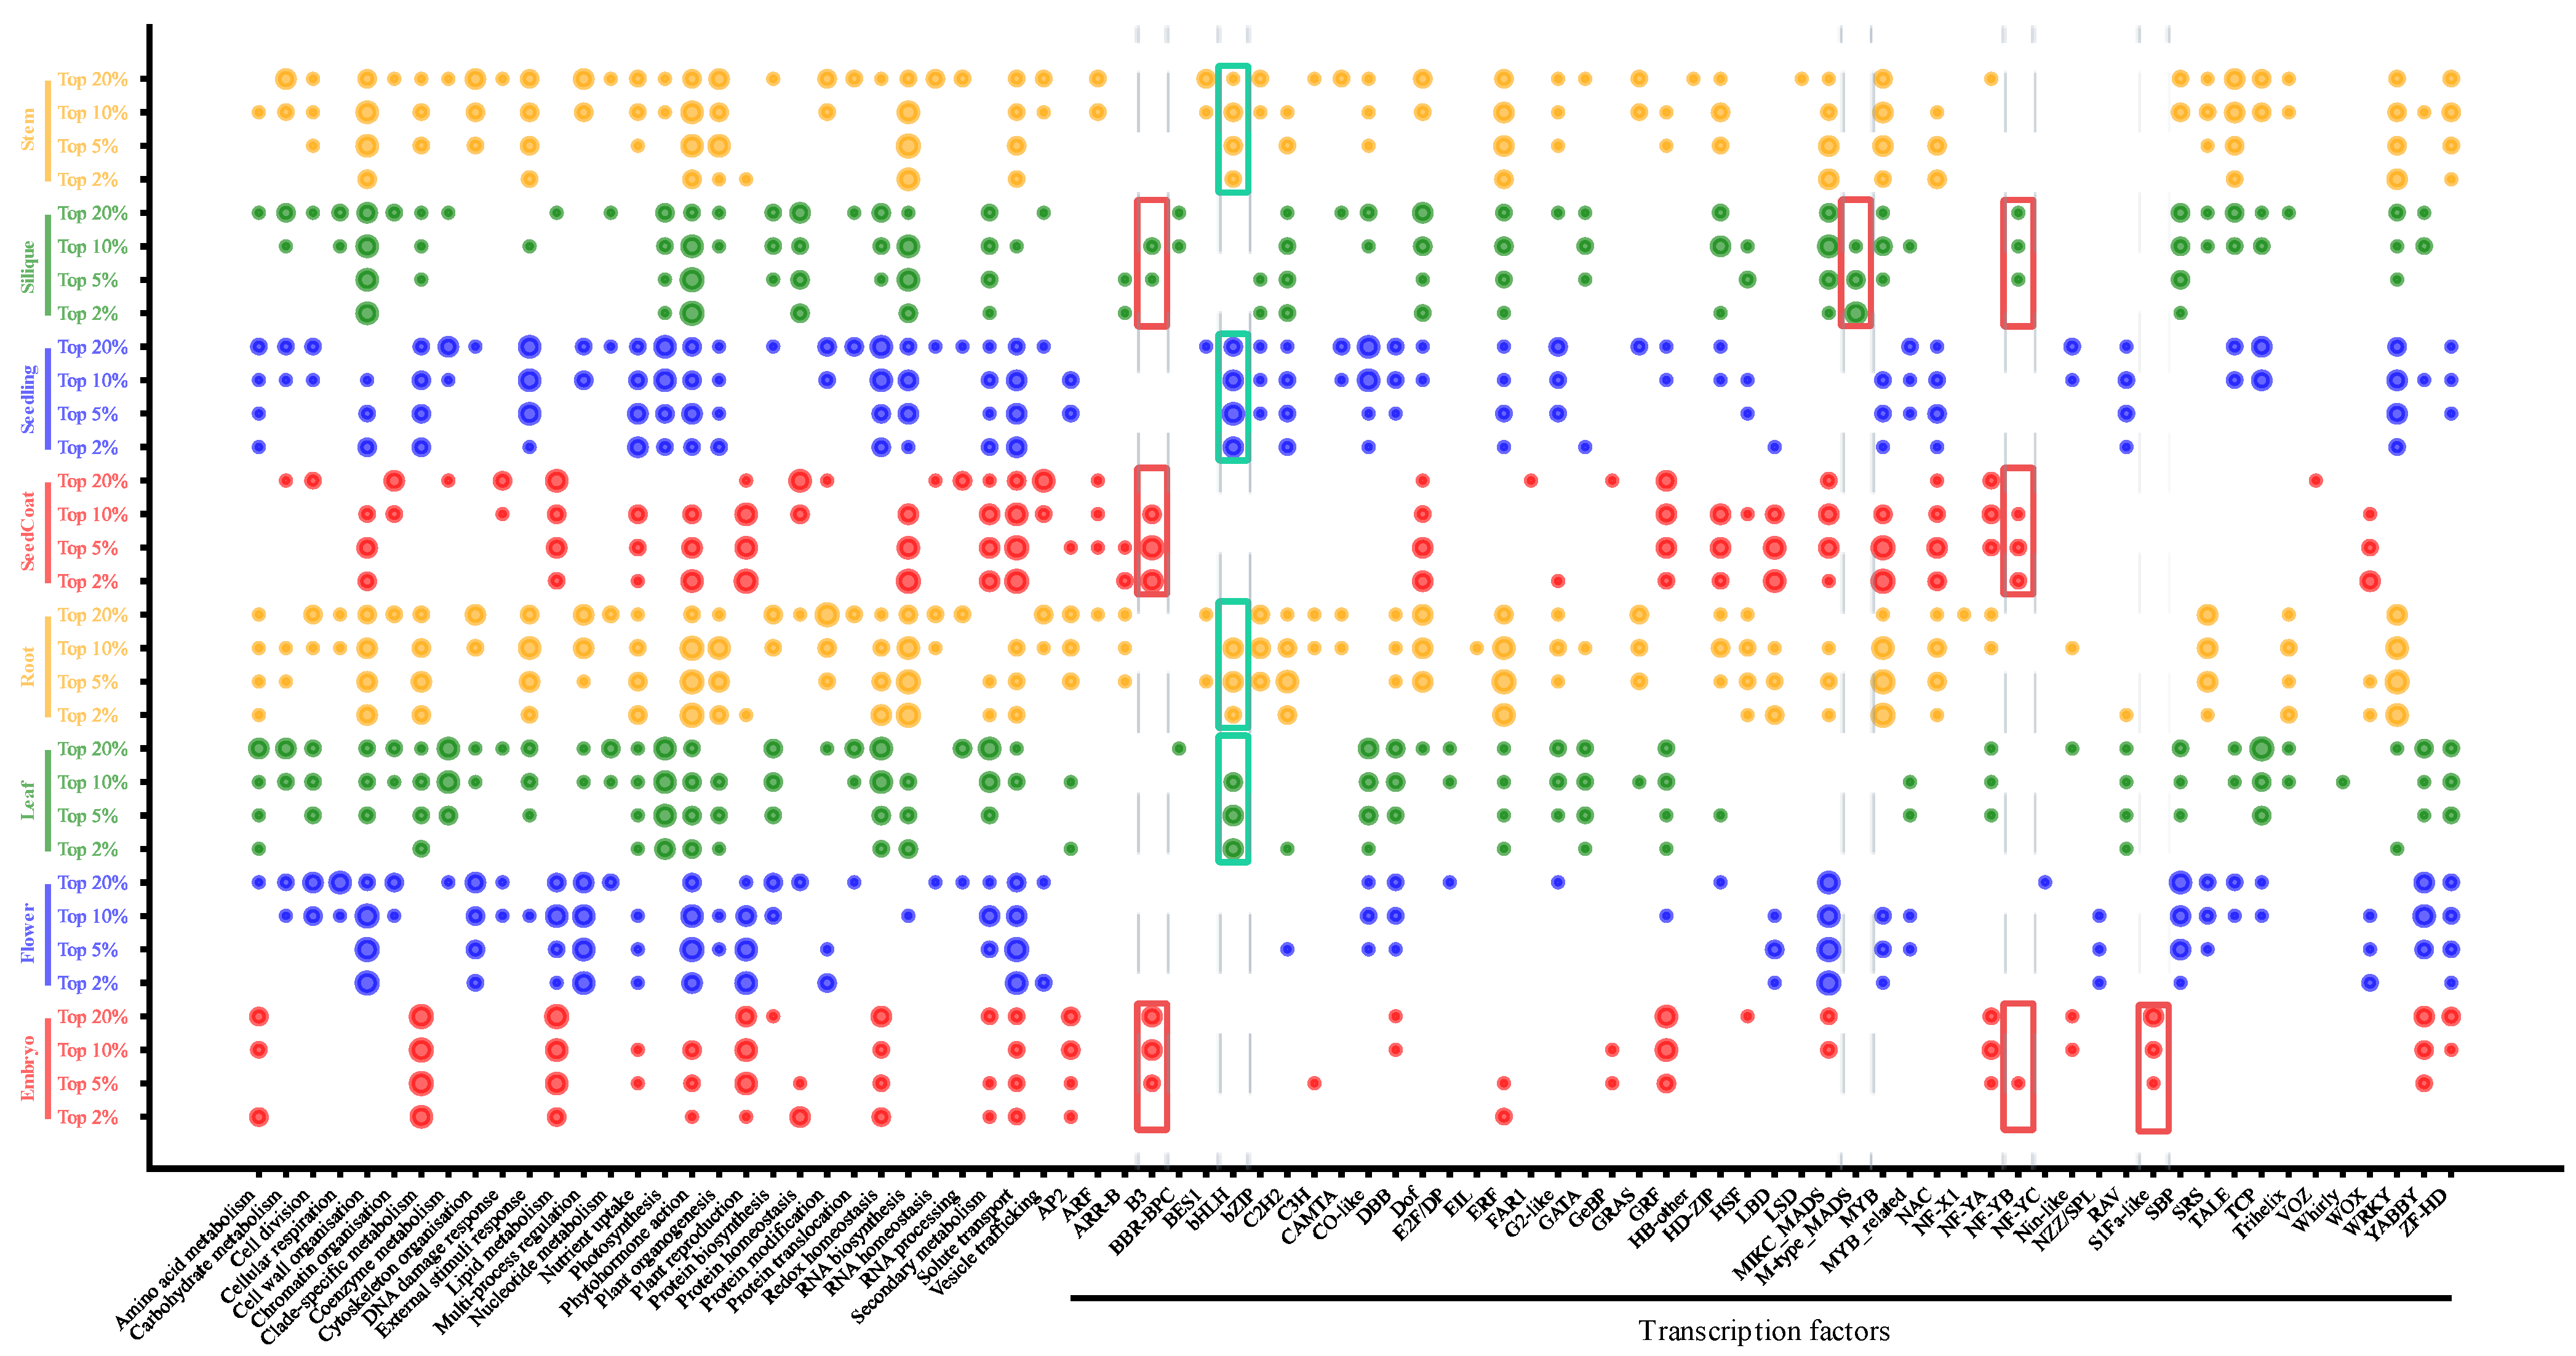
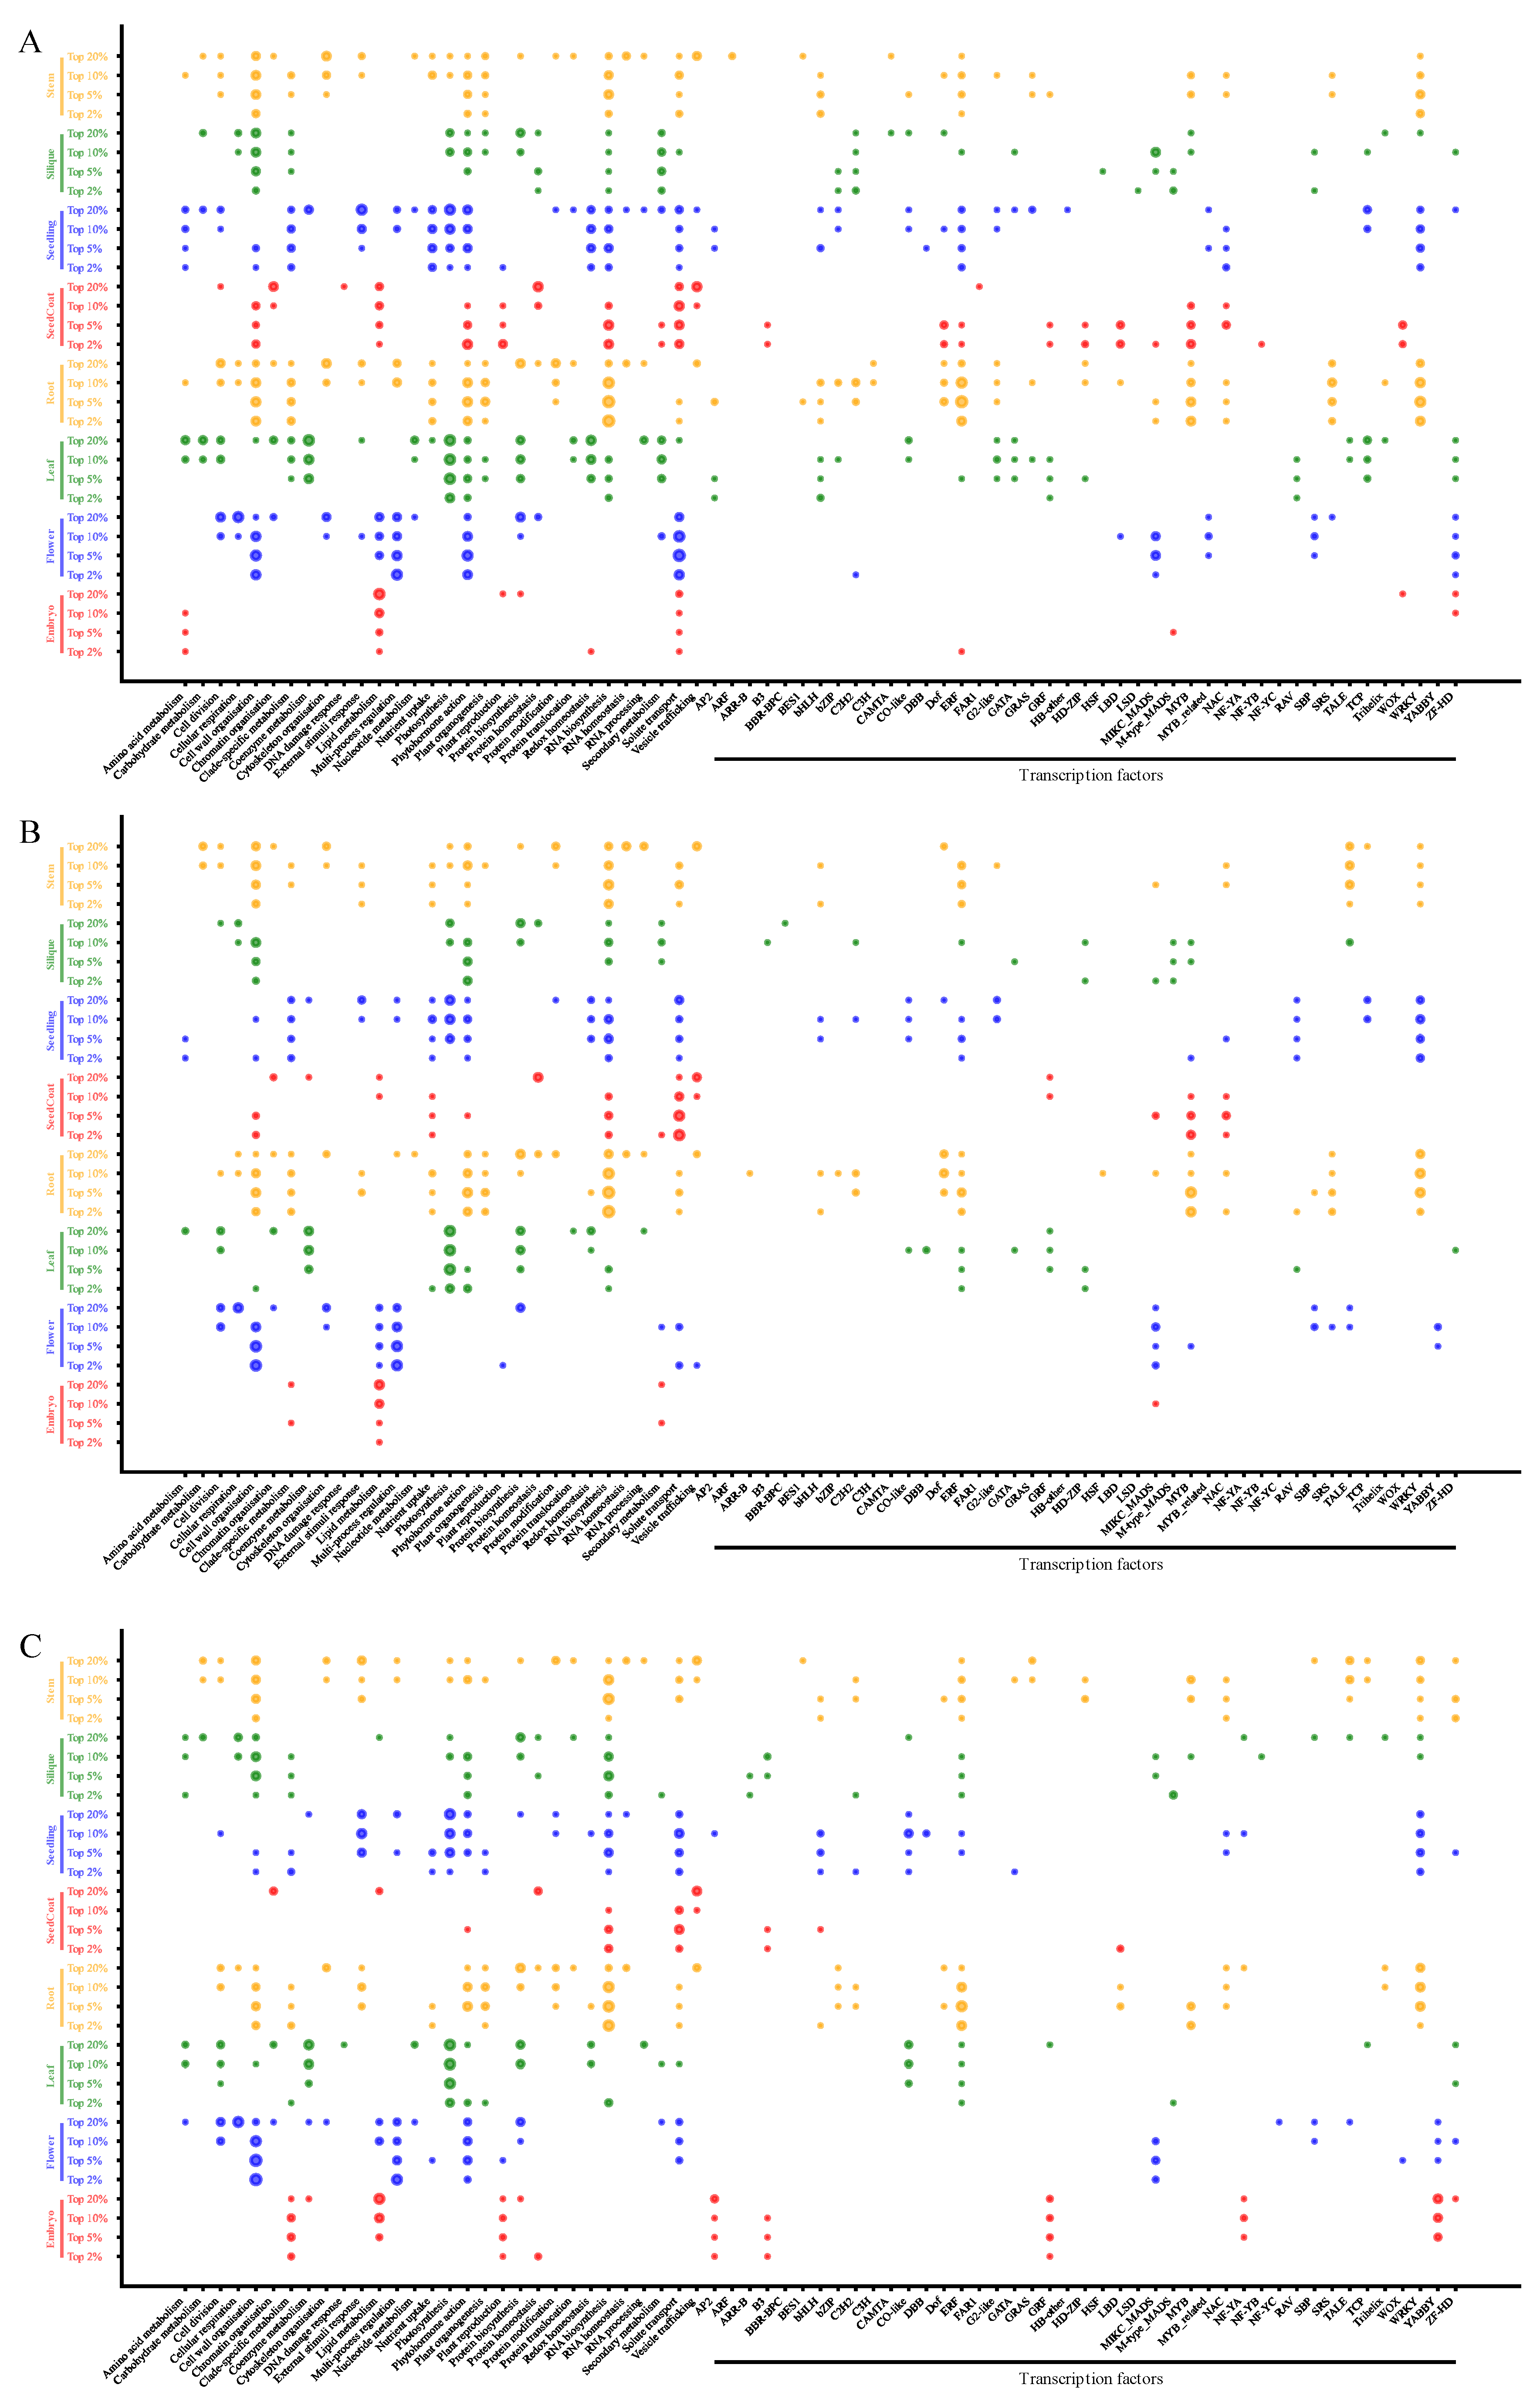
3.5. Enrichment Analysis of Gene Regulatory Pathways and TFs of SPM Genes

The functional enrichment analysis of gene regulatory pathways and TFs across six Brassica species revealed organ-specific biological process prioritization (Figure 5, Table S9). The bHLH TF family showed preferential enrichment in non-reproductive organs, consistent with their established roles in photoresponse regulation and cellular differentiation. Reproductive organ analyses identified three distinct conservation patterns: (1) B3 TFs exhibited embryo–silique–seed coat enrichment, recapitulating their seed dormancy functions [45,46]; (2) M-type_MADS TFs displayed threshold-dependent silique enrichment, with genomic representation scaling linearly with SPM stringency, mechanistically explaining their silique morphogenesis roles [47,48,49]; (3) NF-YB TFs demonstrated tripartite enrichment in embryonic tissues, suggesting expanded seed development functions beyond canonical endosperm regulation [45,50,51]. Notably, S1Fa-like TFs manifested embryonic enrichment (q < 0.01), contrasting with their documented stress response localization in vegetative organs [52,53,54,55], indicating the occurrence of Brassica-specific sub-functionalization events.
Functional annotation and TF enrichment analyses revealed subgenome-partitioned regulatory networks across Brassica organs (Figure 6 and Figure S7). In vegetative organs, bHLH TFs showed exclusive B/C-subgenome enrichment, contrasting with their complete absence on A-subgenomes, suggesting thr subgenome-level regulatory specialization of photomorphogenesis pathways. Reproductive organ analyses uncovered paradoxical spatial regulation: while LF-subgenomes maintained global transcriptional dominance, embryonic MF2-subgenomes specifically accumulated developmental regulators including AP2, B3, GRF (GROWTH-REGULATING FACTOR), NF-YA, and YABBY families, indicating the functional prioritization of developmental competence over dosage-sensitive loci. Seed coat exhibited dual specialization through the LF-subgenome-driven enrichment of reproduction-related pathways and the MYB TF co-enrichment on LF/MF1 subgenomes. Notably, the MF2-subgenome’s embryonic TF enrichment persisted despite its secondary dosage status, revealing layered regulatory hierarchies in embryogenesis where subgenome dominance and functional specialization operate through distinct molecular logic.

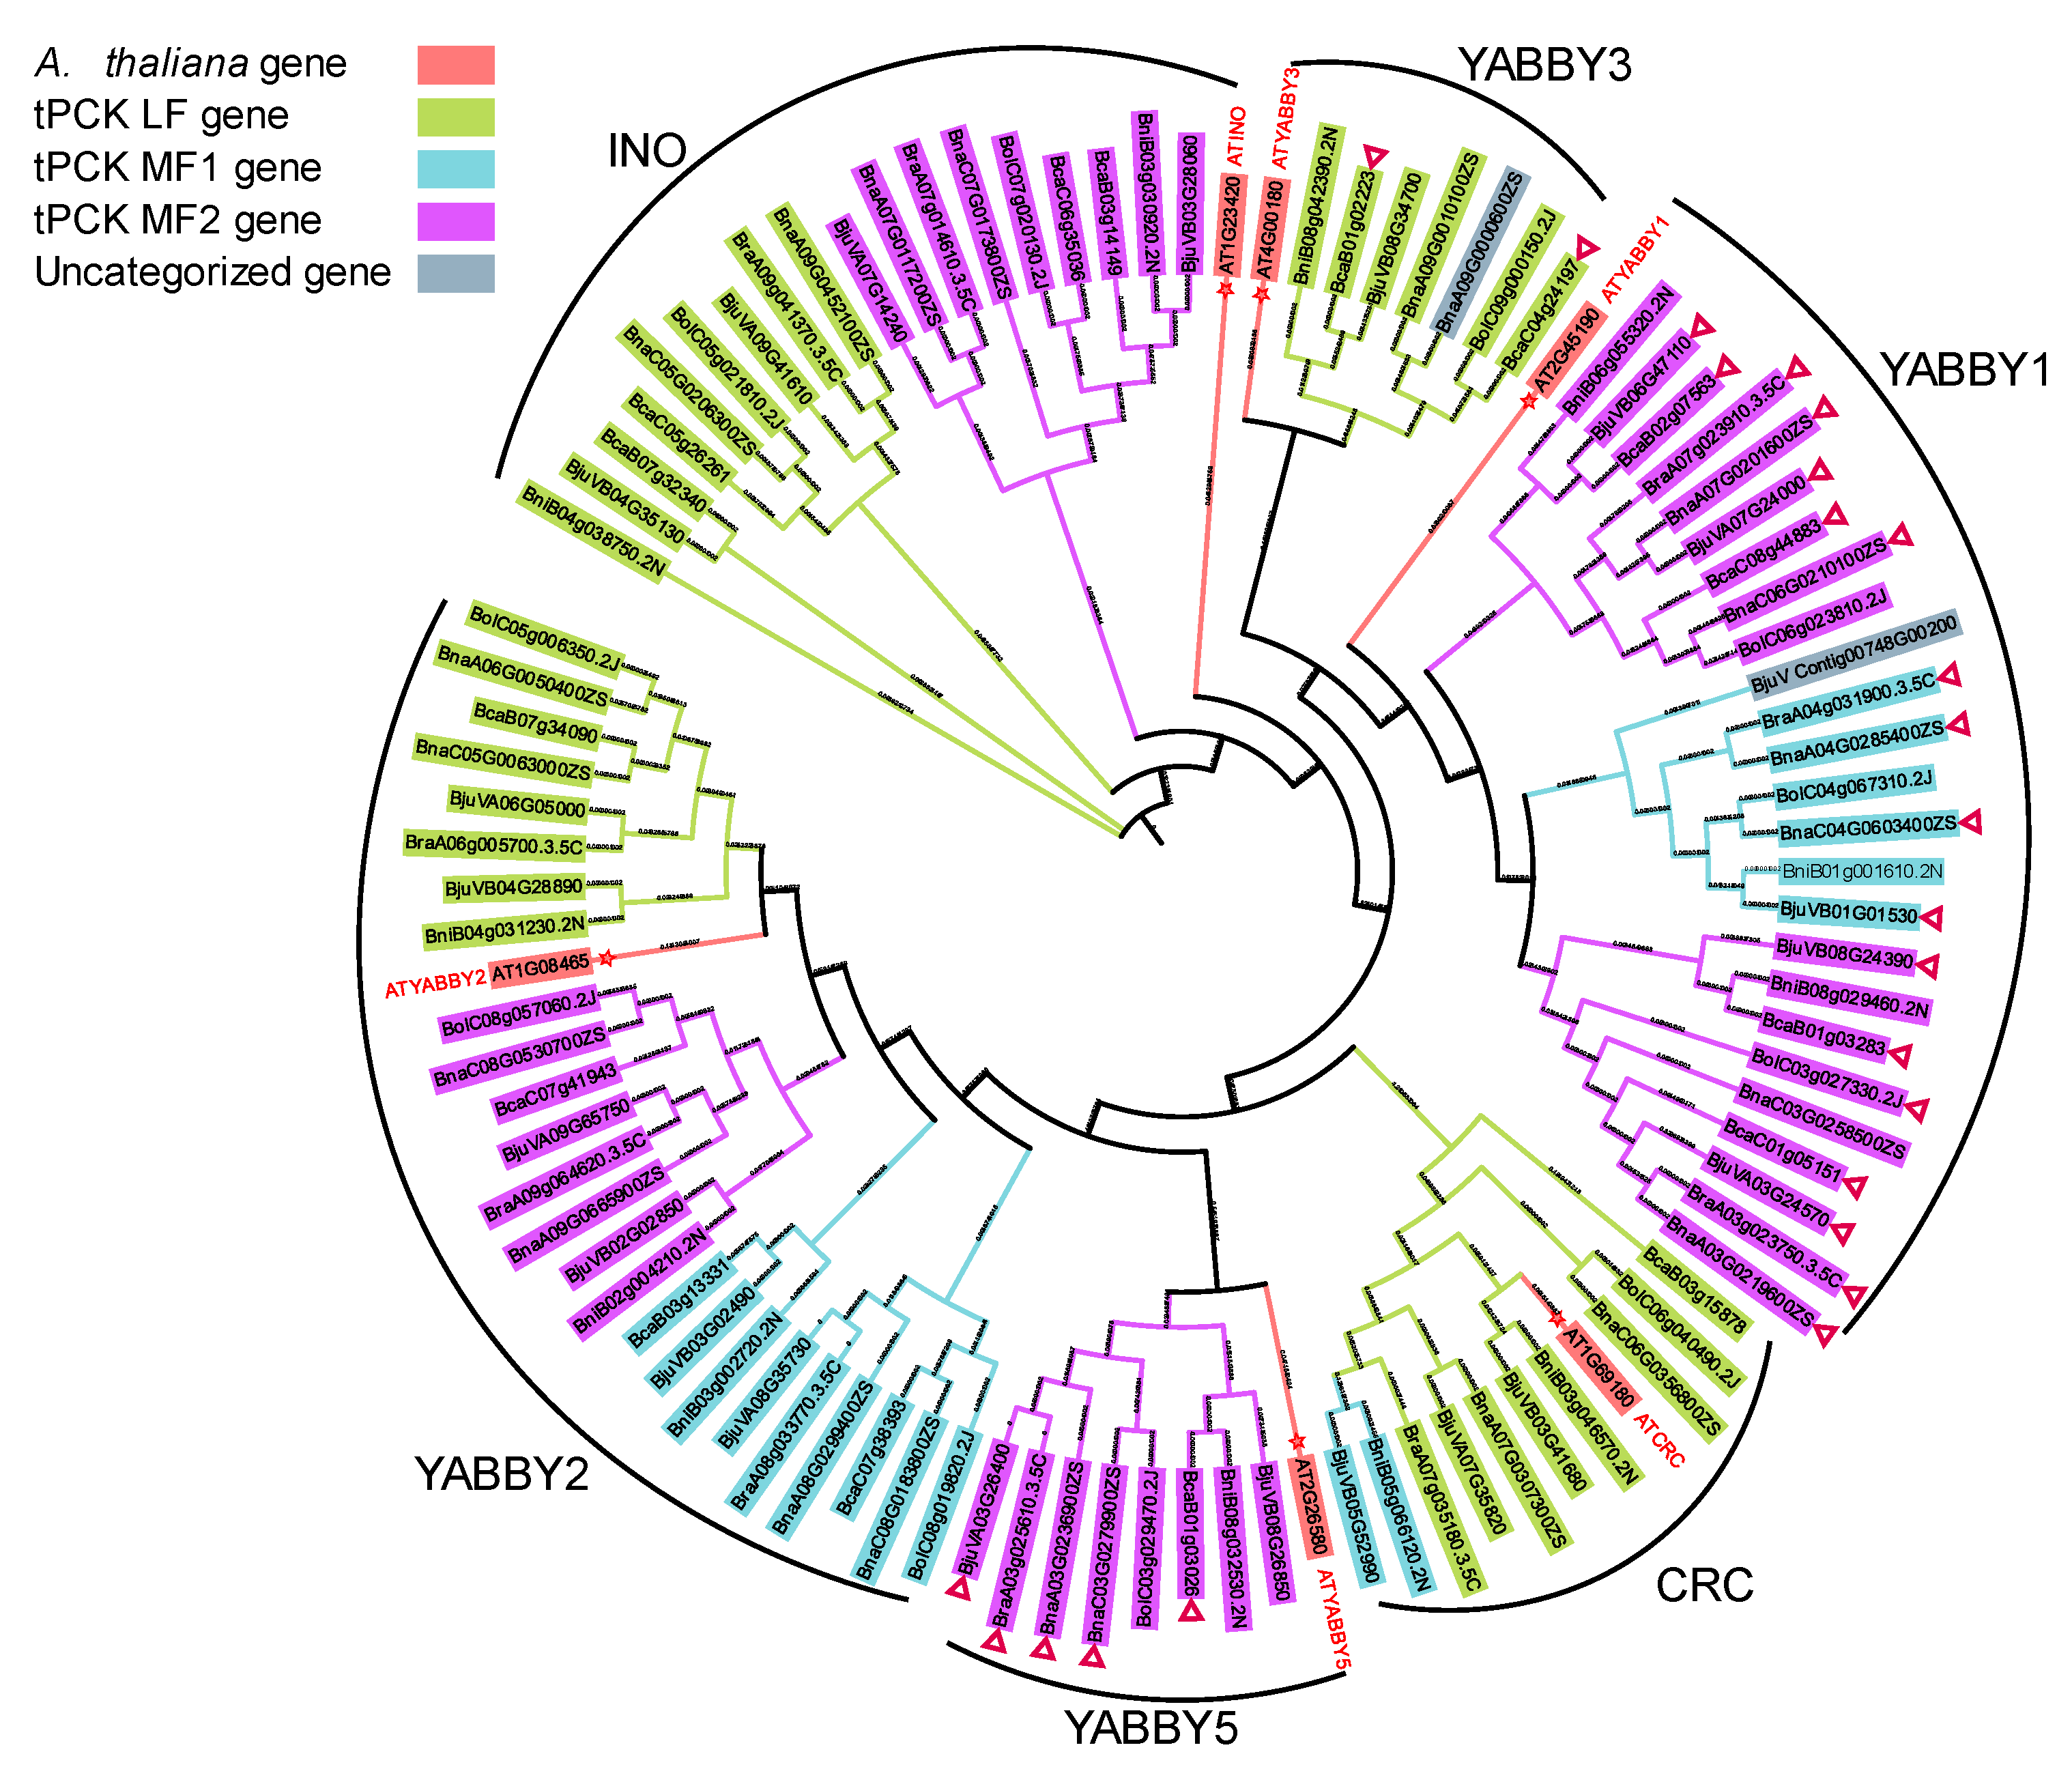
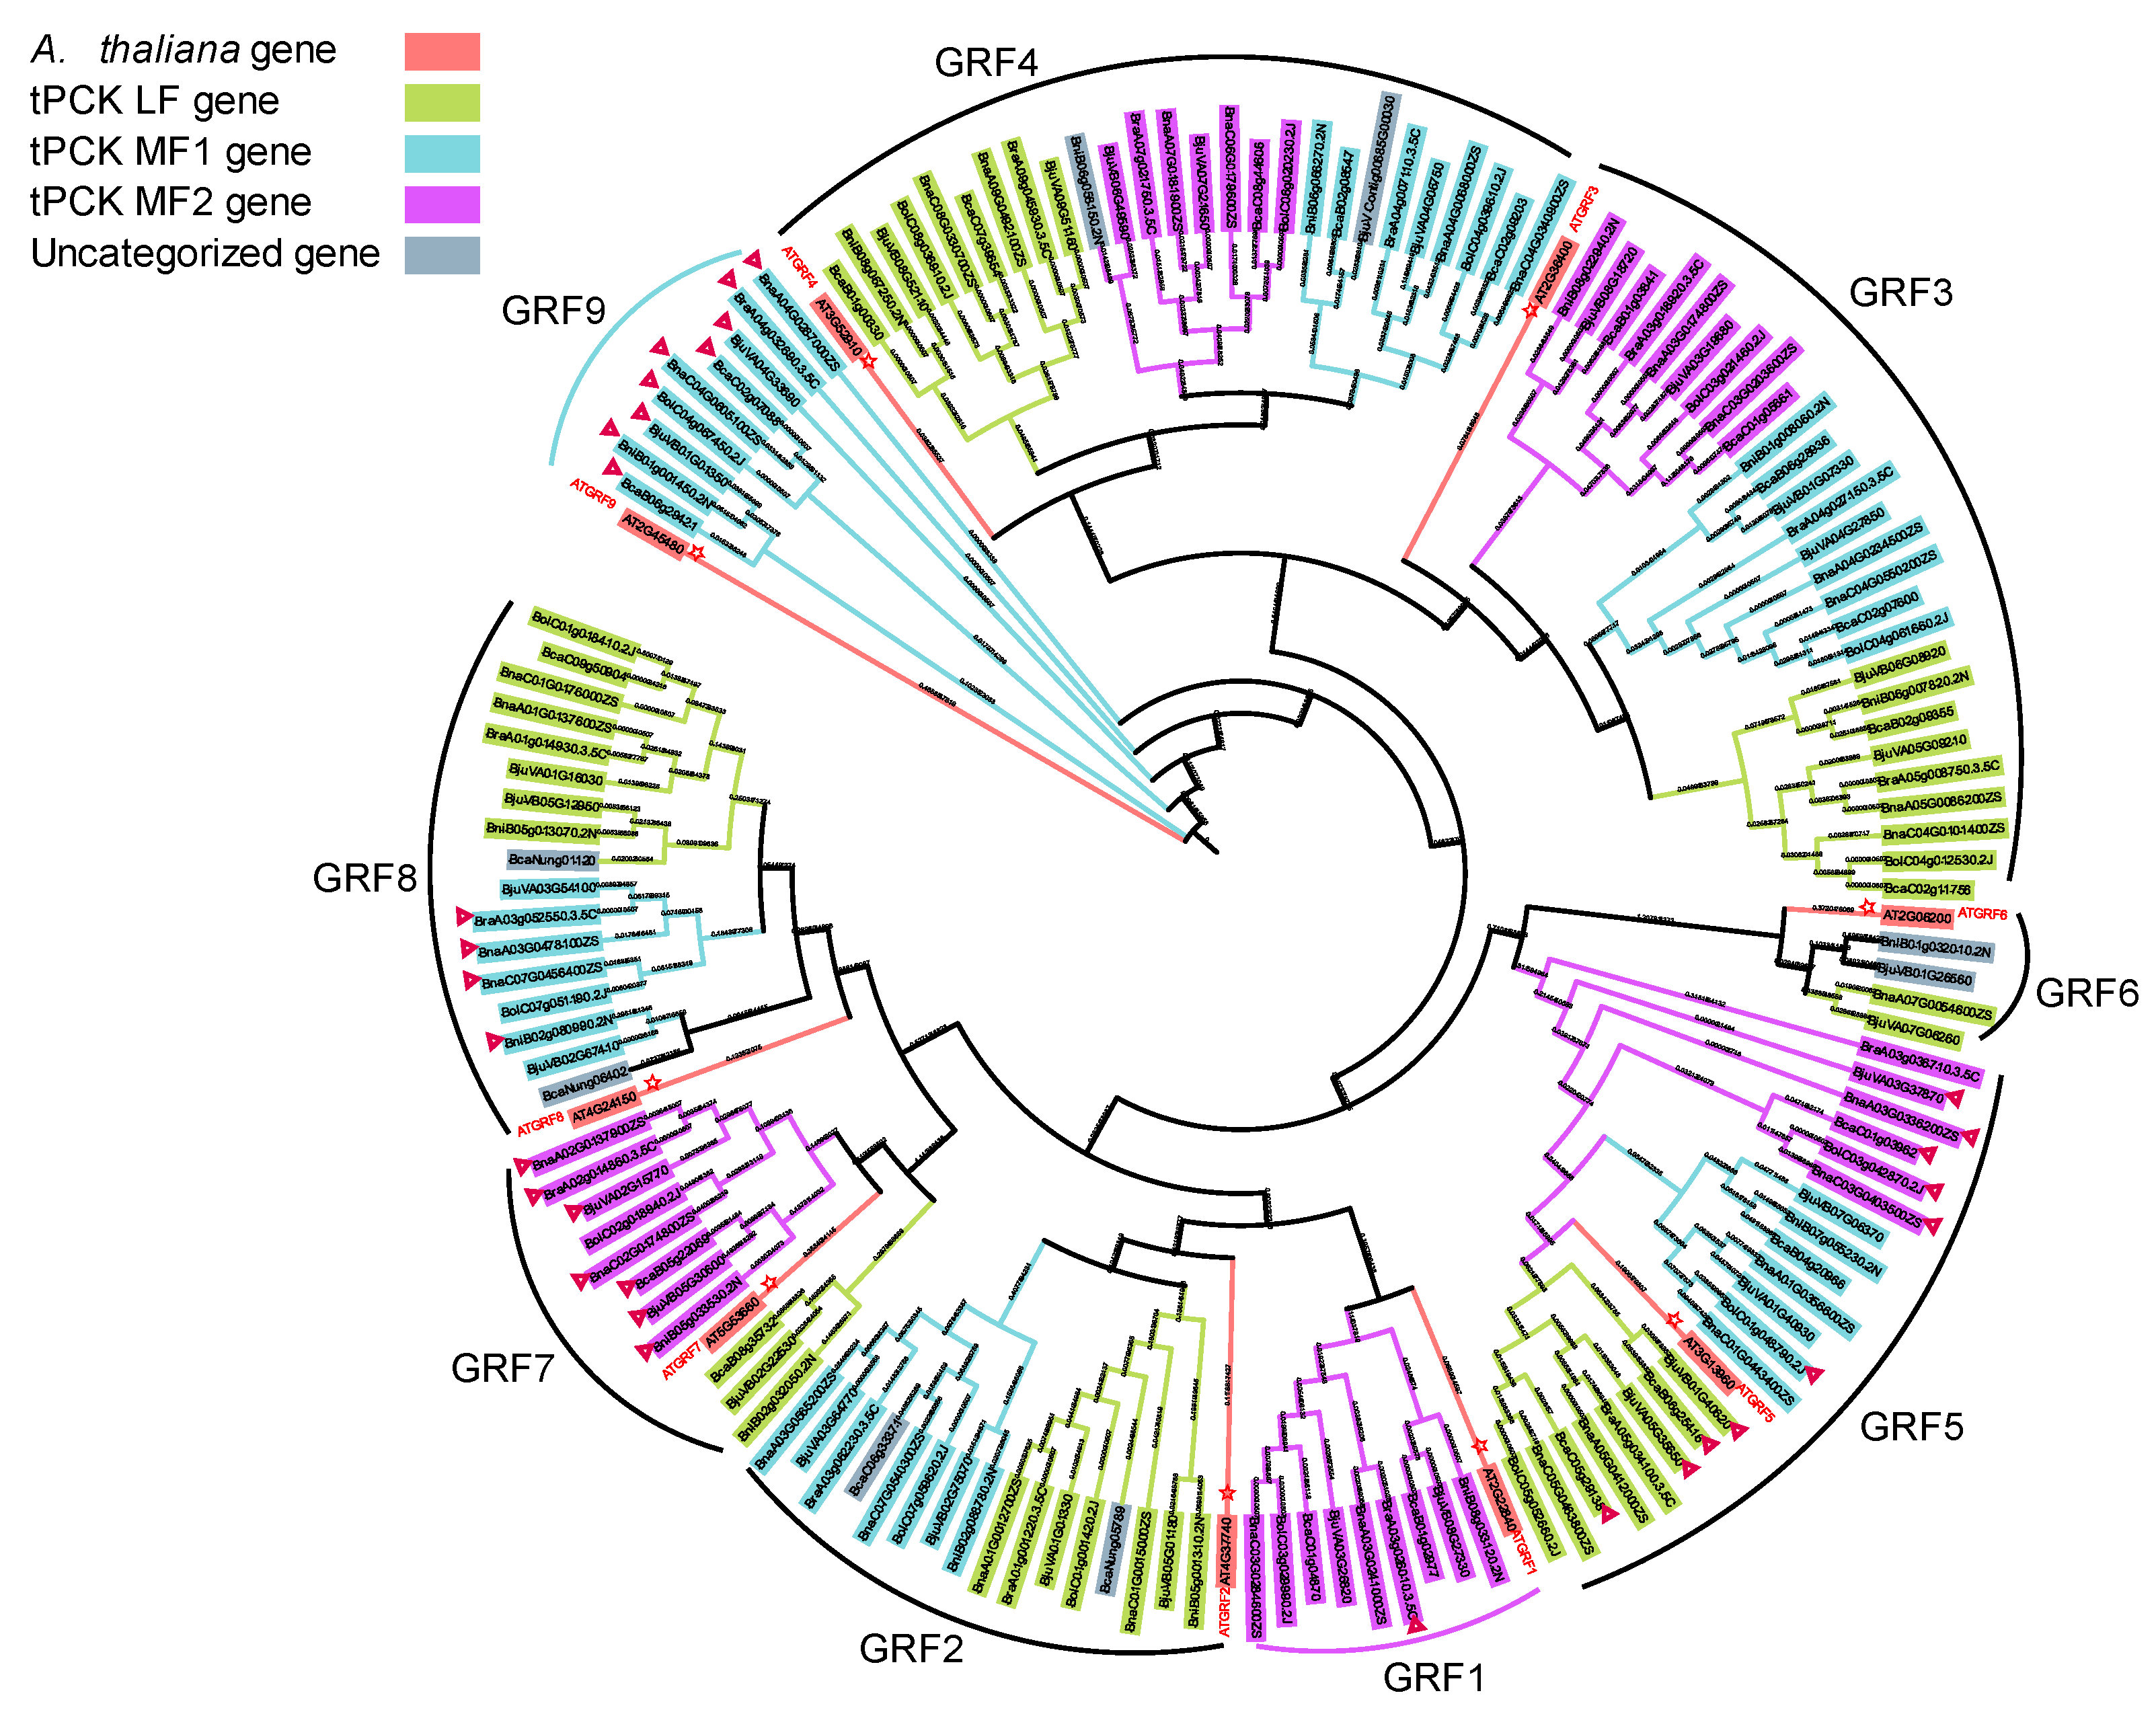
3.6. Phylogenetic Analysis of the YABBY and GRF TF Families in Brassica

YABBY TFs govern polarity establishment and dorsoventral differentiation [56,57,58], while GRF TFs regulate embryonic cell proliferation and organ growth [59,60,61,62], synergistically driving Brassica embryo morphogenesis and critically influencing seed development and crop yield potential. We screened the results obtained from PlantTFDB [38] annotation and obtained 93 YABBY and 140 GRF family TFs.

3.6.1. YABBY1 and YABBY5 Dominantly Expressed in Embryo

The A. thaliana YABBY TFs retrieved from TAIR [63]. Brassica YABBY TFs were subjected to evolutionary analysis, and we grouped the YABBY TFs into six clusters, which were YABBY1,2,3,5, Crabs Claw (CRC) and Inner No Outer (INO) (Figure 7). Labeling these YABBY TFs according to tPCK subgenome distribution, YABBY1 was located in MF1 and MF2, YABBY2 was located in LF, MF1, and MF2, YABBY3 and CRC were mainly located in LF, YABBY5 was only located in MF2, and INO was located in LF and MF2. We located the SPM genes in the embryo and labeled them. This work is presented in Figure 7. We found that the dominantly expressed in YABBY genes in the embryo were YABBY1 and YABBY5 (Table S10).

3.6.2. GRF5, 7, 8 and 9 Dominantly Expressed in Embryo

The evolutionary analysis of A. thaliana GRF TFs retrieved from the TAIR [63] and Brassica GRF TFs classified the GRF TFs into nine clusters, namely, GRF1-9 (Figure 8). Identify these GRF TFs based on the tPCK subgenome list, GRF1 was only located in MF2, GRF2 and GRF8 were located in both LF and MF1, GRF3, 4, and 5 were found in LF, MF1, and MF2, GRF6 was only located in LF, GRF7 was located in both LF and MF2, and GRF9 was only found in MF1. Locating the SPM genes in the embryo and labeling them into Figure 8, we found that the predominantly expressed genes in the embryo were GRF5, 7, 8 and 9 (Table S10).

4. Discussion

In order to study the evolution of Brassica organs, we established a gene expression atlas for the six Brassica major crops in the U’s Triangle. The main strength of our analysis was that the conclusions were drawn from a comparative analysis of the six Brassica major crops, which covered a representative collection of Brassica plants.
Then, we established a method for the identification of organ-specific genes, which are called SPM genes. By calculating the SPM gene proportions of each organ at different thresholds, we found that the proportions of flower, seed coat, and root (21.82%, 22.55% and 17.8% at the 2% threshold) were bigger than the proportions of other organs. The more stringent the threshold, the larger the SPM proportions of flowers and seed coat. Conversely, the SPM gene proportions in roots were stable, suggesting that these non-photosynthetic organs have highly unique and specialized characteristics.
At both genome and subgenome levels in Brassica, we calculated the gene expression conservation of SPM genes across organs, revealing significantly higher conservation in reproductive organs compared to non-reproductive organs. Comparative analysis of SPM gene expression conservation between Brassica and A. thaliana further demonstrated that the flower and embryo exhibited markedly higher conservation than other organs. We hypothesize that the seed coat and silique derived from the ovule and ovary wall, respectively, and implicated in reproductive isolation display substantial divergence in expression conservation due to their distinct developmental and functional roles.
To investigate the formation mechanisms of each organ, we annotated the individual genomes, including protein function mapping (mercator) and transcription factor mapping (plantTFDB). Subsequently, we enriched functions in each organ at the genome, ABC subgenome, and tPCK karyotype subgenome levels. We found that at the genomic level, reproductive organs were specifically enriched for transcription factors such as B3, M-type_MADS, NF-YB, and S1Fa-like transcription factors, and it was these transcription factors that drove the functional specialization of these reproductive organs. At the ABC subgenome level, bHLH is only enriched in the B and C subgenomes, and the AP2 transcription factor is only enriched in the embryo of the A subgenome. At the tPCK karyotype subgenome level, SRS transcription factors were only enriched in LF and MF1, and AP2, B3, GRF, NF-YA, and YABBY transcription factors were only enriched in MF2. This indicates that different subgenomes have different specialized functions in Brassica crops, and together they work to promote the function and development of plant organs.
Our analysis focused on cross-species proportional comparisons (e.g., SPM gene ratios) rather than absolute expression levels, inherently mitigating environmental influences. Since proportional metrics normalize condition-dependent variability (e.g., transcriptome depth or growth-stage shifts) and conserved organ-specific genes (e.g., embryogenesis regulators) exhibit lower environmental plasticity, the observed interspecies GEC hierarchy (reproductive > vegetative organs) primarily reflects evolutionary divergence rather than experimental noise. This aligns with pan-Brassica studies, which demonstrate stable organ-enriched gene proportions across ecotypes, supporting the robustness of our conclusions.
The comparative transcriptome of Brassica reveals the phenomenon of a high degree of conservation of gene expression in the reproductive organs of Brassica. The special significance of this phenomenon is mainly reflected in safeguarding the reproductive stability of the species, maintaining the conservation of germplasm perpetuation characteristics and key regulatory mechanisms, as well as laying the foundation for realizing distant hybridization within the genus (AAxBB → AABB, AAxCC → AACC and BBxCC → BBCC) and expanding germplasm resources. Meanwhile, we also identified differential expression at the subgenome level, with the following benefits. First, the diversity of gene expression increases; second, the complexity of regulatory networks increases, which enhances the ability to adapt to environmental changes and evolution; third, functional redundancy and duplication increases, which improves plant resistance and stability and accelerates gene evolution; and finally, the complexity of epigenetic regulation increases, which enhances plant tolerance [64,65,66,67,68,69].

Supplementary Materials

The following supporting information can be downloaded at: https://www.mdpi.com/article/10.3390/horticulturae11040427/s1, Figure S1: Distribution of SPM genes in different organs of different ABC subgenomes; Figure S2: Distribution of SPM genes in different organs of different tPCK karyotype subgenomes; Figure S3: JCC values distribution among same and different organs of ABC subgenomic SPM genes at different thresholds. A set of three data, the one on the left represents a comparison of subgenomes A-A, the one in the center represents a comparison of subgenomes B-B, and the one on the right represents a comparison of subgenomes C-C; Figure S4: JCC values distribution among same and different organs of ABC subgenomic SPM genes at different thresholds. A set of three data, the one on the left represents a comparison of subgenomes A-B, the one in the center represents a comparison of subgenomes A-C, and the one on the right represents a comparison of subgenomes B-C; Figure S5: JCC values distribution among same and different organs of tPCK karyotype subgenomic SPM genes at different thresholds. A set of three data, the one on the left represents a comparison of subgenomes LF-LF, the one in the center represents a comparison of subgenomes MF1-MF1, and the one on the right represents a comparison of subgenomes MF2-MF2; Figure S6: JCC values distribution among same and different organs of tPCK karyotype subgenomic SPM genes at different thresholds. A set of three data, the one on the left represents a comparison of subgenomes LF-MF1, the one in the center represents a comparison of subgenomes LF-MF2, and the one on the right represents a comparison of subgenomes MF1-MF2; Figure S7: ABC subgenome gene function and transcription factor enrichment at different thresholds. The three subplots A, B, C correspond to the enrichment of the A, B, and C subgenomes, respectively; Table S1: SRA number of the RNA-seq data; Table S2: Multi-organ gene expression atlas data of 6 Brassica species and A. thaliana; Table S3: Number and proportion of genes with TPM ≥ 2 per organ for each species; Table S4: Number and proportion of SPM genes per organ across species and subgenomes; Table S5: Proportion of SPM genes in Brassica genomes and subgenomes at different thresholds; Table S6: JCC and significance of differences within Brassica and between Brassica-A. thaliana organs; Table S7: JCC between organs in the ABC subgenome of Brassica; Table S8: JCC between organs in the tPCK karyotype subgenome of Brassica; Table S9: Regulatory pathways and transcription factors enriched in the genomes and subgenomes of various species in various organs and their p-values; Table S10: Distribution of SPM genes in the tPCK subgenome at each threshold of YABBY and GRF TFs in the embryo.

Author Contributions

X.W. and X.H. designed the experiment; H.C. prepared the materials and data; X.C. and J.W. helped analyze the data; X.H., J.W. and X.W. helped revise the manuscript; H.C. wrote the manuscript. All authors have read and agreed to the published version of the manuscript.

Funding

This research was supported by funding from Innovation Program of Chinese Academy of Agricultural Science. The research was conducted in the State Key Laboratory of Vegetable Biobreeding, Key Laboratory of Biology and Genetic Improvement of Horticultural Crops, Ministry of Agriculture, China, and the Sino-Dutch Joint Lab of Horticultural Genomics Technology, Beijing.

Data Availability Statement

The original contributions presented in this study are included in the article/Supplementary Materials. Further inquiries can be directed to the corresponding authors.

Conflicts of Interest

The authors declare no conflicts of interest.

Abbreviations

The following abbreviations are used in this manuscript:
GECgene expression conservation
TPMtranscripts per million
SPMspecificity measure
JCCJaccard coefficient

References

  1. Branca, F.; Cartea, E. Brassica. In Wild Crop Relatives: Genomic and Breeding Resources: Oilseeds; Kole, C., Ed.; Springer: Berlin/Heidelberg, Germany, 2011; pp. 17–36. [Google Scholar]
  2. Nagaharu, U. Genome analysis in Brassica with special reference to the experimental formation of B. napus and peculiar mode of fertilization. Jpn. J. Bot. 1935, 7, 389–452. [Google Scholar]
  3. Cai, X.; Chang, L.; Zhang, T.; Chen, H.; Zhang, L.; Lin, R.; Liang, J.; Wu, J.; Freeling, M.; Wang, X. Impacts of allopolyploidization and structural variation on intraspecific diversification in Brassica rapa. Genome Biol. 2021, 22, 166. [Google Scholar] [CrossRef] [PubMed]
  4. Li, X.; Wang, Y.; Cai, C.; Ji, J.; Han, F.; Zhang, L.; Chen, S.; Zhang, L.; Yang, Y.; Tang, Q.; et al. Large-scale gene expression alterations introduced by structural variation drive morphotype diversification in Brassica oleracea. Nat. Genet. 2024, 56, 517–529. [Google Scholar] [CrossRef] [PubMed]
  5. Song, J.-M.; Guan, Z.; Hu, J.; Guo, C.; Yang, Z.; Wang, S.; Liu, D.; Wang, B.; Lu, S.; Zhou, R.; et al. Eight high-quality genomes reveal pan-genome architecture and ecotype differentiation of Brassica napus. Nat. Plants 2020, 6, 34–45. [Google Scholar] [CrossRef]
  6. Perumal, S.; Koh, C.S.; Jin, L.; Buchwaldt, M.; Higgins, E.E.; Zheng, C.; Sankoff, D.; Robinson, S.J.; Kagale, S.; Navabi, Z.-K.; et al. A high-contiguity Brassica nigra genome localizes active centromeres and defines the ancestral Brassica genome. Nat. Plants 2020, 6, 929–941. [Google Scholar] [CrossRef]
  7. Kang, L.; Qian, L.; Zheng, M.; Chen, L.; Chen, H.; Yang, L.; You, L.; Yang, B.; Yan, M.; Gu, Y.; et al. Genomic insights into the origin, domestication and diversification of Brassica juncea. Nat. Genet. 2021, 53, 1392–1402. [Google Scholar] [CrossRef]
  8. Yang, J.; Wang, J.; Li, Z.; Li, X.; He, Z.; Zhang, L.; Sha, T.; Lyu, X.; Chen, S.; Gu, Y.; et al. Genomic signatures of vegetable and oilseed allopolyploid Brassica juncea and genetic loci controlling the accumulation of glucosinolates. Plant Biotechnol. J. 2021, 19, 2619–2628. [Google Scholar] [CrossRef]
  9. Niu, Y.; Liu, Q.; He, Z.; Raman, R.; Wang, H.; Long, X.; Qin, H.; Raman, H.; Parkin, I.A.; Bancroft, I. A Brassica carinata pan-genome platform for Brassica crop improvement. Plant Commun. 2024, 5, 100725. [Google Scholar] [CrossRef]
  10. Song, X.; Wei, Y.; Xiao, D.; Gong, K.; Sun, P.; Ren, Y.; Yuan, J.; Wu, T.; Yang, Q.; Li, X.; et al. Brassica carinata genome characterization clarifies U’s triangle model of evolution and polyploidy in Brassica. Plant Physiol. 2021, 186, 388–406. [Google Scholar] [CrossRef]
  11. Yim, W.C.; Swain, M.L.; Ma, D.; An, H.; Bird, K.A.; Curdie, D.D.; Wang, S.; Ham, H.D.; Luzuriaga-Neira, A.; Kirkwood, J.S.; et al. The final piece of the Triangle of U: Evolution of the tetraploid Brassica carinata genome. Plant Cell 2022, 34, 4143–4172. [Google Scholar] [CrossRef]
  12. Town, C.D.; Cheung, F.; Maiti, R.; Crabtree, J.; Haas, B.J.; Wortman, J.R.; Hine, E.E.; Althoff, R.; Arbogast, T.S.; Tallon, L.J.; et al. Comparative Genomics of Brassica oleracea and Arabidopsis thaliana Reveal Gene Loss, Fragmentation, and Dispersal after Polyploidy. Plant Cell 2006, 18, 1348–1359. [Google Scholar] [CrossRef] [PubMed]
  13. Yang, Y.-W.; Lai, K.-N.; Tai, P.-Y.; Li, W.-H. Rates of Nucleotide Substitution in Angiosperm Mitochondrial DNA Sequences and Dates of Divergence Between Brassica and Other Angiosperm Lineages. J. Mol. Evol. 1999, 48, 597–604. [Google Scholar] [CrossRef] [PubMed]
  14. Wang, X.; Wang, H.; Wang, J.; Sun, R.; Wu, J.; Liu, S.; Bai, Y.; Mun, J.-H.; Bancroft, I.; Cheng, F.; et al. The genome of the mesopolyploid crop species Brassica rapa. Nat. Genet. 2011, 43, 1035–1039. [Google Scholar] [CrossRef]
  15. Cheng, F.; Wu, J.; Fang, L.; Sun, S.; Liu, B.; Lin, K.; Bonnema, G.; Wang, X. Biased Gene Fractionation and Dominant Gene Expression among the Subgenomes of Brassica rapa. PLoS ONE 2012, 7, e36442. [Google Scholar] [CrossRef]
  16. Wang, Z.; Yang, J.; Cheng, F.; Li, P.; Xin, X.; Wang, W.; Yu, Y.; Zhang, D.; Zhao, X.; Yu, S.; et al. Subgenome dominance and its evolutionary implications in crop domestication and breeding. Hortic. Res. 2022, 9, uhac090. [Google Scholar] [CrossRef]
  17. Yang, H.; Liu, J.; Huang, S.; Guo, T.; Deng, L.; Hua, W. Selection and evaluation of novel reference genes for quantitative reverse transcription PCR (qRT-PCR) based on genome and transcriptome data in Brassica napus L. Gene 2014, 538, 113–122. [Google Scholar] [CrossRef]
  18. Privitera, G.F.; Treccarichi, S.; Nicotra, R.; Branca, F.; Pulvirenti, A.; Lo Piero, A.R.; Sicilia, A. Comparative transcriptome analysis of B. oleracea L. var. italica and B. macrocarpa Guss. genotypes under drought stress: De novo vs reference genome assembly. Plant Stress 2024, 14, 100657. [Google Scholar] [CrossRef]
  19. Singh, K.P.; Kumari, P.; Yadava, D.K. Development of de-novo transcriptome assembly and SSRs in allohexaploid Brassica with functional annotations and identification of heat-shock proteins for thermotolerance. Front. Genet. 2022, 13, 958217. [Google Scholar] [CrossRef]
  20. An, H.; Qi, X.; Gaynor, M.L.; Hao, Y.; Gebken, S.C.; Mabry, M.E.; McAlvay, A.C.; Teakle, G.R.; Conant, G.C.; Barker, M.S.; et al. Transcriptome and organellar sequencing highlights the complex origin and diversification of allotetraploid Brassica napus. Nat. Commun. 2019, 10, 2878. [Google Scholar] [CrossRef]
  21. Parkin, I.A.P.; Koh, C.; Tang, H.; Robinson, S.J.; Kagale, S.; Clarke, W.E.; Town, C.D.; Nixon, J.; Krishnakumar, V.; Bidwell, S.L.; et al. Transcriptome and methylome profiling reveals relics of genome dominance in the mesopolyploid Brassica oleracea. Genome Biol. 2014, 15, R77. [Google Scholar] [CrossRef]
  22. Tong, C.; Wang, X.; Yu, J.; Wu, J.; Li, W.; Huang, J.; Dong, C.; Hua, W.; Liu, S. Comprehensive analysis of RNA-seq data reveals the complexity of the transcriptome in Brassica rapa. BMC Genom. 2013, 14, 689. [Google Scholar] [CrossRef] [PubMed]
  23. Ziegler, D.J.; Khan, D.; Kalichuk, J.L.; Becker, M.G.; Belmonte, M.F. Transcriptome landscape of the early Brassica napus seed. J. Integr. Plant Biol. 2019, 61, 639–650. [Google Scholar] [CrossRef] [PubMed]
  24. Guo, X.; Liang, J.; Lin, R.; Zhang, L.; Zhang, Z.; Wu, J.; Wang, X. Single-cell transcriptome reveals differentiation between adaxial and abaxial mesophyll cells in Brassica rapa. Plant Biotechnol. J. 2022, 20, 2233–2235. [Google Scholar] [CrossRef] [PubMed]
  25. Sun, X.; Feng, D.; Liu, M.; Qin, R.; Li, Y.; Lu, Y.; Zhang, X.; Wang, Y.; Shen, S.; Ma, W.; et al. Single-cell transcriptome reveals dominant subgenome expression and transcriptional response to heat stress in Chinese cabbage. Genome Biol. 2022, 23, 262. [Google Scholar] [CrossRef]
  26. Gao, P.; Quilichini, T.D.; Yang, H.; Li, Q.; Nilsen, K.T.; Qin, L.; Babic, V.; Liu, L.; Cram, D.; Pasha, A.; et al. Evolutionary divergence in embryo and seed coat development of U’s Triangle Brassica species illustrated by a spatiotemporal transcriptome atlas. New Phytol. 2022, 233, 30–51. [Google Scholar] [CrossRef]
  27. Wang, K.; Wang, D.; Zheng, X.; Qin, A.; Zhou, J.; Guo, B.; Chen, Y.; Wen, X.; Ye, W.; Zhou, Y.; et al. Multi-strategic RNA-seq analysis reveals a high-resolution transcriptional landscape in cotton. Nat. Commun. 2019, 10, 4714. [Google Scholar] [CrossRef]
  28. Wu, Q.; Tong, W.; Zhao, H.; Ge, R.; Li, R.; Huang, J.; Li, F.; Wang, Y.; Mallano, A.I.; Deng, W.; et al. Comparative transcriptomic analysis unveils the deep phylogeny and secondary metabolite evolution of 116 Camellia plants. Plant J. 2022, 111, 406–421. [Google Scholar] [CrossRef]
  29. Chen, J.; Hu, Y.; Zhao, T.; Huang, C.; Chen, J.; He, L.; Dai, F.; Chen, S.; Wang, L.; Jin, S.; et al. Comparative transcriptomic analysis provides insights into the genetic networks regulating oil differential production in oil crops. BMC Biol. 2024, 22, 110. [Google Scholar] [CrossRef]
  30. Libourel, C.; Keller, J.; Brichet, L.; Cazalé, A.-C.; Carrère, S.; Vernié, T.; Couzigou, J.-M.; Callot, C.; Dufau, I.; Cauet, S.; et al. Comparative phylotranscriptomics reveals ancestral and derived root nodule symbiosis programmes. Nat. Plants 2023, 9, 1067–1080. [Google Scholar] [CrossRef]
  31. Cheng, F.; Mandáková, T.; Wu, J.; Xie, Q.; Lysak, M.A.; Wang, X. Deciphering the Diploid Ancestral Genome of the Mesohexaploid Brassica rapa. Plant Cell 2013, 25, 1541–1554. [Google Scholar] [CrossRef]
  32. Chen, H.; Wang, T.; He, X.; Cai, X.; Lin, R.; Liang, J.; Wu, J.; King, G.; Wang, X. BRAD V3.0: An upgraded Brassicaceae database. Nucleic Acids Res. 2021, 50, D1432–D1441. [Google Scholar] [CrossRef] [PubMed]
  33. Chen, S.; Zhou, Y.; Chen, Y.; Gu, J. fastp: An ultra-fast all-in-one FASTQ preprocessor. Bioinformatics 2018, 34, i884–i890. [Google Scholar] [CrossRef] [PubMed]
  34. Kim, D.; Paggi, J.M.; Park, C.; Bennett, C.; Salzberg, S.L. Graph-based genome alignment and genotyping with HISAT2 and HISAT-genotype. Nat. Biotechnol. 2019, 37, 907–915. [Google Scholar] [CrossRef] [PubMed]
  35. Bray, N.L.; Pimentel, H.; Melsted, P.; Pachter, L. Near-optimal probabilistic RNA-seq quantification. Nat. Biotechnol. 2016, 34, 525–527. [Google Scholar] [CrossRef]
  36. Julca, I.; Ferrari, C.; Flores-Tornero, M.; Proost, S.; Lindner, A.-C.; Hackenberg, D.; Steinbachová, L.; Michaelidis, C.; Gomes Pereira, S.; Misra, C.S.; et al. Comparative transcriptomic analysis reveals conserved programmes underpinning organogenesis and reproduction in land plants. Nat. Plants 2021, 7, 1143–1159. [Google Scholar] [CrossRef]
  37. Lohse, M.; Nagel, A.; Herter, T.; May, P.; Schroda, M.; Zrenner, R.; Tohge, T.; Fernie, A.R.; Stitt, M.; Usadel, B. Mercator: A fast and simple web server for genome scale functional annotation of plant sequence data. Plant Cell Environ. 2014, 37, 1250–1258. [Google Scholar] [CrossRef]
  38. Tian, F.; Yang, D.-C.; Meng, Y.-Q.; Jin, J.; Gao, G. PlantRegMap: Charting functional regulatory maps in plants. Nucleic Acids Res. 2019, 48, D1104–D1113. [Google Scholar] [CrossRef]
  39. Quinn, G.P.; Keough, M.J. Experimental Design and Data Analysis for Biologists; Cambridge University Press: Cambridge, UK, 2002. [Google Scholar]
  40. Edgar, R.C. MUSCLE: A multiple sequence alignment method with reduced time and space complexity. BMC Bioinform. 2004, 5, 113. [Google Scholar] [CrossRef]
  41. Nguyen, L.-T.; Schmidt, H.A.; von Haeseler, A.; Minh, B.Q. IQ-TREE: A Fast and Effective Stochastic Algorithm for Estimating Maximum-Likelihood Phylogenies. Mol. Biol. Evol. 2014, 32, 268–274. [Google Scholar] [CrossRef]
  42. Letunic, I.; Bork, P. Interactive Tree of Life (iTOL) v6: Recent updates to the phylogenetic tree display and annotation tool. Nucleic Acids Res. 2024, 52, W78–W82. [Google Scholar] [CrossRef]
  43. Bird, K.A.; Niederhuth, C.E.; Ou, S.; Gehan, M.; Pires, J.C.; Xiong, Z.; VanBuren, R.; Edger, P.P. Replaying the evolutionary tape to investigate subgenome dominance in allopolyploid Brassica napus. New Phytol. 2021, 230, 354–371. [Google Scholar] [CrossRef] [PubMed]
  44. Yang, J.; Liu, D.; Wang, X.; Ji, C.; Cheng, F.; Liu, B.; Hu, Z.; Chen, S.; Pental, D.; Ju, Y.; et al. The genome sequence of allopolyploid Brassica juncea and analysis of differential homoeolog gene expression influencing selection. Nat. Genet. 2016, 48, 1225–1232. [Google Scholar] [CrossRef] [PubMed]
  45. Yamamoto, A.; Kagaya, Y.; Toyoshima, R.; Kagaya, M.; Takeda, S.; Hattori, T. Arabidopsis NF-YB subunits LEC1 and LEC1-LIKE activate transcription by interacting with seed-specific ABRE-binding factors. Plant J. 2009, 58, 843–856. [Google Scholar] [CrossRef]
  46. Romanel, E.A.C.; Schrago, C.G.; Couñago, R.M.; Russo, C.A.M.; Alves-Ferreira, M. Evolution of the B3 DNA Binding Superfamily: New Insights into REM Family Gene Diversification. PLoS ONE 2009, 4, e5791. [Google Scholar] [CrossRef]
  47. Becker, A.; Theißen, G. The major clades of MADS-box genes and their role in the development and evolution of flowering plants. Mol. Phylogenet. Evol. 2003, 29, 464–489. [Google Scholar] [CrossRef]
  48. Sheng, X.-G.; Zhao, Z.-Q.; Wang, J.-S.; Yu, H.-F.; Shen, Y.-S.; Zeng, X.-Y.; Gu, H.-H. Genome wide analysis of MADS-box gene family in Brassica oleracea reveals conservation and variation in flower development. BMC Plant Biol. 2019, 19, 106. [Google Scholar] [CrossRef]
  49. Masiero, S.; Colombo, L.; Grini, P.E.; Schnittger, A.; Kater, M.M. The Emerging Importance of Type I MADS Box Transcription Factors for Plant Reproduction. Plant Cell 2011, 23, 865–872. [Google Scholar] [CrossRef]
  50. Boulard, C.; Fatihi, A.; Lepiniec, L.; Dubreucq, B. Regulation and evolution of the interaction of the seed B3 transcription factors with NF-Y subunits. Biochim. Biophys. Acta (BBA)-Gene Regul. Mech. 2017, 1860, 1069–1078. [Google Scholar] [CrossRef]
  51. Siefers, N.; Dang, K.K.; Kumimoto, R.W.; Bynum, W.E.T.; Tayrose, G.; Holt, B.F., 3rd. Tissue-specific expression patterns of Arabidopsis NF-Y transcription factors suggest potential for extensive combinatorial complexity. Plant Physiol. 2009, 149, 625–641. [Google Scholar] [CrossRef]
  52. Yong, H.-Y.; Zou, Z.; Kok, E.-P.; Kwan, B.-H.; Chow, K.; Nasu, S.; Nanzyo, M.; Kitashiba, H.; Nishio, T. Comparative Transcriptome Analysis of Leaves and Roots in Response to Sudden Increase in Salinity in Brassica napus by RNA-seq. BioMed Res. Int. 2014, 2014, 467395. [Google Scholar] [CrossRef]
  53. Tahmasebi, A.; Ashrafi-Dehkordi, E.; Shahriari, A.G.; Mazloomi, S.M.; Ebrahimie, E. Integrative meta-analysis of transcriptomic responses to abiotic stress in cotton. Prog. Biophys. Mol. Biol. 2019, 146, 112–122. [Google Scholar] [CrossRef] [PubMed]
  54. Zhao, H.; Niu, Y.; Dong, H.; Jia, Y.; Wang, Y. Characterization of the Function of Two S1Fa-Like Family Genes from Populus trichocarpa. Front. Plant Sci. 2021, 12, 753099. [Google Scholar] [CrossRef] [PubMed]
  55. Anwar, A.; Zhang, S.; Wang, L.-X.; Wang, F.; He, L.; Gao, J. Genome-Wide Identification and Characterization of Chinese Cabbage S1fa Transcription Factors and Their Roles in Response to Salt Stress. Antioxidants 2022, 11, 1782. [Google Scholar] [CrossRef] [PubMed]
  56. Finet, C.; Floyd, S.K.; Conway, S.J.; Zhong, B.; Scutt, C.P.; Bowman, J.L. Evolution of the YABBY gene family in seed plants. Evol. Dev. 2016, 18, 116–126. [Google Scholar] [CrossRef]
  57. Eckardt, N.A. YABBY Genes and the Development and Origin of Seed Plant Leaves. Plant Cell 2010, 22, 2103. [Google Scholar] [CrossRef]
  58. Izhaki, A.; Bowman, J.L. KANADI and Class III HD-Zip Gene Families Regulate Embryo Patterning and Modulate Auxin Flow during Embryogenesis in Arabidopsis. Plant Cell 2007, 19, 495–508. [Google Scholar] [CrossRef]
  59. Montgomery, T.A.; Yoo, S.J.; Fahlgren, N.; Gilbert, S.D.; Howell, M.D.; Sullivan, C.M.; Alexander, A.; Nguyen, G.; Allen, E.; Ahn, J.H.; et al. AGO1-miR173 complex initiates phased siRNA formation in plants. Proc. Natl. Acad. Sci. USA 2008, 105, 20055–20062. [Google Scholar] [CrossRef]
  60. Zhang, D.; Sun, W.; Singh, R.; Zheng, Y.; Cao, Z.; Li, M.; Lunde, C.; Hake, S.; Zhang, Z. GRF-interacting factor1 Regulates Shoot Architecture and Meristem Determinacy in Maize. Plant Cell 2018, 30, 360–374. [Google Scholar] [CrossRef]
  61. Omidbakhshfard, M.A.; Proost, S.; Fujikura, U.; Mueller-Roeber, B. Growth-Regulating Factors (GRFs): A Small Transcription Factor Family with Important Functions in Plant Biology. Mol. Plant 2015, 8, 998–1010. [Google Scholar] [CrossRef]
  62. Wang, L.; Gu, X.; Xu, D.; Wang, W.; Wang, H.; Zeng, M.; Chang, Z.; Huang, H.; Cui, X. miR396-targeted AtGRF transcription factors are required for coordination of cell division and differentiation during leaf development in Arabidopsis. J. Exp. Bot. 2010, 62, 761–773. [Google Scholar] [CrossRef]
  63. Lamesch, P.; Berardini, T.Z.; Li, D.; Swarbreck, D.; Wilks, C.; Sasidharan, R.; Muller, R.; Dreher, K.; Alexander, D.L.; Garcia-Hernandez, M.; et al. The Arabidopsis Information Resource (TAIR): Improved gene annotation and new tools. Nucleic Acids Res. 2011, 40, D1202–D1210. [Google Scholar] [CrossRef] [PubMed]
  64. Wendel, J.F. The wondrous cycles of polyploidy in plants. Am. J. Bot. 2015, 102, 1753–1756. [Google Scholar] [CrossRef] [PubMed]
  65. Rapp, R.A.; Udall, J.A.; Wendel, J.F. Genomic expression dominance in allopolyploids. BMC Biol. 2009, 7, 18. [Google Scholar] [CrossRef] [PubMed]
  66. Bottani, S.; Zabet, N.R.; Wendel, J.F.; Veitia, R.A. Gene Expression Dominance in Allopolyploids: Hypotheses and Models. Trends Plant Sci. 2018, 23, 393–402. [Google Scholar] [CrossRef]
  67. Edger, P.P.; Smith, R.; McKain, M.R.; Cooley, A.M.; Vallejo-Marin, M.; Yuan, Y.; Bewick, A.J.; Ji, L.; Platts, A.E.; Bowman, M.J.; et al. Subgenome Dominance in an Interspecific Hybrid, Synthetic Allopolyploid, and a 140-Year-Old Naturally Established Neo-Allopolyploid Monkeyflower. Plant Cell 2017, 29, 2150–2167. [Google Scholar] [CrossRef]
  68. Freeling, M. Bias in Plant Gene Content Following Different Sorts of Duplication: Tandem, Whole-Genome, Segmental, or by Transposition. Annu. Rev. Plant Biol. 2009, 60, 433–453. [Google Scholar] [CrossRef]
  69. Osborn, T.C.; Chris Pires, J.; Birchler, J.A.; Auger, D.L.; Jeffery Chen, Z.; Lee, H.-S.; Comai, L.; Madlung, A.; Doerge, R.W.; Colot, V.; et al. Understanding mechanisms of novel gene expression in polyploids. Trends Genet. 2003, 19, 141–147. [Google Scholar] [CrossRef]
Figure 1. The proportions of expressed genes in different organs.
Horticulturae 11 00427 g001
Figure 2. Distribution of SPM genes across various organs in different genomes.
Horticulturae 11 00427 g002
Figure 3. Distribution of JCC values among same and different organs of genomic SPM genes at different thresholds. Different letters represent 5% significance of differences.
Horticulturae 11 00427 g003
Figure 4. Comparative boxplots illustrate intra-Brassica JCC values (left panel) and Brassica-A. thaliana JCC values (right panel), demonstrating distinct distribution patterns between Brassica-internal and cross-species comparisons. In the figure * represents differences at the 5% level and ** represents differences at the 1% level. The red line area below the numbers contains the data for the comparison.
Horticulturae 11 00427 g004
Figure 5. Genome-level gene function and TF enrichment at different thresholds.
Horticulturae 11 00427 g005
Figure 6. tPCK karyotype subgenome pathway and TF enrichment at different thresholds. Pathway and TF enrichment of LF (A); MF1 (B); and MF2 (C).
Horticulturae 11 00427 g006
Figure 7. Phylogenetic tree of YABBY TFs in major Brassica crops. Red triangles indicate SPM genes in embryo.
Horticulturae 11 00427 g007
Figure 8. Phylogenetic tree of GRF TFs in major Brassica crops. Red triangles indicate SPM genes in embryo.
Horticulturae 11 00427 g008
Disclaimer/Publisher’s Note: The statements, opinions and data contained in all publications are solely those of the individual author(s) and contributor(s) and not of MDPI and/or the editor(s). MDPI and/or the editor(s) disclaim responsibility for any injury to people or property resulting from any ideas, methods, instructions or products referred to in the content.

