Abstract
It is desirable to find and evaluate innovative sustainable products guaranteeing and increasing the quality and productivity of radish (Raphanus sativus). Compost tea (CT) represents a natural organic preparation providing benefits to the soil–plant system, including a biostimulant action against climate change. Therefore, we evaluated whether CT can influence radish nutraceutical properties and its primary metabolism. In particular, the roots resulting from CT treatment were examined via conventional (total antioxidant and phenol contents) and spectroscopic techniques (high-resolution NMR and NIR) and compared with controls. It was proved that CT exerted a positive effect on the radish quality, which led to a significantly larger size in those treated (TRT), accompanied by higher contents of total antioxidants and phenols. The assignment of 1H and 13C signals in the NMR spectra allowed the delineation of the NMR fingerprint of the radish primary metabolome, which was processed by multivariate statistical analyses (PCA, PLS-DA, and heatmap clusterisation). TRT metabolites exhibited a peculiar profile, characterized by higher levels of glutamine and malic acid, along with lower levels of glucose, fructose, sucrose, lactic acid, and tryptophan. NIR spectroscopy also identified a recognisable profile in TRT, confirming its role as an alternative and accessible technique to appreciate the organic treatment’s effects on radish.
1. Introduction
Horticultural productivity is put under ever-increasing pressure due to the worrying progressive decline of soil fertility, associated with climatic change and the rise of fertilizers and biostimulant costs. In this scenario, the models of circular economy and sustainable development evoke the application of sustainable processes to valorise agricultural biomass and to obtain efficient products for soil and plants. In particular, it has become very widespread and advantageous to use organic preparations deriving from the composting process and based on relatively accessible on-farm technologies. Compost tea (CT) represents a promising and sustainable solution to improve the production and quality of the crops in agriculture [1,2]. CT is an organic liquid formulation very rich in microorganisms and organic and inorganic molecules, obtained by extracting biochemically stable compost with dechlorinated water, enriched with oxygen, for a period of time typically ranging from 1 to 10 days [3,4]. CTs are generally characterized by a C/N ranging within 12 and 20 and contain important nutrients such as K, Ca, Mg, Fe, and Zn [5]. Compost teas are also characterized by a relevant content of soluble aromatic compounds, such as lignin and phenol derivatives, fatty acid methyl esters, and lipids of microbial origin [6]. CT may provide numerous benefits by acting as a biostimulant for plants and improving their physiological and productive state [7,8]. Part of such a biostimulation may be also determined by the microorganisms vehicled by the CT serving as efficient plant growth promoters [9]. CT exerts protective effects against the onset of physiopathies [3,10,11] and exhibits fungicidal action [12]. It was demonstrated that CT application on Centella asiatica species resulted in an increase in vegetative growth, yield, and in the content of several antioxidants, such as asiaticoside, madecassoside, and asiatic acid [13]. Similarly, a study conducted on processing tomatoes sprayed with compost tea showed an increase in yield in terms of berry size enhancement [14]. CT proved to serve as a useful biostimulant for several horticultural products, including tomato [15,16], potato [17], and pepper [18,19]. Although the literature reports promising results derived from the application of CT on different crops, most of them are based on agronomic parameters, leaving many aspects unexplored, such as its impact on compositional and nutraceutical quality. Therefore, it becomes a paramount importance to adopt innovative, modern, and reliable analytical approaches to delve into these qualitative aspects.
Metabolomics represents a powerful method to study agricultural edible products and investigate their compositional and metabolic properties. It allows an in-depth analysis useful for the identification of food quality, the characterization of species-specific secondary metabolites with nutraceutical properties [20,21], and the reliable identification of molecular responses induced in plants by either various treatments or specific environmental conditions [22]. Metabolomic analysis relies on the combination of omic data, resulting from advanced analytical techniques and high-throughput technologies, with multivariate statistical analyses. In particular, the high-resolution Nuclear Magnetic Resonance (NMR) spectroscopy is, nowadays, considered one of the most suitable techniques for metabolomics. It is a powerful, reliable, and quantitative method capable of identifying a wide range of metabolites in food products, and determining their structural characteristics and relative concentrations [23,24]. Despite its relatively low sensitivity, NMR offers numerous advantages, including the possibility to use different, complementary, and multidimensional experimental strategies and pulse sequences which, when combined, allow for the identification of a food metabolome. Another interesting analytical technique is represented by Near Infrared (NIR) spectroscopy which, although much less powerful than NMR, is a fast, non-destructive, and easy-to-use method informing on the composition and physico-chemical properties of foods [25,26,27].
The radish (Raphanus sativus) represents an important horticultural product, especially for the valuable nutritional, phytochemical, and nutraceutical properties of the roots [28]. This widely cultivated plant belongs to the Brassicaceae family and is native to East Asia. Radishes are mainly grown in China, followed by European countries, such as Italy, the Netherlands, and Spain. Radish roots contain a number of bioactive compounds, including alkaloids and nitrogen compounds, coumarins, enzymes, gibberellins, glucosinolates, organic acids, phenolic compounds, pigments, polysaccharides, proteoglycans, and sulphur compounds [29,30]. These phytochemicals are known for their nutraceutical and antioxidant properties, with beneficial effects on human health [31], such as anticancer, antibacterial, antidiabetic, and cardiovascular disease prevention activities [32,33]. Therefore, the radish is considered a plant of pharmacological interest, being a promising source of active ingredients and nutraceutical food [34].
Despite the important metabolic, qualitative, and compositional information which could be obtained by applying NMR- and NIR-based metabolomics on radishes, there is an almost total absence of similar applications in the literature. For example, only Ito and co-workers [35] have exploited NIR to determine the nitrate concentration in radishes, by proposing it as an alternative method for ensuring food safety. This evidence underlines that such a promising approach is still drastically underutilized and invites the exploration of its potential as an alternative and innovative composite method to investigate, in depth, radish root quality and metabolism.
Therefore, the main objective of this research was to identify, for the first time, the fingerprint of the primary metabolome of radishes through high-resolution NMR, and investigate whether, and to what extent, a CT treatment can influence the compositional and nutraceutical quality of radish roots. In particular, the roots resulting from CT treatment were examined via conventional (total antioxidant and phenol contents) and spectroscopic techniques (high-resolution NMR and NIR) and compared with controls. Our experimental plan was strongly oriented by preliminary and promising results observed for radish plants treated with CT, which exhibited a significantly larger size and a higher titratable acidity (Supplementary Figure S1).
2. Materials and Methods
2.1. Compost Tea Production, Radish Cultivation, and Sampling
The compost tea was isolated from a mature compost deriving from horticultural residues which was produced in the compost plant OP Terramore in Eboli (Salerno, Italy), and resulted from a three-month-long composting. The CT was obtained by putting 20 dm3 of a compost obtained from vegetable residues into a water-permeable composting tea bag, which was then soaked in a barrel containing 80 litres of chlorine-free water. The concomitant processes of extraction and fermentation occurred for 7 days, at a constant temperature of 28 °C, with 15 min aeration cycles every 6 h. The temperature was controlled by a thermometer sensor, while the aeration was supplied by an electric pump controlled by a mechanical timer.
Radish (Raphanus sativus) plants were grown under greenhouse conditions in the experimental site of OP Ortolanda (Latina, Italy), using the cultivar Winar. The sowing was conducted on November 29, 2023, using a seeding density of 200 seeds/m² (95% of average emergency), sowed at a distance of 5 cm along the rows and 10 cm among the rows. The experimental plan was set up to evaluate the effects of CT treatments on radishes and compare the roots of treated plants (TRT) with those of untreated ones (CTRL). Precisely, for each treatment, three 9 m2 plots were delimited. The total experimental area was organized with a complete randomized block design, according to a 3 × 2 scheme. At the harvesting and for each plot, the plants were collected and analysed from an area of 2 m2, situated in the centre of each plot. Each CT application consisted of 100 L/ha of a CT solution diluted 1:10 with water. The complete CT treatment encompassed 3 applications which were conducted (i) at the beginning of true leaf formation, (ii) at the onset of radish formation, and (iii) during the swelling of the radishes. CT applications were performed using a spray bar connected to a barrel. The radishes were harvested fresh on 15 January 2024, collected into sterile low-density polyethylene bags (one bag per each field replicate), then immediately frozen at −20 °C and stored up to the subsequent analyses and extractions.
2.2. Extraction of Total Phenols and Antioxidant Agents from Radishes
Based on the previous literature [24], the total phenols and antioxidants were extracted via a solid–liquid extraction carried out with a hydroalcoholic ethanol–water solution. However, to maximize the extraction yield, a preliminary method optimization was performed by evaluating and comparing several hydroalcoholic extractants prepared with increasing ethanol concentrations (40, 55, and 70% V:V EtOH:H2O). As described below in the Results Section, the 55% hydroalcoholic solution resulted in the best performance and, thus, was adopted for all extractions presented in this work.
An extraction was conducted for each individual field plot (3 extractions for CTRL plots and 3 extractions for TRT plots). In particular, five radishes per field plot were peeled and combined. The fresh material (around 20 g) was then minced using an immersion blender with blades until the total homogenization. A total of 7 g of the resulting puree were placed into a 250 mL glass flask, along with a magnetic stir bar and, then, put in contact with 14 mL of the extractant hydroalcoholic solution. After a 4 min long ultrasonication in a water bath (ARGO LAB DU-32; Levanchimica, Bari, Italy) at 30 °C and 120 W (40 kHz), the extraction was conducted for 17.5 h in a cold room at 4 °C, in the absence of light and under continuous magnetic stirring. At the end of each extraction cycle, the sample was centrifuged at 6000 rpm for 10 min to isolate the supernatant (NEYA-16; Levanchimica, Bari, Italy). The resulting supernatant was filtered using a vacuum filtration system (N820 LABOPORT,; Levanchimica, Bari, Italy) and employing cellulose acetate filters (Whatman 41, with 20 μm pores; VWR international srl, Milano, Italy). Finally, the filtered extract was transferred into glass vials and stored at −20 °C until subsequent analyses.
2.3. Determination of Antioxidant Capacity (DPPH Assay)
The antioxidant content in the ethanolic extract was assessed via a DPPH (2,2-diphenyl-1-picrylhydrazyl; supplied by VWR) free radical scavenging assay and the results reported as ascorbic acid equivalents (AAE) [24,36]. Specifically, the reaction was launched by combining, progressively, 4.75 mL of methanol, 1 mL of radish extract, and 0.55 mL of DPPH reagent (2.18 nM DPPH solution in methanol). For each extract was launched a reaction cycle composed by three analytical replicates and a blank, which was prepared adopting the same procedure as for the samples, but replacing the extract volume with 1 mL of the extractant solution. The mixtures were vortexed for approximately 10 s and then allowed to react in the dark for 30 min. Immediately after the end of the reaction, each mixture was transferred to polystyrene cuvettes and analysed using a spectrophotometer (Thermo Spectronic 20 Genesys; Hosmotic srl., Vico Equense, Italy) which was set at a wavelength of 517 nm. The free radical scavenging activity of the samples was determined by measuring the residual DPPH concentration. The quantification was conducted by comparing the absorbance results with a calibration curve, built up by launching the reaction with increasing concentrations of ascorbic acid (average r2 > 0.995). Finally, the results were expressed in µg AAE per gram of fresh radish puree. A parametric two-sample t-test was conducted to evaluate the significance of the differences between the CTRL and TRT samples (9 replicates per treatment).
2.4. Determination of Total Phenolic Concentration
The total phenolic concentration in the radish extracts was determined using the Folin–Ciocalteu method [24,37], and the results were expressed as gallic acid equivalents (GAEs).
The reaction was carried out by combining, progressively, 1 mL of radish extract with 3.5 mL of the Folin–Ciocalteu reagent (supplied by VWR; diluted 1:3 with distilled water), 0.2 mL of 10% (w/v) Na2CO3 solution, and 2.45 mL of water. For each extract was launched a reaction cycle composed of three analytical replicates and a blank, which was prepared adopting the same procedure as the sample, but replacing the sample extract volume with 1 mL of the extractant solution. Each reaction mixture was vortexed and then allowed to react in the dark for 2.5 h. The reaction mixtures were transferred into polystyrene cuvettes and analysed spectrophotometrically at the wavelength of 765 nm.
The total phenolic content was determined by comparing the absorbance results with those of a calibration curve, built up by launching the reaction with increasing concentrations of gallic acid (average r2 > 0.995). The GAE value was finally expressed in mg GAE per gram of fresh radish puree. A parametric two-sample t-test was conducted to evaluate the significance of the differences between the CTRL and TRT samples (9 replicates per treatment).
2.5. Nuclear Magnetic Resonance Spectroscopy
Liquid-phase high-resolution NMR spectroscopy was used to evaluate the primary metabolome of the radish extracts. For each NMR replicate was conducted one extraction on a single radish (9 total replicates per treatment, selecting 3 radishes per single field plot). Briefly, one radish root was peeled and 4 thin slices were cut from the outside toward the centre. The biomass (around 400 mg of fresh sample) underwent a cryogenic grinding through liquid nitrogen, until achieving a finely ground material. Then, 150 mg of the sample was extracted with 1.6 mL of a solution prepared by diluting (1:4; v:v) a phosphate buffer solution (brought to pH 6 and obtained with K2HPO3 and KH2PO3 salts) with deuterated water (99.8% D2O/H2O; Eurisotop, Saint Aubin, France) and adding, as an internal standard, 3-Trimethylsilylpropionic Acid (TMSPA) to attain a final concentration of 0.3 mg/mL. Each sample was vortexed and ultrasonicated for 10 min at 30 °C and at a power of 120 W. Then, it was placed into a linear shaking agitator (ARGO LAB SKO-D XL; Levanchimica, Bari, Italy) for 10 min at a speed of 350 rpm and, finally, centrifuged (Eppendorf CENTRIFUGE 5415R; Levanchimica, Bari, Italy) for 10 min at 4 °C and 13,000 rpm. The supernatant was transferred into NMR glass tubes (Bruker Labscape high precision, 5 mm in borosilicate; Bruker Italia srl, Milano, Italy), degassed for 5 min, and loaded into the magnet.
The NMR spectra were acquired at 25 ± 1 °C using a Bruker Ascend 400 MHz magnet (9.4 Tesla; Bruker Biospin, Rheinstetten, Germany), equipped with a 24-position autosampler and a BBI (Broad-Band Inverse) probe, operating at resonance frequencies of 100 MHz and 400 MHz for the 13C and 1H nuclei, respectively. For each replicate, the 1H spectrum was acquired using the on-resonance presaturation technique (at a power of 55 ± 5 dB) to suppress the residual signal from the aqueous solvent (Bruker pulse sequence: NOESYGPPR1D). The optimal acquisition parameters consisted of 4 dummy scans; 96 scans; a 90° spin inversion pulse duration ranging from 10.2 to 10.7 μs; a spectral window of 16 ppm (6410.256 Hz); 67,854 acquisition points; and a total recycle time of 10 s (5 s of acquisition time followed by 5 s of prescan delay). Fourier transformation was applied to the 1D proton spectra by applying an apodization filter of 0.5 Hz, without any “zero-filling”.
Peak assignment for the NMR spectra and, thus, the identification of the primary metabolome, was performed based on both the existing scientific literature and the interpretation of 2D homo- and hetero-correlation NMR spectra acquired from representative radish extracts. The latter were conducted on a 500 MHz magnet (11.75 Tesla, Bruker Oxford/Spectrospin Cryomagnet) equipped with a BBO (Broad-Band Observe) probe. Specifically, 2D homonuclear 1H–1H COSY (Correlation Spectroscopy, TOCSY (Total Correlation Spectroscopy), and NOESY (Nuclear Overhauser Effect Spectroscopy) spectra, as well as heteronuclear 1H–13C HSQC (Heteronuclear Single-Quantum Coherence) and HMBC (Heteronuclear Multiple-Bond Coherence) spectra, were acquired. For all 2D NMR spectra, the set up consisted of 16 dummy scans and 48 real scans, with spectral windows of 16 ppm (6410.3 Hz) for 1H and 300 ppm (30,186.8 Hz) for 13C nuclei.
For all 1D and 2D NMR spectra, the 1H and 13C frequency axes were calibrated by using as a reference the singlet of the internal standard TMSPA (chemical shift δ for 1H and 13C nuclei = 0 ppm). All NMR spectra were processed using the Bruker Topspin software (v. 4.0.2, Bruker Biospin, Rheinstetten, Germany).
2.6. Near Infrared Spectroscopy
Radish samples analysed in the solid state via Near Infrared spectroscopy were dried at 60 °C for 48 h, crushed to obtain a fine powder, and transferred into glass vials.
The analyses were conducted on a PERKIN ELMER Frontier Spectrometer SP8, equipped with an InGaAs detector. Prior to each analysis, a background acquisition was performed by detecting an empty vial. Measurements were carried out in transmittance mode, acquiring 96 scans per sample, examining a spectral range included within 10,000 and 4000 cm−1, with intervals of 2 cm−1 and a resolution of 16 cm−1. Spectral processing was performed using the Spectragryph software (v. 1.2.16.1). In all cases, a baseline correction was applied to ensure reliable spectral comparisons. A total of 7 replicates were performed for each radish type. For each replicate, a single radish was considered by loading, into a glass vial, 100 mg of dried and pulverized product, as well as at least 2 replicates per field plot (7 total replicates per treatment).
2.7. Multivariate Analysis
The spectral range included within 10 and 0.7 ppm of the 1D 1H NMR spectra of radish extracts was divided into n-parcels (buckets) of equal size (0.02 ppm, each corresponding to about 8 Hz), thus generating a matrix composed of 484 buckets per spectrum. This 1D proton spectral bucketing was conducted using the MestReC software (v. 4.9.9.9). Each bucket was then integrated and the resulting values were divided by the area of the internal standard TMSPA (semi-quantitative standardisation). For NIR, the transmittance spectra were firstly converted into absorbance spectra; then, the main signals included in the spectral range 8860–4190 cm−1 were integrated individually to generate 10 buckets per spectrum.
Principal Component Analysis (PCA) was used to evaluate data, identify similarities and dissimilarities in the metabolome among samples, and find variables (loading vectors) discriminating the different types of radishes. PCA was conducted separately on both the 1H NMR spectra (9 replicates per treatment) and NIR spectra (7 replicates per treatment). The parametric two-samples t-test and One-Way ANOVA (Analysis of Variance) were used to examine and select the most important and significant loading vectors associated with the explored principal components of PCA. In all cases, only loading vectors capable of contributing significantly (a p value at least < 0.05 for the t-test and both ANOVA Tukey and Benjamini–Hochberg tests; α confidence level of 0.05) to the discrimination between the different types of investigated radishes, were considered [38,39]. The Partial Least Square–Discriminant Analysis (PLS-DA) assessed the ability to objectively and significantly (α confidence level of 0.05) discriminate the composition of different radishes by providing the extent (%) of correct sample classification and the receiver operator characteristics (ROCs) curve. In detail, the cross-validation test was carried out by considering only the variables identified by the t-test and ANOVA, as significantly involved in the samples’ inter-class differentiation. This choice had the purpose to reduce calculation time and avoid redundancy problems. The criterion was to use around 63% of observations to compose the training set (samples were classified a priori) and the remaining 37% to compose the test set (the samples were left unknown) [40]. The cross-validation was repeated 5 times by randomly inverting, per each radish type, the samples included in the training and test sets.
The clustered heatmap was performed by centring and reducing the values and displaying them according to a colour scale which ranged from dark red (relatively higher/more concentrated) to light yellow (relatively lower/less concentrated), through orange (intermediate values). Samples were clustered using Euclidean’s distance and the Ward’s aggregation method. The Pearson correlation matrix was used to assess the relationship among the variables mostly involved in the discrimination between the radish types, and was reported by highlighting in red and light blue the positive and negative significant correlations, respectively. All the statistical applications reported in this study were executed through the XLStat software (v. 2016, Addinsoft, Paris, France) [40].
3. Results and Discussion
3.1. Optimization of the Extraction Procedure
The extraction procedure represents a crucial step to isolate and quantify the total phenols and antioxidant agents in radishes. In fact, an inefficient and inappropriate radish extraction can lead to an underestimation of their contents. Although the existing literature indicates the ethanol–water solution as one the most suitable extraction solvents for this type of horticultural product, there is a certain divergence regarding the EtOH:H2O ratio which ensures the highest extraction yield of these compounds. Therefore, we performed a preliminary optimization phase in which we used and compared, as extractants, ethanol diluted to different extents with water (40, 55, and 70% v:v EtOH:H2O). The most suitable and efficient mixture was determined based on the content of antioxidant agents and total phenols (expressed in terms of the spectrophotometric absorbance at 517 and 765 nm, respectively).
The free radical scavenging assay via DPPH (Supplementary Figure S2a) revealed that the 55% EtOH:H2O solution, as compared to the 40 and 70% ones, exhibited a significantly lower residual content of DPPH. This ratio ensured the highest extraction yield of antioxidant agents, encompassing a discrete range of polarity. A similar result was observed also with the Folin–Ciocalteu assay, which revealed the highest content in total phenols for the 55% EtOH hydroalcoholic solution (Supplementary Figure S2b). The higher absorbance detected further proved that this solution extracted and solubilized a higher content of phenolic compounds, including both polar compounds, such as flavonoids and phenolic acids, as well as less polar compounds, like lignans.
Since the 55% EtOH:H2O solution was found to be the best and most advantageous for both classes of nutraceutics, it was chosen as the extractant solution for all radish types.
3.2. Free Radical Scavenging Activity and Total Phenol Content
The free radical scavenging activity was determined on root extracts produced by the control CTRL and TRT radish plants. The mean values observed for the CTRL and TRT were 58 ± 6 and 97.2 ± 13.5 µg AAE per g fresh weight, respectively, with significantly higher values in the CT-treated radishes. The differences were statistically significant, as verified via t-test (Table 1). We proved that compost tea influenced the content of compounds with potential antioxidant activity, which was 67.5% higher than that of CTRL samples.

Table 1.
Average values (n = 9) of ascorbic acid equivalents (μg AAE/g of fresh weight) and total phenols (mg GAE/g of fresh weight) and their corresponding standard deviations, standard errors, and significance results (according to a t-test) evaluated for control (CTRL) and compost tea-treated (TRT) radishes. * indicates that the differences are significant, with a p value < 0.1.
The same extracts were also analysed through the Folin–Ciocalteu method, which permitted quantification of the total content in phenols, including both oligomeric and polymeric forms. A moderate increase in phenolic compounds was observed for TRT roots as compared to CTRL samples, with mean values of 74.5 ± 9.1 and 65.5 ± 13 GAE/g fresh weight, respectively (Table 1). However, the significance for such discrimination was less satisfying, since it was significant only at a p-value < 0.1. Such a lower differentiation was ascribed to a larger intra-specific variability, especially for the treated samples.
Such an outcome was consistent with the trend already observed from the DPPH assay and was expected, as phenolic compounds are responsible for much of the antioxidant activity in various vegetables, including radishes [41].
However, the antioxidant agents revealed by the DPPH assay not only refer to phenolics, but also encompass glucosinolates, carotenoids, and sulphur-containing compounds [42]. All of these compounds have a nutraceutical value, because they work synergistically to counteract oxidative stress. Considering that a higher content of antioxidant molecules in food corresponds to higher nutraceutical properties associated with its consumption, we can conclude that the compost tea treatment provided added value to the radishes, both from a nutraceutical and health-promoting perspective.
3.3. NMR-Based Metabolomic Profile
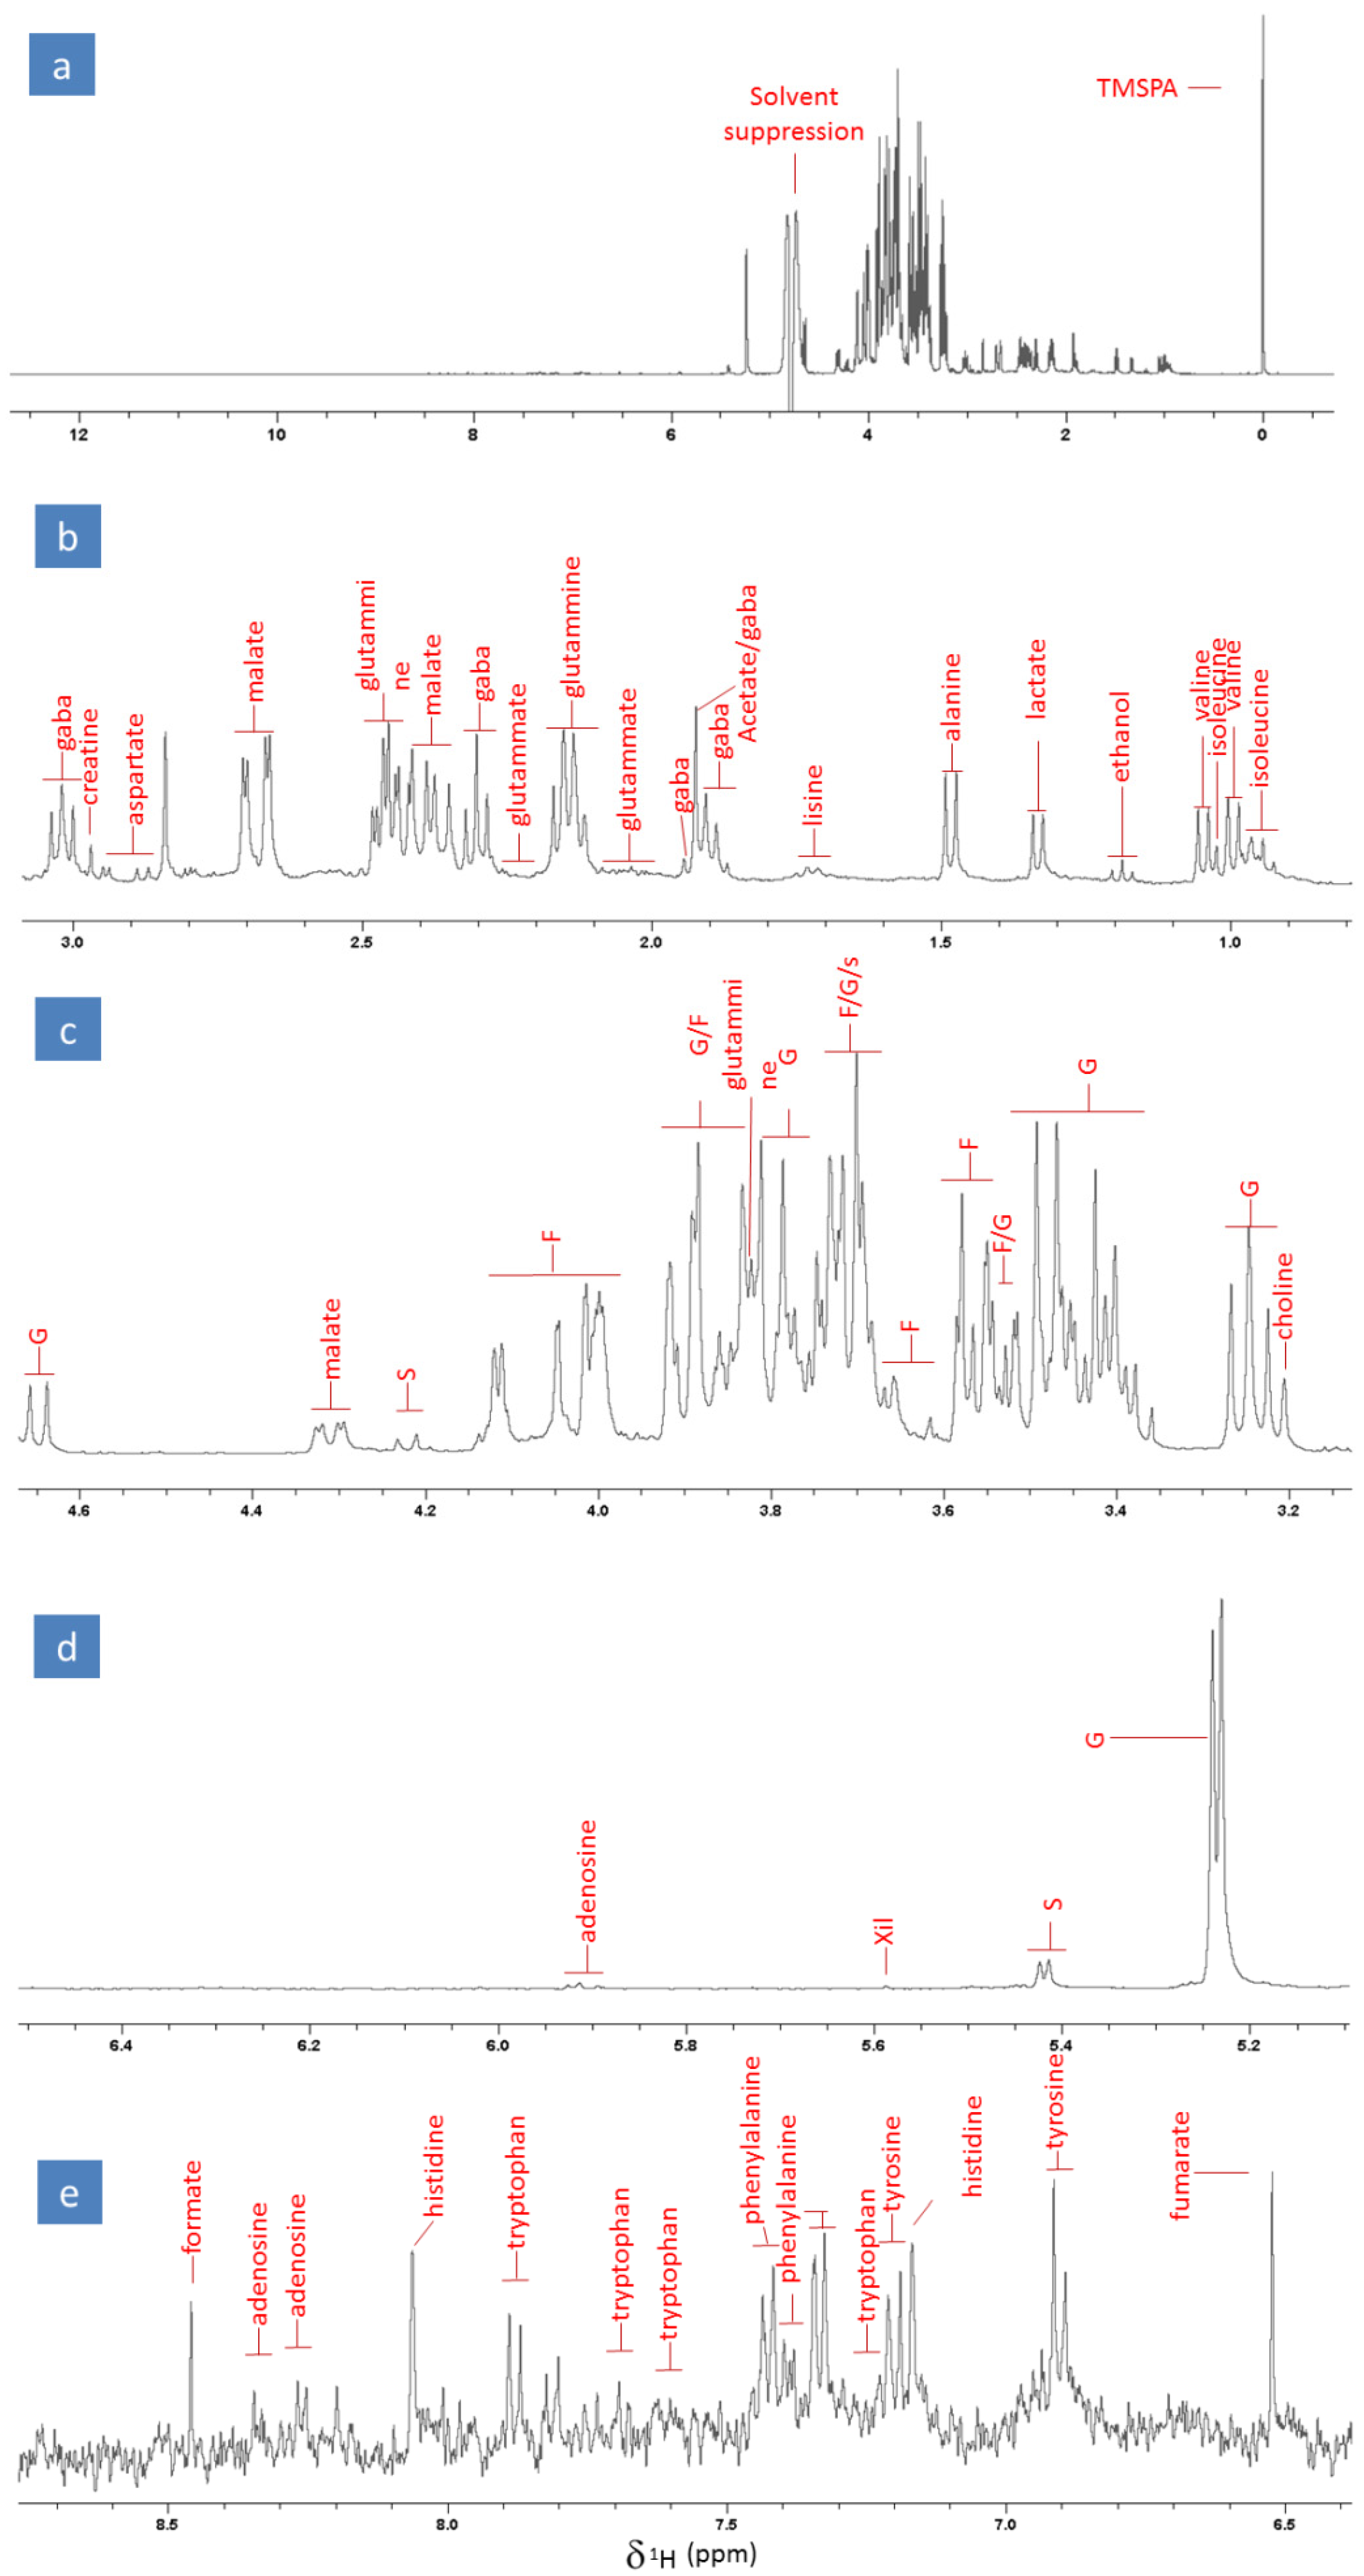
With the aim of identifying the profile of the primary metabolome of radish samples, we analysed the mixture of compounds resulting from an aqueous radish extraction through high-resolution 1H NMR spectroscopy in the liquid phase. The analyses were performed immediately after the sample extraction and preparation to minimize possible degradative and oxidative phenomena. The identification of the primary metabolome was carried out by assigning most of the detected proton signals through the use of a composite approach, based on (i) the interpretation of the 1D and 2D NMR spectra, both homo- and hetero-correlated, of the radish extracts, (ii) the examination of the detected proton signals, and (iii) the comparison of the extract’s spectra with those of certified standards. Figure 1a shows the proton spectrum of a representative radish dissolved in the extractant solution, buffered at pH 6. The intense singlet at 0 ppm corresponds to the signal of methyl hydrogens bound to the silicon nucleus of the TMSPA molecule (which acts as the internal standard), while the region around 4.7 ppm is affected by the solvent suppression (Figure 1a).
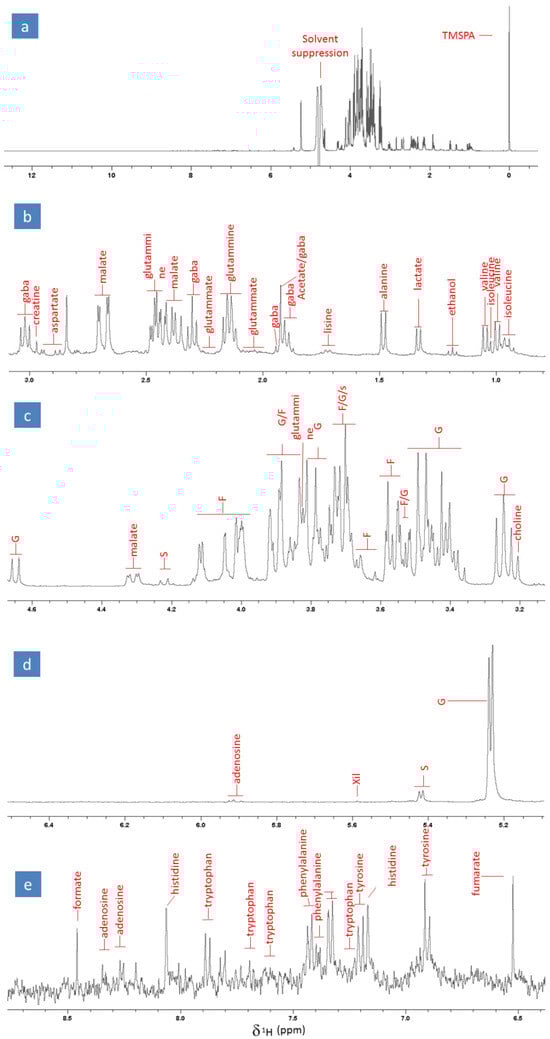
Figure 1.
(a) High-resolution full NMR spectrum of a representative radish extract along with an enlargement of the following spectral regions: (b) alkyl and hydroxyalkyl (0.8–3.1 ppm), (c) hydroxyalkyl (3.1–4.65 ppm), (d) region of double bonds and aromatic compounds (5.1–6.5 ppm), and (e) amides (6.4–8.8 ppm). The assignments are reported in the figures, where G, F, S, and Xil abbreviations stand for glucose, fructose, sucrose, and xylose, respectively.
The primary metabolic profile of the radish extracts revealed the presence of 22 compounds, including amino acids, organic acids, carbohydrates, alcohols, and nucleosides. Most of the peaks detected in the alkyl and hydroxyalkyl region (ranging between 0 and 3.5 ppm; Figure 1b) were attributed to GABA, creatine, aspartate, glutamine, malate, glutamate, acetate, lysine, alanine, lactate, ethanol, valine, and isoleucine; the signals observed in the hydroxyalkyl region between 3.5 and 4.7 ppm (Figure 1c,d) were assigned to glucose (G), fructose (F), sucrose (S), xylose (xil), and choline; and the signals appearing in the region of double bonds and aromatic compounds between 5.9 and 8.5 ppm (Figure 1e,f) were ascribed to adenosine, formate, histidine, tryptophan, phenylalanine, tyrosine, and fumaric acid. The most intense and predominant signals observed in the radish metabolome were represented by the multiplets of carbohydrates. This was expected, as carbohydrates are the most abundant compound class in radishes, with an average content of around 3–4%. It is noteworthy that the obtained aqueous extract was also rich in amino acids and organic acids, such as malate and lactate. Moreover, it is important to underline that, to the best of our knowledge, this is the first time that the NMR-based fingerprint of the primary metabolome of radish roots has been proposed. This finding may pave the way to and help future investigations aiming to estimate possible systemic and metabolic effects exerted on the radish by experimental treatments or specific conditions.
3.4. Metabolomic Analysis of Radishes Based on NMR Data
The NMR spectra obtained from the analysis of TRT and CTRL radish extracts were compared through a semi-quantitative approach, aiming to identify the elicited metabolic response and understand the biochemical mechanisms, either directly or indirectly, triggered by the compost tea application.
In particular, the 1D proton NMR spectra of the radish extracts were integrated, divided in buckets, and included into a data matrix, which was subsequently processed through various multivariate statistical analyses. Initially, Principal Component Analysis (PCA) was applied, which produced two interrelated outputs, referred to as the score plot (related to the observations) and loading plot (related to the variables), and is very advantageous since it enables a rapid exploration of the internal variance among samples. PCA is usually adopted in metabolomics, since it allows identifying similarities and dissimilarities between studied sample types, revealing possible metabolic responses induced by experimental conditions [40].
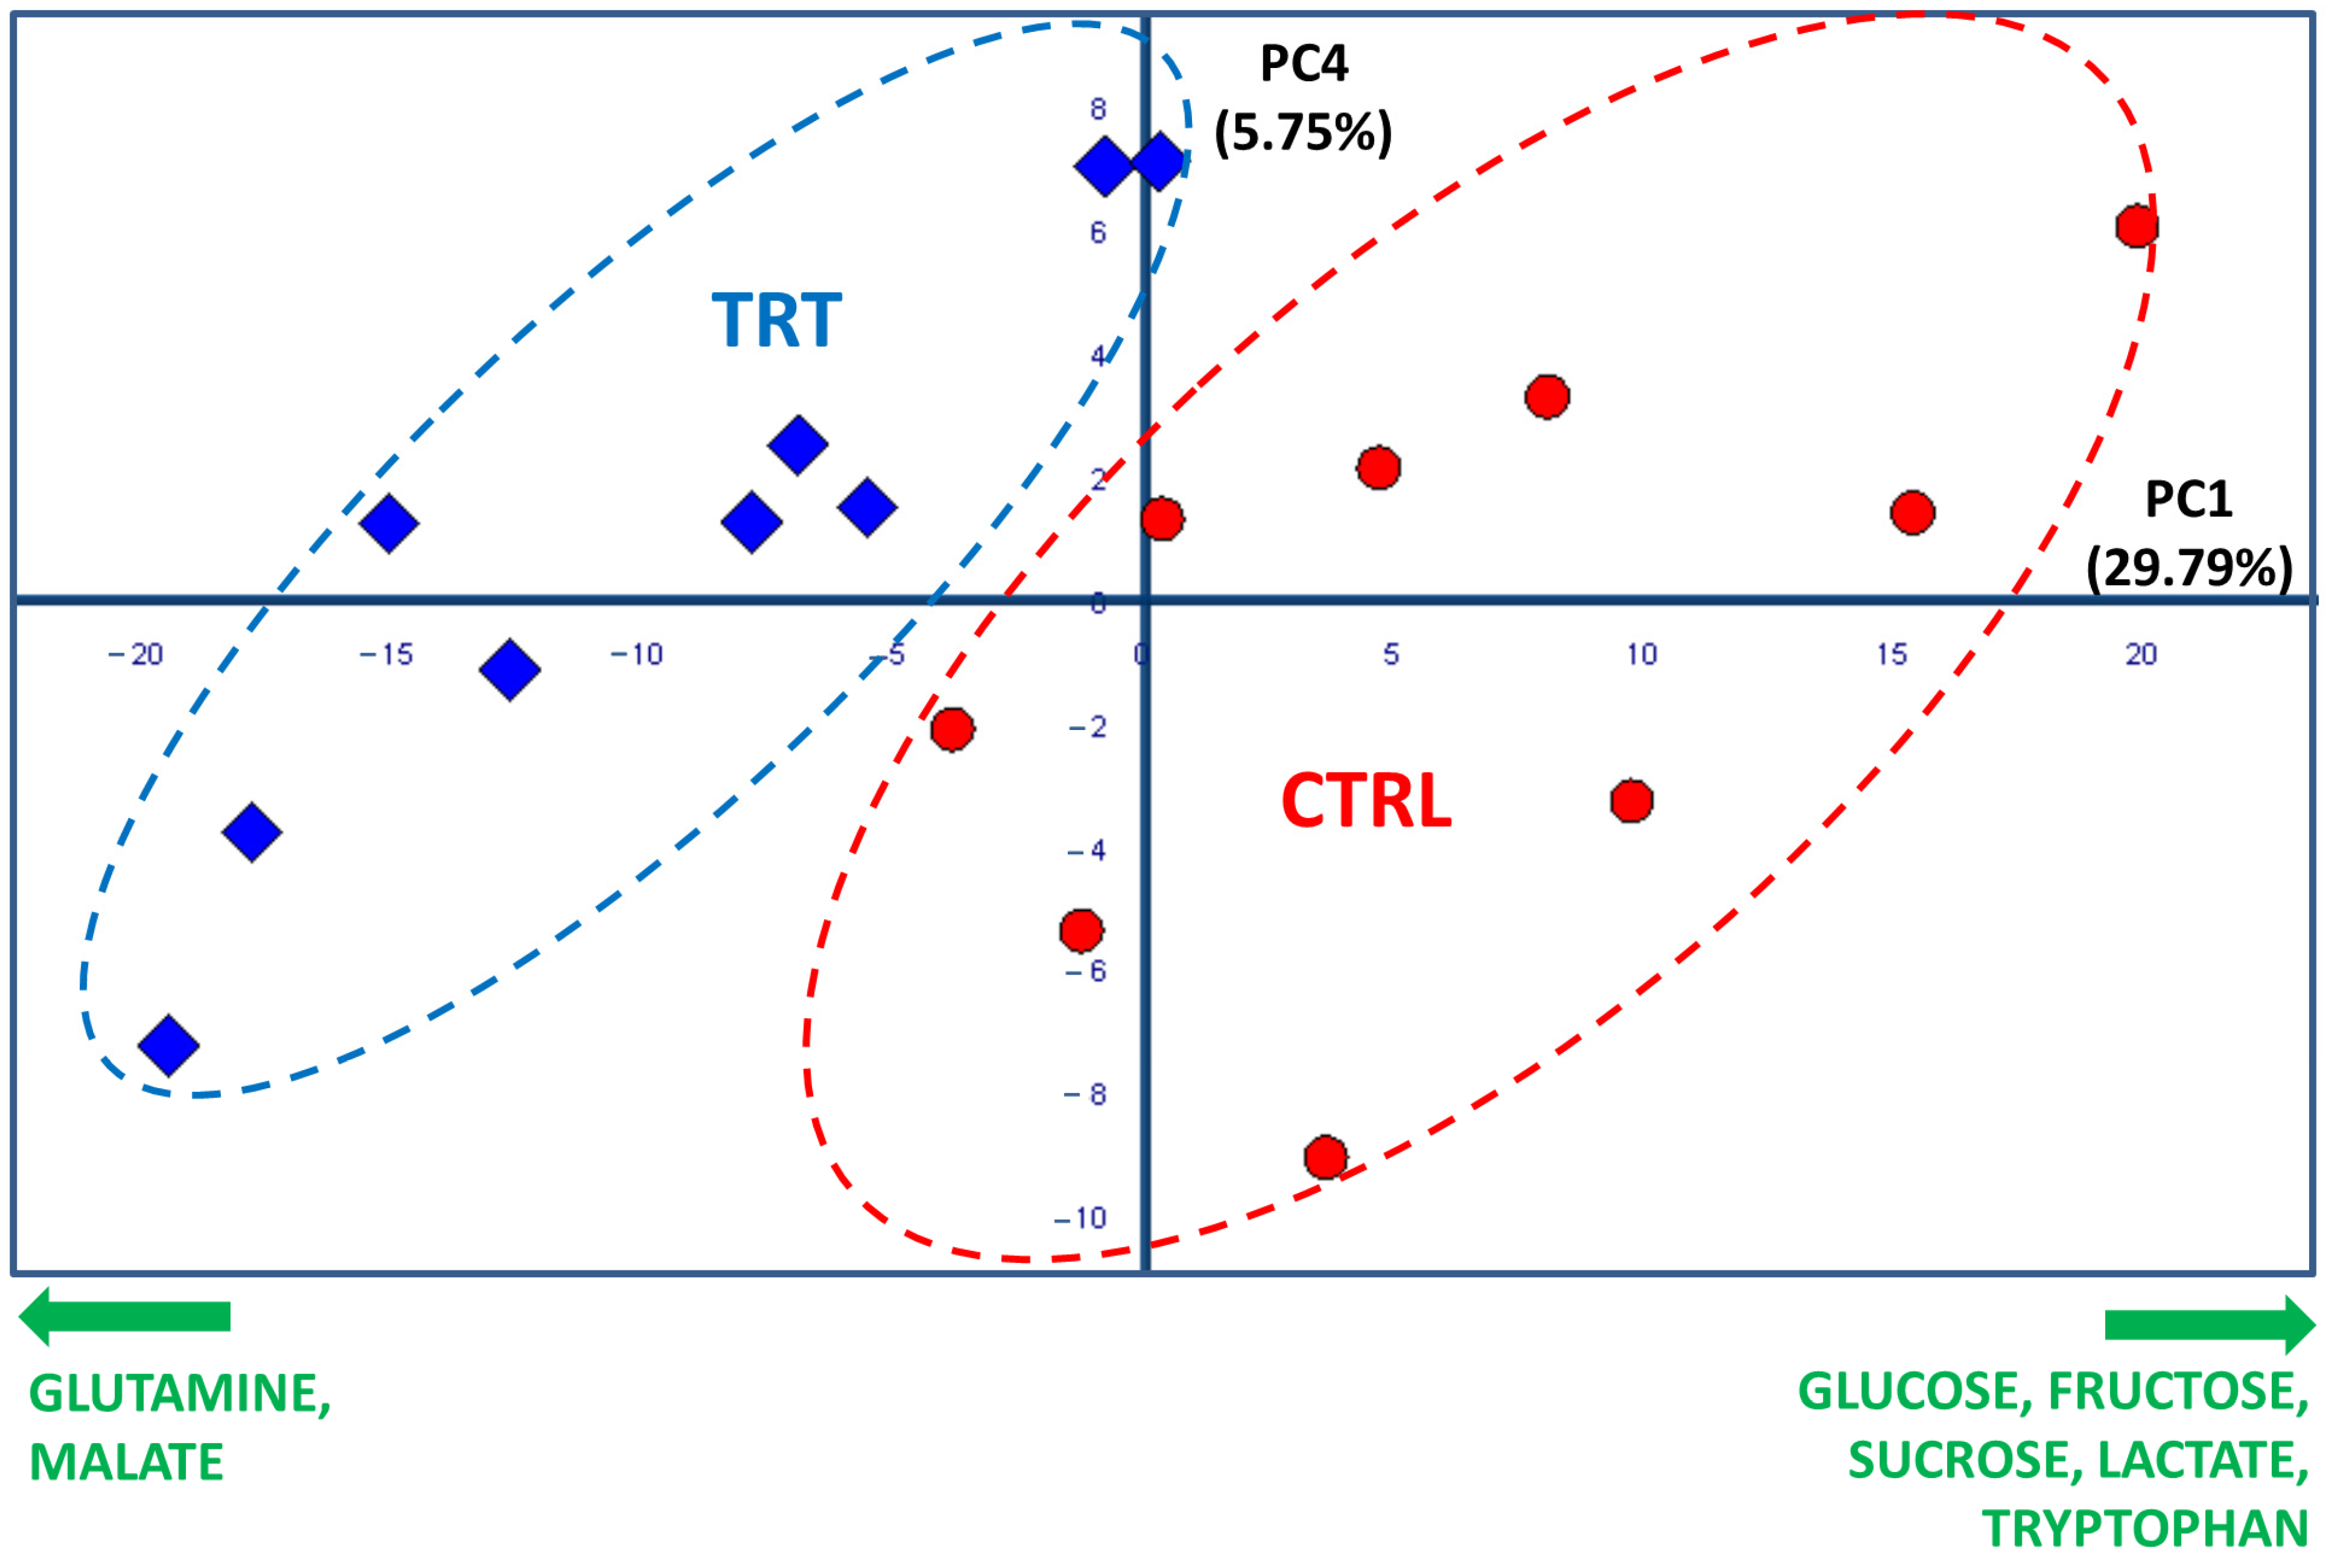
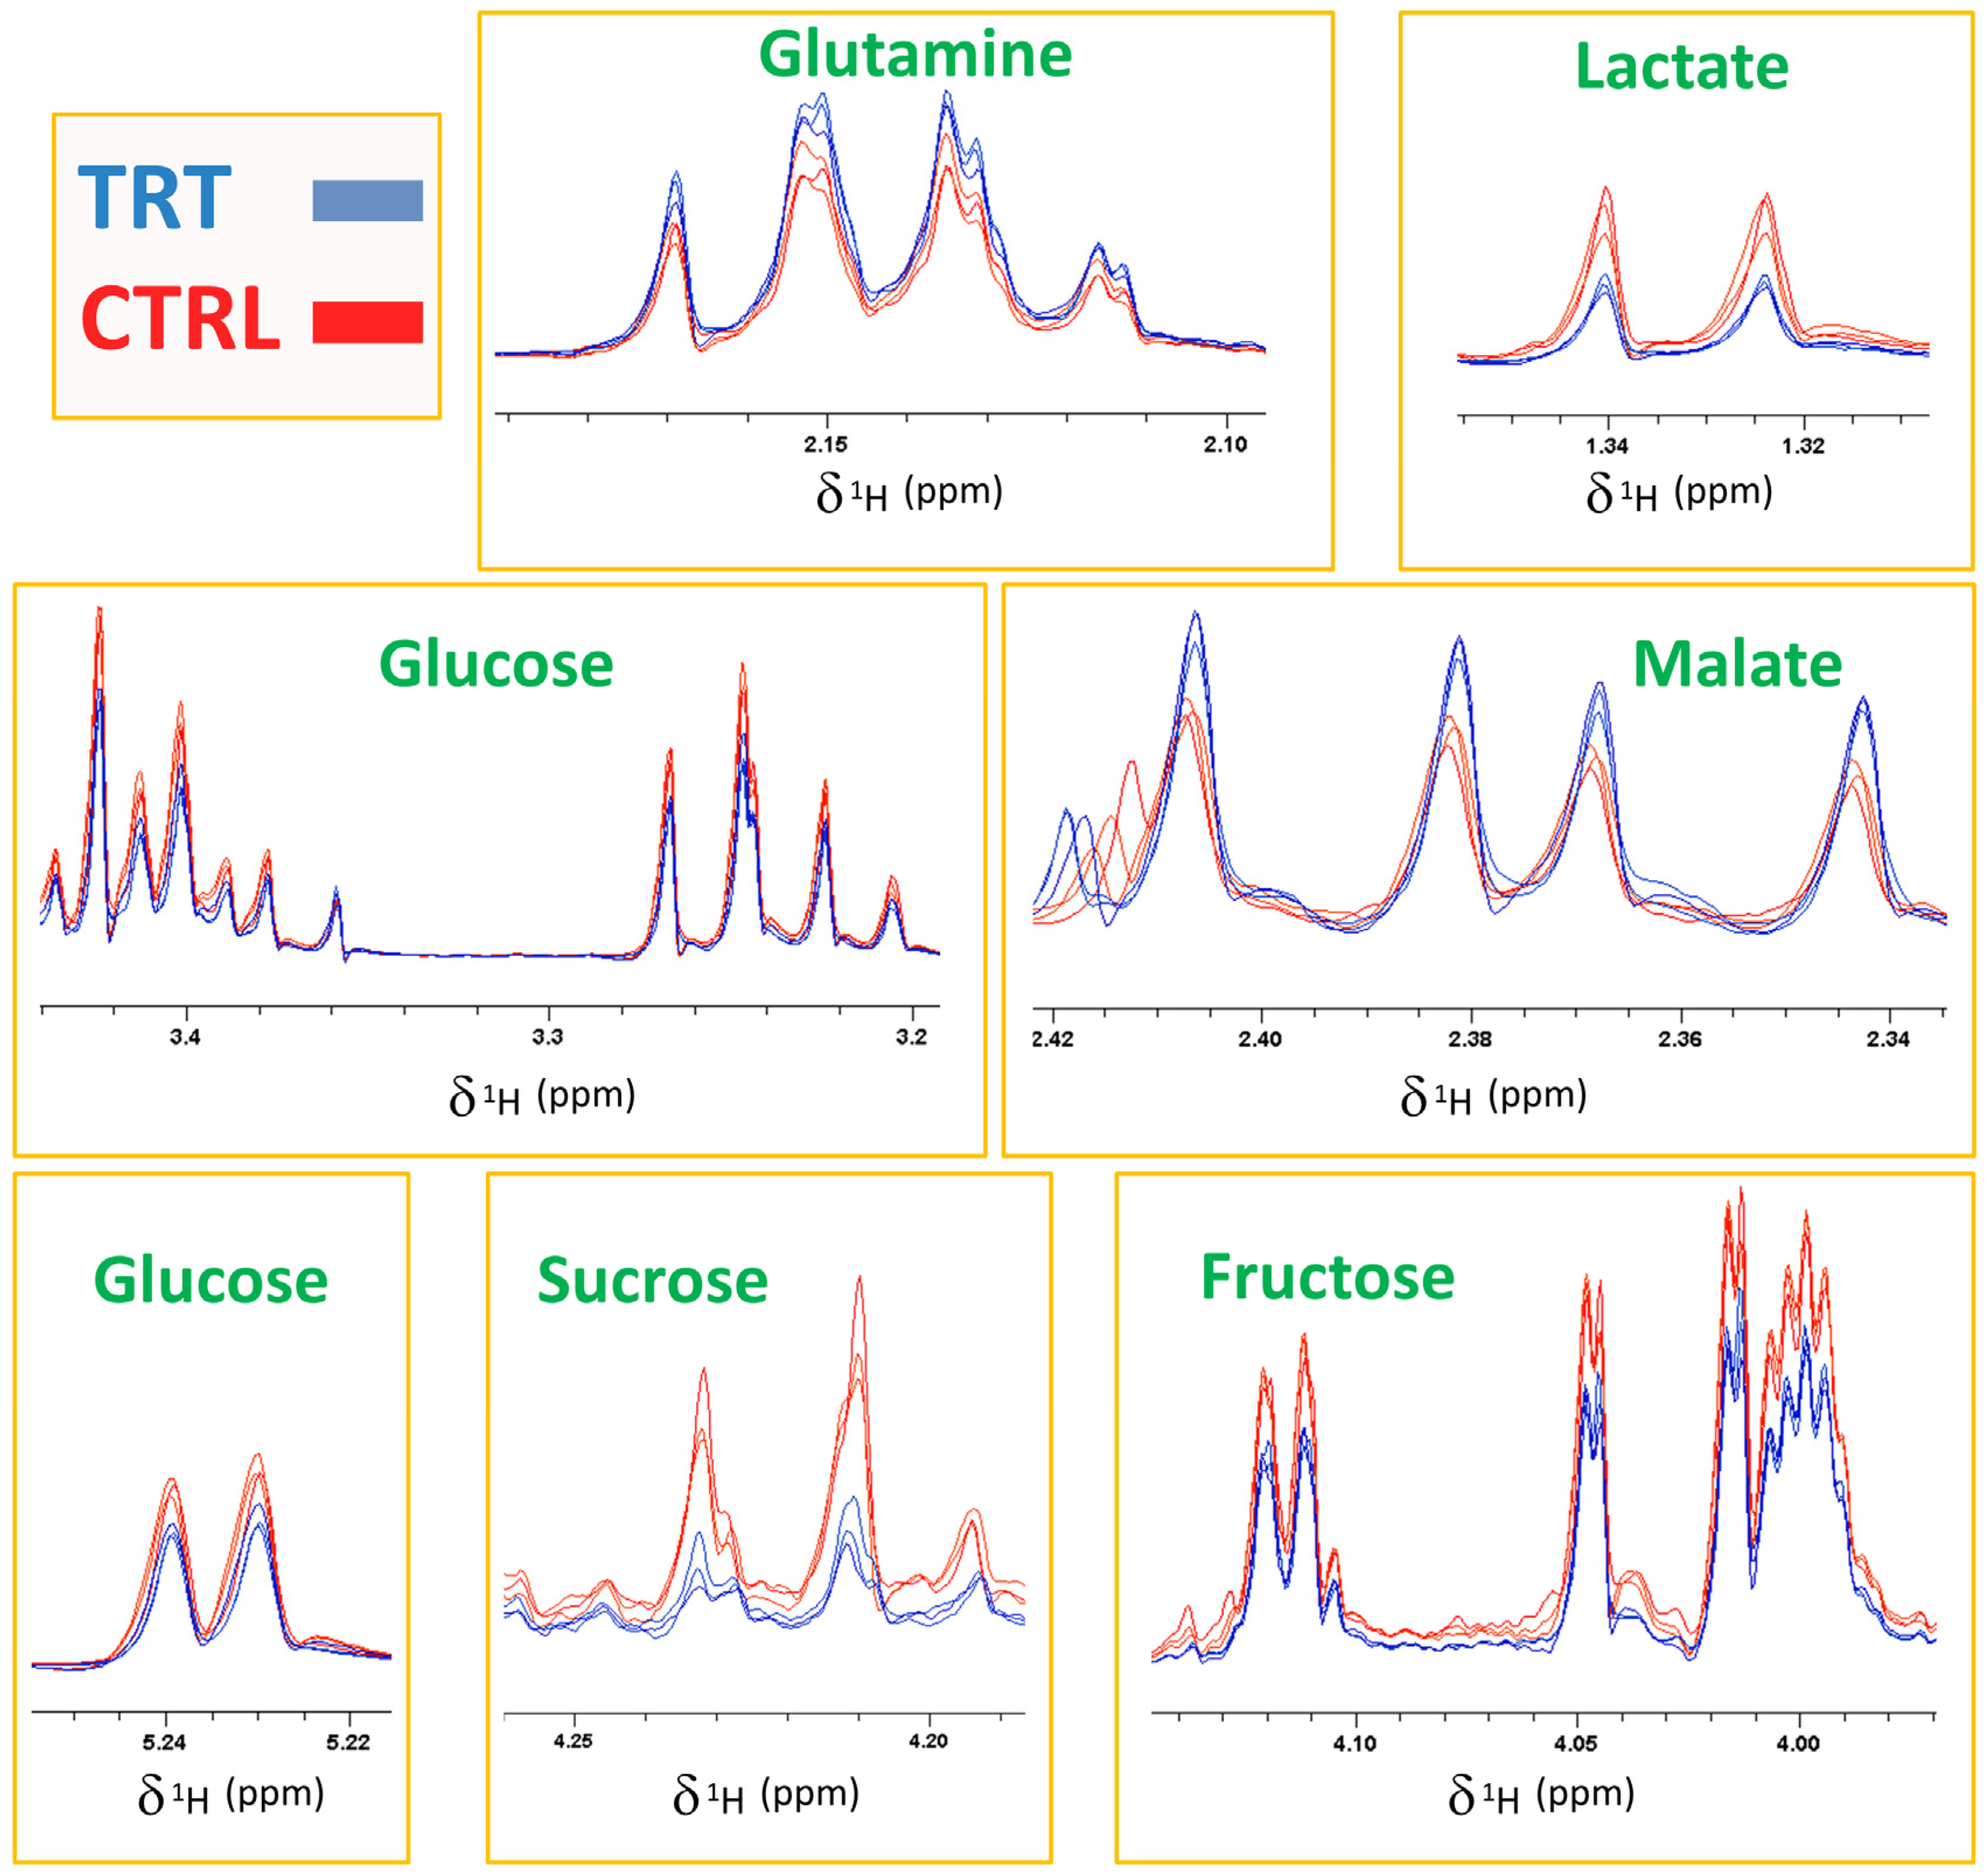
The score plot shown in Figure 2 resulted from the combination of the PC1 and the PC4 axes, which explained 29.79 and 5.57% of the total system variability, respectively. The score plot revealed that the CTRL and TRT observations were collocated in two different spatial regions. Specifically, most of TRT samples were grouped in an area characterized by negative values of PC1, while the control samples were positioned at positive PC1 values. Such a clear separation confirmed that the treatment with the compost tea was effective in inducing significant changes in the primary radish metabolome. The fact that the separation of the two groups occurred only along PC1 indicated that the variables related to CT treatment were mostly represented by this axis. Therefore, the examination of the loading plot permitted the isolation of several loading vectors associated with PC1, which were subsequently evaluated by a t-test and ANOVA. In this way, the molecules responsible for the significant (p value at least < 0.05, although in many cases even < 0.001) discrimination between the CTRL and TRT samples were individuated. Specifically, the treated samples showed a higher content of malate and glutamine, which was accompanied by a lower content of several carbohydrates (glucose, fructose, and sucrose), tryptophan, and lactic acid (Figure 2). The spectral regions, including the signals determining the groups’ differentiation, are exhibited in Figure 3 through a representative superimposition of three replicates per sample type. This figure not only sheds light on the neat spectral differences existing between the TRT and CTRL samples, but also indicates the high reproducibility and reliability of both these outcomes and of the method itself.
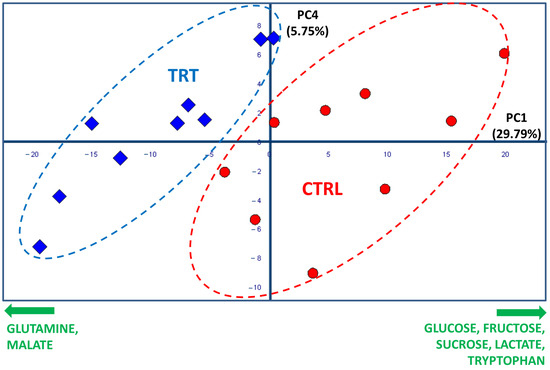
Figure 2.
PCA score plot based on 1H NMR spectra of CTRL (red circles) and TRT (blue rhombuses) radish extracts (PC1 vs. PC4, 35.4% of total variance explained). The ellipses have been arbitrarily generated to emphasize the groups’ separation. The names and orthogonal directions of the most significant loading vectors responsible for the radish type discrimination are reported in green along the edges.
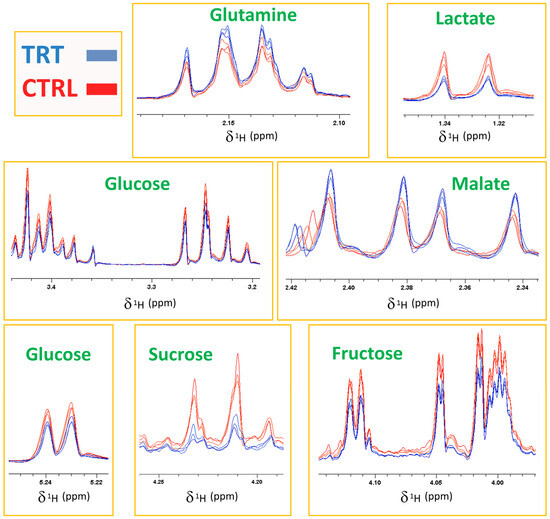
Figure 3.
1H NMR spectra of CTRL (red) and TRT (blue) radish extracts (three replicates per type). The boxes report the spectral regions including the signals mostly involved in the discrimination.
NMR data provided evidence that the CT treatment had a significant impact on the metabolome, altering the concentration of several metabolites present in the root. This change may be the result of the conditions established in the complex soil–plant system by the action of compost tea, which induced a lower production of carbohydrates in the root, accompanied by an overexpression of malic acid and glutamine. Compost tea is known to contain not only nutrients and bioactive compounds, but also microorganisms which, interacting with plants at the rhizosphere, positively influence nutrient and water uptake, hopefully fostering the development of plant resilience against abiotic stress due to climatic change [43].
It is important to note that part of these results is consistent with the preliminary agronomic results (Supplementary Figure S1). In fact, the higher carbohydrate content detected by NMR in CTRL samples is in line with the fact that this type of radish showed a slightly higher dry matter and optical residue. At the same time, the higher malic acid content found in the proton spectra of TRT samples is consistent with the higher values observed for titratable acidity, being that malate is one of the predominant organic acids composing the radish root.
Finally, samples were evaluated by a PLS-DA cross-validation test. Supplementary Figure S3a–c shows the most important outputs of one representative cross-validation test, which includes (i) a score plot with validation scores and groups’ centroids, (ii) a cross-validation table showing the extent of unknown samples classified correctly, and (iii) the ROC curve. PLS-DA further validated our conclusions, since 100% of “unknown” replicates were classified correctly in each of all the five cross-validation rounds. This helps to bolster the evidence that CT treatment determines a specific and recognizable metabolomic fingerprint in radishes.
3.5. Near-Infrared Spectroscopy (NIR) of Radishes
Near-infrared spectroscopy is a rapid analytical method for analysing the main compositional properties of fresh and unprocessed food products without the need for time-consuming and labour-intensive manipulations [44]. Therefore, NIR spectra can serve as a useful additional tool to inform on the primary metabolome of radishes in a non-destructive manner [45].
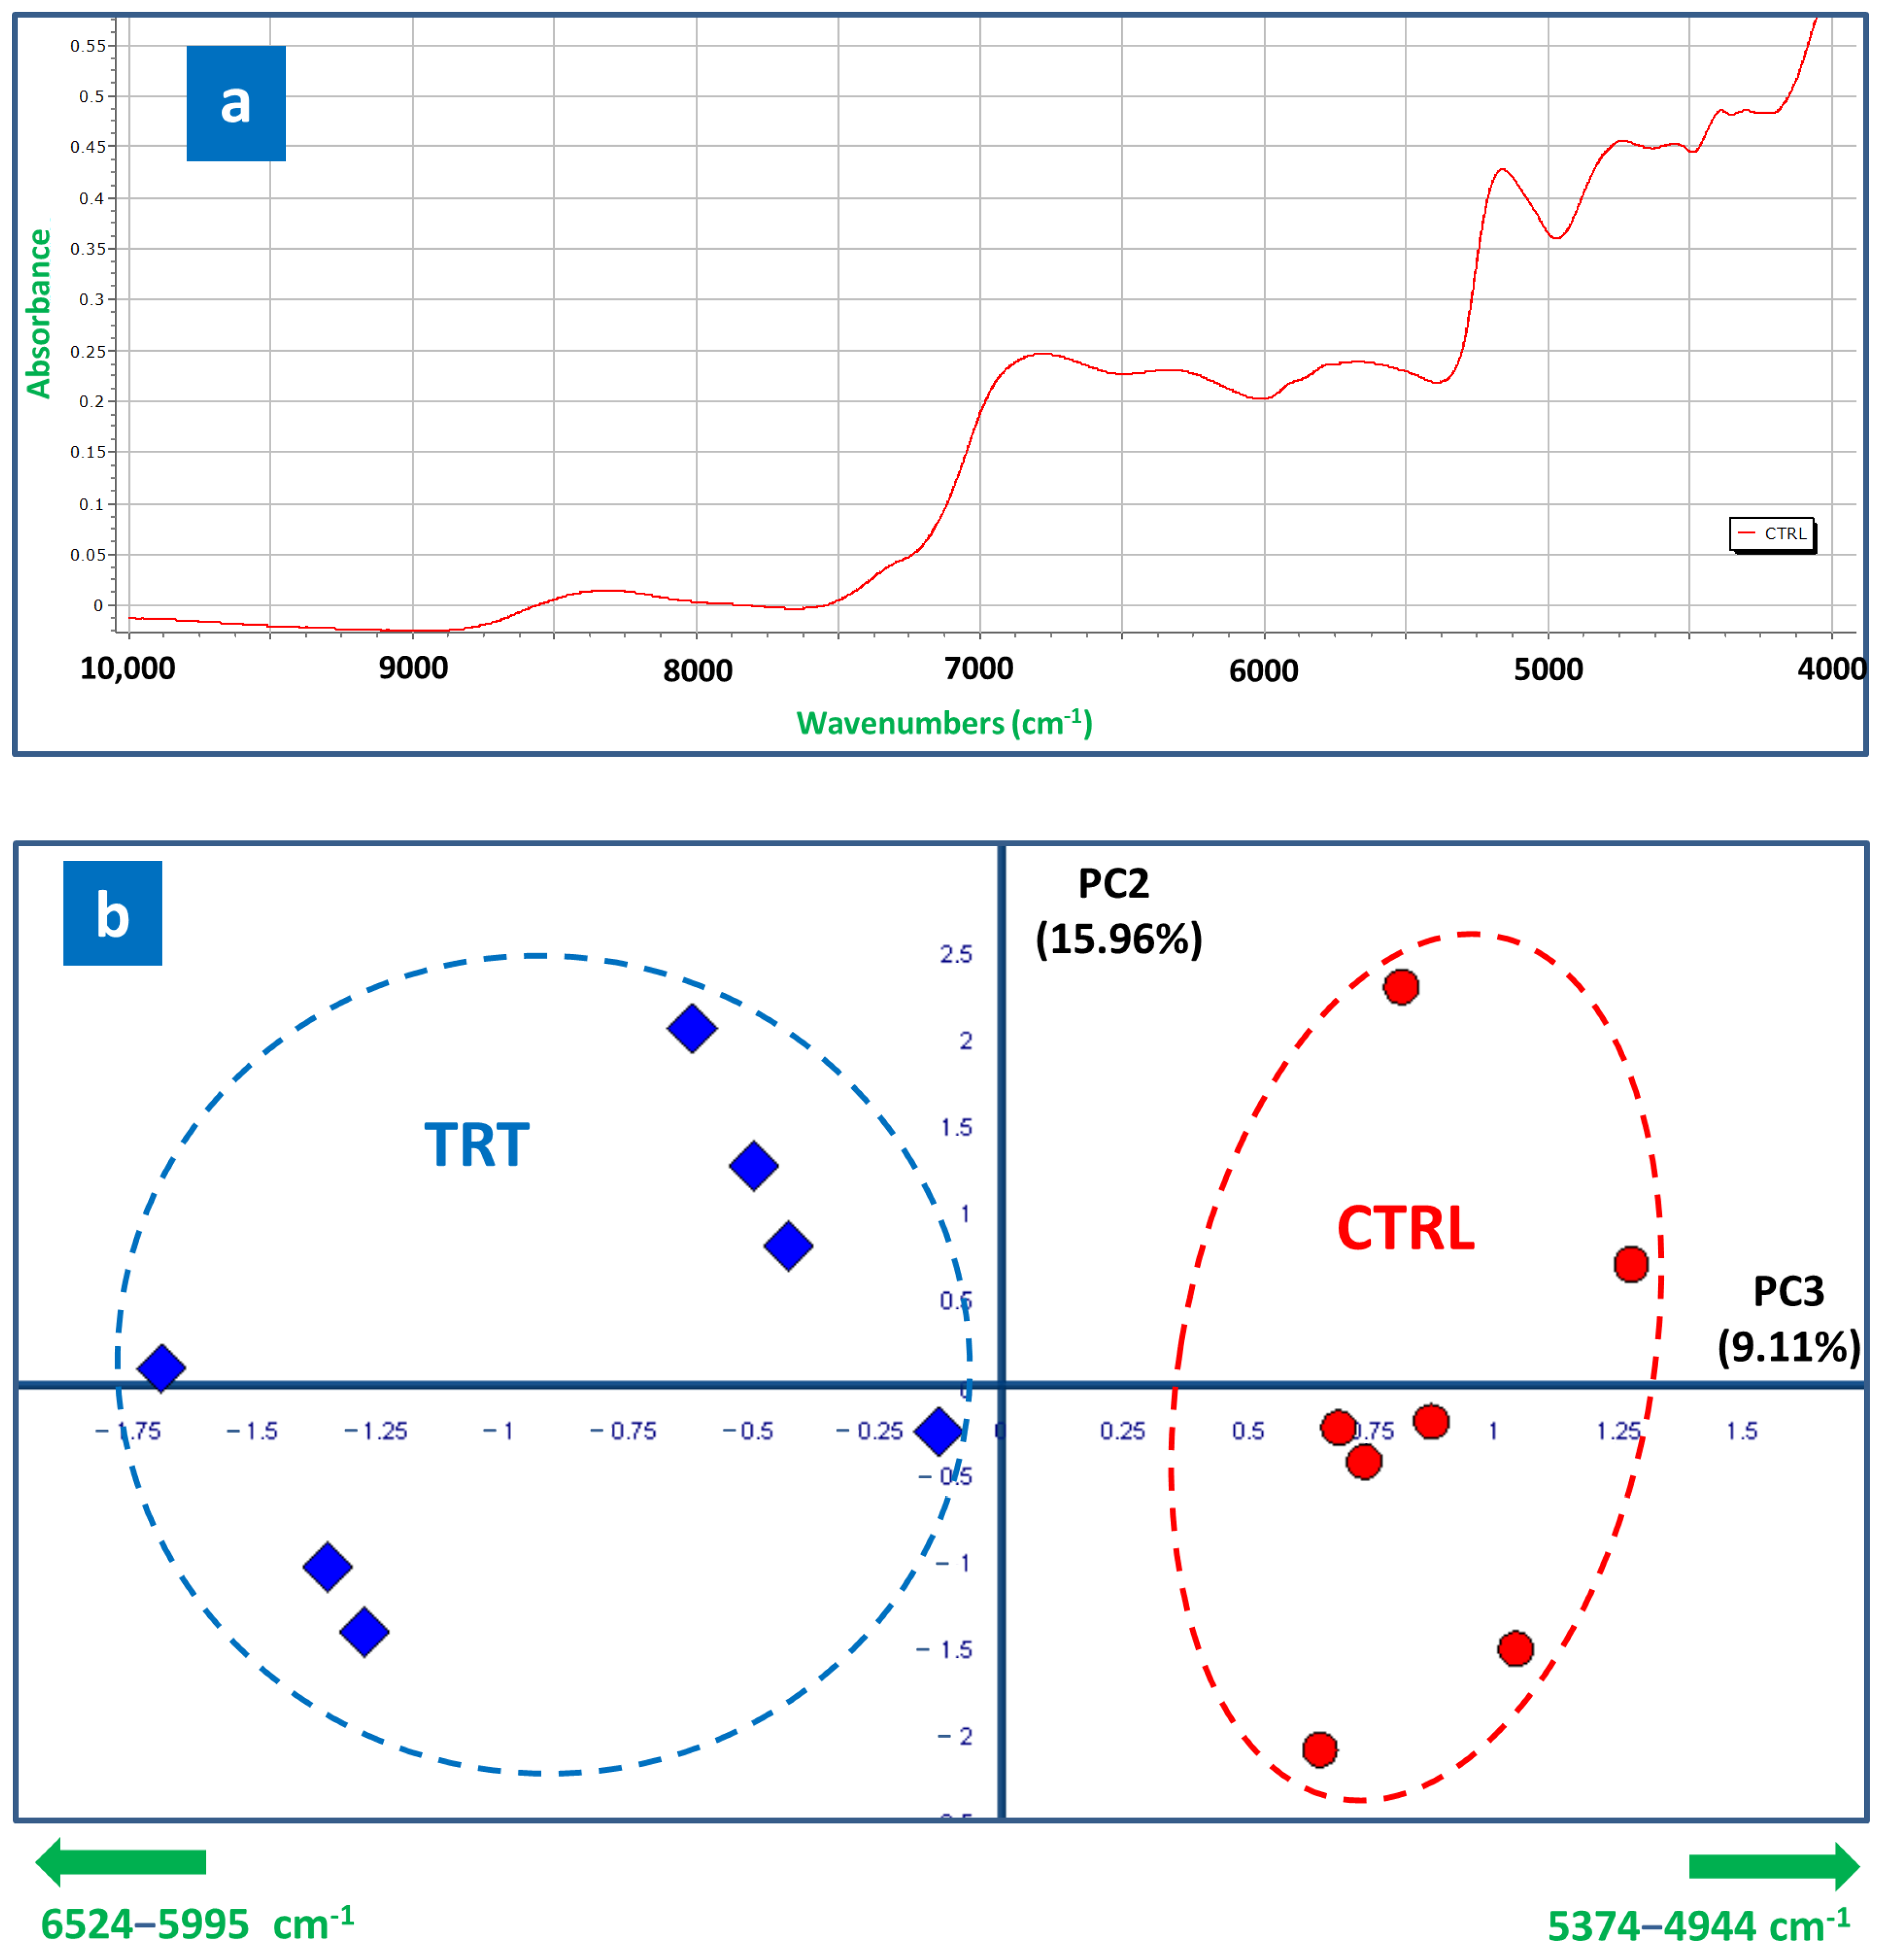
The solid-state NIR spectra of radishes revealed a broad overlap of absorption bands, resulting from the complex and relatively heterogeneous mixture of molecules composing the examined samples, accompanied by relatively low resolution [46]. Figure 4a shows the full NIR spectrum of a representative CTRL radish sample [47]. From a qualitative point of view, the TRT spectra also exhibited a similar profile, with the same peaks. Based on the literature [46,47], the absorption band in the range 9000–8000 cm−1 was attributed to lipid and carbohydrate vibrations, and the region between 7000 and 6000 cm−1 was associated with carbohydrate vibrations. For the region from 7000 to 5900 cm−1, the absorption bands were attributed to several amino acids, phenols, alcohols, water, and lipids. In detail, (i) the absorption band from 6950 to 7400 cm−1 was assigned to a combination of the primary overtone of the C-H stretch; (ii) the first overtone of the C-H stretch was expected to resonate between 5600 and 6150 cm−1; (iii) the band near 5200 cm−1 was assigned to the second overtone of the C=O stretch; and (iv) the absorption band at approximately 4850 cm−1 corresponded to combinations of O-H or N-H stretches.
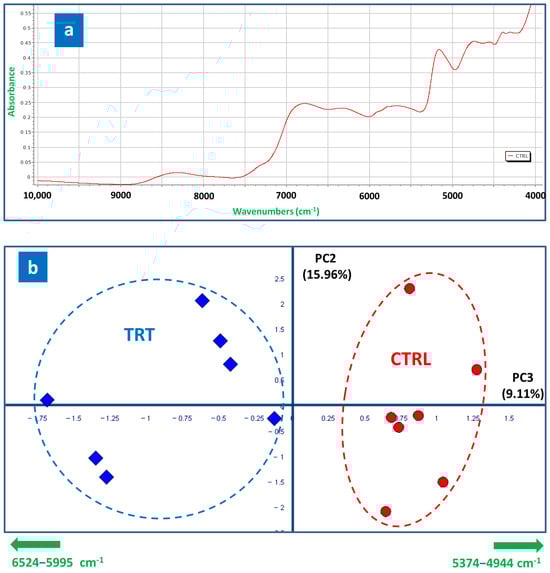
Figure 4.
(a) Solid-state ATR-NIR spectrum of a representative control radish; (b) PCA score plot based on NIR spectra of CTRL (red circles) and TRT (blue rhombuses) radish samples (PC3 vs. PC2, 25.07% of total variance explained). The region interval and orthogonal directions of the most significant loading vectors responsible for the radish type discrimination are reported in green along the edges.
The NIR spectra of the CTRL and TRT samples were processed and compared to carry out a semiquantitative evaluation. The PCA score plot composed by the PC2 and PC3 axes (25.07% of total variance explained; Figure 4b) revealed a clear separation between the treated and control samples, occurring prevalently along the PC3 axis. Most of the TRT observations were positioned at negative values of the PC3, while the opposite was observed for the CTRL ones. The examination of the loading vectors associated to PC3, followed by the t-test and ANOVA, permitted the reveal that the TRT NIR profile was systematically characterized by a more intense signal in the region 6524–5995 cm−1, accompanied by a lower intensity in the 5374–4944 cm−1 region. Moreover, it is interesting to note that the TRT samples exhibited a slightly greater dispersion than the CTRL samples along both PC axes, thus suggesting a higher metabolic variability promoted by the CT. In conclusion, the NIR data were also evaluated by the PLS-DA cross-validation test, which further validated our conclusions, since 100% of “unknown” replicates were classified correctly in each of all the five cross-validation rounds (Supplementary Figure S3d–f).
The fact that NIR was able to recognize an alteration in the composition of TRT samples due to CT treatment is noteworthy and not obvious. In fact, this outcome is of a paramount importance because, as compared to NMR, the NIR technique represents a more accessible, widespread, and cheaper instrumentation which, although it has objective limitations, may serve as a useful and reliable tool to conduct a preliminary radish screening and evaluate the effects elicited by agronomic and innovative treatments.
3.6. Clustered Heatmap of Combined Data
Finally, the heatmap technique, which is another “unsupervised” method, was applied to process all the data that contributed significantly to discriminate the CTRL from TRT samples. The clustered heatmap is very advantageous because it clearly and directly highlights the semi-quantitative response (from red to yellow) of the variables mostly involved in the discrimination between the sample types. Moreover, it reports a clusterisation of both variables (dendrogram on the left-hand side of the figure) and samples (dendrogram on the top of the figure) based on their mutual similarity, providing two tree structures where objects are linked to one another depending on their progressively decreasing similarity. Consequently, for sample clusterisation, the more similar the values for the compared variables, the closer the observations are placed in this structure.
The clustered heatmap of the CTRL and TRT samples is shown in Figure 5. By focusing on the sample dendrogram on the top of the figure, it is interesting to note that the first knot clearly separated all the CTRL and TRT samples into two distinct macro-clusters, by indicating an inter-class difference significantly greater than the intra-class one (81.4 vs. 18.6%, respectively). In agreement with the data from the PCA, t-test, and ANOVA, such a finding was further evidence that all the experimental data considered in this study (nutraceuticals, NMR, and NIR) provided peculiar traits in TRT radishes. Interestingly, the colour modulation confirmed that the TRT samples showed higher values (darker colours, converging towards red) for malic acid, glutamine, antioxidant content, and compounds resonating in the NIR range 5374–4994 cm−1, whereas the CTRL samples exhibited a higher concentration of certain carbohydrates, lactate, and the NIR band in the range 6524–5995 cm−1. Finally, examining the tree structure on the left, it was also appreciated that, on one hand, a strong correlation existed between all the variables that were more abundant in the CTRL (in particular, the correlation between the three carbohydrates) and, on the other hand, between all those that were found more abundant in the TRT. In Supporting Table S1, the Pearson correlation matrix of variables mostly involved in the discrimination among investigated radish types is shown. In line with the heatmap results, in red and in blue are highlighted the most intense positive and negative correlations.
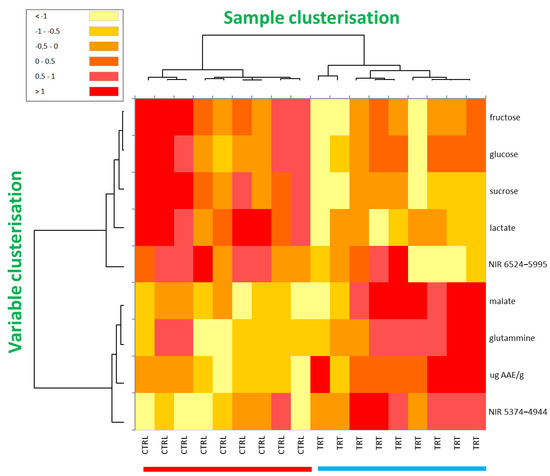
Figure 5.
Clustered heatmap based on the variables significantly involved in the discrimination between the CTRL and TRT samples, including NMR, NIR, and nutraceutical data. The values were centred, scaled, and displayed according to a colour gradient ranging from red (relatively high values) to yellow (relatively low values), with orange representing intermediate values.
4. Conclusions
We proved that composite approaches based on high-throughput and advanced analytical techniques may help to fill the dearth of compositional information on the radish (Raphanus sativus) and permit a delve into the metabolic responses induced by external stimuli or field treatments, such as the application of compost tea. Neat differences were observed for most of the considered nutraceutic and metabolic parameters, with antioxidant agent levels found to be higher in the treated samples (67.5% more). Through NMR data, we identified, for the first time and to the best of our knowledge, the primary metabolome of the radish, identifying more than 20 compounds. In particular, it was found that the TRT samples had lower levels of glucose, fructose, sucrose, lactic acid, and tryptophan, accompanied by higher levels of glutamine and malic acid. In line with preliminary agronomic results, the higher malic acid levels observed in the TRT samples via NMR coincided with a higher titratable acidity, while the higher carbohydrate content in the CTRL correlated with the higher dry weight and optical residue. Interestingly, the lower optical residue and the larger size of treated radishes also suggested a more efficient water adsorption biostimulated by the treatment.
Our results also demonstrated that NIR can provide valuable information on the primary metabolome of radishes, complementing liquid-phase 1H NMR spectroscopy. Even though NIR is much less powerful than NMR, it exhibited a certain discriminatory power for the investigated radishes. This, along with its cost-effectiveness and ease of use, permits the suggestion of NIR as an ideal and complimentary tool to conduct screening to assess the effects induced by innovative treatments.
In conclusion, compost tea represents a sustainable strategy to positively influence radish quality, hopefully promoting its resilience to stress conditions, including those related to climatic change. Importantly, CT may permit limiting the use of common and unsustainable solutions, which may exert long-term and detrimental effects on soil. Our outcomes also pave the way for future experiments aiming to evaluate the effects of CT in other challenging conditions, as well as confirm the observed agronomic and metabolomics effects on horticultural products different than radishes.
Supplementary Materials
The following supporting information can be downloaded at: https://www.mdpi.com/article/10.3390/horticulturae11040426/s1, Figure S1: (a) Table including average values and related standard deviations for dry matter, optical residue, titratable acidity and size (transversal and longitudinal diameters) of bulb radishes resulting from control (CTRL) and compost tea treatment (TRT). The figure also includes the pictures of representative CTRL (b) and TRT (c) bulb radishes; Figure S2: Spectrophotometric responses (Absorbance, mean values and standard deviations) of DPPH (a) and Folin-Ciocalteu (b) assays, to evaluate the extraction yields of antioxidants and phenols, respectively, as a function of the different extraction solutions (40, 55 and 70% v:v EtOH:H2O solution). Mean values associated to different letters are significantly different, according to Tukey and Benjamini-Hochberg tests at a p value < 0.001; Figure S3: Representative PLS-DA cross-validations, based on NMR (up) and NIR (down) spectra, to discriminate CTRL from TRT samples. The figure includes cross-validation score-plots (a and d; where red circles and blue rhombuses represent CTRL and TRT samples), the Receiver Operator Characteristics curve (ROC; b and e) and the cross-validation results (c and f); Table S1: Correlation matrix investigating the variables mostly involved in the discrimination between CTRL and TRT samples. The most intense positive and negative correlations are highlighted in red and in blue, respectively.
Author Contributions
P.M. contributed to conceptualization, methodology, investigation, resources, manuscript editing, supervising and reviewing, and funding acquisition. A.F. and M.L.G. contributed to nutraceutical and metabolomic analysis, investigation, and the original draft of the manuscript. M.Z. contributed to conceptualization and manuscript reviewing. V.T.L. contributed to agronomic analysis and investigation. All authors have read and agreed to the published version of the manuscript.
Funding
Part of this work was funded by the project funds of “NMR-based metabolomics to investigate on the effects exerted by several biofactors on typical Italian agrofood—Responsible P. Mazzei” of the University of Salerno.
Data Availability Statement
Data are contained within the article.
Conflicts of Interest
The authors declare no conflict of interest.
References
- Yin, J.; Wang, J.; Zhao, L.; Cui, Z.; Yao, S.; Li, G.; Yuan, J. Compost tea: Preparation, utilization mechanisms, and agricultural applications potential—A comprehensive review. Environ. Technol. Innov. 2025, 38, 104137. [Google Scholar] [CrossRef]
- De Corato, U. Agricultural waste recycling in horticultural intensive farming systems by on-farm composting and compost-based tea application improves soil quality and plant health: A review under the perspective of a circular economy. Sci. Total Environ. 2020, 738, 139840. [Google Scholar] [CrossRef] [PubMed]
- Zaccardelli, M.; Pane, C.; Scotti, R.; Palese, A.M.; Celano, G. Use of compost tea as bioagrochemicals and biostimulants in vegetable-fruit cultivation. Italus Hortus 2012, 19, 17–28. [Google Scholar]
- González-Hernández, A.I.; Pérez-Sánchez, R.; Plaza, J.; Morales-Corts, M.R. Compost tea as a sustainable alternative to promote plant growth and resistance against Rhizoctonia solani in potato plants. Sci. Hortic. 2022, 300, 111090. [Google Scholar] [CrossRef]
- Verrillo, M.; Salzano, M.; Cozzolino, V.; Spaccini, R.; Piccolo, A. Bioactivity and antimicrobial properties of chemically characterized compost teas from different green composts. Waste Manag. 2021, 120, 98–107. [Google Scholar] [CrossRef]
- Moț, A.; Pârvulescu, O.C.; Ion, V.A.; Moloșag, A.; Dobrin, A.; Bădulescu, L.; Orbeci, C.; Egri, D.; Dobre, T.; Løes, A.-K.; et al. Preparation, Characterization, and Testing of Compost Tea Derived from Seaweed and Fish Residues. Agronomy 2024, 14, 1919. [Google Scholar] [CrossRef]
- Waliczek, T.M.; Wagner, N.C. An Investigation of the Impact of Compost Tea Applications on Turf Quality and Soil Microbial Activity. J. Environ. Hortic. 2023, 41, 1–6. [Google Scholar] [CrossRef]
- Ros, M.; Hurtado-Navarro, M.; Gimenez, A.; Hernandez, J.A.F.; Egea-Gilabert, C.; Lozano-Pastor, P.; Pascual, J.A. Spraying agro-industrial compost tea on baby spinach crops: Evaluation of yield, plant quality and soil health in field experiments. Agronomy 2020, 10, 440. [Google Scholar] [CrossRef]
- Pane, C.; Celano, G.; Villecco, D.; Zaccardelli, M. Control of Botrytis cinerea, Alternaria alternata and Pyrenochaeta lycopersici on tomato with whey compost-tea applications. Crop Prot. 2012, 38, 80–86. [Google Scholar] [CrossRef]
- Ritter, G.; Villa, F.; da Silva, D.F.; Alberton, O.; Menegusso, F.J.; Eberling, T.; Doria, J. Microbiological biostimulant promotes rooting of olive cuttings. Int. J. Agric. Biol. Eng. 2021, 14, 207–212. [Google Scholar] [CrossRef]
- Yousfi, S.; Marín, J.; Parra, L.; Lloret, J.; Mauri, P.V. A Rhizogenic Biostimulant Effect on Soil Fertility and Roots Growth of Turfgrass. Agronomy 2021, 11, 573. [Google Scholar] [CrossRef]
- Scheuerell, S.J.; Mahaffee, W.F. Compost tea: Principles and prospects for plant disease control. Compost Sci. Util. 2002, 10, 313–338. [Google Scholar] [CrossRef]
- Siddiqui, Y.; Islam, T.M.; Naidu, Y.; Meon, S. The conjunc- tive use of compost tea and inorganic fertiliser on the growth, yield and terpenoid content of Centella asiatica (L.) urban. Sci. Hortic. 2011, 130, 289–295. [Google Scholar] [CrossRef]
- Pane, C.; Villecco, D.; Zaccardelli, M.; Ronga, D.; Celano, G. Compost tea on tomato increases yield and improves quality. Inf. Agrar. 2012, 7, 43. [Google Scholar]
- Pane, C.; Palese, A.M.; Spaccini, R.; Piccolo, A.; Celano, G.; Zaccardelli, M. Enhancing sustainability of a processing tomato cultivation system by using bioactive compost teas. Sci. Hortic. 2016, 202, 117–124. [Google Scholar] [CrossRef]
- Durmus, M.; Kızılkaya, R. The effect of tomato waste compost on yield of tomato and some biological properties of soil. Agronomy 2022, 12, 1253. [Google Scholar] [CrossRef]
- López-Martín, J.J.; Morales-Corts, M.R.; Pérez-Sánchez, R.; Gómez-Sánchez, M.A. Efficiency of garden waste compost teas on potato growth and its suppressiveness against Rhizoctonia. Agric. For. 2018, 64, 7–14. [Google Scholar]
- Zaccardelli, M.; Pane, C.; Villecco, D.; Palese, A.M.; Celano, G. Compost tea spraying increases yield performance of pepper (Capsicum annuum L.) grown in greenhouse under organic farming system. Ital. J. Agron. 2018, 13, 229–234. [Google Scholar] [CrossRef]
- Villecco, D.; Pane, C.; Ronga, D.; Zaccardelli, M. Enhancing sustainability of tomato, pepper and melon nursery production systems by using compost tea spray applications. Agronomy 2020, 10, 1336. [Google Scholar] [CrossRef]
- Cagliani, L.R.; Scano, P.; Consonni, R. Metabolomica basata sulla risonanza magnetica mobile: Qualità e autenticità degli alimenti di origine vegetale. In Risonanza Magnetica Moderna; Webb, G., Ed.; Springer: Cham, Switzerland, 2017. [Google Scholar]
- Razzaq, A.; Sadia, B.; Raza, A.; Khalid, H.M.; Saleem, F. Metabolomics: A Way Forward for Crop Improvement. Metabolites 2019, 9, 303. [Google Scholar] [CrossRef]
- Bundy, J.G.; Davey, M.P.; Viant, M.R. Environmental metabolomics: A critical review and future perspectives. Metabolomics 2009, 5, 3–21. [Google Scholar] [CrossRef]
- Kim, H.K.; Choi, Y.H.; Verpoorte, R. NMR-based plant metabolomics: Where do we stand, where do we go? Trends Biotechnol. 2011, 29, 267–275. [Google Scholar] [CrossRef] [PubMed]
- Mazzei, P.; Sica, A.; Migliaro, C.; Altieri, G.; Funicello, N.; De Pasquale, S.; Piccolo, A.; Celano, G. MRI and HR-MAS NMR spectroscopy to correlate structural characteristics and the metabolome of Fiano and Pallagrello grapes with the action of field spray preparation 500 and the soil spatial microvariability. Chem. Biol. Technol. Agric. 2024, 11, 131. [Google Scholar] [CrossRef]
- Osborne, B.G. Near-infrared spectroscopy in food analysis. In Encyclopedia of Analytical Chemistry; John Wiley & Sons, Ltd.: Hoboken, NJ, USA, 2006; pp. 1–14. [Google Scholar]
- Nagy, N.M.; Wang, S.; Farag, M.A. Quality analysis and authentication of nutraceuticals using near IR (NIR) spectroscopy: A comprehensive review of novel trends and applications. Trends Food Sci. Technol. 2022, 123, 290–309. [Google Scholar] [CrossRef]
- Squeo, G.; Cruz, J.; De Angelis, D.; Caponio, F.; Amigo, J.M. Considerations about the gap between research in near-infrared spectroscopy and official methods and recommendations of analysis in foods. Curr. Opin. Food Sci. 2024, 59, 101203. [Google Scholar] [CrossRef]
- Gamba, M.; Asllanaj, E.; Raguindin, P.F.; Glisic, M.; Franco, O.H.; Minder, B.; Busslerf, W.; Metzgerf, B.; Kern, H.; Muka, T. Nutritional and phytochemical characterization of radish (Raphanus sativus). Trends Food Sci. Technol. 2021, 113, 205–218. [Google Scholar] [CrossRef]
- Shin, T.; Ahn, M.; Kim, G.O.; Park, S.U. Biological activity of various radish species. Orient. Pharm. Exp. Med. 2015, 15, 105–111. [Google Scholar] [CrossRef]
- Cai, X.; Zhu, K.; Li, W.; Peng, Y.; Yi, Y.; Qiao, M.; Fu, Y. Characterization of flavor and taste profile of different radish (Raphanus Sativus L.) varieties by headspace-gas chromatography-ion mobility spectrometry (GC/IMS) and E-nose/tongue. Food Chem. X 2024, 22, 101419. [Google Scholar] [CrossRef]
- Baenas, N.; Piegholdt, S.; Schloesser, A.; Moreno, D.A.; Garcia-Viguera, C.; Rimbach, G.; Wagner, A.E. Metabolic activity of radish sprouts derived isothiocyanates in drosophila melanogaster. Int. J. Mol. Sci. 2016, 17, 251. [Google Scholar] [CrossRef]
- Caceres, A. Screening on antimicrobial activity of plant popular in Guatemala for the treatment of dermato mucosal diseases. J. Ethnopharmacol. 1987, 20, 223–237. [Google Scholar] [CrossRef]
- Shukla, S.; Chatterji, S.; Yadav, D.K.; Watal, G. Antimicrobial efficacy of Raphanus constituents of some Nigerian medicinal plants. Africa J. Biotechnol. 2011, 4, 685–688. [Google Scholar]
- Manivannan, A.; Kim, J.-H.; Kim, D.-S.; Lee, E.-S.; Lee, H.-E. Deciphering the nutraceutical potential of Raphanus sativus—A comprehensive overview. Nutrients 2019, 11, 402. [Google Scholar] [CrossRef]
- Ito, H.; Horie, H.; Ippoushi, K.; Azuma, K. Potential of Visible-Near Infrared (VIS-NIR) Spectroscopy for Non-destructive Estimation of Nitrate Content in Japanese Radishes. Acta Hortic. 2003, 604, 549–552. [Google Scholar] [CrossRef]
- Baliyan, S.; Mukherjee, R.; Priyadarshini, A.; Vibhuti, A.; Gupta, A.; Pandey, R.P.; Chang, C.M. Determination of Antioxidants by DPPH Radical Scavenging Activity and Quantitative Phytochemical Analysis of Ficus religiosa. Molecules 2022, 27, 1326. [Google Scholar] [CrossRef] [PubMed]
- Prior, R.L.; Wu, X.; Schaich, K. Standardized methods for the determination of antioxidant capacity and phenolics in foods and dietary supplements. J. Agric. Food Chem. 2005, 53, 4290–4302. [Google Scholar] [CrossRef] [PubMed]
- Brereton, R.G. Pattern recognition. In Chemometrics: Data Analysis for the Laboratory and Chemical Plant; John Wiley & Sons, Ltd.: Wiley, UK, 2003; pp. 183–249. [Google Scholar]
- Worley, B.; Powers, R. Multivariate Analysis in Metabolomics. Curr. Metabolomics 2013, 1, 92–107. [Google Scholar]
- Mazzei, P.; Vinale, F.; Lois Woo, S.; Pascale, A.; Lorito, M.; Piccolo, A. Metabolomics by Proton High Resolution Magic-Angle-Spinning Nuclear Magnetic Resonance of Tomato Plants Treated with Two Secondary Metabolites Isolated from Trichoderma. J. Agric. Food Chem. 2016, 64, 3538–3545. [Google Scholar] [CrossRef] [PubMed]
- Rashmi, H.B.; Negi, P.S. Phenolic acids from vegetables: A review on processing stability and health benefits. Food Res. Int. 2020, 136, 109298. [Google Scholar] [CrossRef]
- Baek, S.-A.; Jung, Y.-H.; Lim, S.H.; Park, S.U.; Kim, J.K. Metabolic Profiling in Chinese Cabbage (Brassica rapa L. subsp. pekinensis) Cultivars Reveals that Glucosinolate Content Is Correlated with Carotenoid Content. J. Agric. Food Chem. 2016, 64, 4189–4434. [Google Scholar] [CrossRef]
- Vidana Gamage, D.N.; Peiris, T.; Kasthuriarachchi, I.; Mohotti, K.M.; Biswas, A. Enhancing Soil Resilience to Climate Change: Long-Term Effects of Organic Amendments on Soil Thermal and Physical Properties in Tea-Cultivated Ultisols. Sustainability 2025, 17, 1184. [Google Scholar] [CrossRef]
- Krahmer, A.; Bottcher, C.; Gudi, G.; Stürtz, M.; Schulz, H. Application of ATR-FTIR spectroscopy for profiling non-structural carbohydrates in onion bulbs (Allium cepa L.). Food Chem. 2021, 360, 129978. [Google Scholar] [CrossRef] [PubMed]
- Pranantoa, J.A.; Minasnya, B.; Weaverb, T. Near-infrared spectroscopy (NIR) as a rapid and cost-effective method for nutrient analysis in leaf tissues of plants. Adv. Agric. 2020, 164, 1–49. [Google Scholar]
- Suzuki, M.; Kusano, M.; Takahashi, H.; Nakamura, Y.; Hayashi, N.; Kobayashi, M.; Ichikawa, T.; Matsui, M.; Hirochika, H.; Saito, K. Screening di linee FOX di riso-arabidopsis lines with FT-NIR based fingerprinting for metabolite profiling using GC-TOF/MS”. Metabolomics 2010, 6, 137–145. [Google Scholar] [CrossRef]
- Baqueta, M.R.; Coqueiro, A.; Março, P.H.; Mandrone, M.; Poli, F.; Valderrama, P. Integrated 1H NMR fingerprint with NIR spectroscopy, sensory properties, and quality parameters in a multi-block data analysis using ComDim to evaluate coffee blends. Food Chem. 2021, 355, 129618. [Google Scholar] [CrossRef]

Disclaimer/Publisher’s Note: The statements, opinions and data contained in all publications are solely those of the individual author(s) and contributor(s) and not of MDPI and/or the editor(s). MDPI and/or the editor(s) disclaim responsibility for any injury to people or property resulting from any ideas, methods, instructions or products referred to in the content. |
© 2025 by the authors. Licensee MDPI, Basel, Switzerland. This article is an open access article distributed under the terms and conditions of the Creative Commons Attribution (CC BY) license (https://creativecommons.org/licenses/by/4.0/).