Article

The Effects of Increasing Boron on Growth, Yield, and Nutritional Value of Scallion (Allium cepa L.) Grown as a Bunch Harvest

1
Department of Crop and Animal Production, Izmit Vocational School, Kocaeli University, Kocaeli 41285, Türkiye
2
Department of Soil Science and Plant Nutrition, Faculty of Agriculture, Çanakkale Onsekiz Mart University, Çanakkale 17100, Türkiye
*
Author to whom correspondence should be addressed.
Horticulturae 2025, 11(5), 450; https://doi.org/10.3390/horticulturae11050450
Submission received: 18 March 2025 / Revised: 18 April 2025 / Accepted: 19 April 2025 / Published: 22 April 2025
(This article belongs to the Special Issue Biotic and Abiotic Stress Responses of Horticultural Plants)

Abstract

:
Scallions are a highly valued leafy vegetable and are enjoyed worldwide due to their appealing taste and nutritional benefits. A combination of short cultivation cycles and high market demand not only enhances food security but also offers a profitable opportunity for growers. In our study, we aim to evaluate the effect of increasing boron (B) applications, specifically 0, 0.2, 0.4, 0.8, 1.2, and 1.6 mM B supplied as boric acid (H3BO3) in the nutrient solution, on several key physiological and agronomic parameters in scallions. Results showed that the effects of increasing B levels on biomass production were insignificant, but the root fresh weight (FW) significantly decreased with all B levels. Higher B levels (1.2 and 1.6 mM) caused decreases of 22.9% and 29.6%, respectively. The effects of all B levels on photosynthetic pigment contents [chlorophyll (Chl) a, b, a + b, and carotenoid (Car)], root and shoot membrane permeability (MP), and root, shoot, and leaf nutritional status [phosphorus (P), potassium (K), calcium (Ca), and sodium (Na) concentrations] were found insignificantly. However, all B levels caused a significant increase in the B concentrations of the root, shoot, and leaf of scallions and plants translocated the majority of applied B into their leaves. The translocation factor (TF) of B from the root to the leaf was found to be 138.2%, 133.3%, and 107.3% with 0.8, 1.2, and 1.6 mM B levels, respectively. Moreover, plants exposed to high levels of B showed no significant response or toxicity symptoms. We concluded that B is a phloem mobile element in onion, a non-graminaceous monocotyledonous plant, and therefore accumulates in the upper organs but illustrates partial toxicity symptoms in leaves. Studies with higher B concentrations could be recommended to determine critical B levels for green onion production in B-contaminated areas.

1. Introduction

Although it has been known for nearly a century that boron (B) is an essential micronutrient for plants, its role in plant metabolism can still not be clearly defined. Recent studies show that B plays important roles mainly in synthesizing the cell wall and maintaining its structure and integrity. The amount of B in the cell wall may vary depending on the species of plant, its organs, and the amount of B in the growing medium [1]. Although there are differences between species, plants grown in soils containing extractable B in hot water, generally above 5 mg kg−1, could exhibit toxicity symptoms [2]. The toxicity mechanism of B is not clear yet; however, it has been suggested that toxicity may be related to the B forms in plants and that soluble B is more effective than total B [3].
The absorbed B by roots, as boric acid (H3BO3) or a small amount of borate (H3BO4), can reach all cells by easily moving through lipid bilayers due to its characteristic feature (a small, water-soluble, un-dissociated, and uncharged molecule). Both B compounds tend to complex easily with different sugars and other compounds with cis-hydroxyl groups [4] that are primarily involved in the formation of cell walls. It forms di-ester bridges between two RG-II molecules and cross-links cell wall pectin. The RG-II-pectins are major B-binding fractions and they influence cell wall porosity and plant morphogenesis [5]. Information on how plants localize B to RG-II is still limited [6], but it is believed that as a result of an abnormal decrease in the amount of this cross-linking, there may be a decrease in intercellular binding, causing stunting in plants [7,8]. The main dimerization reaction involved in the B-bridging of RG-II is illustrated in Figure 1. Briefly, two monomeric neutral apiose residues (RG-II molecules), which resist the electrostatic repulsion important for B-bridging, approach each other, and a dimeric RG-II is formed. This dimerization reaction introduces an additional negative charge onto the previously neutral B atom, and three molecules of water and a positive charge are also released.
The dimeric RG-II is often associated with upright growth, and it has been observed that a higher concentration of borate-cross-linked RG-II in cell walls has contributed to the evolution of lignified secondary walls in higher plants [8]. One of the important functions of B in plants is to form a covalent bridge [RG-II–(B−)–RG-II] between pectin molecules [7]. These bridges can reduce cell wall porosity [10]. It is accepted that species with high cell wall pectin content, such as onion, require more B for cell wall construction than other species and that pectin in the cell wall forms an insoluble complex with B, thus reducing the toxic effect of B [11].
Generally, B is known to be immobile in the phloem in most plant species. However, researchers have reported that B is mobile in some species that use polyols (simple sugars) as primary photosynthetic metabolites and can then transport B to active accumulation sites in the phloem, e.g., vegetative or reproductive organs [12].
Some plant species’ ability to move B around depends on how it binds to polyols (sugar alcohols), which are the main byproduct of photosynthesis. Brown and Hu [13] found that a polyol–B–polyol complex is made in the leaves of these species and moved to the active sites by the phloem. It is significantly mobile in species where polyols (e.g., sorbitol, mannitol, etc.) are the primary products of photosynthesis. These species include onions, celery, carrots, olives, beans, peas, and cauliflower [14].
Onion is among the non-graminaceous monocots, like asparagus, and unlike other monocots, it has pectin-rich cell walls [15,16]. Therefore, the tissue B requirements of species such as onion are equal to those of dicotyledonous species. However, some species, such as asparagus, have higher tissue B requirements than dicotyledonous species [17]. B plays a crucial functional role in the formation of pectic networks within the plant cell wall, primarily through its interaction with rhamnogalacturonan II (RG-II), a pectic polysaccharide. This cross-linking contributes to the structural integrity and porosity of the cell wall, thereby enhancing its extensibility [6]. Such extensibility is crucial for cell wall loosening, a process that enables cell expansion and promotes overall plant growth. Consequently, B is not only vital for maintaining cell wall architecture but also acts as a key regulator of plant developmental processes by influencing cell elongation and tissue differentiation [18].
Scallions are one of the most important leafy vegetables and are widely cultivated in various climatic conditions, both in fields and greenhouses, for bunch consumption [19]. They also provide significant profits to producers due to their ease of vegetative propagation, short growth cycle, tolerance to abiotic stress conditions, and longer shelf life [20]. However, research on this widely produced and consumed crop remains limited, which is why this study was planned.
We aim to identify the critical B concentrations that may induce stress in scallions in this study. In addition, our aim is to enhance the understanding of plant nutrition by investigating the mechanisms of B transport and accumulation, ultimately supporting the development of more effective agricultural practices and environmental management strategies.

2. Materials and Methods

2.1. Experimental Design

We performed this study in a semi-controlled climate room with a temperature of 24 ± 3 °C and a humidity of 50 ± 15 percent in the summer. We used small bulbs (Allium cepa L. var. Kartopu) purchased from the local seed market, with a 1.5–2.0 cm diameter. We compacted the perlite-filled plastic pots well with a volume of 1.5 L, and equalized their weights. We saturated the pots with distilled water and allowed them to flow freely under the influence of gravity for 24 h. After draining the excess water, we weighed them to determine the approximate amount of solution. We planted the tiny bulbs in an inert medium (sterile perlite) with three plants per pot. To ensure a gradual acclimation of the test plants to the nutrient environment, we initially applied a quarter-strength and a half-strength modified Hoagland solution during the first week and the second week, respectively. By the third week, once the first true leaves of the plants had reached a length of 3–4 cm, we began applying the full-strength modified nutrient solution until the end of the study. Throughout the experiment, we monitored surface evaporation daily and added the lost water with the nutrient solution accordingly to maintain consistent moisture levels.
We applied to the related pots the B levels [0 (B-free), 0.2, 0.4, 0.8, 1.2, and 1.6 mM B (from H3BO3)] by mixing them with nutrient solution and approximately 50–100 mL of B-supplemented full-strength nutrient solution to the related pots daily, depending on their water consumption.
The modified Hoagland solution contains 5 mM calcium nitrate tetrahydrate [Ca(NO3)2 × 4H2O], 5 mM potassium nitrate (KNO3), 2 mM magnesium sulfate heptahydrate (MgSO4 × 7H2O), 1 mM potassium di-hydrogen phosphate (KH2PO4), 44.7 µM iron sulfate heptahydrate (FeSO4 × 7H2O), 30 µM sodium chloride (NaCl), 9.1 µM manganese sulfate monohydrate (MnSO4 × H2O), 0.77 µM zinc sulfate heptahydrate (ZnSO4 × 7H2O), 0.32 µM copper sulfate pentahydrate (CuSO4 × 5H2O), 0.10 µM ammonium molybdate tetrahydrate [(NH4)2Mo7O24 × 4H2O], and 54.8 µM disodium EDTA dihydrate (Na2EDTA × 2H2O) [21]. We adjusted the pH of the medium to 6.0–6.5 during the experimental period.

2.2. Sampling and Harvest of Plants

After 54 days, we harvested the green onions and separated them into roots, shoots, and leaves. We weighed all parts for fresh biomass. Then, to remove any particles that might have adhered to the plant surfaces, we washed these parts under running tap water and rinsed them three times with deionized water. We dried all samples in an air-pressurized oven at 70 °C until a constant mass was obtained. We weighed the dried samples to determine their DW and ground them into powder for ion analysis.

2.3. Determination of Photosynthetic Pigments

Before harvest, for photosynthetic pigment analysis in healthy, fresh leaves, we extracted 250 mg of fresh leaf samples in 10 mL of acetone (90% v/v) with a homogenizer and filtered the extract. Then, we measured the absorbance of the extract at 663, 645, and 470 nm using a spectrophotometer (UV-1201, Shimadzu, Kyoto, Japan) as described by Lichtenthaler [22].

2.4. Determination of Membrane Damage

We measured the MP in fresh leaves using the electrical conductivity (EC, %) method as described by Yan et al. [23]. For this purpose, just before the harvest, we washed leaves and then took out a standard sample using a disc, cut it into 1 cm pieces, and placed it in a beaker containing 10 mL of deionized water. We immersed the leaf samples at 30 °C for 3 h, and then we measured the EC of the solution. After boiling the samples for 2 min, we measured their conductivity again when the solution was cooled to room temperature. We calculated the percentage of MP as follows:
MP (EC, %) = C1/C2 × 100
where C1 and C2 are the electrolyte conductivities measured before and after boiling, respectively.

2.5. Determination of Nutrient Ion Concentrations

We determined nutrient ion concentrations using the dry-ashed method. For this purpose, 500 mg of each of the shoot and root samples was dry-ashed in a muffle furnace at 500 °C for 6 h, and then the cooled ash was dissolved in a 10 N nitric acid (HNO3) solution [24]. The B and phosphorus (P) concentrations were measured using a spectrophotometer (Shimadzu UV-1201, Kyoto, Japan). The potassium (K), calcium (Ca), and sodium (Na) concentrations were analyzed using a flame photometer.

2.6. Determination of Bio-Concentration, Translocation, and Accumulation

The bio-concentration factor (BCF) is the ratio of ions in plant organs (root, shoot, or leaf) to the ion concentration in the nutrient solution and was calculated according to the formulation of Equation (1). The translocation factor (TF) is the ratio of ion concentrations in the shoots or leaves to those at the roots, and the net accumulation (NA) of ions is the rate of total ion amounts in the whole plant to dry biomass in the roots and they were calculated using the formulation of Equations (2) and (3), respectively [25]
BCF of ion = [ion]root, shoot, or leaf/[ion]nutrient solution
TF of ion = [ion]shoot or leaf/[ion]nutrient solution
NA of ion via roots (mg kg−1 dry biomass) = [ion]shoot or leaf/dry biomass root
where [ion]shoot/root/leaf is the ion concentration in shoots, roots, or leaves; [ion]nutrient solution is the ion concentration in the nutrient solution; dry biomassroot is the dry biomass of roots.

2.7. Statistical Analysis

We carried out this study in three replications according to the randomized plot design. We evaluated the normality of the data distribution using the Shapiro–Wilk test, and according to the test results, we performed the statistical analysis of the experimental data using ANOVA with the MINITAB (version 16) package program. We also used the Pearson correlation coefficient (r) test to show the correlations among all parameters in the root, shoot, and leaves of scallions. We analyzed the multiple comparisons of means among B levels using Tukey’s honestly significant difference (HSD) at the significance level (α: 0.05). We showed the significance levels as (*) p < 0.050, (**) p < 0.010, (***) p < 0.001, and (ns) not significant.

3. Results

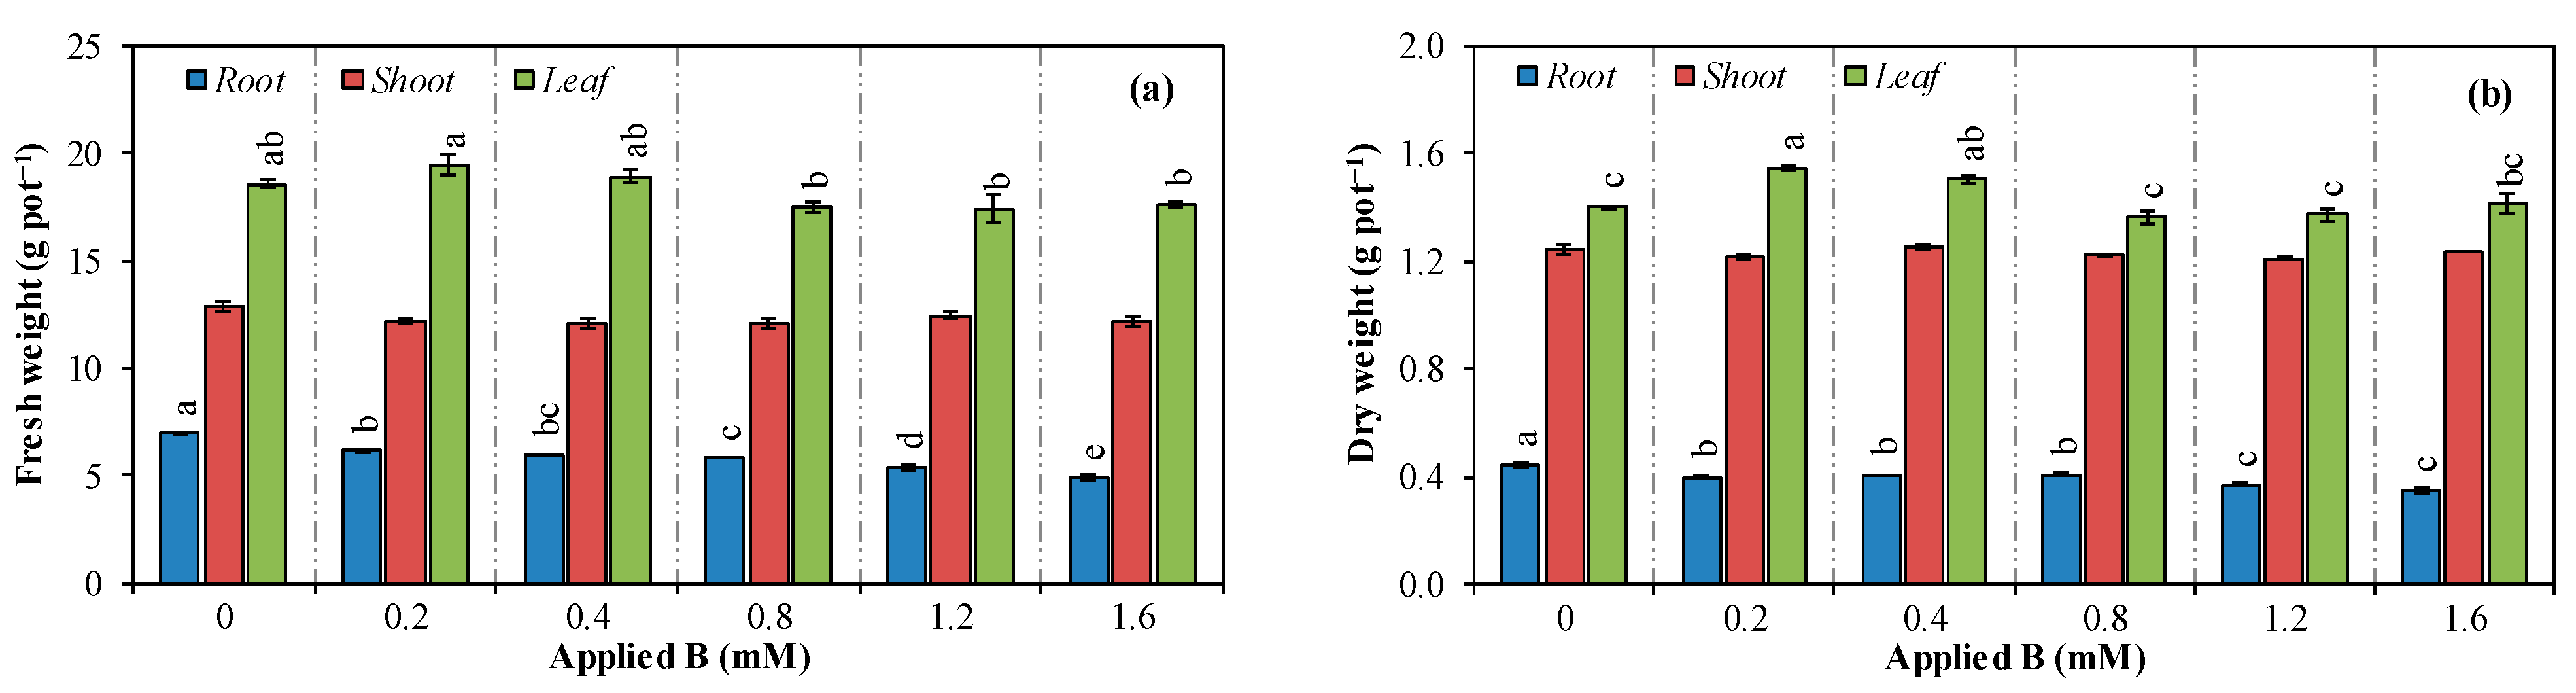
3.1. Vegetative Growth

All B applications had a significant influence on the FW and DW of roots and shoots, but they had a non-significant influence on the FWs and DWs of shoots (Figure 2). Compared to the control, the FW of roots decreased with all B levels (0.2, 0.4, 0.8, 1.2, and 1.6 mM) by 12.0%, 14.4%, 16.4%, 22.9%, and 29.6%, respectively. The FW of shoots showed a declining tendency with all B applications. In addition, the FW of leaves decreased by 5.7%, 6.0%, and 5.0%, respectively, with high B levels (0.8, 1.2, and 1.6 mM) in contrast to low B levels (Figure 2a). On the other hand, the DW of roots decreased at 0.2, 0.4, 0.8, 1.2, and 1.6 mM B levels by 10.1%, 8.1%, 7.9%, 16.7%, and 22.4%, respectively. Decreases in the DW of shoots were non-significant. We observed that the DW of leaves significantly increased with low B applications (0.2 and 0.4 mM) by 10.1% and 7.4%, respectively; however, there were non-significant changes with high B applications (Figure 2b).

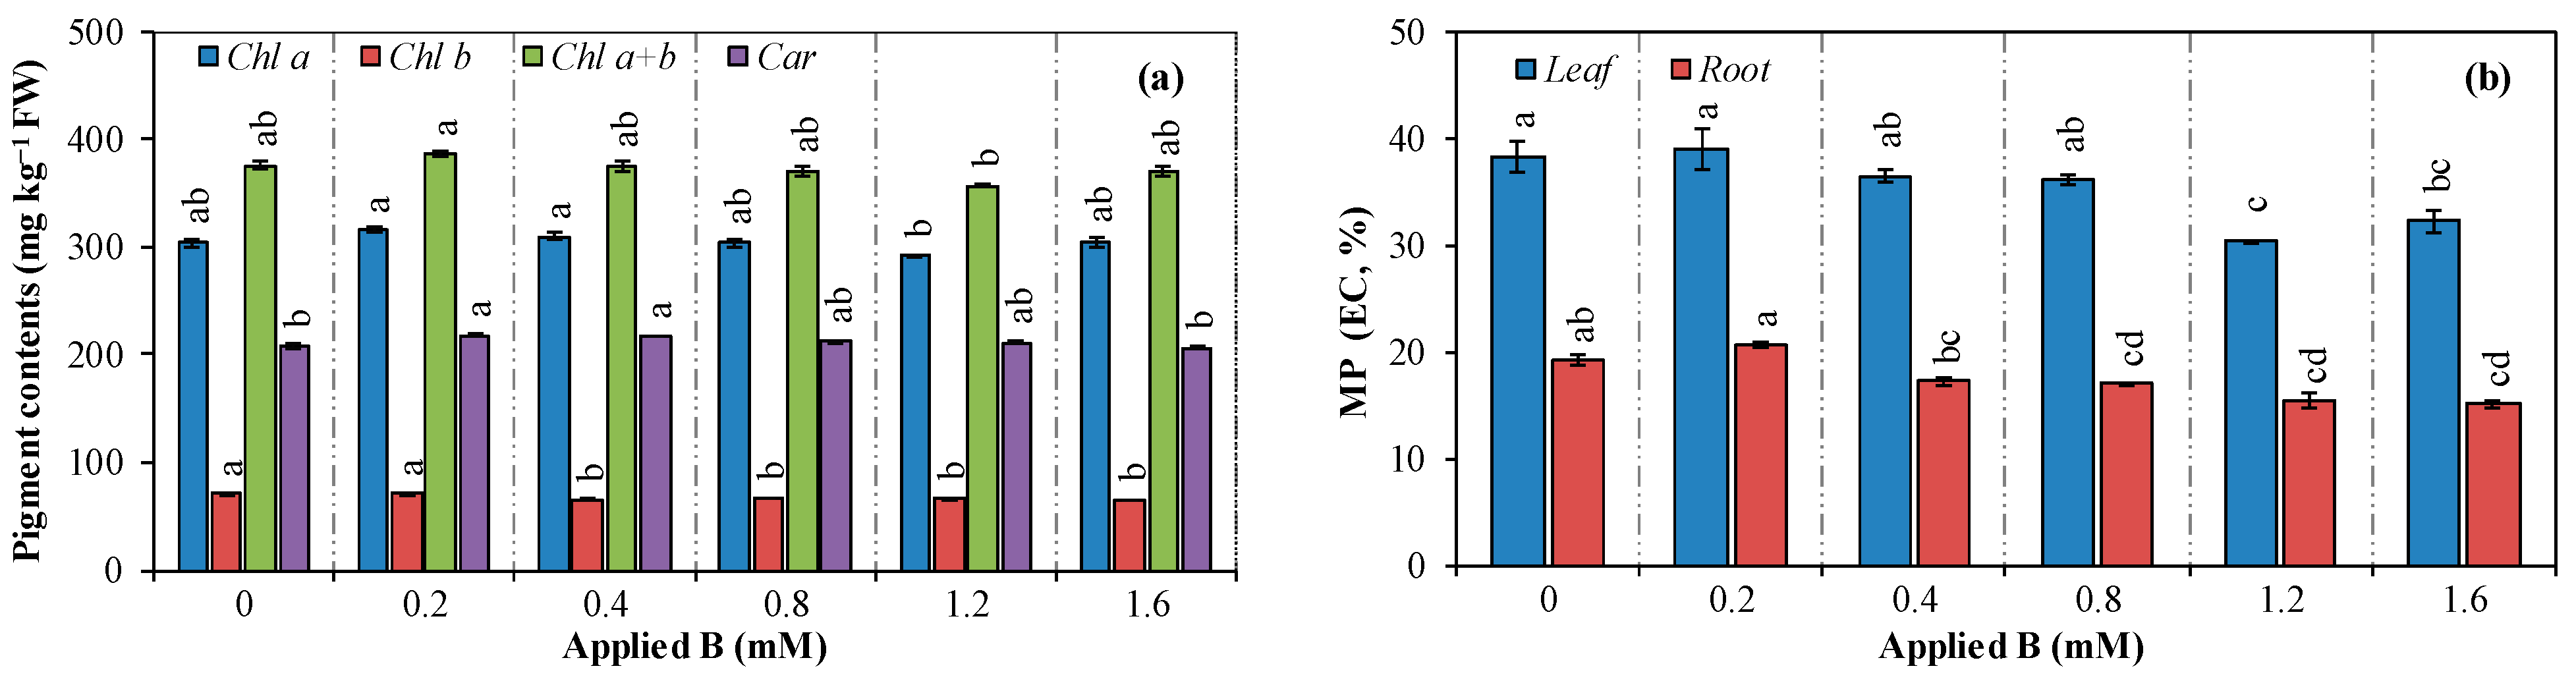
3.2. Photosynthetic Pigment Contents and Membrane Permeability

In scallion, while the B applications did not significantly affect the content of Chl a and Chl a + b, the 0.4, 0.8, 1.2, and 1.6 mM B applications caused notable decreases in Chl b contents by 8.3%, 6.2%, 5.9%, and 8.1%, respectively. In addition, low B applications (0.2 and 0.4 mM) significantly increased the Car contents by 5.1% and 4.6%, respectively (Figure 3a).
On the other hand, the root MP value significantly decreased with the 1.2 and 1.6 mM B levels by 20.6% and 15.8%, respectively. Similarly, the shoot MP value considerably decreased with 0.8, 1.2, and 1.6 mM B levels by 11.5%, 19.8%, and 21.5%, respectively (Figure 3b).

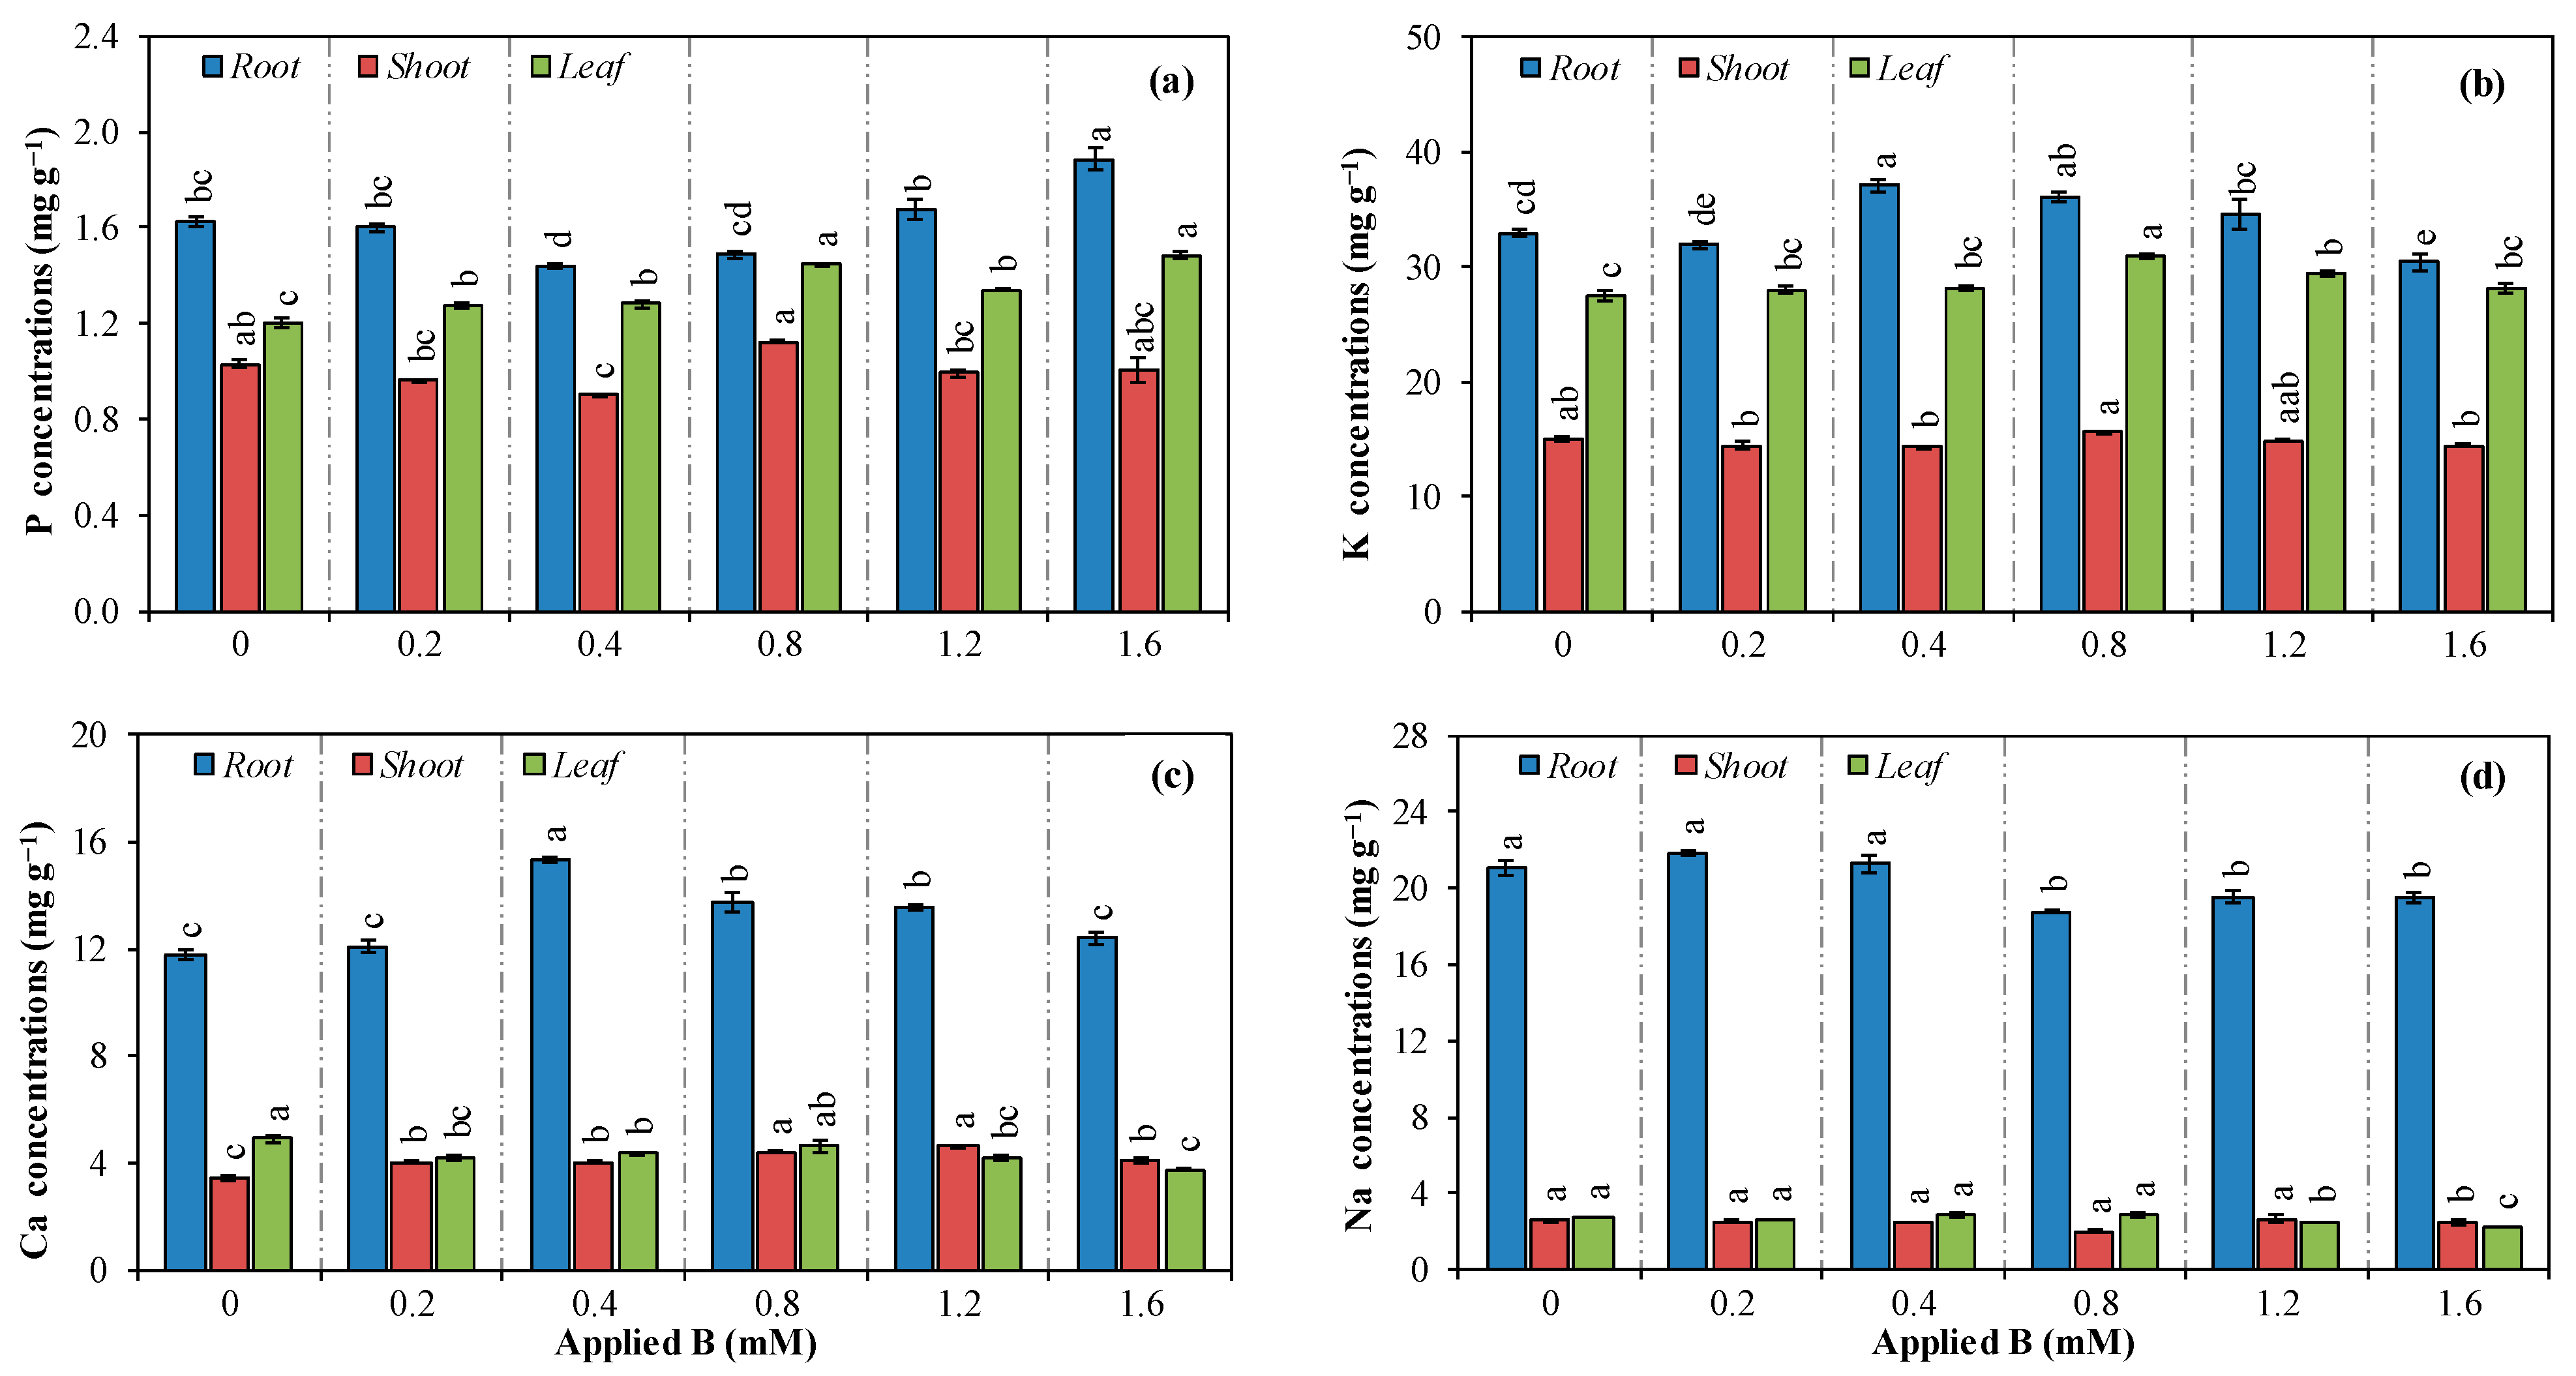
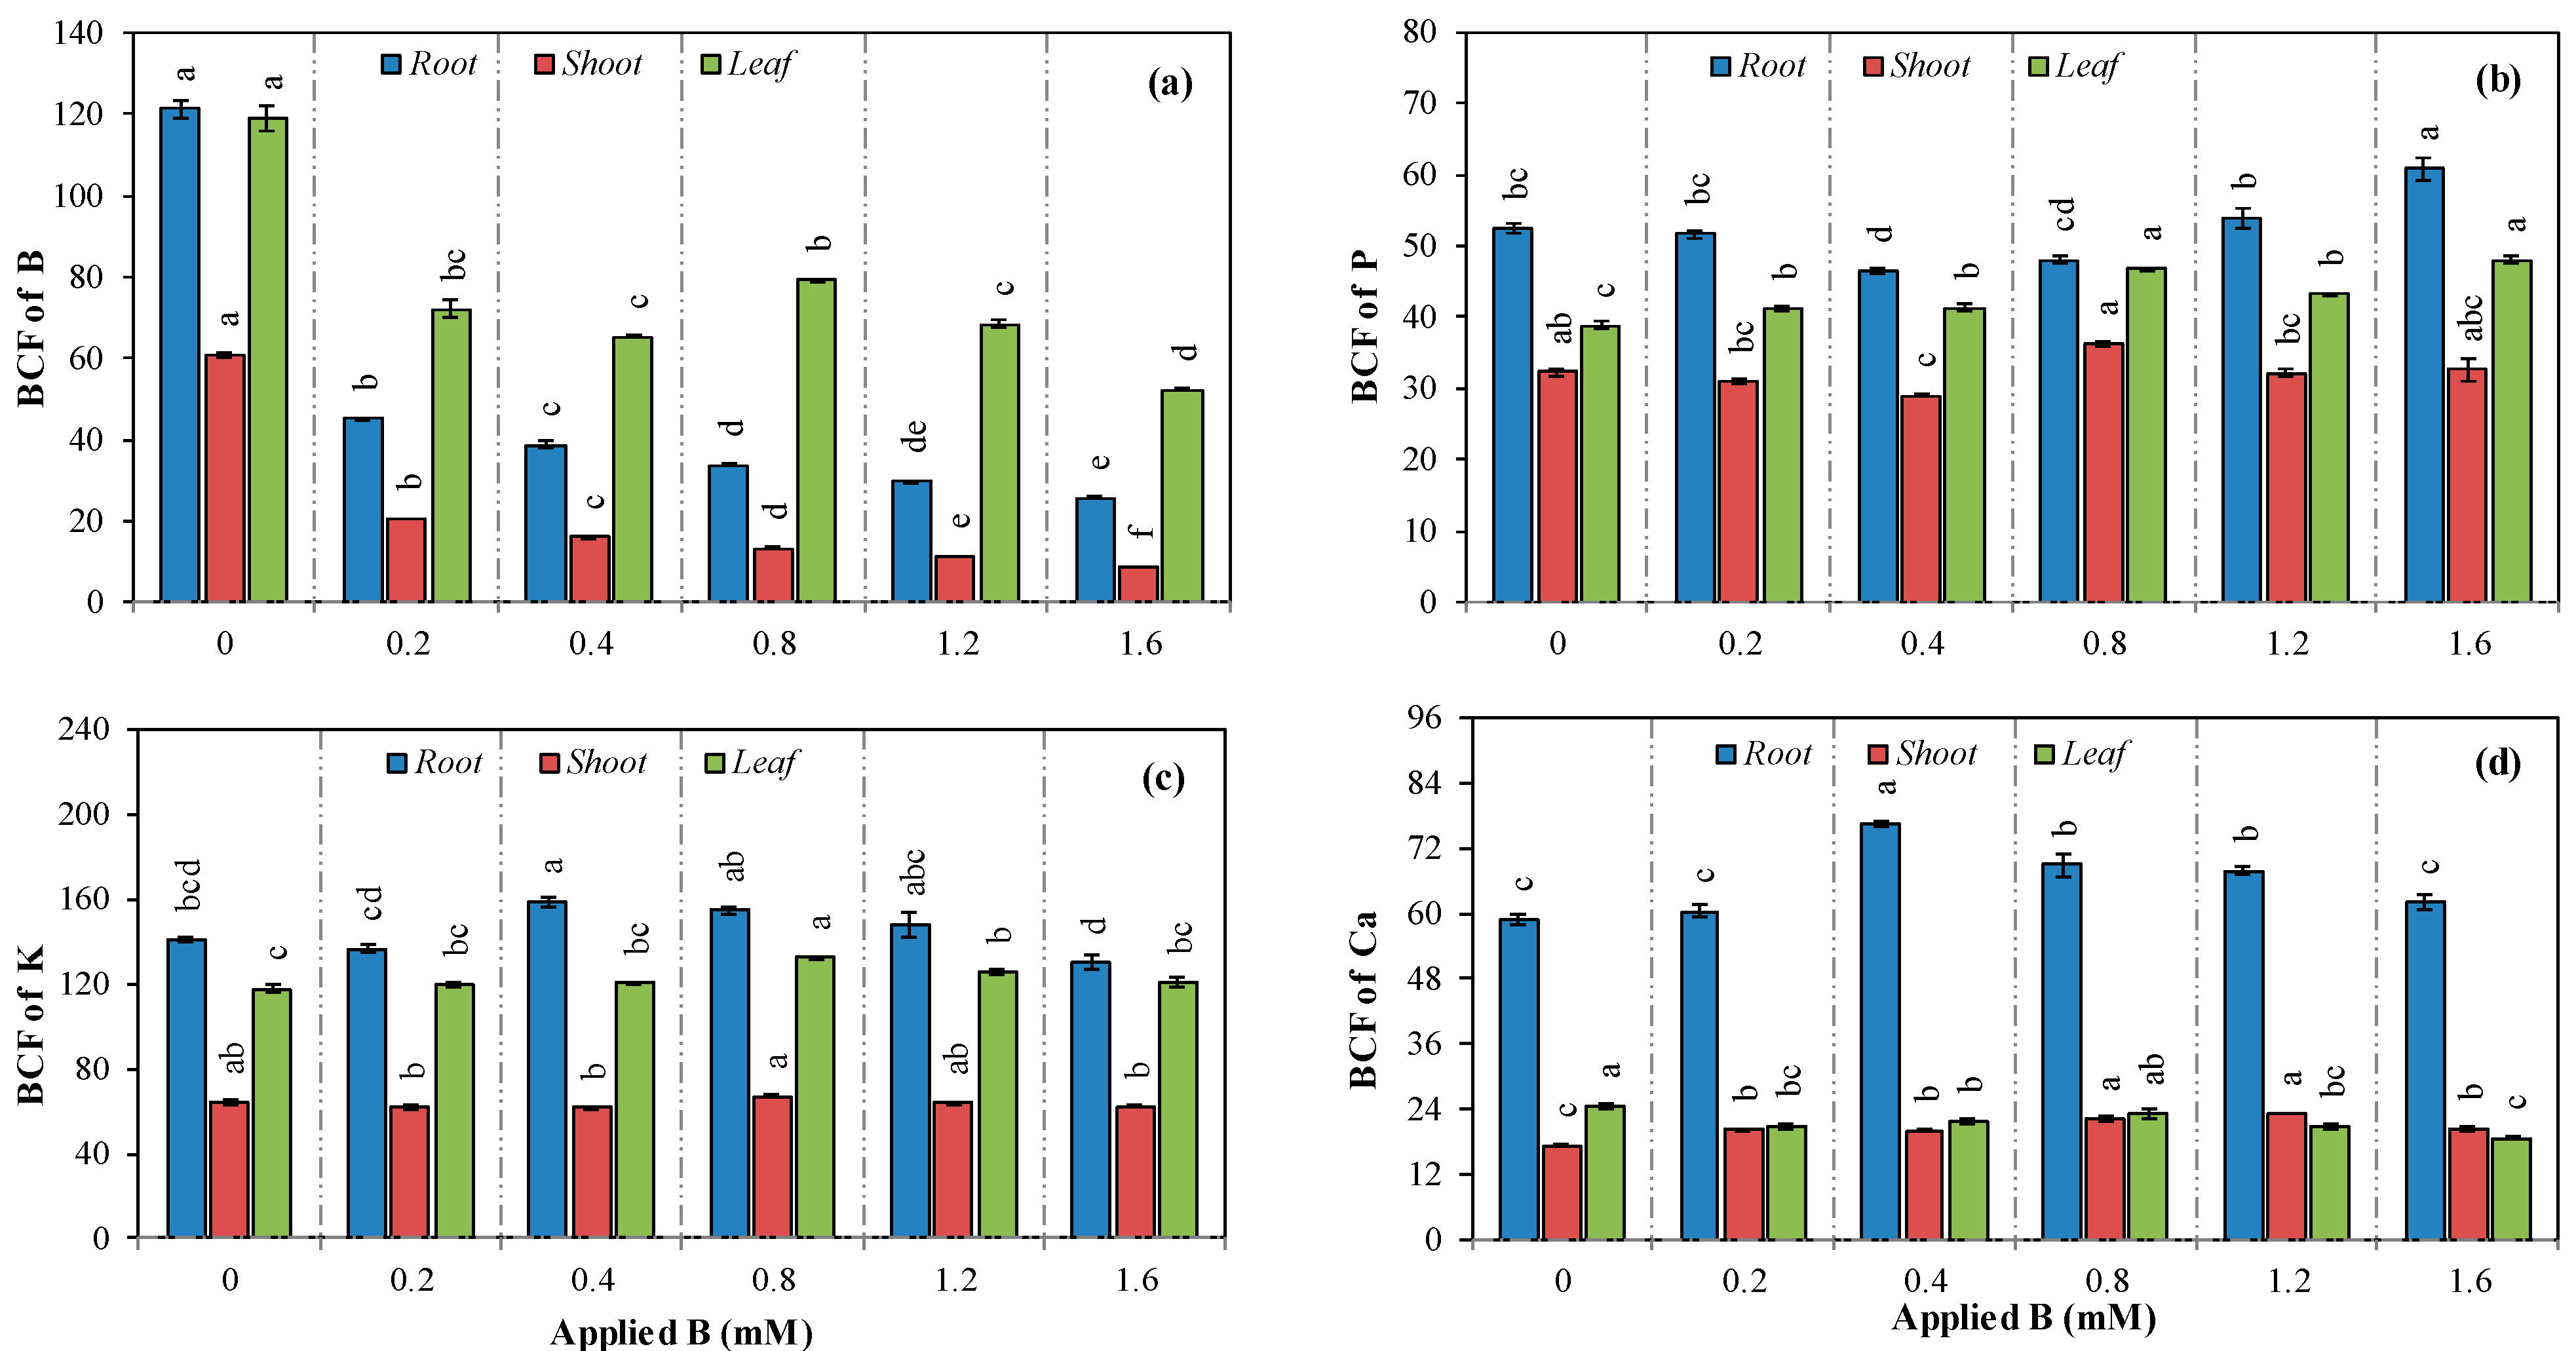
3.3. Concentration, Translocation, and Accumulation of Nutrients

Applied B levels significantly affected the B concentrations in roots, shoots, and leaves, as well as the TF value of B (Table 1). In comparison with control, all B levels (0.2, 0.4, 0.8, 1.2, and 1.6 mM) caused a notable increase in the root B concentrations by 2.0-, 3.1-, 5.2-, 6.7-, and 7.6-fold, respectively. Furthermore, all B applications significantly increased the shoot B concentrations by 1.8-, 2.6-, 4.1-, 5.1-, and 5.2-fold, respectively. Similarly, these B applications significantly increased the leaf B concentrations by 3.3-, 5.4-, 12.4-, 15.7-, and 15.9-fold, respectively (Table 1). The B concentrations in plant parts, in descending order, were as follows: leaves < shoots < roots. In addition, all B applications (0.2, 0.4, 0.8, 1.2, and 1.6 mM) caused a significant decrease in the TF of B (root to shoot) by 9.2%, 17.9%, 21.3%, 24.5%, and 32.3%, respectively. However, these B levels caused a considerable increase in the TF of B (root to leaf) by 62.7%, 71.2%, 138.2%, 133.8%, and 107.3%, respectively (Table 1).
Applied B levels significantly affected the leaves’ P, K, Ca, and Na concentrations (Figure 4). The P concentration in roots significantly decreased with 0.4 mM B application by 11.1% but increased with 1.6 mM B application by 16.7% compared to the control. Similarly, the P concentration in shoots markedly decreased with 0.4 mM B application by 12.6%, while other B applications had insignificant effects. Furthermore, 0.2, 0.4, 0.8, 1.2, and 1.6 mM B applications caused a notable increase in the P concentrations in leaves by 6.7%, 6.7%, 20.8%, 11.7%, and 24.2%, respectively (Figure 4a).
The K concentration in roots significantly increased with 0.4 and 0.8 mM B levels by 12.6% and 9.7%, respectively; however, it significantly decreased with a 1.6 mM B application by 7.7% compared to the control. While the K concentration in shoots was not affected by B applications, the K concentration in leaves markedly increased with 0.8 and 1.2 mM B applications by 12.3% and 6.6%, respectively, compared to the control (Figure 4b).
On the other hand, the Ca concentration in roots considerably increased at 0.4, 0.8, and 1.2 mM B levels by 30.3%, 17.1%, and 15.4%, respectively. The Ca concentration in shoots also significantly increased with 0.2, 0.4, 0.8, 1.2, and 1.6 mM B applications by 16.4%, 16.1%, 27.4%, 33.4%, and 17.6%, respectively. However, the Ca concentration in leaves remarkably decreased with 0.2, 0.4, 1.2, and 1.6 mM B applications by 14.3%, 11.2%, 14.5%, and 23.5%, respectively (Figure 4c).
The Na concentration in roots decreased with higher B levels (0.8, 1.2, and 1.6 mM) by 10.8%, 7.1%, and 7.4%, respectively, compared to the control. The Na concentration in shoots significantly decreased at only 1.6 mM B applications by 20.3%, and the Na concentration in leaves significantly decreased with the 1.2 and 1.6 mM B applications by 7.7%, and 15.1%, respectively (Figure 4d).
We found a significant interaction between B applications and the TF of ions (P, K, Ca, and Na) (Table 2). While the 0.8 mM B application caused a notable increase in TF of P from root to shoot by 19.2%, the 1.6 mM B application caused a notable decrease in this parameter by 15.6%, compared to the control. In addition, the 0.4 and 0.8 mM B applications significantly increased the TF of P from root to leaf by 20.4% and 31.8%, respectively.
While the 0.4 mM B application caused a notable decrease in the TF of K from root to shoot by 14.7%, the 1.6 mM B application caused a notable increase in the TF of K from root to leaf by 11.0%, compared to the control.
The 0.2, 1.2, and 1.6 mM B applications significantly increased the TF of Ca from root to shoot by 13.2%, 15.6%, and 11.5%, respectively, compared to the control. However, the 0.4 mM B level caused a significant reduction in the TF of Ca from root to shoot of 10.8%. Furthermore, the 0.2, 0.4, 0.8, 1.2, and 1.6 mM B levels caused a notable decrease in the TF of Ca from root to leaf by 16.5%, 31.9%, 19.2%, 25.9%, and 27.6%, respectively (Table 2).
The 0.2, 0.4, 0.8, 1.2, and 1.6 mM B applications significantly affected the BCF of B, P, K, and Ca in roots, shoots, and leaves compared to the control (Figure 5). All B applications (0.2, 0.4, 0.8, 1.2, and 1.6 mM) caused notable decreases in BCF of B in roots, shoots, and leaves. These decreases in roots were 62.9%, 68.1%, 72.1%, 75.5%, and 78.9%, respectively. In addition, the reductions in shoots were 66.3%, 73.9%, 78.2%, and 81.4%, respectively. Similarly, in leaves, they were 85.7%, 39.5%, 45.3%, 35.5%, 42.6%, and 56.1%, respectively (Figure 5a).
The 0.4 mM B application significantly decreased the BCF of P in roots and roots by 11.5% and 9.9%, respectively. However, the 1.6 mM B level increased this parameter by 16.2% in roots. Similarly, 0.8 mM B caused an increase in BCF of P in shoots by 12.7%, compared to the control. On the other hand, all B applications (0.2, 0.4, 0.8, 1.2, and 1.6 mM) significantly increased the BCF of P in leaves by 6.2%, 6.4%, 20.4%, 11.3%, and 23.5%, respectively (Figure 5b).
The 0.4 mM of B application caused a notable increase in the BCF of K in roots by 12.8%. In addition, 0.8 and 1.2 mM B applications caused a notable increase in the BCF of K in leaves by 6.8% and 6.8%, respectively. However, the effects of B applications on the BCF of K in shoots were non-significant (Figure 5c).
On the other hand, the 0.4, 0.8, and 1.2 mM B applications caused a considerable increase in the BCF of Ca in roots by 30.3%, 17.2%, and 15.3%, respectively. However, the 0.2, 0.4, 1.2, and 1.6 mM B applications caused a considerable decrease in the BCF of Ca in leaves by 14.3%, 11.0%, 14.3%, and 23.7%, respectively (Figure 5d).
All B applications (0.2, 0.4, 0.8, 1.2, and 1.6 mM B) caused a considerable increase in the net accumulations of B, K, and Ca via roots compared to the control (Table 3). These increases in the net accumulation of B were 3.1-, 4.8-, 9.3-, 13.1-, and 14.5-fold, respectively. The increases in the net accumulations of K were 14.2%, 14.6%, 14.8%, 18.9%, and 21.0%, respectively. In addition, the increases in the net accumulation of Ca were 10.2%, 18.6%, 14.8%, 19.9%, and 13.8%, respectively.
On the other hand, only high B applications (0.8, 1.2, and 1.6 mM) caused a notable increase in the net accumulations of P by 16.5%, 19.2%, and 38.3%, respectively. The B applications did not significantly affect the net accumulation of Na (Table 3).

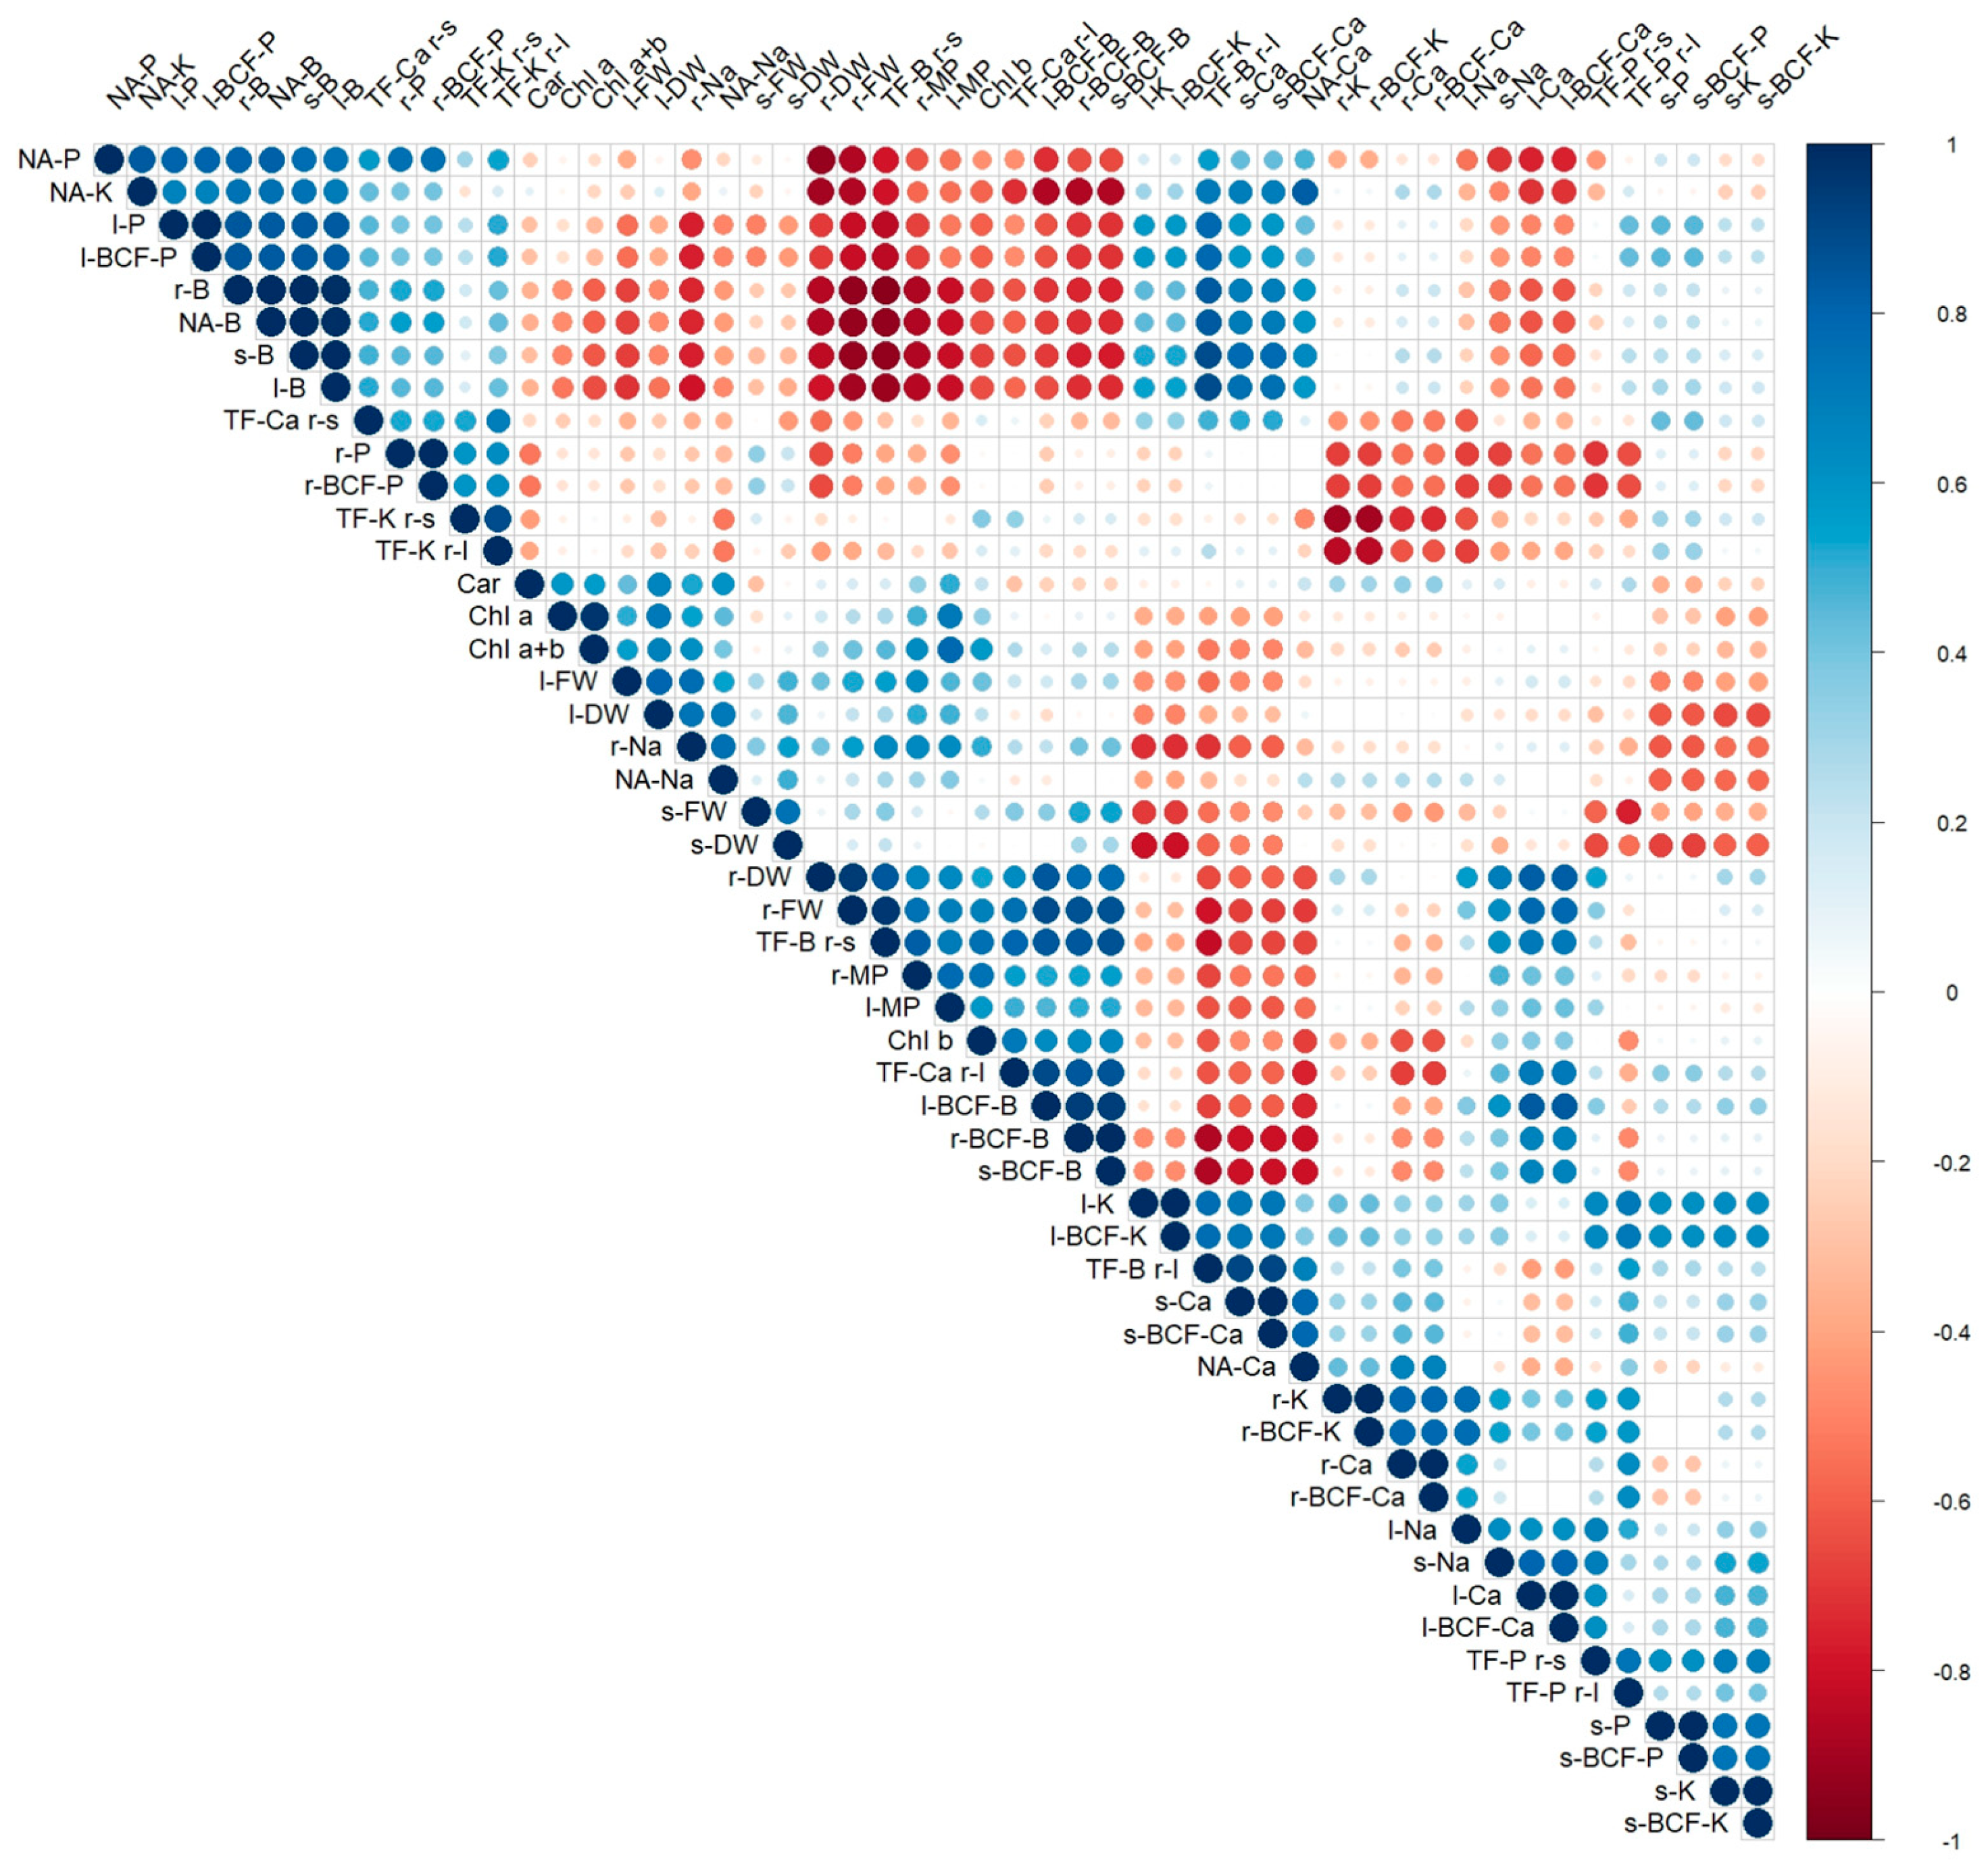
3.4. Correlation Analysis

Evaluations based on plant biomass production, photosynthetic pigment contents, and B behaviors (translocation, concentration, and accumulation) determined variables showing statistically significant relationships. The data reveal that the root FW of scallion leaves exhibited a highly significant and negative correlation with the B concentrations in the root, shoot, and leaf tissues, as well as with net ion accumulations of B, P, Ca, and K. The correlation coefficients for these relationships ranged from 0.691 to 0.926, indicating a strong inverse relationship between root FW and the concentrations of these ions. In contrast, the root FW showed a notable positive correlation with the BCF of B in the root, shoot, and leaf, as well as with the MP values in both the root and leaf tissues. The correlation coefficients for these positive relationships ranged from 0.696 to 0.885 (Figure 6).

4. Discussion

Excessive B in the rooting medium negatively affects the physiological, biochemical, and metabolic functions of plants and may reduce yield and quality [26]. In our study, increasing B applications resulted in a significant reduction in both the FWs and DWs of the roots, whereas the shoot and leaf biomass remained unaffected (Figure 1). When examining B concentrations, it was seen that B concentrations in upper organs (shoot + leaves) were approximately 2–2.5-fold higher than those in the roots (Table 2). The B distribution in plant parts may be closely related to the genetic structure of the onion. This may be partially explained by the fact that sorbitols, the primary photosynthetic products in onion plants, are highly mobile and tend to accumulate in leaves [13]. The absence of dramatic toxicity symptoms in leaves (Figure 7) may also support this result. Additionally, previous research has demonstrated that excessive B in the rooting medium can inhibit root growth [27]. In agreement with these findings, Francois [28] observed that even when applying a range of B concentrations (0.5, 1, 5, 10, 15, and 20 mg kg−1) to the nutrient solution, there was no significant effect on the biomass production of green onion leaves [29].
Changes in plant’photosynthetic pigment contents (especially Chl and carotenoids) are considered an important indicator of negativity due to abiotic stress factors. The B levels applied in our study caused certain changes in the content of these pigments in scallions (Figure 3). For instance, there was a non-significant decrease in Chl a content, whereas there was a significant decrease in Chl b content. This result is from a previous work, which reported that during the process of Chl degradation due to B toxicity, Chl b is converted to Chl a, and thus the Chl a/b ratio might increase [29]. Ito et al. [30] revealed that the reduction of Chl b in leaves exposed to high B application depends on the different mechanisms such as greater degradation of Chl b, an increment of Chl b in conversion to Chl a, a reduction in conversion of Chl a to Chl b, or the combination of these mechanisms. The Car contents of scallions significantly increased with only low B applications (Figure 3a).
At the same time, MP value in roots and shoots significantly decreased with the high B applications, contrary to expectations (Figure 3b). Notably, positive correlations were observed between the root FW and MP values of the root and leaf, suggesting that as the root FW increased, MP values in the plant tissues also tended to increase (Figure 6). The tendency of B, which is abundant in the growth medium, to form complexes easily with different sugars and other compounds containing cis-hydroxyl groups may partially support this conclusion. Kobayashi et al. [31] reported that the B–RG-II complex cross-links pectin polysaccharide chains and thus functions to form a pectin network in cell walls. The Car pigments, components of thylakoid membranes, protect Chl from photo-oxidation by absorbing and transferring light to Chl [32]. Nevertheless, Bolaños et al. [33] noted that B has a vital role in the stabilization of molecules by cis-diol groups, independent of its other functions. The insignificant effects of B applications on biomass production in leaves (Figure 2), some photosynthetic pigment contents (Chl a, Chl a + b) (Figure 3a), and MP (Figure 3b) could be explained by the specific B mobility in onion.
Onions are known to produce complex sugar alcohol (polyol) and therefore have high phloem B mobility [14]. The transport of B in the phloem was discussed in previous sections, but its mobility is highly variable among plant species. In species-producing sugar alcohols like onions, the borate anion binds to these sugar alcohols to form complexes that are crucial for transporting B from mature leaves to young leaves via the phloem [13,34]. In contrast, in sucrose-producing species like wheat, complexes such as bis–sucrose–borate have been identified, resulting in a lower concentration of B within the phloem [35]. Brown and Hu [13], who applied 10B-enriched boric acid to leaves, reported that onions and carrots are important mannitol-producing plants. As seen in Figure 7, the absence of serious B toxicity symptoms in scallions exposed to high B indicates that this plant is tolerant of high B doses. Onion leaf injury remained restricted to the tip of the leaves, without marginal chlorosis. Onions showed a notable tolerance to high B treatments, especially 10, 15, or 20 mg L−1 B doses [28]. This tolerance could be related to the role of B in di-ester bridges between two RG-II molecules (Figure 1). These major B-binding fractions may affect cell wall porosity and plant morphogenesis [5], due to an increase in intercellular bindings [7,8].
Many researchers reported that there appears to be a linear relationship between the B levels applied to the rooting medium and the B concentration in the plant tissue [36,37,38]. However, this relationship could be disrupted by some conditions, such as the location of the study (greenhouse or field conditions) [39], working in a nutrient solution or a soilless environment, etc. [40]. In our study, the B applications caused a significant increase in the B concentrations of plant organs (the roots, shoots, and leaves), and the leaves have an approximately 2-fold higher B concentration than the roots in plants exposed to high B (Table 1). The distribution of B concentrations in plant organs is ordered as shoot < root < leaf. Differences between B concentrations in plant organs and the lack of toxicity symptoms can be explained by B mobility in plant species as above. These findings are in agreement with the results of Subedi [41], who studied the accumulation and distribution of B in wheat varieties. This researcher reported the total B concentrations in the leaves by 68%, in the roots by 16%, and in the bulbs by 10%. In addition, Samet and Çıkılı [38] stated that purslane leaves exposed to 0.37, 0.74, 1.48, and 2.96 mM B contained 2.64-, 3.42-, 3.14-, and 4.28-fold more B than in their roots, respectively.
Leaf P concentrations increased significantly with all B levels (Figure 4a), while leaf K concentrations increased only with 0.8 and 1.2 mM B levels (Figure 4b). On the other hand, leaf Ca and Na concentrations decreased significantly only with 1.2 and 1.6 mM B levels (Figure 4c,d). Francois [42] studied the effect of B on radish growth in sand culture, and he reported that Ca and P concentrations showed a notable reduction with excess B, while K, Mg, and Na concentrations remained unchanged. The same researcher found that P, K, Ca, Na, and Mg in the leaves and bulbs of onions were not affected significantly by increasing B levels [28].
While a larger TF value of nutrient elements indicates a higher plant’s transfer capacity of elements from the root to the shoot or leaves, the higher elements’ BCF value indicates that the plant has a higher accumulation potential of these nutrients. In the present study, translocation for P, K, and Ca elements in both shoots and roots was found to be lower than 1 (Table 2). This indicated that only limited quantities of these elements could be transported to the aboveground parts of scallions, which might be due to lower mobility [43,44]. However, the TF value of B in leaves was larger than 1 (Table 1), implying that B was more readily accumulated in the leaves, which had also been observed by other researchers [45]. In addition, over the range of 0.2–1.6 mM of B supply, the TF value of B, P, and K in leaves was found to be greater than in shoots (Table 1 and Table 2). This may be due to the higher accumulation of B, P, and K in leaves compared to shoots (Figure 4). On the other hand, higher B application caused a greater increase in the TF value for B in leaves, contrary to shoots (Table 1). This may also be related to the fact that translocation from roots to shoots is low with low B applications because the B in the roots is bound to the root’s cell wall [1]. These findings showed that scallions have a high transfer capacity of B, P, and K to leaves, contrary to Ca. The fact that the Ca concentration in the roots is approximately 8-fold higher than in the leaves (Figure 4c) and that the BCF of Ca is higher than in the roots (Figure 5d) indicates that calcium is accumulated in the roots. The uptake and transport of Ca are primarily involved by physiological (cation exchange capacity of the rhizosphere, root, and shoot) and molecular mechanisms (Ca transporter proteins and channels), which affect the accumulation and partitioning of Ca in plant parts [46]. Furthermore, applying 0.4 mM B increased the Ca concentration in the roots, while applying higher B decreased it (Figure 4c). This could be explained by the fact that insufficient B in the rooting medium will change the intracellular Ca ion concentration. A significant positive correlation was observed between the Ca concentration and root FW, as well as the Ca accumulation in the plant leaves (Figure 6). This suggests that the increase in root FW may contribute to higher calcium concentration and accumulation in the leaves. González-Fontes et al. [47] reported that Ca and B have a vital role in jointly stabilizing and maintaining the structure and function of the cell wall, and there is a close connection between the Ca and B interaction and the physiological processes taking place in the cell wall.
Net ion accumulation indicates the amount of ions accumulated in the upper organs by the resulting dry root biomass [48]. The results presented in Table 3 showed that increasing B levels caused a significant increase in the net accumulation of B, P, K, and Ca, except for Na. Gradual and significant increases in net B accumulation in plants may result from plant exposure to increased B levels (Table 1). B is mobile in plants that use complex sugar alcohols (polyols) as the primary photosynthetic metabolite, like onions, and is carried from the roots to the upper parts of the plant by the transpiration stream (via xylem), where it joins with polyols to form a complex. Complexes of polyol–B–polyol can pass through the phloem and reach the actively developing meristematic tissues [49]. At higher B applications (0.8, 1.2, and 1.6 mM), in contrast to net B accumulation, the closeness of net P, K, Ca, and Na accumulation data could be explained by the strong tolerance of onions to B toxicity. On the other hand, a significant negative correlation was observed between root FW and net ion accumulation via the root, indicating a strong inverse relationship between root FW and the ion accumulations (Figure 6). Root DW (Figure 2b) and MP values (Figure 3b) measured at the same B levels show that onion roots were not seriously damaged at these B levels. The fact that no effective deficiency symptoms were seen in the onion leaves in Figure 5 may support this hypothesis.

5. Conclusions

Boron exhibits unique characteristics compared to other plant nutrients, particularly in terms of its narrow threshold between deficiency and toxicity, species-specific uptake and transport mechanisms, and its diverse physiological roles. In this study, green onions did not show a significant response to high B levels. However, important information was obtained regarding the effects of B on the ion concentrations, net ion accumulations, and bio-concentrations. For example, the applied B levels caused significant increases in P, K, and Ca net ion accumulation. The BCF of P also increased with higher B levels (0.8, 1.2, and 1.6 mM). Collectively, these findings partially confirmed the potential relationship between increasing B levels and ion behavior (transport and accumulation) and also revealed the complex interactions of B uptake, transport, and accumulation in metabolism. The fact that the expected results cannot be obtained with increasing B levels may be related to the genetic structure of the onion. Evidence suggests that onion (Allium sp.), as a non-gramineous monocot, displays distinct phloem mobility of B, unlike many other plant species where B transport is primarily limited to the xylem. Phloem mobility may enable a more efficient internal redistribution of B, potentially contributing to a higher tolerance. In addition, B is known to play a critical role in the structural integrity of cell walls by forming diester bonds between two rhamnogalacturonan II (RG-II) molecules, which is particularly associated with maintaining upright growth and cell wall stability. Furthermore, the partial limitations in observing toxicity symptoms may be attributed to the relatively low B concentrations applied to the rooting medium. Therefore, future studies employing higher B levels may offer a clearer finding of the physiological roles of B and its behavior in green onions. Given these findings, we suggest B concentrations in experiments above 1.6 mM to reach more definitive conclusions about response thresholds in onion varieties.
In the broader context, the increasing contamination of agricultural lands and water resources worldwide compels farmers to produce crops on polluted soils or to use contaminated water for irrigation. In such environments, knowing the ability of plants to tolerate abiotic stress can help minimize yield losses and ensure access to safe and sustainable food sources. Nevertheless, findings derived from greenhouse experiments conducted under controlled hydroponic conditions should be validated through field trials carried out in soil-based systems to enhance their applicability to agricultural settings.

Author Contributions

The authors (H.S. and Y.Ç.) collaborated on the following issues: methodology, validation, analysis, investigation, data collection, writing, review, and editing of the original draft. Furthermore, All authors have read and agreed to the published version of the manuscript.

Funding

This research received no external funding.

Data Availability Statement

The raw data supporting the conclusions of this article will be made available by the authors on request.

Conflicts of Interest

There are no conflicts of interest among the authors in this study.

References

  1. Goldbach, H.E.; Wimmer, M.A.; Findeklee, P. Discussion paper: Boron—How can the critical level be defined? J. Plant Nutr. Soil Sci. 2000, 163, 115–121. [Google Scholar] [CrossRef]
  2. Yau, S.K.; Hamblin, J.; Ryan, J. Phenotypic variation in boron toxicity tolerance in barley, durum, and bread wheat. Rachis 1994, 13, 20–25. [Google Scholar]
  3. Wimmer, M.A.; Goldberg, S.; Gupta, U.C. Boron. In Handbook of Plant Nutrition; Barker, A., Pilbeam, D., Eds.; CRC Press: Boca Raton, FL, USA, 2015; pp. 305–346. [Google Scholar]
  4. Loomis, W.D.; Durst, R.W. Chemistry and biology of boron. BioFactors 1992, 3, 229–239. [Google Scholar]
  5. Xiao, C.; Anderson, C.T. Roles of pectin in biomass yield and processing for biofuels. Front. Plant Sci. 2013, 4, 67. [Google Scholar] [CrossRef]
  6. Begum, R.A.; Fry, S.C. Arabinogalactan-proteins as boron-acting enzymes, cross-linking the rhamnogalacturonan-II domains of pectin. Plants 2023, 12, 3921. [Google Scholar] [CrossRef]
  7. O’Neill, M.A.; Eberhard, S.; Albersheim, P.; Darvill, A.G. Requirement of borate cross-linking of cell wall rhamnogalacturonan II for Arabidopsis growth. Science 2001, 294, 846–849. [Google Scholar] [CrossRef]
  8. Matsunaga, T.; Ishii, T.; Matsumoto, S.; Masanobu, H.; Darvill, A.; Albersheim, P.; O’Neill, M.A. Occurrence of the Primary Cell Wall Polysaccharide Rhamnogalacturonan II in Pteridophytes, Lycophytes, and Bryophytes. Implications for the Evolution of Vascular Plants. Plant Physiol. 2004, 134, 339–351. [Google Scholar] [CrossRef]
  9. Avci, U.; Peña, M.J.; O’Neill, M.A. Changes in the abundance of cell wall apiogalacturonan and xylogalacturonan and conservation of rhamnogalacturonan II structure during the diversification of the Lemnoideae. Planta 2018, 247, 953–971. [Google Scholar] [CrossRef]
  10. Begum, R.A.; Messenger, D.J.; Fry, S.C. Making and breaking of boron bridges in the pectic domain rhamnogalacturonan-II at apoplastic pH in vivo and in vitro. Plant J. 2023, 113, 1310–1329. [Google Scholar] [CrossRef]
  11. Hu, H.; Brown, P.H.; Labavitch, J.M. Species variability in boron requirement is correlated with cell wall pectin. J. Exp. Bot. 1996, 47, 227–232. [Google Scholar] [CrossRef]
  12. Brown, P.H.; Bellaloui, N.; Wimmer, M.A.; Bassil, E.S.; Ruiz, J.; Hu, H.; Pfeffer, H.; Dannel, F.; Römheld, V. Boron in plant biology. Plant Biol. 2002, 4, 205–223. [Google Scholar] [CrossRef]
  13. Brown, P.H.; Hu, H. Boron mobility and consequent management in different crops. Better Crops 1998, 82, 28–31. [Google Scholar]
  14. Brdar-Jokanović, M. Boron toxicity and deficiency in agricultural plants. Int. J. Mol. Sci. 2020, 21, 1424–1444. [Google Scholar] [CrossRef] [PubMed]
  15. Redgwell, R.J.; Selvendran, R.R. Structural features of cell wall polysaccharides of onion (Allium cepa). Carbohydr. Res. 1986, 157, 183–199. [Google Scholar] [CrossRef]
  16. Waldron, K.W.; Selvendran, R.R. Composition of the cell walls of different asparagus (Asparagus officinalis) tissues. Physiol. Plant. 1990, 80, 568–575. [Google Scholar] [CrossRef]
  17. Jones, J.B., Jr.; Wolf, B.; Mills, H.A. Plant Analysis Handbook. A Practical Sampling, Preparation, Analysis, and Interpretation Guide; Micro-Macro Publishing Inc.: Athens, GA, USA, 1991; pp. 127–189. [Google Scholar]
  18. González-Fontes, A.; Rexach, J.; Navarro-Gochicoa, M.T.; Herrera-Rodríguez, M.B.; Beato, V.M.; Maldonado, J.M.; Camacho-Cristóbal, J.J. Is boron involved solely in structural roles in vascular plants? Plant Signal. Behav. 2008, 3, 24–26. [Google Scholar] [CrossRef]
  19. Manna, D.; Maity, T.K. Growth, yield, and bulb quality of onion (Allium cepa L.) in response to foliar application of boron and zinc. J. Plant Nutr. 2016, 39, 438–441. [Google Scholar] [CrossRef]
  20. Francke, A.; Majkowska-Gadomska, J.; Kaliniewicz, Z.; Jadwisieńczak, K. No Effect of Biostimulants on the Growth, Yield, and Nutritional Value of Shallots Grown for Bunch Harvest. Agronomy 2022, 12, 1156. [Google Scholar] [CrossRef]
  21. Hoagland, D.R.; Arnon, D.I. The water-culture method for growing plants without soil. Calif. Agric. Exp. Stn. Circ. 1950, 347, 1–32. [Google Scholar]
  22. Lichtenthaler, H.K. Chlorophylls and carotenoids: Pigments of photosynthetic biomembranes. Methods Enzymol. 1987, 148, 350–382. [Google Scholar] [CrossRef]
  23. Yan, B.; Dai, Q.; Liu, X.; Huang, S.; Wang, Z. Flooding-induced membrane damage, lipid oxidation, and activated oxygen generation in corn leaves. Plant Soil 1996, 179, 261–268. [Google Scholar] [CrossRef]
  24. Miller, R.O. High-temperature oxidation: Dry ashing. In Handbook of Reference Methods for Plant Analysis; Kalra, P.Y., Ed.; Taylor and Francis/CRC Press: Boca Raton, FL, USA, 1998; pp. 66–69. [Google Scholar]
  25. Soda, S.; Hamada, T.; Yamaoka, Y.; Ike, M.; Nakazato, H.; Saeki, Y.; Kasamatsu, T.; Sakurai, Y. Constructed wetlands for advanced treatment of wastewater with a complex matrix from a metal-processing plant: Bioconcentration and translocation factors of various metals in Acorus gramineus and Cyperus alternifolius. Ecol. Eng. 2012, 39, 63–70. [Google Scholar] [CrossRef]
  26. Herrera-Rodríguez, M.B.; González-Fontes, A.; Rexach, J.; Camacho-Cristobal, J.J.; Maldonado, J.M.; Navarro-Gochicoa, M.T. Role of boron in vascular plants and response mechanisms to boron stresses. Plant Stress 2010, 4, 115–122. [Google Scholar]
  27. Reid, R.; Fitzpatrick, K. Influence of leaf tolerance mechanisms and rain on boron toxicity in barley and wheat. Plant Physiol. 2009, 151, 413–420. [Google Scholar] [CrossRef]
  28. Francois, L.E. Yield and quality responses of garlic and onion to excess boron. HortScience 1991, 26, 547–549. [Google Scholar] [CrossRef]
  29. Trifunović-Momčilov, M.; Milošević, S.; Marković, M.; Đurić, M.; Jevremović, S.; Dragićević, I.Č.; Subotić, A.R. Changes in photosynthetic pigments content in non-transformed and AtCKX transgenic centaury (Centaurium erythraea Rafn) shoots grown under salt stress in vitro. Agronomy 2021, 11, 2056. [Google Scholar] [CrossRef]
  30. Ito, H.; Ohtsuka, T.; Tanaka, A. Conversion of chlorophyll b to chlorophyll a via 7-hydroxymethyl chlorophyll. J. Biol. Chem. 1996, 271, 1475–1479. [Google Scholar] [CrossRef]
  31. Kobayashi, M.; Nakagawa, H.; Asaka, T.; Matoh, T. Borate ± rhamnogalacturonan II bonding reinforced by Ca2+ retains pectic polysaccharides in higher-plant cell walls. Plant Physiol. 1999, 119, 199–204. [Google Scholar] [CrossRef]
  32. Park, S.; Fischer, A.L.; Steen, C.J.; Iwai, M.; Morris, J.M.; Walla, P.J.; Niyogi, K.K.; Fleming, G.R. Chlorophyll-carotenoid excitation energy transfer in high-light-exposed thylakoid membranes investigated by snapshot transient absorption spectroscopy. J. Am. Chem. Soc. 2018, 140, 11965–11973. [Google Scholar] [CrossRef]
  33. Bolaños, L.; Lukaszewski, K.; Bonilla, I.; Blevins, D. Why boron? Plant Physiol. Biochem. 2004, 42, 907–912. [Google Scholar] [CrossRef]
  34. Brown, P.H.; Shelp, B.J. Boron mobility in plants. Plant Soil 1997, 193, 85–101. [Google Scholar] [CrossRef]
  35. Stangoulis, J.; Tate, M.; Graham, R.; Bucknall, M.; Palmer, L.; Boughton, B.; Reid, R. The mechanism of boron mobility in wheat and canola phloem. Plant Physiol. 2010, 153, 876–881. [Google Scholar] [CrossRef] [PubMed]
  36. Cervilla, L.M.; Blasco, B.; Ríos, J.J.; Romero, L.; Ruiz, J.M. Oxidative stress and antioxidants in tomato (Solanum lycopersicum) plants subjected to boron toxicity. Ann. Bot. 2007, 100, 747–756. [Google Scholar] [CrossRef] [PubMed]
  37. Hamurcu, M.; Demiral, T.; Hakki, E.E.; Turkmen, Ö.; Gezgin, S.; Bell, R.W. Oxidative stress responses in watermelon (Citrullus lanatus) as influenced by boron toxicity and drought. Zemdirbyste/Agriculture 2015, 102, 209–216. [Google Scholar] [CrossRef]
  38. Samet, H.; Çıkılı, Y. Response of Purslane (Portulaca oleracea L.) to Excess Boron and Salinity: Physiological Approach. Russ. J. Plant Physiol. 2019, 66, 316–325. [Google Scholar] [CrossRef]
  39. Paull, J.G.; Cartwright, B.; Rathjen, A.J. Responses of wheat and barley genotypes to toxic concentrations of soil boron. Euphytica 1988, 39, 137–144. [Google Scholar] [CrossRef]
  40. Nable, R.O. Resistance to boron toxicity amongst several barley and wheat cultivars: A preliminary examination of the resistance mechanism. Plant Soil 1988, 112, 45–52. [Google Scholar] [CrossRef]
  41. Subedi, K.D.; Gregory, P.J.; Gooding, M.J. Boron accumulation and partitioning in wheat cultivars with contrasting tolerance to boron deficiency. Plant Soil 1999, 214, 141–152. [Google Scholar] [CrossRef]
  42. Francois, L.E. Effect of excess boron on broccoli, cauliflower, and radish. J. Am. Soc. Hortic. Sci. 1986, 111, 494–498. [Google Scholar] [CrossRef]
  43. Huang, S.S.; Liao, Q.L.; Hua, M.; Wu, X.M.; Bi, K.S.; Yan, C.Y.; Chen, B.; Zhang, X.Y. Survey of heavy metal pollution and assessment of agricultural soil in Yangzhong district, Jiangsu Province, China. Chemosphere 2007, 67, 2148–2155. [Google Scholar] [CrossRef]
  44. Wang, X.; Liu, Y.; Zeng, G.; Chai, L.; Song, X.; Min, Z.; Xiao, X. Subcellular distribution and chemical forms of cadmium in Bechmeria nivea (L.) Gaud. Environ. Exp. Bot. 2008, 62, 389–395. [Google Scholar] [CrossRef]
  45. Kabata-Pendias, A. Trace Elements in Soils and Plants, 3rd ed.; CRC Press: Boca Raton, FL, USA, 2000; p. 432. [Google Scholar]
  46. Kumar, A.; Singh, U.M.; Manohar, M.; Gaur, V.S. Calcium transport from source to sink: Understanding the mechanism(s) of acquisition, translocation, and accumulation for crop biofortification. Acta Physiol. Plant. 2015, 37, 1722. [Google Scholar] [CrossRef]
  47. González-Fontes, A.; Navarro-Gochicoa, M.T.; Camacho-Cristóbal, J.J.; Herrera-Rodríguez, M.B.; Quiles-Pando, C.; Rexach, J. Is Ca2+ involved in the signal transduction pathway of boron deficiency? New hypotheses for sensing boron deprivation. Plant Sci. 2014, 217, 135–139. [Google Scholar] [CrossRef] [PubMed]
  48. Moradi, L.; Ehsanzadeh, P. Effects of Cd on photosynthesis and growth of safflower (Carthamus tinctorius L.) genotypes. Photosynthetica 2015, 53, 506–518. [Google Scholar] [CrossRef]
  49. García-Sánchez, F.; Simón-Grao, S.; Martínez-Nicolás, J.J.; Alfosea-Simón, M.; Liu, C.; Chatzissavvidis, C.; Pérez-Pérez, J.G.; Cámara-Zapata, J.M. Multiple stresses occurring with boron toxicity and deficiency in plants. J. Hazard. Mater. 2020, 397, 122713. [Google Scholar] [CrossRef]
Figure 1. The main dimerization reaction in the B-bridging of monomeric RG-II (red circles indicate the charges of the neighboring anionic sugar residue) [6,9].
Horticulturae 11 00450 g001
Figure 2. The effects of increasing B levels on (a) Fresh weight; (b) Dry weight of scallions (Bars indicate means of three replicates ± SE. Different letters on the bars for each parameter differ significantly according to Tukey HSD).
Horticulturae 11 00450 g002
Figure 3. The effects of increasing B levels on (a) photosynthetic pigment contents, (b) membrane permeability (MP) of scallions (Bars indicate means of three replicates ± SE. Different letters on the bars for each parameter differ significantly according to Tukey HSD).
Horticulturae 11 00450 g003
Figure 4. The effects of increasing B levels on (a) P concentrations; (b) K concentrations; (c) Ca concentrations; (d) Na concentrations in scallions (Bars indicate means of three replicates ± SE. Different letters on the bars for each parameter differ significantly according to Tukey HSD).
Horticulturae 11 00450 g004
Figure 5. The effects of increasing B levels on (a) BCF of B; (b) BCF of P; (c) BCF of K; (d) BCF of Ca in scallions (Bars indicate means of three replicates ± SE. Different letters on the bars for each parameter differ significantly according to Tukey HSD).
Horticulturae 11 00450 g005
Figure 6. The correlation matrix illustrates the relationships among parameters measured in scallions’ root, shoot, and leaf tissues. In the matrix, both the color and size of the circles reflect the strength and direction of the correlations: blue circles indicate positive correlations, while red circles denote negative correlations. Larger circles correspond to stronger correlation coefficients. Abbreviations: r, root; s, shoot; l, leaf; r–s, root to shoot; r–l, root to leaf.
Horticulturae 11 00450 g006
Figure 7. The effects of increasing B levels on the growth of scallions.
Horticulturae 11 00450 g007
Table 1. The effects of increasing B levels on concentrations and translocation of B in scallions.
Applied B (mM)Boron Concentrations (mg kg−1)Translocation Factor of B
RootShootLeafRoot to ShootRoot to Leaf
059.8 ± 1.01 f30.0 ± 0.26 e58.7 ± 5.07 e0.502 a0.984 d
0.2119.6 ± 1.52 e54.5 ± 0.34 d191.3 ± 13.2 d0.456 b1.601 c
0.4186.8 ± 4.14 d76.9 ± 0.40 c314.5 ± 4.00 c0.412 c1.685 c
0.8309.4 ± 4.38 c122.1 ± 2.31 b725.0 ± 1.80 b0.395 cd2.344 a
1.2400.8 ± 3.47 b151.8 ± 1.13 a922.1 ± 5.81 a0.379 d2.301 a
1.6456.6 ± 4.39 a155.0 ± 2.60 a931.3 ± 1.57 a0.340 e2.040 b
F-test***************
Values are the mean of three replicates (means ± SE, n = 3). Different letters in the same column are significantly different according to Tukey HSD. The F-test shows a significant difference at *** p < 0.001.
Table 2. The effects of increasing B levels on the translocation of phosphorus, potassium, and calcium of scallions.
Applied B (mM)Translocation Factor of PTranslocation Factor of KTranslocation Factor of Ca
Root to ShootRoot to LeafRoot to ShootRoot to LeafRoot to ShootRoot to Leaf
00.634 b0.740 c0.455 a0.836 bc0.295 b0.417 a
0.20.600 bc0.800 c0.453 a0.878 ab0.334 a0.348 b
0.40.626 b0.891 b0.388 b0.760 c0.263 c0.284 c
0.80.756 a0.975 a0.433 ab0.856 ab0.321 ab0.337 b
1.20.597 bc0.801 c0.433 ab0.851 abc0.341 a0.309 bc
1.60.535 c0.788 c0.477 a0.928 a0.329 a0.302 bc
F-test*****************
Values are the mean of three replicates (means ± SE, n = 3). Different letters in the same column are significantly different according to Tukey HSD. F-test shows a significant difference at ** p < 0.010 and *** p < 0.001.
Table 3. The effects of increasing B levels on net ion accumulations of scallions.
Applied B (mM)Net Ion Accumulations via Roots (mg g−1 DW)
BPKCaNa
00.329 ± 0.004 f8.30 ± 0.21 c161.8 ± 2.59 b36.92 ± 0.72 b36.92 ± 0.63 ab
0.21.028 ± 0.031 e9.48 ± 0.06 bc184.7 ± 1.63 a40.69 ± 0.53 a38.44 ± 0.62 ab
0.41.584 ± 0.025 d8.94 ± 0.15 bc185.4 ± 2.51 a43.78 ± 0.55 a39.44 ± 0.74 a
0.83.069 ± 0.024 c9.67 ± 0.09 b185.8 ± 1.64 a42.39 ± 1.00 a36.20 ± 0.55 b
1.24.315 ± 0.062 b9.89 ± 0.18 b192.4 ± 4.22 a44.26 ± 0.83 a36.98 ± 0.23 ab
1.64.774 ± 0.179 a11.48 ± 0.55 a195.8 ± 6.55 a42.01 ± 0.87 a36.22 ± 0.67 b
F-test**************
Values are the mean of three replicates (means ± SE, n = 3). Different letters in the same column are significantly different, according to Tukey’s HSD. F-test shows a significant difference at ** p < 0.010 and *** p < 0.001.
Disclaimer/Publisher’s Note: The statements, opinions and data contained in all publications are solely those of the individual author(s) and contributor(s) and not of MDPI and/or the editor(s). MDPI and/or the editor(s) disclaim responsibility for any injury to people or property resulting from any ideas, methods, instructions or products referred to in the content.

