Abstract
Background: Gloriosa superba L., commonly known as Glory Lily, is a medicinally valuable perennial climber native to tropical and subtropical regions of India. It is known for its rich alkaloid content, including colchicine and colchicoside, which contribute to its therapeutic potential in treating various ailments. Despite its pharmacological significance, genomic research on G. superba remains limited due to the lack of genetic markers, hindering molecular studies and breeding advancements. Methods: This study utilized a previously reported de novo transcriptome assembly of G. superba, identifying 14,672 EST-SSRs as genomic markers to assess genetic variations across different accessions. Genetic diversity was examined using SSR markers, while 20 morphological traits were systematically evaluated across 19 G. superba accessions from diverse geographic regions to provide insights into trait variability. Results: The most highly variable traits included plant height, number of leaves per plant, number of branches per plant, fresh pod yield, fresh seed yield, dry seed yield, number of pods per plant, leaf width, and internodal length, with coefficients of variation (CV) ranging from 63.53% to 22.45%. Intermediate CV values (10.05% to 18.75%) were observed in eight traits, while three traits (days to flowering, days to 50% flowering, and colchicine content) had low variation (<5%). Principal component analysis (PCA) accounted for 51.3% of phenotypic variation, with PC1 and PC2 contributing 29.4% and 21.9%, respectively. Clustering analysis grouped the 19 G. superba accessions into two main clusters and four sub-clusters, highlighting significant genetic divergence, with the highest dissimilarity (81.45%) observed between accessions from Arrupukottai and Pachmarhi. SSR analysis using 112 markers revealed high polymorphism but a relatively low heterozygosity index (H = 0.277) and PIC values of individual SSRs ranged from 0.26069 in RGM-51635 to 0.4534 in RGM-24219. Conclusions: The genetic divergence observed among the collected G. superba ecotypes provides valuable insights for future breeding programs aimed at enhancing cultivation efficiency and developing superior varieties with improved yield and colchicine content.
1. Introduction
Gloriosa superba L., commonly known as Glory Lily, belongs to the order Liliales and family Colchicaceae. It is a perennial climbing plant widely found in tropical and subtropical regions of India, including the foothills of the Himalayas. This striking lily is native to Africa and serves as the national flower of Zimbabwe. In India, it is widely distributed and is recognized as the state flower of Tamil Nadu. The plant is rich in alkaloids, such as colchicine and colchicoside, which contribute to its significant medicinal value. It is traditionally used to treat various conditions, including cancer, arthritis, gout, rheumatism, and infertility [1].
Since this herb is sold as tubers and seeds, its identification based on morphological and histological characteristics is crucial. Some studies have reported a high degree of variability in its habitat, colchicine content, and morphology. However, no research has documented variations among plants from different habitats [2]. Another study [3] found low genetic variability in G. superba due to its continuous vegetative propagation through tubers. Currently, only local ecotypes of G. superba are cultivated and no traditional or conventional breeding approaches have been attempted for this species [4]. Until recently, limited genomic information was available and the lack of genetic markers has hindered further genetic studies. In our previous research, we identified 14,672 potential EST-SSRs from a de novo transcriptome assembly, providing a valuable genomic resource for studying genetic variation in this species [5]. In a recent study, the reference genome assemblies of L. sargentiae (47.09 Gb) and G. superba (5.15 Gb), both members of the Liliales order, were published. Their phylogenetic analysis and hybridization patterns at the nuclear gene level revealed diverse and independent origins of lily cultivars [6].
Chitra and Rajamani evaluated 18 Gloriosa superba genotypes collected from different locations in Tamil Nadu and Andhra Pradesh for vegetative, floral, and yield-related traits [7]. A similar study assessed yield-attributing characteristics and colchicine content in Gloriosa genotypes from various agro-climatic zones in these states [8]. Genetic variation among 18 G. superba accessions was analyzed using 58 Random Amplified Polymorphic DNA (RAPD) markers, revealing significant diversity [9]. However, RAPD and AFLP analyses of G. superba from five locations in Udipi, Karnataka, suggested low intraspecific diversity and potential genetic drift [10]. A more recent study on G. superba accessions from the Western Ghats indicated significant morphogenetic and metabolite variation, highlighting the potential for expanding cultivation to meet the growing demand for colchicine and improve farmers’ income [11].
Morphological, biochemical, and molecular markers have proven highly effective for assessing genetic diversity [12,13,14]. However, studies have reported an underrepresentation of total genetic diversity due to the influence of environmental factors on morphological and biochemical markers [15,16,17]. Molecular markers, particularly Simple Sequence Repeats (SSRs), overcome this limitation due to their high reproducibility, efficiency, polymorphism, and information capacity. As a result, SSRs have been widely used in genetic diversity studies [18,19], cultivar identification [20], and molecular mapping [21].
Despite the importance of G. superba, only a few studies have combined morphological, biochemical, and molecular analyses for its characterization. In this study, we utilized 200 EST-SSRs derived from large-scale ESTs identified in our previous transcriptome sequencing research [5]. We combined morphological, biochemical, and SSR markers to analyze genetic diversity and relationships among 19 G. superba ecotypes distributed across different agroclimatic zones in India.
2. Materials and Methods
2.1. Plant Material
Tubers of 19 Gloriosa accessions were collected randomly from various locations like Darjeeling (West Bengal), Salyan (Nepal), Sumbuk (Sikkim), Chhatarpur, Mandla, Chhindwara, Kesla, Pachmarhi, Amarkantak, and Jabalpur (Madhya Pradesh), Nellore (Andhra Pradesh), Tenkasi, Valliyur, Aruppukottai, Kallimandayam, Markampatti, and Mullanoor (Tamil Nadu) (Table 1). Tubers were collected in the months of May–July. During the time of the collection of the tubers, the GPS coordinates were recorded as mentioned in Table 1. The tubers of the collected Gloriosa ecotypes were stored and planted in pots using a completely randomized design with 3 replications in the month of July at the medicinal garden of Rajiv Gandhi Proudyogiki Vishwavidyalaya, Bhopal, Madhya Pradesh, India.

Table 1.
Geographical distribution of the collected G. superba ecotypes.
2.2. Morphological Data
Morphological data was recorded for 19 accessions, including Darjeeling 1, 2, and 3 (West Bengal), each displaying different flower colors; Salyan (Nepal); Sumbuk (Sikkim); Chhatarpur, Mandla, Chhindwara, Hoshangabad, Pachmarhi, Amarkantak, and Jabalpur (Madhya Pradesh); Nellore (Andhra Pradesh); and Tenkasi, Valliyur, Aruppukottai, Kallimandayam, Markampatti, and Mullanoor (Tamil Nadu). Data collection was performed in the months of September–November, focusing on the following traits: plant height, number of leaves per plant, number of branches per plant, days to flowering, days to fifty percent flowering, number of flowers per plant, number of pods per plant, number of seeds per pod, fresh pod weight, fresh seed weight per pod, fresh pod yield per plant, fresh seed yield per plant, dry seed weight per pod, dry seed weight per plant, leaf length, leaf width, internodal length, tuber size, diameter of tuber, and colchicine. Data was collected for 5 plants on 4 replications for each ecotype. Data for plant height, number of leaves per plant, and number of branches per plant were collected at physiological maturity when the plants reached their maximum height and when branching was complete. Days to fifty percent flowering was recorded when 50% of the flowers bloomed. Again, the number of flowers per plant was recorded by counting flowers at the peak flowering time just before ripening or maturity. The yield-related traits like fresh pod weight and fresh pod yield per plant were recorded at physiological maturity by observing the change in pod color. Dry weight was then obtained from the pod samples after they were dried in an oven at 60–70 °C until a constant weight was achieved. Drying was done over a period of 48–72 h.
2.3. Estimation of Colchicine Content
Colchicine was extracted from the tubers of all 19 G. superba accessions using a standard method [22] with a Soxhlet extractor. Freshly collected tubers were thoroughly washed, cut into small pieces, and dried in a hot air oven at 60 °C for 48 h until a constant weight was achieved. The dried tubers were then ground into a fine powder using a mechanical grinder. A 10 g sample of dried tuber was subjected to Soxhlet extraction for six hours (18–19 cycles) using 100 mL of methanol as the solvent, maintaining a temperature of 45–50 °C. The extracts were purified using petroleum ether and chloroform, filtered through a 0.45 µm filter, and dissolved in 10 mL of methanol. Qualitative and quantitative estimation of colchicine was performed using HPTLC (CAMAG, Muttenz, Switzerland) with a mobile phase composition of 50:30:15:5 (methanol: acetonitrile: water: 0.1% orthophosphoric acid). The application parameters were as follows: spray gas: inert gas; sample solvent type: methanol; dosage speed: 150 nL/s; and predosage volume: 0.2 µL.
2.4. DNA Isolation
Genomic DNA was isolated from the young leaves of all 19 accessions using the CTAB method [23,24,25]. The quality of the extracted DNA was assessed using 1% agarose gel electrophoresis, followed by quantification with the Quantus Fluorometer (Promega Corporation, Madison, WI, USA).
2.5. SSR Analysis
Primers were synthesized for 200 EST-SSRs developed from the transcriptome sequencing of G. superba, as published in our previous studies. PCR amplification of all 19 G. superba accessions was performed using these 200 EST-SSRs. The amplified products were resolved on 8% polyacrylamide gels using a large-format vertical gel electrophoresis unit (Clever Scientific). SSR bands were identified and scored from the gel images using Gel Analyzer 2010a (http://en.bio-soft.net/draw/gela.html, accessed on 18 March 2020).
2.6. Statistical Analysis of Phenotypic and Genotypic Data
For phenotypic data, the Analysis of Variance (ANOVA) and Least Significant Difference (LSD) were computed for all traits using ADEL-R 2.0 [26] with R for Windows. Phenotypic trait correlation was determined using the WARD method. A dendrogram was constructed using DARwin6 [27]. Basic statistics were computed with STAD-R 1.0 using R for Windows. The PCA scores plot, biplot, correlation heatmap and PLS-DA Variable Importance in Projection (VIP) plots were prepared using an online web tool MetaboAnalyst v6.0 [28]. For genotypic data, the Marker Polymorphic Information Content (PIC) and heterozygosity were calculated using the R software with the Agricolae package [29]. The dendrogram and similarity matrix were constructed using NTSYS-PC (version 2.11f) [30].
3. Results
3.1. Morphological and Biochemical Study
Twenty morphological traits were assessed for the 19 Gloriosa superba accessions. The mean, maximum, minimum, standard deviation (SD), Least Significant Difference (LSD), and coefficient of variation (CV) were calculated for each morphological character (Table 2). It was observed that the 19 accessions of Gloriosa superba showed considerable variation in their morphological and biochemical traits. The most highly variable traits were plant height, number of leaves per plant, number of branches per plant, fresh pod yield per plant, fresh seed yield per plant, dry seed yield per plant, number of pods per plant, leaf width, and internodal length (CV ≥ 20%, range: 63.53% to 22.45%). Eight traits (number of flowers per plant, number of seeds per pod, fresh pod weight, fresh seed weight per pod, dry seed weight per pod, leaf length, tuber size, and diameter of tuber) exhibited intermediate CV values ranging from 10.05% to 18.75%. The remaining three traits (days to flowering, days to 50% flowering, and colchicine content) had low CV values (<5%).
Table 2.
Descriptive statistics of morphological traits in G. superba. (maximum and minimum values are in bold).
The Markampatti accession showed the highest values for PH (158.2 cm), NLPP (67.2), DF (115.5 days), DFF (124.5 days), and DT (2.3 cm). The wild accession from Chattarpur had the highest values for FPYPP (47.46 g), FSYPP (23.64 g), DSYPP (12.9 g), NFPP (9), and NPP (7.2), whereas Darjeeling 2 exhibited the highest DFF (52.5 days) but the lowest NFPP (2.5), NPP (1.5), FPYPP (9.26 g), and FSYPP (3.69 g). The highest NSPP (40.8) was found in the Valliour accession (Table 2). The longest leaves were observed in Darjeeling 1 (16.56 cm) and the shortest in Valliour (10.15 cm). The mean colchicine content (%) ranged from 0.0491 to 0.642, with the wild accession from Kesla, Madhya Pradesh showing the lowest value and the Tenkashi accession from Tamil Nadu showing the highest value, followed by Nellore (0.6205%) in Andhra Pradesh and Markampatti (0.583%) in Tamil Nadu. A representative HPTLC chromatogram for the extracted colchicines from G. superba is shown in Figure S1.
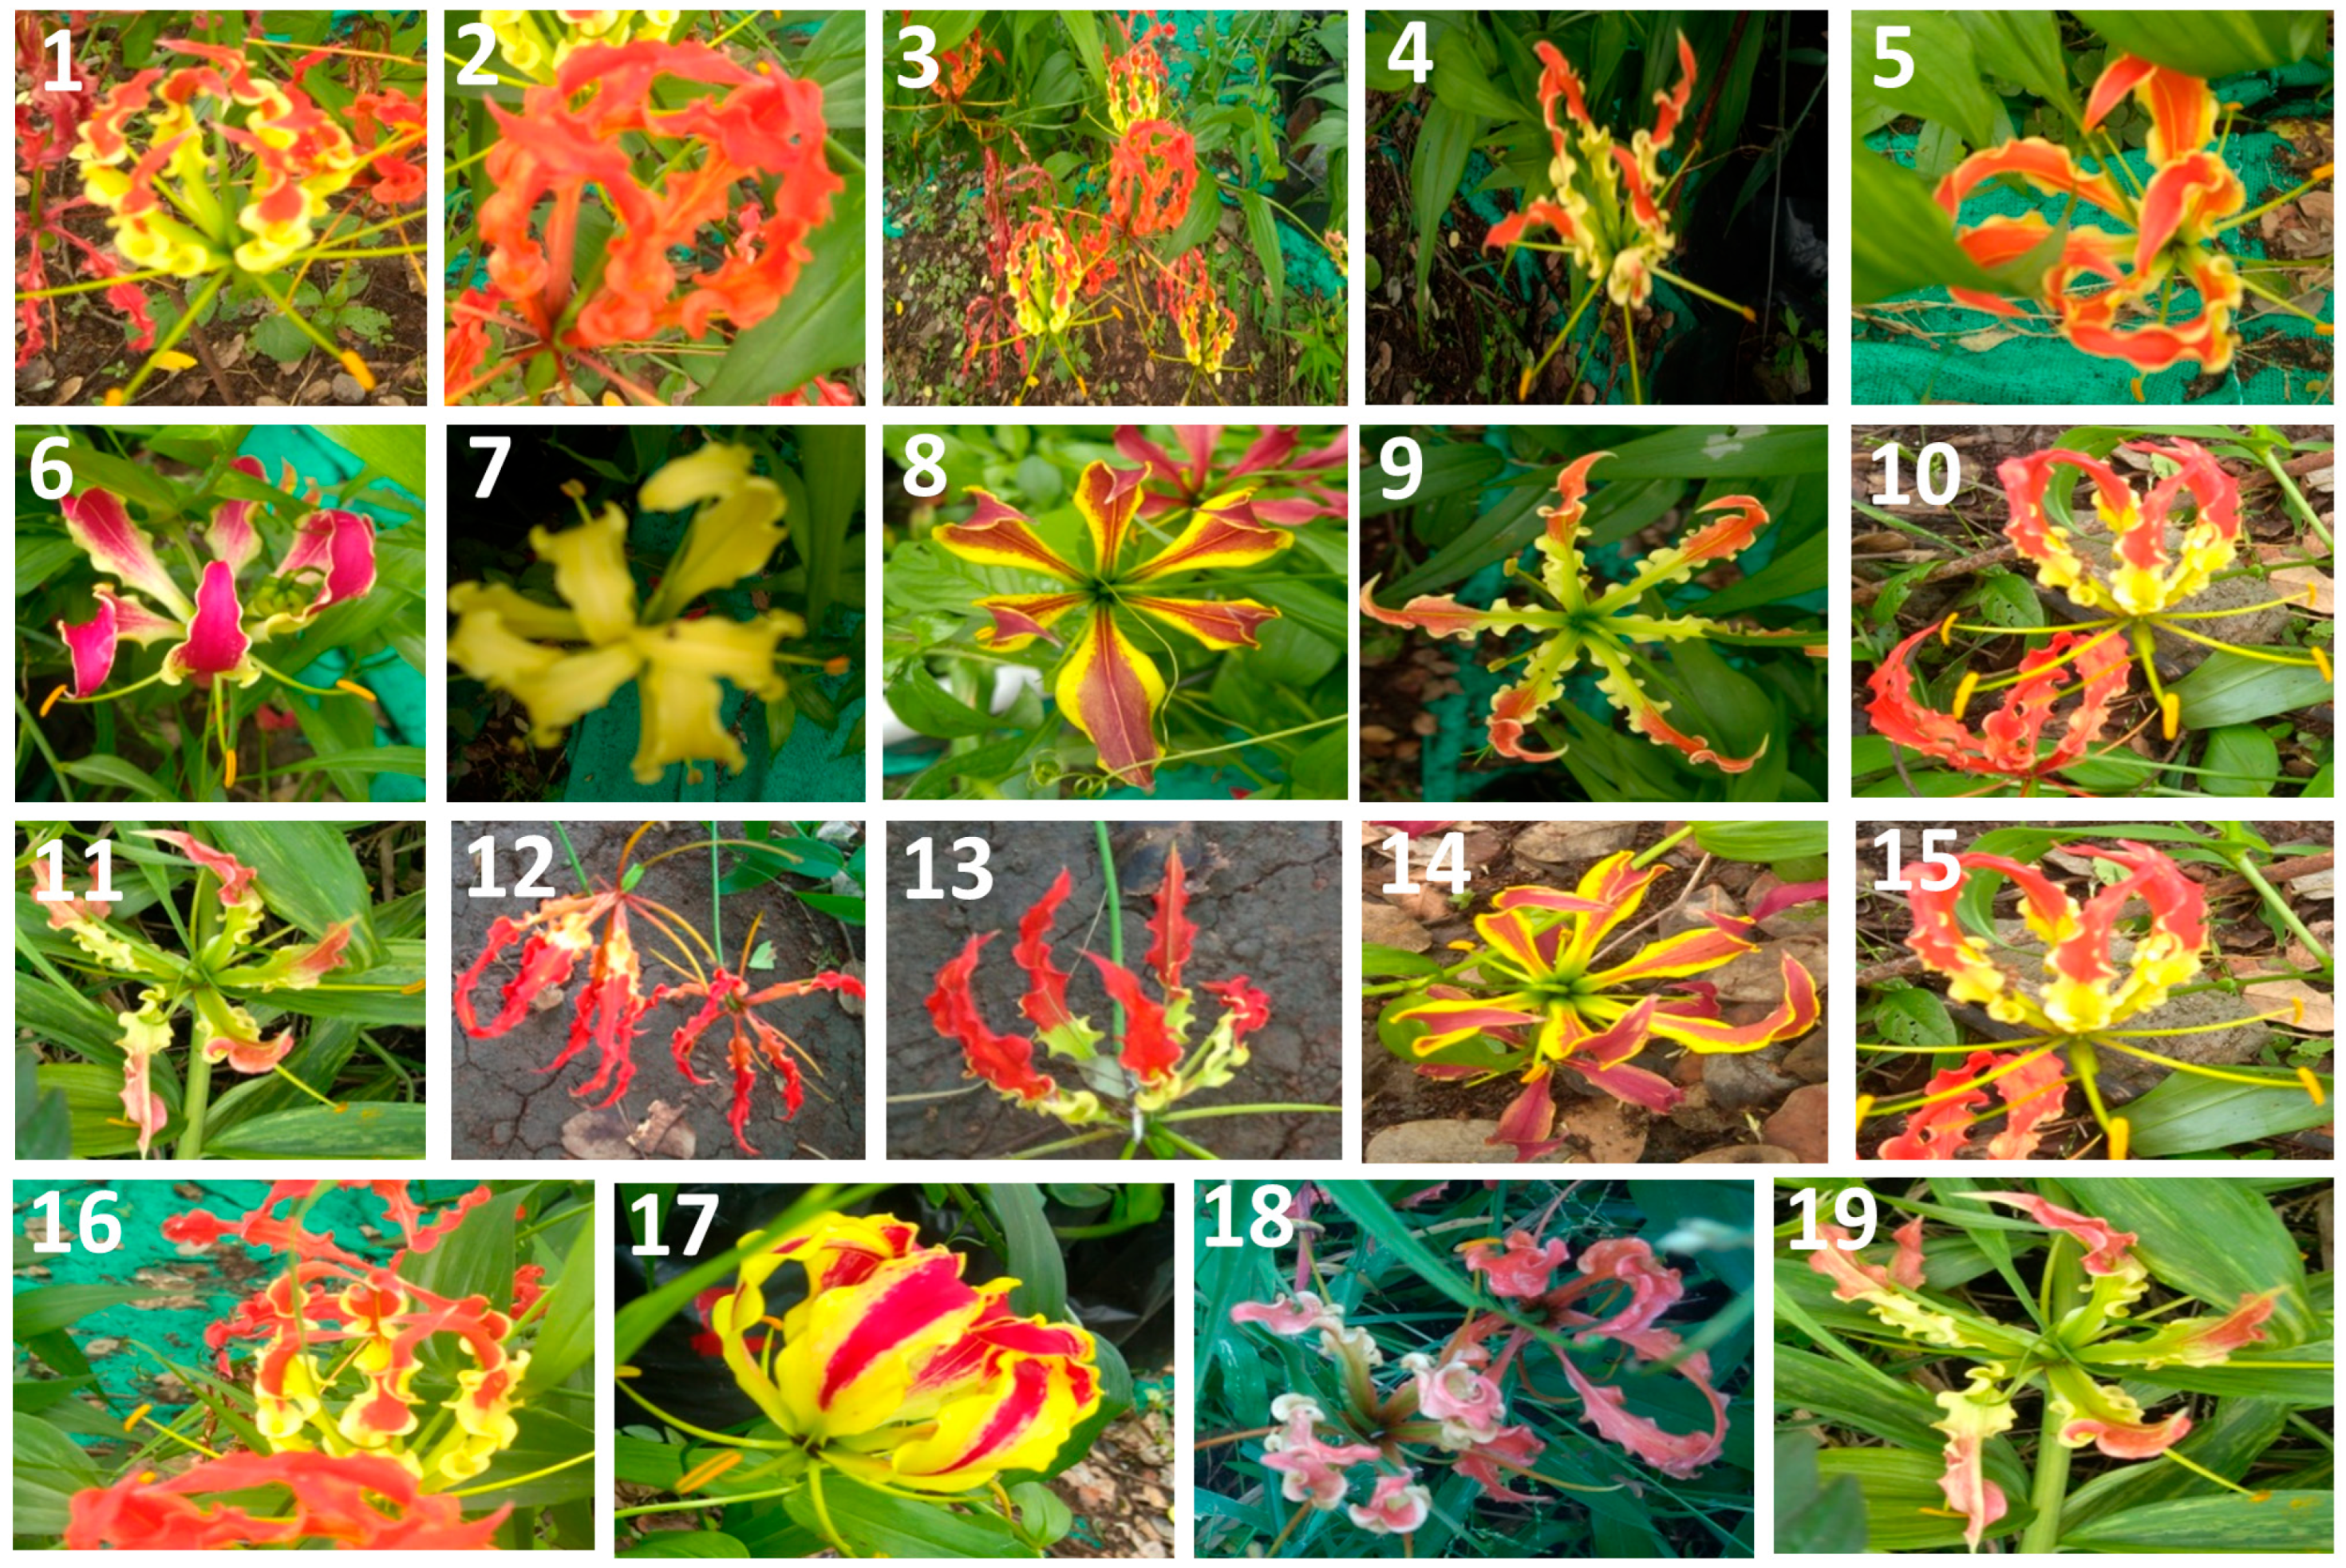
Significant variation in flower color was observed among all 19 ecotypes of G. superba (Figure 1). ANOVA results indicated that the mean squares for genotypes were highly significant (p ≤ 0.01) for all morphological traits, except for the number of branches per plant (Table 3a,b).
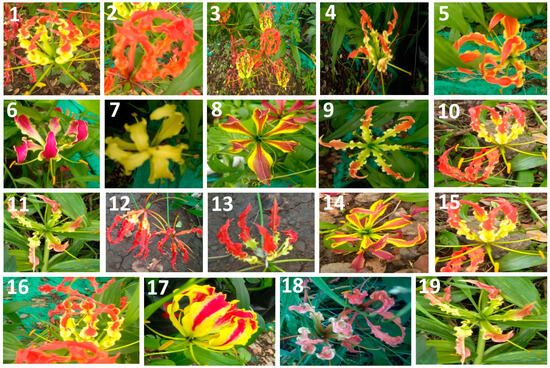
Figure 1.
A representative figure showing variation in flower color of all the 19 accessions of G. superba. 1: Darjeeling 1, 2: Darjeeling 2, 3: Darjeeling 3, 4: Salyan, 5: Sumbuk, 6: Chhatarpur, 7: Mandla, 8: Chhindwara, 9: Kesla, 10: Pachmarhi, 11: Amarkantak, 12: Jabalpur, 13: Nellore, 14: Tenkasi, 15: Aruppukottai, 16: Vallioor, 17: Kallimandayam, 18: Markampatti, and 19: Mulanur.
Table 3.
(a) Results of ANOVA showing the mean square values of the 10 morphological traits. (b) Results of ANOVA showing the mean square values of the remaining 10 morphological and biochemical traits.
3.1.1. Hierarchical Clustering Analysis
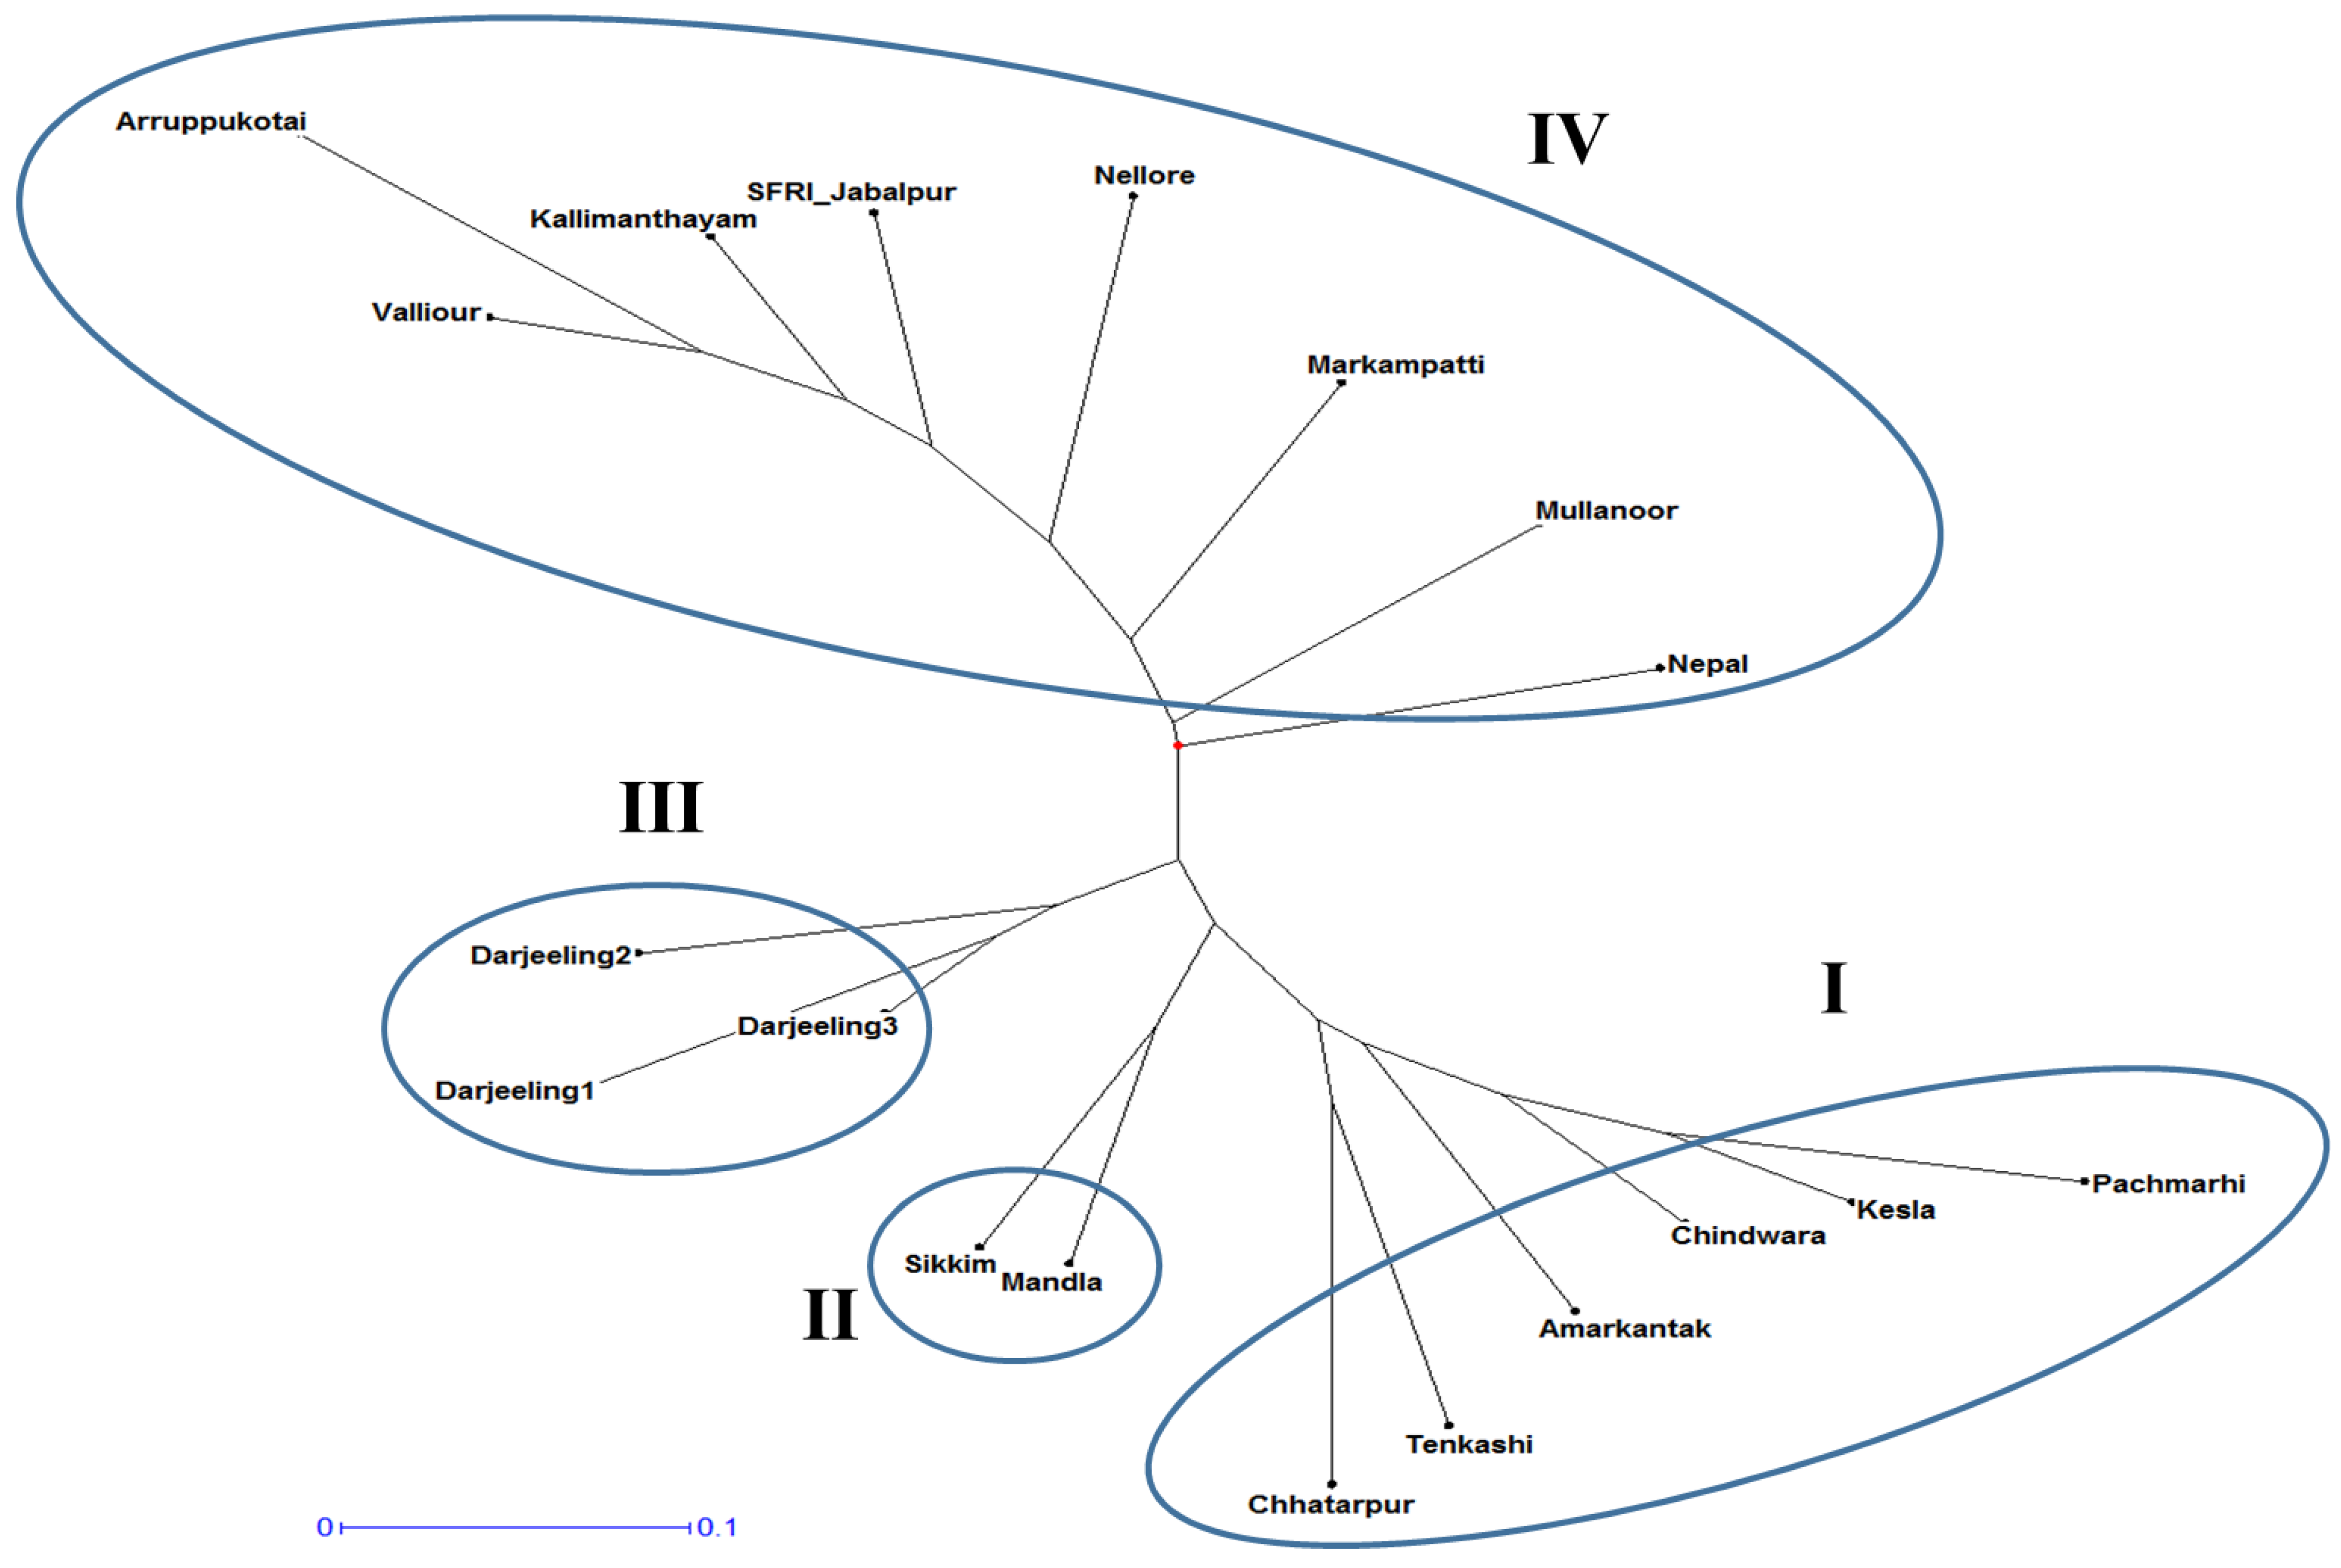
Clustering analysis based on the 20 morphological traits grouped 19 Gloriosa accessions into two main clusters and four sub-clusters. Cluster analysis showed that 19 Gloriosa accessions exhibited notable genetic divergence in terms of morphological traits. Group I consisted of six accessions. Group II consisted of two accessions, Group III had three, and Group IV had eight accessions (Figure 2). The wild accessions from Madhya Pradesh belonging to Chattarpur, Amarkantak, Chindwara, Kesla, and Amarkantak also belonged to Group I.
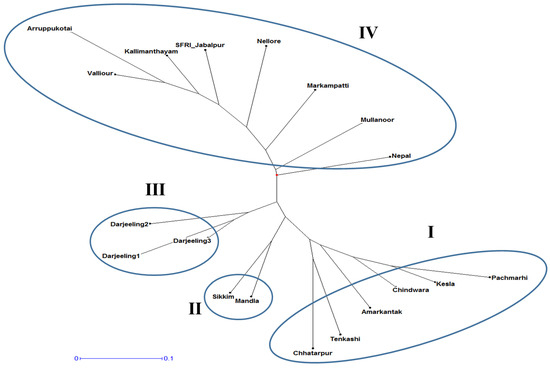
Figure 2.
Clustering analysis based on the 20 morphological traits of the 19 Gloriosa superba accessions using DARwin.
3.1.2. Principal Component Analysis (PCA) and Phenotypic Correlations
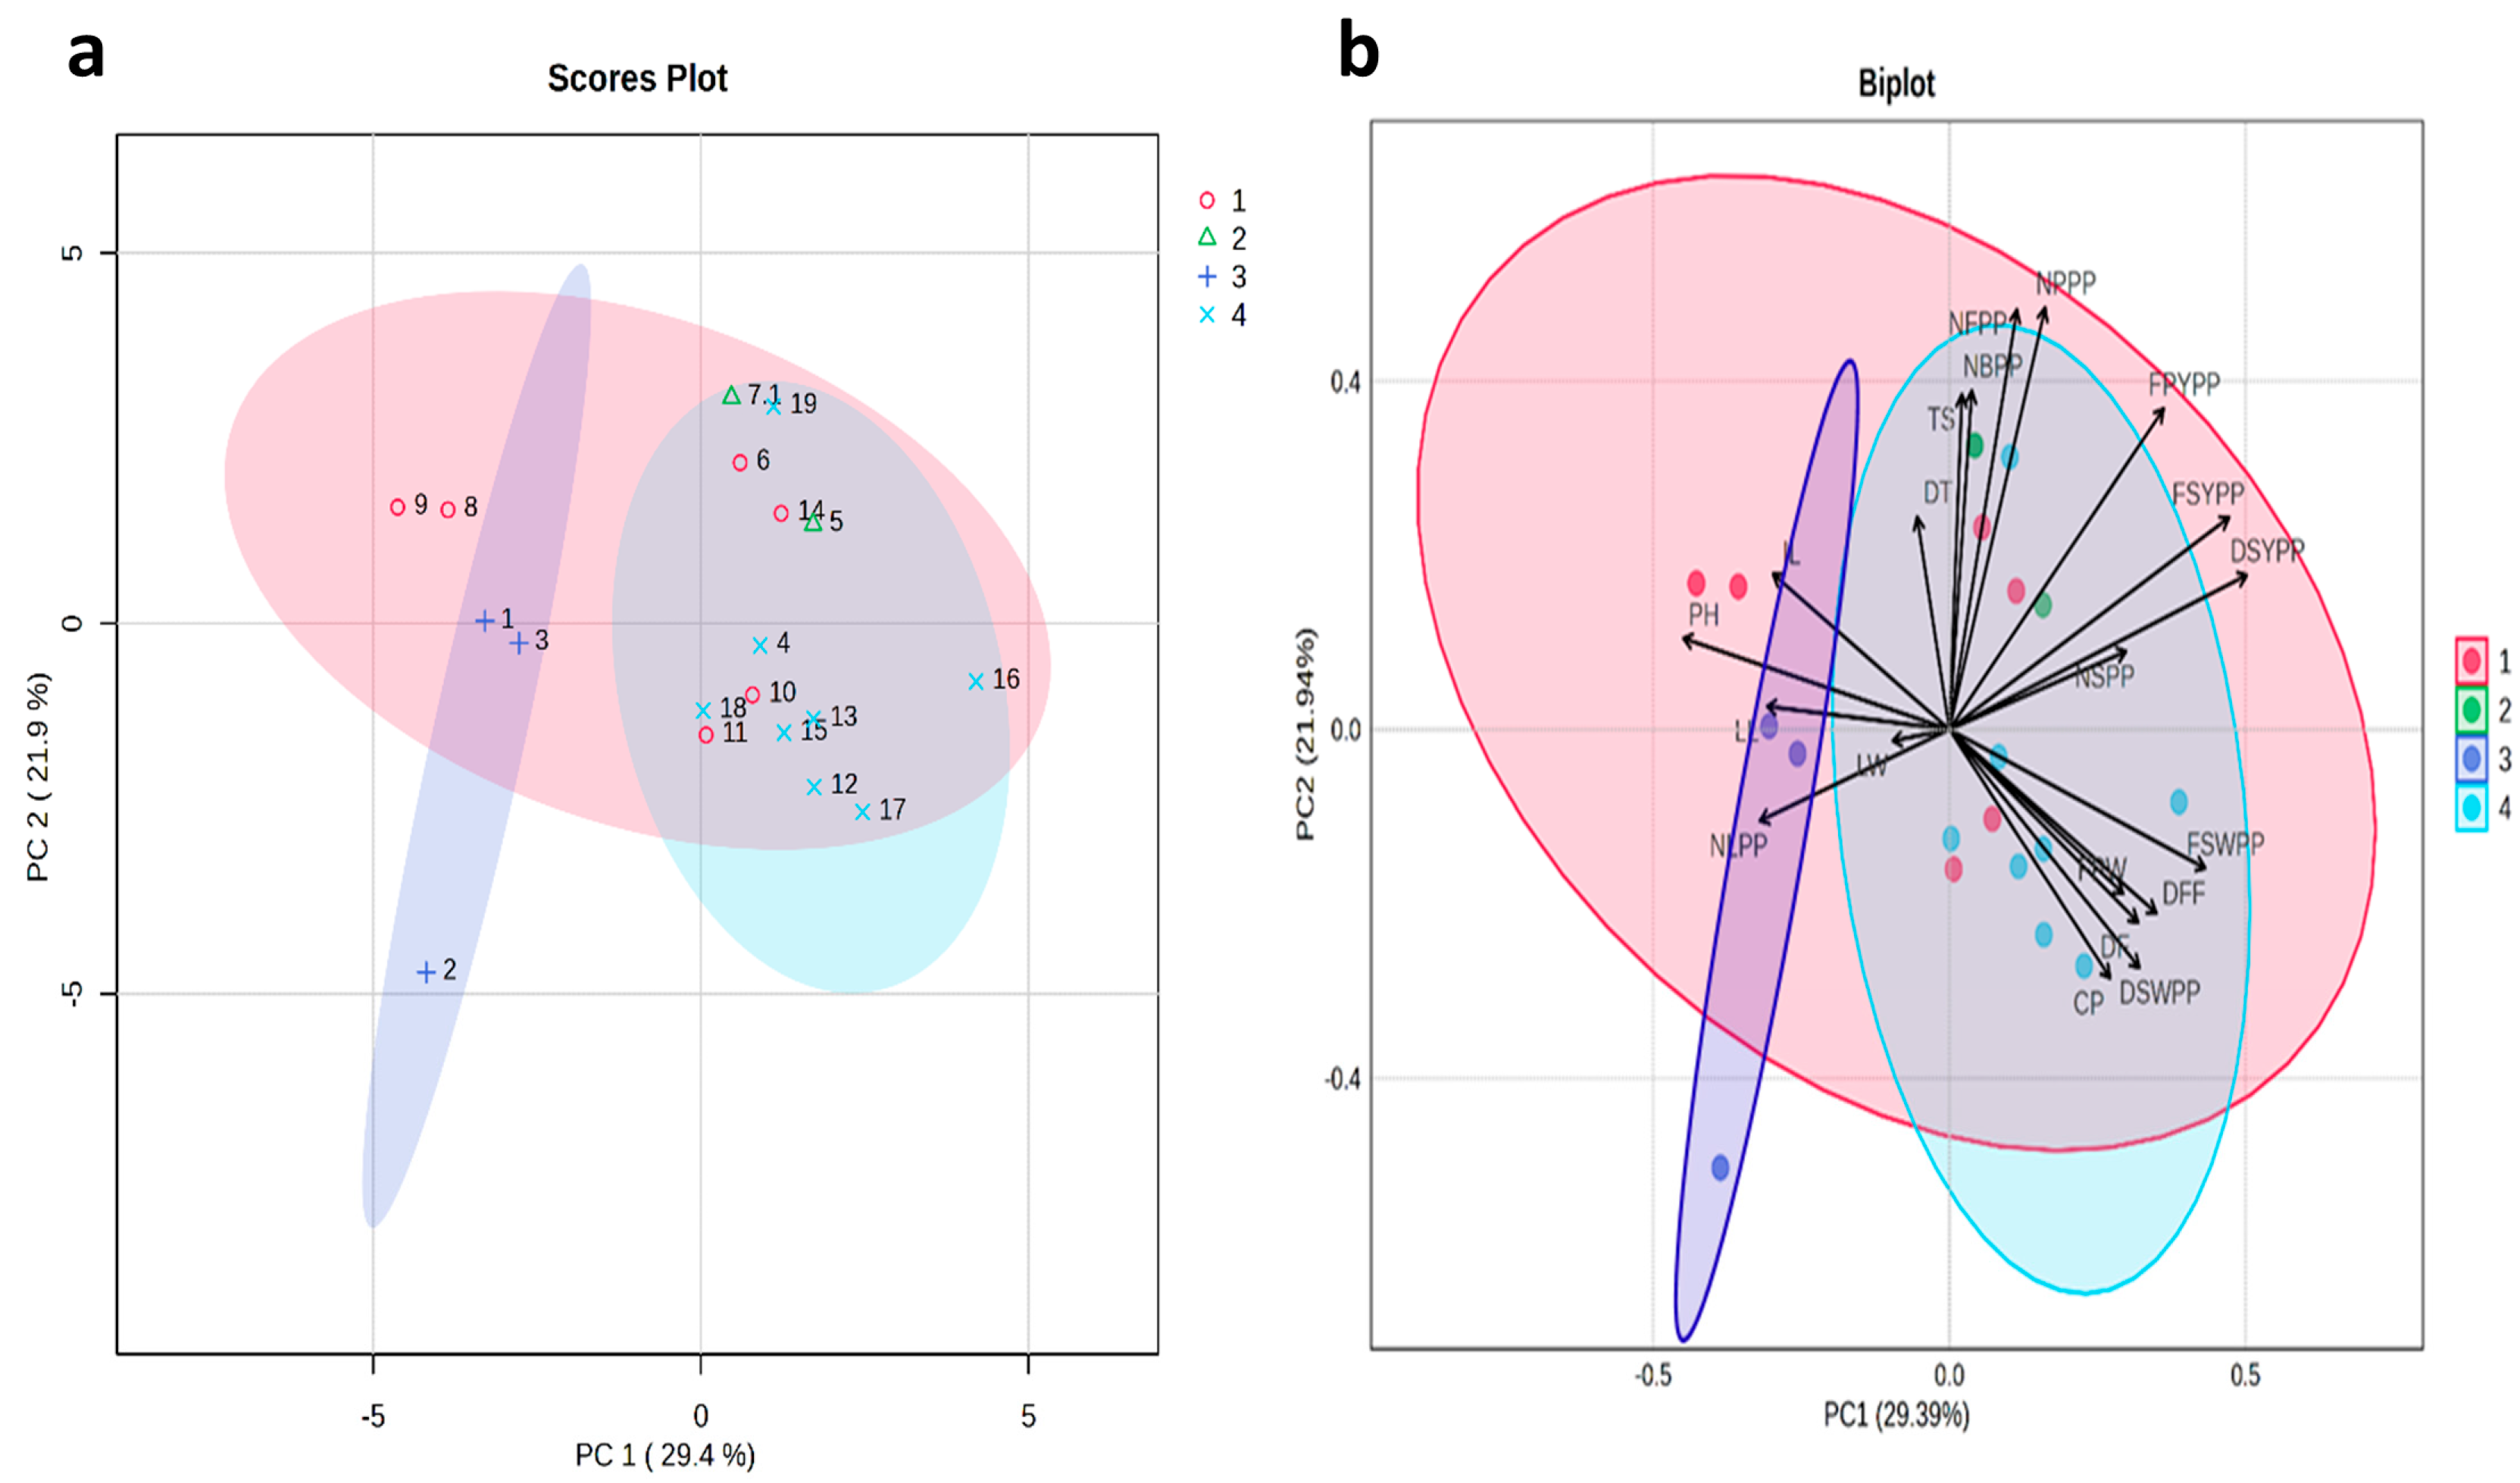
The principal component analysis for the phenotypic correlation of all the morphological traits is represented in a score plot and biplot (Figure 3). The results of principal component analysis (PCA) showed that the eigenvalues ranged from 1.96 to 3.46, which cumulatively accounted for 51.33% of the phenotypic variation. PC1 represented 29.4% of the total variation, whereas PC2 represented 21.9% of the total variation. According to Girgel (2021), the vector direction indicates positive and negative relationships between the descriptors and the vector length of the trait indicates the magnitude of its influence on the dependent character [31]. The vectors for the traits such as number of flowers per plant and the number of pods per plant were the longest, indicating that these traits had a greater effect on the variation (Figure 3); however, leaf width was the shortest, indicating a lesser effect on the variation. Additionally, traits like DT, TS, NFPP, NBPP, NPPP, FPYPP, FSYPP, DSYPP, and NSPP all have the same directions on the upper part of the figure, indicating positive correlations among them. In contrast, traits such as FSWPP, DFF, FPW, DF, DSWPP, and CP share the same directions and exhibit positive correlations on the lower part. These results are consistent with the values of the phenotypic correlation coefficients of the 20 traits of G. superba.

Figure 3.
Principal component analysis (PCA) (a) scores plot and (b) biplot, clarifying the distribution of morphological and biochemical traits in the first principal component and second principal component. Color indicates 4 sub-clusters. PH: plant height (cm), NLPP: number of leaves per plant, NBPP: number of branches per plant, DF: days to flowering, DFF: days to fifty percent flowering, NFPP: number of flowers per plant, NPPP: number of pods per plant, NSPP: number of seeds per pod, FPW: fresh pod weight (g), FSW: fresh seed weight per pod (g), FPYPP: fresh pod yield per plant (g), FSYPP: fresh seed yield per plant (g), DSWPP: dry seed weight per pod (g), DSYPP: dry seed yield per plant (g), LL: leaf length (cm), LW: leaf width (cm), IL: internodal length (cm), TS: tuber size (cm), DS: diameter of tuber (cm), and CP: colchicine (%). Numbers (1–19): Gloriosa accessions as mentioned in Table 1.
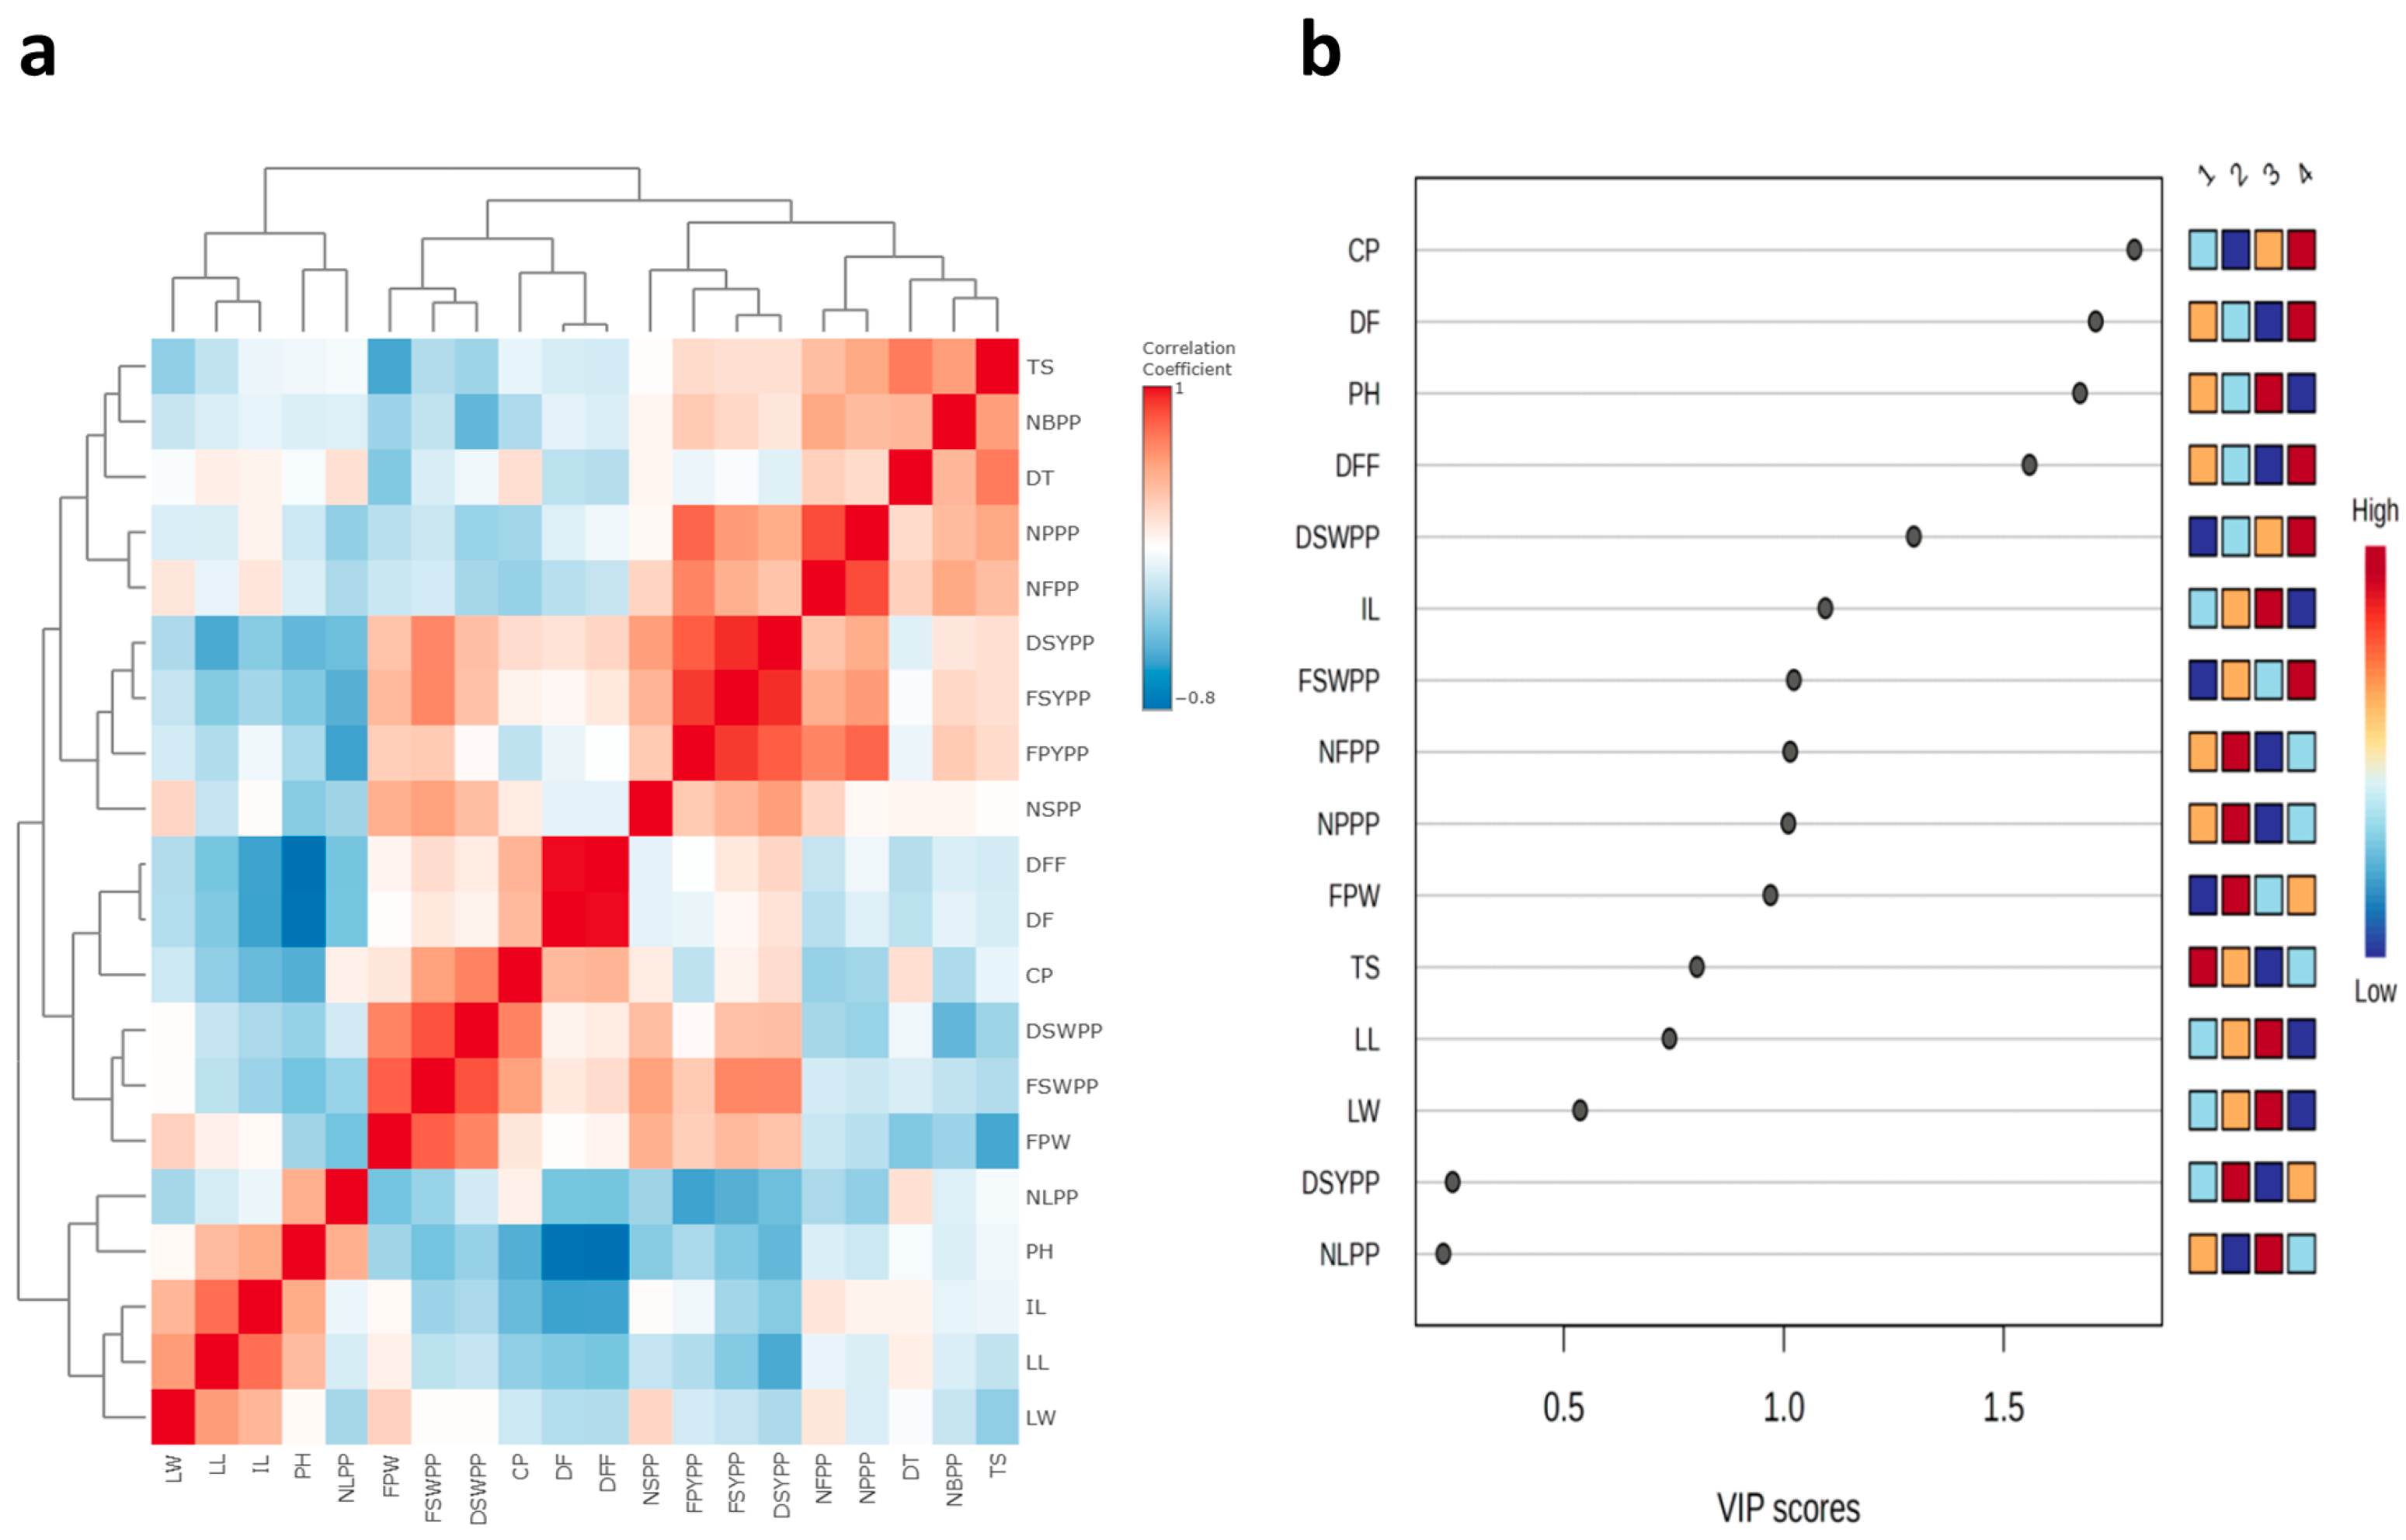
There were strong positive correlations between number of branches per plant, number of seeds per pod, dry seed yield per plant, number of leaves per plant, fresh seed yield per plant, fresh pod yield per plant, tuber size, tuber diameter, number of flowers per plant, and number of pods per plant (Figure 4a and Table S1). The PLS-DA VIP plot identified colchicine (highest VIP score) as the most important features that contribute to the separation of different groups (Figure 4b). Positive correlations were also observed between fresh pod weight, fresh seed weight per pod, days to fifty percent flowering, days to flowering, dry seed weight per pod, and colchicine content, as well as between leaf width, leaf length, and internodal length (Table S1).

Figure 4.
(a) Correlation heatmap and (b) Variable Importance in Projection (VIP) plot of the 20 morphological and biochemical traits.
The dissimilarity coefficient values were calculated from the morphological data of 19 G. superba accessions across 20 different traits. Dissimilarity coefficient values ranged from 0.1691 to 0.8145. The highest dissimilarity of 81.45% was observed between the accessions from Arrupukottai and Pachmarhi, followed by Valliour and Pachmarhi (71.84%), and Kesla and Arrupukottai (71.1%), indicating that these ecotypes are distantly related. The lowest dissimilarity was observed between Darjeeling 2 and Darjeeling 3 (16.9%) and Kesla and Pachmarhi (18.12%) (Table S2).
3.2. SSR Analysis and Polymorphism Study
A total of 200 EST-SSRs were used for genotyping the 19 accessions of Gloriosa superba. Of these, 88 primers showed no amplification, while nearly all of the amplified primers exhibited polymorphism. The list of selected primers, along with their sequences, is provided in Table S3. SSR analysis using 112 SSR markers across the 19 G. superba accessions revealed a high level of polymorphism. The primer product sizes ranged from 180 bp to 278 bp. The mean heterozygosity index (H) was 0.277, with values ranging from 0 to 0.589. The Polymorphic Information Content (PIC) values for individual SSRs ranged from 0.26069 in RGM-51635 to 0.4534 for RGM-24219 (Table 4). The gel profile of RGM6975 and RGM8588 of 19 accessions are presented in Figure S2.
Table 4.
SSR marker information and genetic diversity among the 19 G. superba accessions.
3.2.1. Similarity Matrix
The genotypic data of 112 SSR primers from the 19 accessions of G. superba were used to obtain the similarity coefficient values. These values ranged from 0.02 to 0.1515. The highest similarity of 15.15% was observed between accessions 1 (Darjeeling 1) and 2 (Darjeeling 2), followed by accessions 18 (Markampatti) and 19 (Mulanur), 17 (Kallimanthayam) and 18 (Markampatti), and 12 (Jabalpur) and 13 (Nellore) (Table S4).
3.2.2. Cluster Analysis
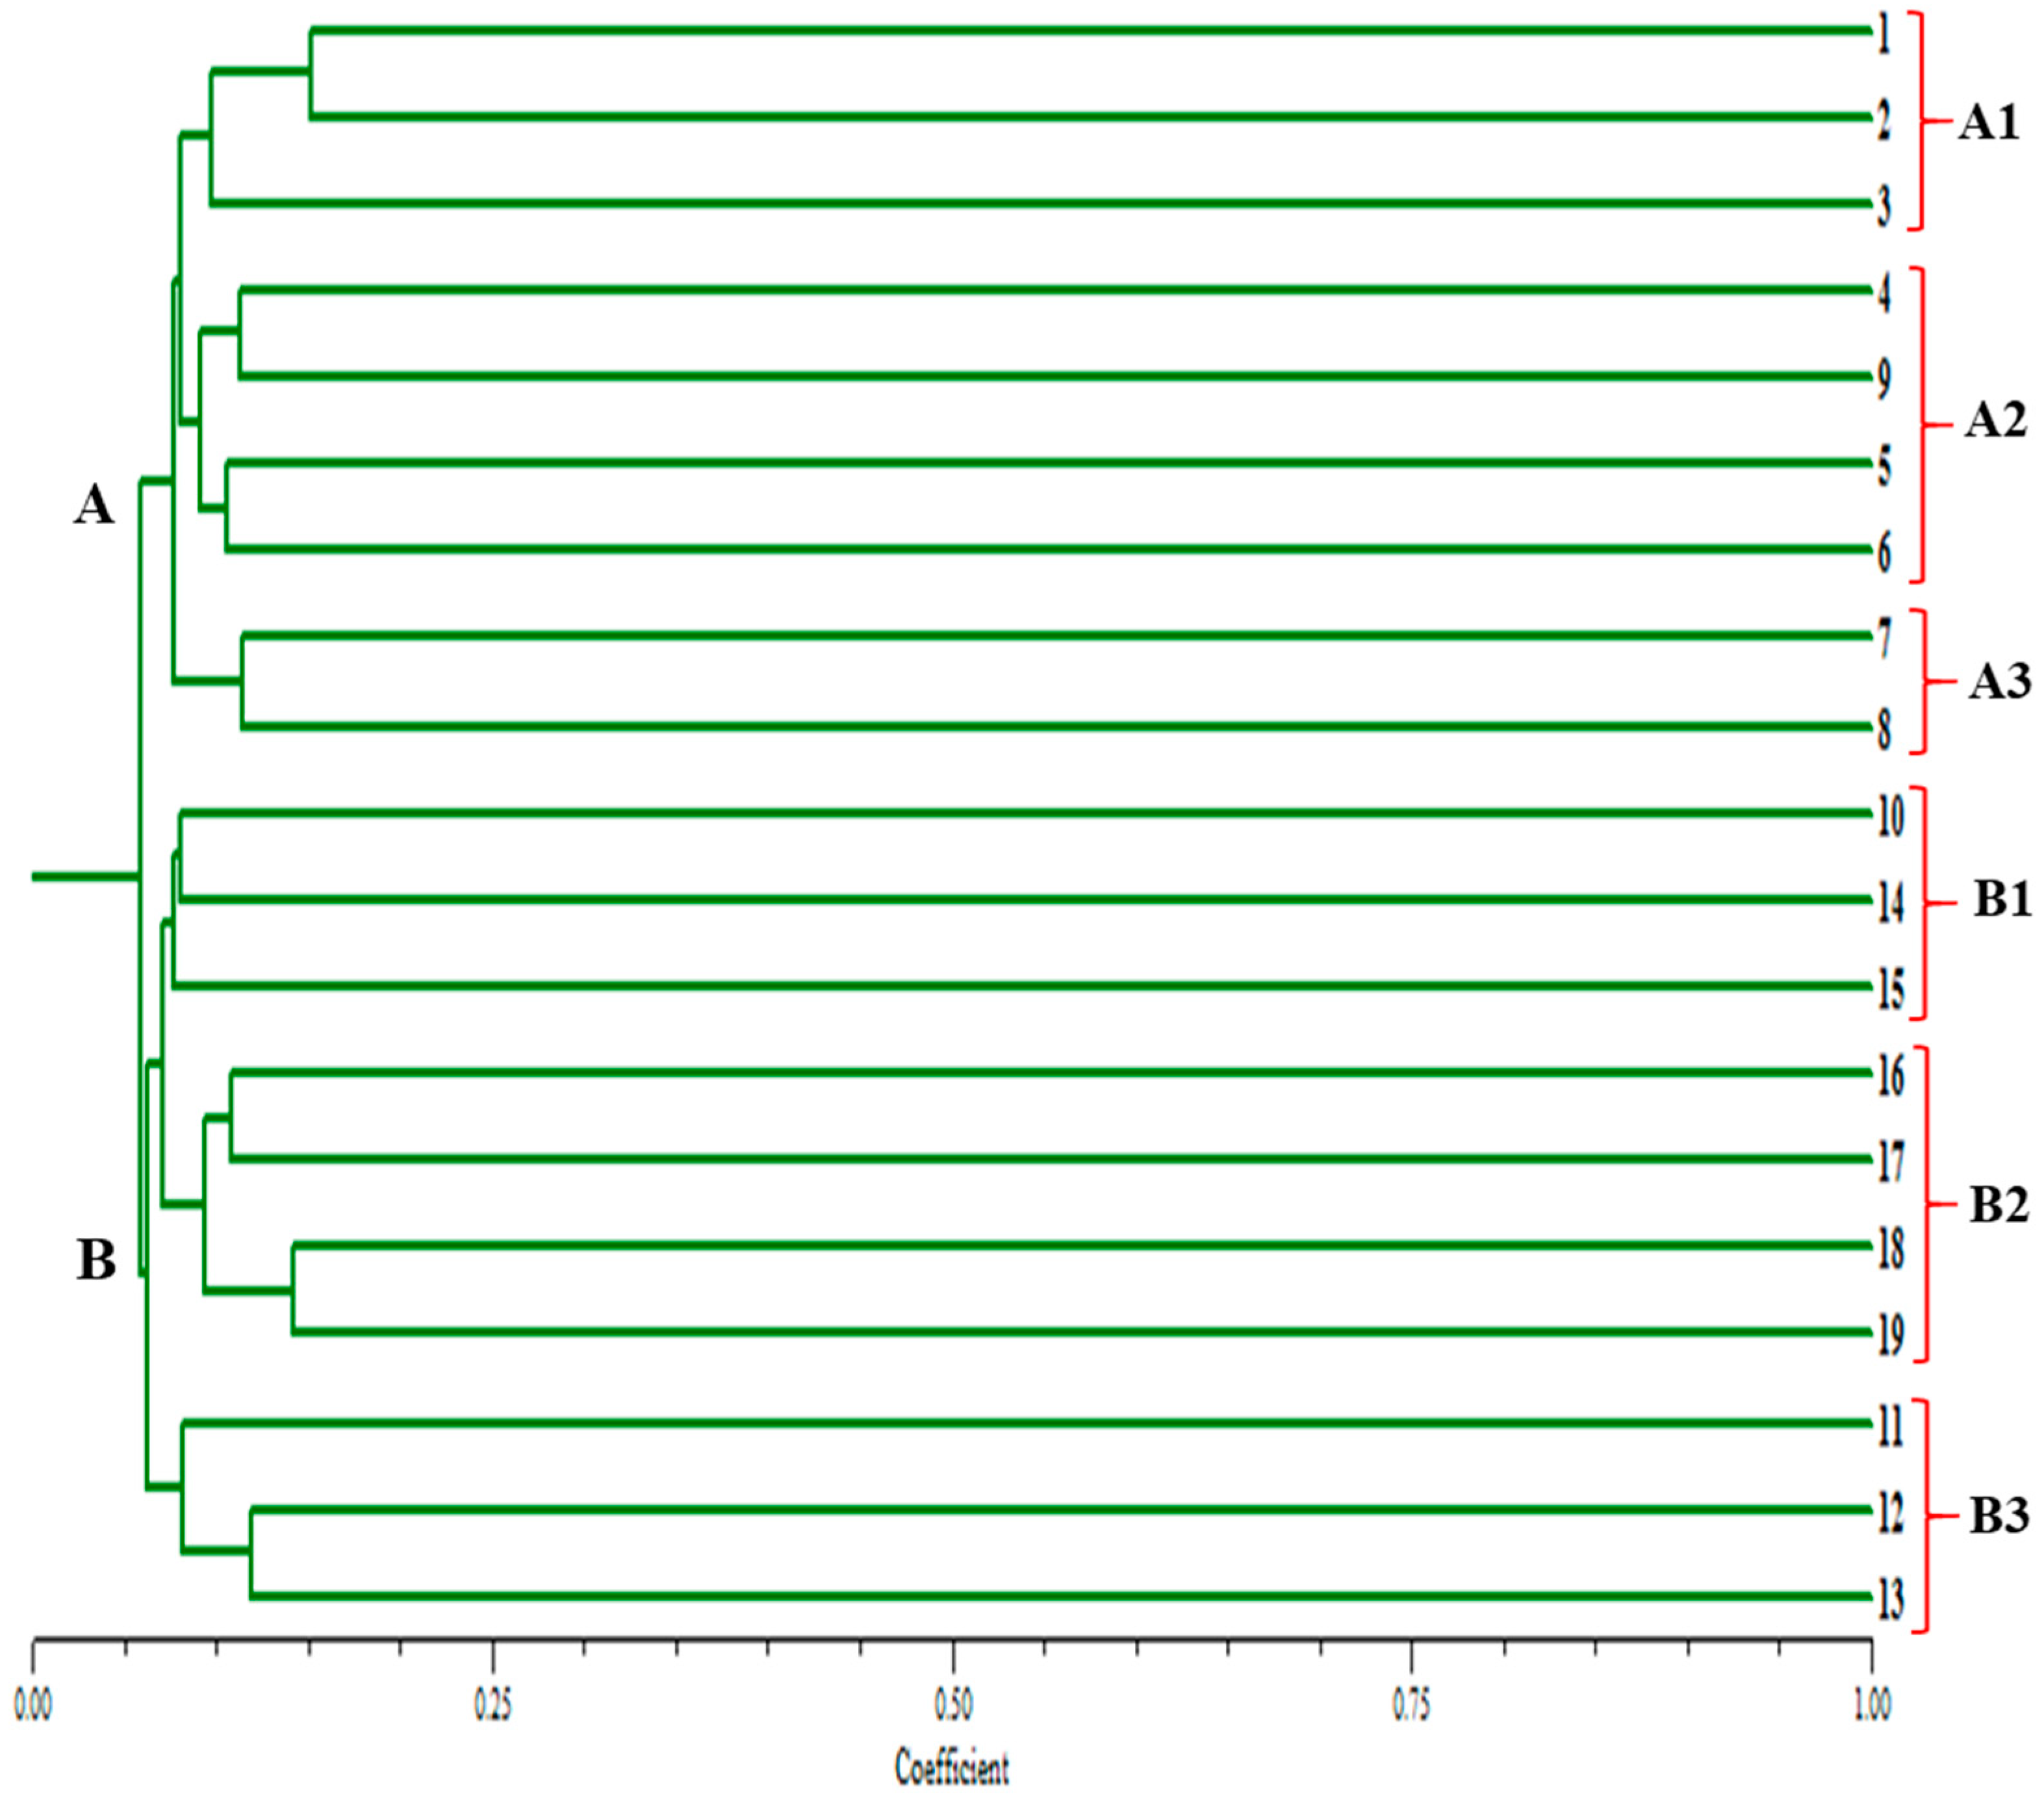
A dendrogram was constructed based on the similarity coefficient values of the 19 Gloriosa accessions, which were grouped into two major clusters, A and B (Figure 5). Group A consists of nine accessions, while Group B comprises 10 accessions. Group A was further divided into sub groups A1, A2, and A3, while group B was divided into subgroups into B1, B2, and B3. Subgroup A1 includes three accessions (Darjeeling 1, 2, and 3), A2 includes four accessions (Nepal, Sikkim, Chattarpur, and Kesla), and A3 consists of only two accessions (Mandla and Chindwara). Similarly, B1 comprises three accessions (Pachmarhi, Tenkashi, and Arruppukottai), B2 includes four accessions (Valliour, Kalimandyam, Markampatti, and Mullanur), and B3 consists of three accessions (Amarkantak, Jabalpur, and Nellore).
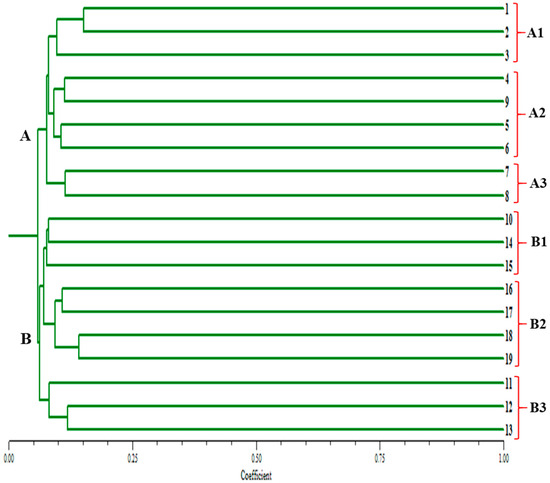
Figure 5.
Dendrogram showing the clustering pattern of 19 Gloriosa ecotypes based on similarity value obtained from SSR markers. (1–19)—Gloriosa ecotypes, as mentioned in Table 1.
3.2.3. Principal Component Analysis and SSR Markers
Principal component analysis based on the similarity values of 19 Gloriosa accessions clearly distinguished the accessions into two main groups, consistent with the results of the cluster analysis. PC1 accounted for 9.2% of the total variation, while PC2 accounted for 32.2% of the total variation. Among all 112 SSR markers used in this study, the SSR markers RGM-27384, RGM-79522, and RGM-67617 had the greatest impact on the variation (Figure 6).
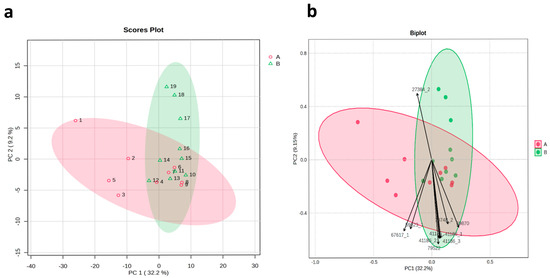
Figure 6.
Principal component analysis (PCA) (a) scores plot and (b) biplot, clarifying the distribution of SSR marker data in the first principal component and second principal component. Color indicates 2 clusters. (1–19): Gloriosa ecotypes, as mentioned in Table 1.
4. Discussion
Investigating genetic diversity in medicinal plants is crucial, as it provides valuable insights into the prevalent germplasms and helps environmentalists developing conservation strategies [32]. In recent years, biochemical and morphological characterizations of G. superba from various geographic locations have been reported [33,34]. Additionally, several researchers have studied the genetic diversity of G. superba using RAPD and ISSR markers [11,35]; however, more extensive research utilizing different genetic markers is needed for effective identification and the development of superior cultivars.
In this study, the genetic diversity of 19 G. superba accessions collected from various locations in India and Nepal was evaluated based on morphological traits, biochemical characteristics, and SSR markers. Significant variation in morphological traits was observed among these 19 ecotypes of G. superba, with the highest variability noted in plant height, number of leaves per plant, number of branches per plant, fresh pod yield per plant, fresh seed yield per plant, dry seed yield per plant, number of pods per plant, leaf width, and internodal length—indicating that these traits are highly influenced by environmental factors.
A recent diversity assessment of G. superba accessions from the Western Ghats of India revealed that seed yield per vine and dry seed weight per 100 seeds were the most diverse traits among the established accessions [11], which is consistent with our findings. While that study reported a coefficient of variation (CV) ranging from 7.97% to 45.39% for all studied traits, we observed a much broader CV range of 4.19% to 63.5%, suggesting a greater degree of variability. PCA identified the key variables integrated in PC1, including the number of pods per plant, number of flowers per plant, fresh pod yield per plant, fresh seed yield per plant, and dry seed yield per plant.
Strong positive correlations were observed among traits such as the number of branches per plant, number of seeds per pod, dry seed yield per plant, number of leaves per plant, fresh seed yield per plant, fresh pod yield per plant, tuber size, tuber diameter, number of flowers per plant, and number of pods per plant. Additionally, significantly positive correlations were reported for seed yield per vine and dry seed weight per 100 seeds with four vegetative and five yield-related traits in G. superba accessions from the Western Ghats of India [11], aligning with our findings.
Based on the results of the dissimilarity matrix calculated from the morphological data, our study identified the highest dissimilarity of 81.45% between accessions collected from Arrupukottai and Pachmarhi. Furthermore, the highest colchicine content was observed in the Tenkashi accession (0.642%) from Tamil Nadu, followed by Nellore (0.6205%) in Andhra Pradesh, as determined using HPTLC. In contrast colchicine quantification from the tubers of 50 wild and established accessions using liquid chromatography high-resolution mass spectrometry (LC-HRMS) revealed concentrations ranging from 0.040 to 0.138 mg/g in wild accessions and 0.038 to 0.135 mg/g in established accessions [11].
Due to their co-dominant nature, high reproducibility, elevated polymorphism levels, and transferability in allied plant species, SSRs are the preferred tool for plant breeders [36]. In our previous efforts, we developed large-scale EST SSRs through de novo transcriptome sequencing of G. superba, which are used in the current study for genetic diversity analysis. While several researchers have assessed genetic diversity in G. superba, none have explored SSR markers. Our study is the first to report genetic diversity analysis using EST SSR markers in this species.
Out of the 112 SSR markers used in this study, all exhibited polymorphism across the 19 G. superba accessions. This finding is higher than what has been previously reported for RAPD and ISSR markers [9,11,35]. The Polymorphic Information Content for individual SSRs ranged from 0.260 to 0.453, aligning with values reported earlier for RAPD (0.258 to 0.405) and ISSR (0.273 to 0.381) markers [35]. However, the mean expected heterozygosity index (H) in this study was 0.277, indicating limited genetic diversity, possibly due to inbreeding. Lower He values have been reported for ISSR markers in other plant species, like C. kwangtungensis (H = 0.243) [37], Commiphora wightii (H = 0.294) [38], and Allium sativum [39] (H = 0.2898).
The similarity coefficient values for the 19 G. superba accessions, based on genotyping data from 112 SSRs markers, ranged from 0.02 to 0.1515. In contrast, a previous genetic diversity study using ISSR markers on G. superba accessions collected from 16 different locations in Tamil Nadu reported similarity coefficient values ranging from 0.392 to 0.688 [40] significantly higher than those observed in our study.
In the dendogram constructed based on the similarity coefficient values of the 19 Gloriosa accessions, distinct accessions grouped within the same cluster share a high degree of similarity. The closer two accessions are positioned along the dendrogram’s branches, the higher their similarity, whereas accessions that are further apart are considered more distinct and dissimilar.
In our study, the 19 Gloriosa accessions were grouped into two main clusters: Group A (9 accessions) and Group B (10 accessions), based on genotypic data. Within these clusters, distinct subgroups were identified: A1 (Darjeeling 1, 2, and 3), A2 (Nepal, Sikkim, Chattarpur, and Kesla), A3 (Mandla and Chindwara), B1 (Pachmarhi, Tenkashi, and Arruppukottai), B2 (Valliour, Kalimandyam, Markampatti, and Mullanur), and B3 (Amarkantak, Jabalpur, and Nellore). These subgroups reflect a considerable range of genetic diversity, which can be leveraged for conservation efforts and plant breeding programs.
The genetic diversity of these distinct accessions allows breeders to select parental lines for crosses that may lead to the development of new varieties with improved traits, such as higher yield and increased colchicine content in G. superba. Additionally, the results of PCA revealed that PC1 accounted for 9.2% of the variation and PC2 explained 32.2% of the variation.
5. Conclusions
In conclusion, this study highlights significant morphological and biochemical variations among the 19 G. superba accessions collected from diverse geographical locations, including West Bengal, Nepal, Sikkim, Madhya Pradesh, Andhra Pradesh, and Tamil Nadu. Nine morphological traits namely plant height, number of leaves per plant, number of branches per plant, fresh pod yield per plant, fresh seed yield per plant, dry seed yield per plant, number of pods per plant, leaf width, and internodal length exhibited highest variations (CV ≥20%). The accession from Valliour, Tamil Nadu exhibited the highest seed yield, while the Tenkashi accession of Tamil Nadu recorded the highest colchicine content (0.6205%) in tubers. Molecular analysis using 112 SSR markers revealed substantial polymorphism but a relatively low heterozygosity index (H = 0.277) indicating low genetic diversity among the 19 accessions of G. superba. The distinct accessions identified through cluster analysis provide valuable genetic resources for breeders, enabling the selection of superior parental lines for developing high-yielding G. superba cultivars with enhanced colchicine content. These findings contribute to the conservation and genetic improvement of this medicinally significant species.
Supplementary Materials
The following supporting information can be downloaded at: https://www.mdpi.com/article/10.3390/horticulturae11070723/s1, Figure S1: Representative HPTLC chromatogram for the extracted colchicine from Gloriosa superba showing retention time of 0.8 min; Figure S2: Representative gel pictures showing polymorphism for primers; Table S1: Phenotypic correlation coefficients among 20 morphological traits in the 19 Gloriosa accessions; Table S2: Dissimilarity matrix based on phenotypic data of the 19 Gloriosa accessions; Table S3: Details of primers used in the genotyping of the 19 Gloriosa accessions; Table S4: Similarity matrix based on genotypic data of the 19 Gloriosa accessions.
Author Contributions
Conceptualization, M.M.; data curation, M.M.; formal analysis, M.M., R.A., and S.P.S.; funding acquisition, M.M.; investigation, M.M. and R.A.; methodology, M.M.; resources, M.M. and S.P.S.; software, M.M. and R.A.; supervision, A.T. and J.-J.K.; project administration, M.M.; validation, M.M.; visualization, M.M.; writing—original draft, M.M. writing—review and editing, M.M. and R.A. All authors have read and agreed to the published version of the manuscript.
Funding
This research was funded by Department of Biotechnology, Ministry of Science and Technology, grant number: DBT BIOCARE, BT/PR18366/BIC/101/179/2016.
Data Availability Statement
The original contributions presented in this study are included in the article/Supplementary Material. Further inquiries can be directed to the corresponding author(s).
Conflicts of Interest
The authors declare no conflicts of interest.
References
- Padmapriya, S.; Rajamani, K.; Sathiyamurthy, V. Glory Lily (Gloriosa superba L.)—A Review. Int. J. Curr. Pharm. Rev. Res. 2015, 7, 43–49. [Google Scholar]
- Ghosh, S.; Ghosh, B.; Jha, S. Polymorphism in Gloriosa superba. Plant Genet. Resour. 2009, 7, 9–15. [Google Scholar] [CrossRef]
- Rajadurai, K. Enhancing the Bio Productivity of Gloriosa superba L. through Mutatic Genetic Manipulation. Ph.D. Thesis, Tamil Nadu Agricultural University, Coimbatore, India, 2001. [Google Scholar]
- Selvarasu, A.; Rajamani, K. Analysis of Variability, Correlation and Path Coefficients in Induced Mutants of Glory Lily (Gloriosa superba L.). Int. J. Plant Breed. 2013, 7, 69–75. [Google Scholar]
- Das, M.; Prakash Sahu, S.; Tiwari, A. De novo Transcriptome Assembly and Mining of EST-SSR Markers in Gloriosa superba. J. Genet. 2020, 99, 77. [Google Scholar] [CrossRef]
- Liang, Y.; Gao, Q.; Li, F.; Du, Y.; Wu, J.; Pan, W.; Wang, S.; Zhang, X.; Zhang, M.; Song, X.; et al. The Giant Genome of Lily Provides Insights into the Hybridization of Cultivated Lilies. Nat. Commun. 2025, 16, 45. [Google Scholar] [CrossRef] [PubMed]
- Chitra, R.; Rajamani, K. Evaluation of Different Glory Lily (Gloriosa superba L.) Genotypes for Vegetative, Floral and Yield Characters. Agric. Sci. Dig. 2009, 29, 190–193. [Google Scholar]
- Arun Kumar, P.; Elangaimannan, R. Evaluation of Gloriosa superba for Yield Attributing Characters and Quantification of Colchicine Originated from Different Agro Climatic Zones of Tamil Nadu and Andhra Pradesh. Int. J. Pharm. Clin. Res. 2017, 9, 183–192. [Google Scholar]
- Chitra, R.; Rajamani, K. Assessment of Genetic Diversity of Gloriosa superba L. Accessions Detected by Random Amplified Polymorphic DNA Analysis. J. Med. Plants Res. 2013, 7, 2122–2127. [Google Scholar] [CrossRef]
- Babu, V.; Pai, D.; Shaik, T.; Muthusamy, A.; Satyamoorthy, K. Low Intraspecific Diversity Suggesting Genetic Drift in Gloriosa superba L. (Liliaceae) in Konkan Coast of Karnataka, India. Ann. Plant Sci. 2013, 2, 524–531. [Google Scholar]
- Mahajan, Y.A.; Shinde, B.A.; Mulani, F.A.; Gade, A.B.; Kasodekar, A.K.; Thulasiram, H.V.; Kadoo, N.Y.; Nikam, T.D. Diversity Assessment of Gloriosa superba Accessions from Western Ghats of India Based on Morphological Traits, ISSR Markers and Metabolite Content. J. Appl. Res. Med. Aromat. Plants 2022, 30, 100388. [Google Scholar] [CrossRef]
- Fang, H.; Guo, Q.; Shen, H.; Li, Y. Genetic Diversity Evaluation of Chrysanthemum Indicum L. by Medicinal Compounds and Molecular Biology Tools. Biochem. Syst. Ecol. 2012, 41, 26–34. [Google Scholar] [CrossRef]
- Kremer, D.; Bolarić, S.; Ballian, D.; Bogunić, F.; Stešević, D.; Karlović, K.; Kosalec, I.; Vokurka, A.; Vuković Rodríguez, J.; Randić, M.; et al. Morphological, Genetic and Phytochemical Variation of the Endemic Teucrium arduini L. (Lamiaceae). Phytochemistry 2015, 116, 111–119. [Google Scholar] [CrossRef]
- Fang, M.-F.; Li, J.; Zhou, T.-H.; Yang, J.; Zhao, G.-F. Genetic Diversity in Natural Populations of the Medicinal Herb Polygala Tenuifolia Willd. and Its Implications for Conservation. Biochem. Syst. Ecol. 2012, 44, 400–406. [Google Scholar] [CrossRef]
- Falconer, D. Introduction to Quantitative Genetics; Pearson Education: Noida, India, 1996. [Google Scholar]
- Liu, C.-H.; Liu, T.-S.; Luo, C.-Q.; Zhang, J.; Zeng, X.-Y.; Cui, L.; Xie, L.-J. Determination of Forsythiaside B and Poliumoside in Different Origin and Parts from Callicarpa Kwangtungensis. Zhongguo Zhong Yao Za Zhi 2013, 38, 3324–3326. [Google Scholar] [PubMed]
- Liu, G.-D.; Chen, G.-L.; Li, W.; Li, C.-X. Genetic and Phytochemical Diversities of Cynomorium Songaricum Rupr. in Northwest China Indicated by ISSR Markers and HPLC-Fingerprinting. Biochem. Syst. Ecol. 2013, 48, 34–41. [Google Scholar] [CrossRef]
- Fadaei Heidari, E.; Rahimmalek, M.; Mohammadi, S.; Hossein Ehtemam, M. Genetic Structure and Diversity of Ajowan (Trachyspermum ammi) Populations Based on Molecular, Morphological Markers, and Volatile Oil Content. Ind. Crops Prod. 2016, 92, 186–196. [Google Scholar] [CrossRef]
- Tiwari, V.; Meena, B.; Nair, K.N.; Upreti, D.K.; Tamta, S.; Rana, T.S. Assessment of Genetic Diversity and Population Structure of Bergenia stracheyi (Saxifragaceae) in the Western Himalaya (India). Biochem. Syst. Ecol. 2017, 70, 205–210. [Google Scholar] [CrossRef]
- Zheng, P.; Zhang, K.; Wang, Z. Genetic Diversity and Gentiopicroside Content of Four Gentiana Species in China Revealed by ISSR and HPLC Methods. Biochem. Syst. Ecol. 2011, 39, 704–710. [Google Scholar] [CrossRef]
- Tomar, R.S.; Parakhia, M.V.; Rathod, V.M.; Thakkar, J.R.; Padhiyar, S.M.; Thummar, V.D.; Dalal, H.; Kothari, V.V.; Kheni, J.; Dhingani, R.M.; et al. Molecular Mapping and Identification of QTLs Responsible for Charcoal Rot Resistance in Castor (Ricinus communis L.). Ind. Crops Prod. 2017, 95, 184–190. [Google Scholar] [CrossRef]
- Hayashi, T.; Yoshida, K.; Sano, K. Formation of Alkaloids in Suspension-Cultured Colchicum Autumnale. Phytochemistry 1988, 27, 1371–1374. [Google Scholar] [CrossRef]
- Porebski, S.; Bailey, L.G.; Baum, B.R. Modification of a CTAB DNA Extraction Protocol for Plants Containing High Polysaccharide and Polyphenol Components. Plant Mol. Biol. Report. 1997, 15, 8–15. [Google Scholar] [CrossRef]
- Ogunkanmi, L.A.; Ogundipe, O.T.; Ng, N.Q.; Fatokun, C.A. Genetic Diversity in Wild Relatives of Cowpea (Vigna unguiculata) as Revealed by Simple Sequence Repeats (SSR) Markers. J. Food Agric. Environ. 2008, 6, 132–137. [Google Scholar]
- Devi, K.D.; Punyarani, K.; Singh, N.S.; Devi, H.S. An Efficient Protocol for Total DNA Extraction from the Members of Order Zingiberales- Suitable for Diverse PCR Based Downstream Applications. SpringerPlus 2013, 2, 669. [Google Scholar] [CrossRef] [PubMed]
- Pacheco, A.; Rodriguez, F.; Alvarado, G.; Crossa, J.; Burgueno, J. ADEL-R, Version 2.0; Analysis and Design of Experiments with R for Windows; International Maize and Wheat Improvement Center (CIMMYT): Mexico City, Mexico, 2017. [Google Scholar]
- Tsilanizara, A.; Diop, C.M.; Nimal, B.; Detoc, M.; Lunéville, L.; Chiron, M.; Huynh, T.D.; Brésard, I.; Eid, M.; Klein, J.C.; et al. DARWIN: An Evolution Code System for a Large Range of Applications. J. Nucl. Sci. Technol. 2000, 37, 845–849. [Google Scholar] [CrossRef]
- Pang, Z.; Xu, L.; Viau, C.; Lu, Y.; Salavati, R.; Basu, N.; Xia, J. MetaboAnalystR 4.0: A Unified LC-MS Workflow for Global Metabolomics. Nat. Commun. 2024, 15, 3675. [Google Scholar] [CrossRef]
- De Mendiburu, F.; Simon, R. Agricolae—Ten Years of an Open Source Statistical Tool for Experiments in Breeding, Agriculture and Biology. PeerJ PrePrints 2015, e1404v1. [Google Scholar]
- Rohlf, F.J. NTSYS-Pc Numerical Taxonomy and Multivariate Analysis System; Version 2.0; Applied Biostatistics Inc.: Setauket, NY, USA, 1992. [Google Scholar]
- Girgel, U. Principle Component Analysis (PCA) of Bean Genotypes (Phaseolus vulgaris L.) Concerning Agronomic, Morphological and Biochemical Characteristics. Appl. Ecol. Environ. Res. 2021, 19, 1999–2011. [Google Scholar] [CrossRef]
- Sharma, R.S.; Vaidya, N.; Maloo, S.R.; Kumar, A.; Sharma, S.; Ramkrishnan, R.S.; Kumari, V. Application of Molecular Markers in Assessment of Genetic Diversity of Medicinal Plants. In Molecular Marker Techniques; Springer Nature: Singapore, 2023; pp. 103–116. [Google Scholar]
- Sharma, S.; Sharma, Y.P.; Thakur, P. Quantification of Colchicine in Different Parts of Gloriosa superba L. Int. J. Chem. Stud. 2017, 5, 147–149. [Google Scholar]
- Uchimahali, J.; Jebamalar, A.; Duraikannu, G.; Thirumal, S. Phytochemical Analysis and Evaluation of Antimicrobial Activity in the Whole Plant Extracts of Gloriosa superba. Asian J. Pharm. Clin. Res. 2019, 12, 245–249. [Google Scholar] [CrossRef]
- Tilwari, A.; Sharma, R. Random Amplified Polymorphic DNA and Inter Simple Sequence Repeat Markers Reveals Genetic Diversity between Micro Propagated, Wild and Field Cultivated Genotypes of Gloriosa superba: An Endangered Medicinal Plant. Mol. Biol. Rep. 2021, 48, 2437–2452. [Google Scholar] [CrossRef]
- Parkash, C.; Kumar, S.; Singh, R.; Kumar, A.; Kumar, S.; Dey, S.S.; Bhatia, R.; Kumar, R. ‘Ogura’-Based ‘CMS’ Lines with Different Nuclear Backgrounds of Cabbage Revealed Substantial Diversity at Morphological and Molecular Levels. 3 Biotech 2018, 8, 27. [Google Scholar] [CrossRef] [PubMed]
- Fang, H.; Nie, W.; Zhu, P.; Liang, C.; Deng, S. Genetic Diversity in Callicarpa Kwangtungensis Chun. Based on Morphological, Biochemical and ISSR Markers. J. Appl. Res. Med. Aromat. Plants 2018, 10, 41–48. [Google Scholar] [CrossRef]
- Harish; Gupta, A.K.; Phulwaria, M.; Rai, M.K.; Shekhawat, N.S. Conservation Genetics of Endangered Medicinal Plant Commiphora Wightii in Indian Thar Desert. Gene 2014, 535, 266–272. [Google Scholar] [CrossRef] [PubMed]
- Chen, S.; Chen, W.; Shen, X.; Yang, Y.; Qi, F.; Liu, Y.; Meng, H. Analysis of the Genetic Diversity of Garlic (Allium sativum L.) by Simple Sequence Repeat and Inter Simple Sequence Repeat Analysis and Agro-Morphological Traits. Biochem. Syst. Ecol. 2014, 55, 260–267. [Google Scholar] [CrossRef]
- Sahana, K.S.; Gnanam, R.; Rajesh, S.; Rajamani, K. Evaluation of Genetic Diversity in Gloriosa superba L, an Endangered Medicinal Plant Using Molecular Marker. Int. J. Curr. Microbiol. Appl. Sci. 2019, 8, 2125–2134. [Google Scholar] [CrossRef]

Disclaimer/Publisher’s Note: The statements, opinions and data contained in all publications are solely those of the individual author(s) and contributor(s) and not of MDPI and/or the editor(s). MDPI and/or the editor(s) disclaim responsibility for any injury to people or property resulting from any ideas, methods, instructions or products referred to in the content. |
© 2025 by the authors. Licensee MDPI, Basel, Switzerland. This article is an open access article distributed under the terms and conditions of the Creative Commons Attribution (CC BY) license (https://creativecommons.org/licenses/by/4.0/).