Abstract
Soil analysis is used to estimate nutrient availability, but nutrient concentrations are not always related to yield in most fruit plants, including grapevines. Thus, additional multivariate mathematical models, such as the compositional nutrient diagnosis (CND), which takes into account leaves nutrient concentration, and yield, can contribute to estimating critical levels or sufficiency bands of elements, as well as to detect deficiency and/or excess of nutrients. The aim of the present study was to establish CND standards, and the critical level and sufficiency band of nutrients, in the grapevine Vitis vinifera L., grown in a subtropical climate region. Leaves were collected in 81 vineyards in the Campanha Gaúcha do Rio Grande do Sul region, Southern Brazil, and analyzed for macro- and micro-nutrient concentration. The yield of each vineyard was assessed. Grapevine nutritional status was calculated through the CND method. CND-r2 indices were effective in establishing the nutritional status of grapevines for macro- and micro-nutrients as sub-optimal, excessive, or balanced. The CND methodology established the critical level and sufficiency bands of nutrients more accurately than the current recommendations for grapevines. Multi-nutrient associations were more effective than the single nutrient determination in defining the threshold of a given nutrient that can reduce grapevine yield.
1. Introduction
Viticulture is a highly profitable agricultural activity, nevertheless, winegrowers’ financial sustainability depends on good yield and on the high quality of the harvested products. These features are determined by several factors, among them, plant nutritional balance and soil fertilization. Brazilian viticulture applies fertilizers and soil acidity correctives that account for 38% of expenses in crop inputs and for approximately 16% of costs in the total maintenance of producing grapevines (>4 years) [1]. Thus, there is high demand for methodologies to help winegrowers with soil corrective and fertilizer management, to achieve satisfactory grape, must, and wine yield, and quality [2].
Soil analysis is globally used to estimate nutrient availability; the recorded values are mainly related to culture growth and yield parameters [3,4]. However, it is essential carrying out leaf analysis for perennial fruit plants, such as grapevines, rather than soil analysis alone. This is because, compared with annual crops, trees overall record higher dry matter rates, accumulate more nutrients, and occupy a larger volume of soil [5,6]. Accordingly, fruit trees acquire some nutritional stability at the adult phase [7]. Owing to such a stability, the leaf composition diagnosis, allows adjustments of fertilization programs. In grapevines, leaf collection is suggested at full flowering or at berry veraison [8].
The compositional nutrient diagnosis method (CND) takes into account the association between a given nutrient and the geometric means of concentration, on a dry matter basis, recorded for the other nutrients (multivariable relations), including those that are not analytically determined. It is considered as the best way to express balance in plant tissue [9,10]. This technique was developed in Canada [9] and has been applied worldwide to several annual cultures such as beans, maize, rice, soybeans, tomato, and Aloe vera [11,12,13,14,15]. However, the methodology also has a potential high success in forest essences such as eucalyptus [16,17], and in fruit plants such as banana, orange, pear, mango, and guava trees [18,19,20,21]; but, it has not yet been applied to grapevines.
In 2018, Melo and collaborators [22], used the diagnosis and recommendation integrated system (DRIS) to determine normal nutrient ranges in vineyards in Southern Brazil. However, the DRIS values were not associated with yield. Thus, it became mandatory to apply other methods, such as the CND, that are more accurate in estimating normal nutrient ranges in grapevines, in order to find good association with yield. The compositional nutrient diagnosis method generates a correlation factor for any nutrient by adding all essential elements in a multi-nutrient analysis. It also enables attributing the same weight unbalance to deficiencies and excesses; such a factor can be detected by applying the Mahalanobis distance [23]. Besides, the CND methodology has only one standard deviation, and allows identifying and excluding atypical data (outliers), a fact that increases its reliability in result interpretation [18,23,24]. Consequently, this method can be applied to a database set for a single region, to establish an association between grapevine nutritional status and yield.
We hypothesized that it would be possible to generate a range of specific sufficiency for the type of Vitis vinifera grape. The aim of the current study was to use CND standards, to determine the critical level and sufficiency band of nutrients in Vitis vinifera L. grapes.
2. Materials and Methods
2.1. Data Collection
Eighty-one grapevines belonging to the species Vitis vinifera L. were selected in the Campanha Gaúcha do Rio Grande do Sul region, Southern Brazil, on the border of Uruguay (latitude 30°53′27″ S and longitude 55°31′58″ W; altitude 208 m). The varieties Cabernet Franc, Cabernet Sauvignon, Sauvignon Blanc, Merlot, Pinotage, Sémillon, and Tannat were grafted on SO4 (V. berlandieri × V. riparia). The mean age of each vineyard was 8 years. Vines were trained as in a spurred cordon with 3.00 m spacing between rows and 1.20 m between plants in the row. In all vineyards, soil was classified as Ultisols. Based on Köppen’s classification, the climate in the region was categorized as Cfa subtropical. The coldest months are June and July, when the mean minimum temperature is 8 °C and the mean maximum temperature is 17 °C. The warmest months are January and February, when the mean minimum temperature is 17 °C and the mean maximum temperature is 28 °C. Mean annual rainfall is 1.700 mm.
2.2. Evaluations and Analyses
Twenty-five grapevine leaves were collected in each vineyard in order to have a composite sample. Complete leaves (lamina + petiole) were picked on the opposite side to the first cluster of the fruit shoot at the beginning of the berry ripening (veraison) phase, based on the methodology recommended by CQFS (Comissão de Química e Fertilidade do Solo dos Estados do Rio Grande do Sul e Santa Catarina) [25]. Leaves were washed based on the following sequence: running water, deionized water and neutral detergent (0.1%) solution, deionized water and hydrochloric acid (0.3%) solution, and deionized water. Then, leaves were dried in forced air circulation oven at 60 °C ± 5 °C until constant mass, ground in a Willey type mill, and sieved in 0.841 mm mesh. The total concentrations of Nitrogen (N) were measured after digestion of 0.200 g of plant tissue sample with 2 mL of H2SO4 and 1 mL of H2O2, and progressively heated in a digester block (Tecnal, Micro 42, Piracicaba, Brazil) to 350 °C for 1 h. [26]. Nitrogen was extracted using sulfuric acid digestion and its determination was carried out in a steam Kjeldahl drag distiller (TE-0364, Tecnal, Piracicaba, Brazil) [27]. The concentrations of phosphorus (P), potassium (K), calcium (Ca), magnesium (Mg), copper (Cu), iron (Fe), manganese (Mn), and zinc (Zn) were measured after digestion of 0.250 g of tissue sample with 3 mL of HNO3 and 1 mL of HClO4 and progressively heated in a digester block (Tecnal, Micro 42, Piracicaba, Brazil) to 180 °C for 2 h [28]. In the extract, the concentrations of Ca, Mg, Cu, Zn, Fe, and Mn were determined by atomic absorption spectrophotometer (AAS; Perkin Elmer, Waltham, MA, USA, AAnalyst 200) [29]. The P concentration was determined through colorimetry, based on the methodology described by Murphy & Riley [30], in a spectrophotometer (SF325NM, Bel Engineering, Monza, Italy). The K concentration in the digested extract was determined in a flame photometer (B262 Micronal, São Paulo, Brazil). Finally, the concentration of boron (B) in the leaves was determined by burning 0.5 g of sample plant tissue in the muffle furnace (600 °C for 1 h). After cooling, we added 10 mL of 0.18M H2SO4, shook intermittently for 1 h, and let decant for 3 h. After, we removed 4 mL of the supernatant and added 4 mL of azomethine-H buffer, and performed the determination at 435 nm in a spectrophotometer (SF325NM, Bel Engineering, Monza, Italy) [31,32].
Yield was recorded from 20 grapevines, from each vineyard, by collecting all clusters at grape ripening, and weighing them.
2.3. Calculations
Gross data were collected in the real space between (−) infinite and (+) infinite. On the other hand, compositional data were strictly positive and provided relative information [33]. Leaf tissue compositional analysis is considered a 100% closed system, formed by known nutrients (N, P, K, etc.) and by unknown nutrients (other non-determined elements, carbohydrates, etc.) gathered in a term called R. This process forms an arrangement of d-dimensional nutrients; in other words, a simplex (Sd) deriving from the ratios of d+1 nutrients, with includes d elements and residual value (Rd) (Equation (1)):
wherein, N, P, K are the ratios of nutrients determined in the dry matter and Rd is calculated through difference (Equation (2)):
Nutrient ratios were turned into scale-invariant after they were divided through geometric mean (G) of d + 1 components, including [34] (Equation (3)):
Defining new variables (V) that undergo centered logarithmic transformation (natural or Neperian logarithm) is the way to express each simplex component in comparison to all others (interaction study), i.e., in comparison to the geometric mean of the observed values (Equation (4)):
and, for definition (Equation (5)),
Thus, only one standard deviation was taken into account, so a single relative position of each nutrient was found in relation to all others. The access to recent multivariate analysis instruments, such as the principal component analysis and the compositional analysis, was used as the leverage of variables VX.
The following step divided the database into two subpopulations (high and low yield) by using the Cate–Nelson procedure, since observations were classified in decreasing yield order. Khiari et al. [35] elucidated all the procedures used to establish the reference population.
Compositional nutrient diagnosis standards use means and standard deviations, that correspond to the VX relations of centered logarithmic transformation of d nutrients of high-yield specimens, i.e.,. and , respectively. The CND indices for d elements were calculated (Equation (6)):
wherein, and, are the mean and standard deviation of the X element in the high-yield subpopulation and is the CND index of the X element.
Independence between data is ensured by centered logarithmic transformation [33]. The CND indices were normalized and variables were made linear as dimensions in a circle (d + 1 = 2), in a sphere (d + 1 = 3), or in a big sphere (d + 1 > 3), in a dimensional space of d +1. The nutritional unbalance index was distributed as variable, if the CND indices were independently reduced variables (Equation (7)):
The r radius is computed in the CND nutrient index to feature each sample based on the global imbalance CND-r2.
Thus, 18 atypical results were excluded from the study (outliers) through Mahalanobis distance (D2) [23], applied to the database; 63 observations remained in the sample, they represented yield variation ranging from 22 to 0.4 t ha−1 (mean of 16 t ha−1 and standard deviation of 4 t ha−1). When calculating the Mahalanobis distance, the nutrient imbalance present in the reference population of the culture is dimensioned, allowing the identification of possible outliers before proceeding with the classification of the CND indices [23]. Gaussian data distribution (n = 63) was carried out prior to the analysis, as described by Hair et al. [36]. The normal distribution was taken into account for yield, as well as for the assessed nutrients by accepting Ho; in other words, data with normal distribution.
In order to find the sufficiency band of each nutrient, after the nutrient index (In) = 0 (break-even point = BP) was equated, (BPIn0) was added with (BPIn0) 2/3 of the standard deviation of nutrient contents in the reference population [37,38]. The critical level corresponds to the BP of the sufficiency ranges.
The limitation order was found based on the arithmetic average of the low-yield population indices recorded for each nutrient.
Statistical analyses were carried out in R software [39].
3. Results and Discussion
The database comprised 81 commercial vineyards focused on grape crops for wine production, it held yield results and leaf nutrient concentrations that have presented yield variations ranging from 69 to 0.4 t ha−1, a mean of 14 t ha−1, and a standard deviation of 12 t ha−1.
The correlation matrix was initially used to explore the results in order to assess the correlation and the appropriate coefficient of determination between isolated nutrient concentration and yield. Accordingly, it was possible to observe the influence of a single-nutrient leaf concentration on the concentration of other nutrients and/or grapevine yield. The present study was not capable of assessing, through univariate analysis, any significant correlation, with high determination coefficient (Table 1). Moreover, it is worth highlighting the low effectiveness of the concentration of a single nutrient on vine yield prediction [7].

Table 1.
Correlation between leaf nutrient concentration and grapevine yield (n = 63).
Remarkably significant correlations between nutrients and determination coefficient were observed between Ca and Mg, P and S, N and S, N and P, P and Mg (Table 1). These correlations between nutrients indicate that changes in the concentration of a given nutrient in the plant can consequently change the concentration of others [18,40]. This finding helps to explain why univariate correlations are not enough to justify the yield rates.
Reference population division was carried out based on Khiari et al. [35], whose nutritional diagnosis for the 63 vineyards presented a yield mean inflection point, at cumulative function of 11,111 kg ha−1. This value was applied to determine the reference high-yield subpopulation (N = 29) (Figure 1).
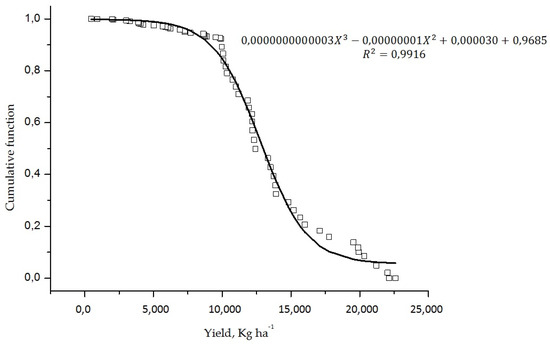
Figure 1.
Cumulative function of data of yield (kg ha−1) in vineyards (n = 63).
Among the 63 vineyards, only 29 (46%) presented grape yield higher than 11,180 kg ha−1 (first production after the inflection point), and these composed the high-yield subpopulation. The other 34 vineyards (54%) composed the low-yield subpopulation.
The division into high and low yield populations allowed observing that none of these populations (Table 2) exceeded the amount of correlation found in the complete database (Table 1). This outcome was expected, since observation partitions generated a smaller number of occurrences. Moreover, there was no positive correlation between a single nutrient and yield, even in the high-yield population; this finding evidences that the appropriate balance among all nutrients ensures higher yield. The main associations highlighted in the complete database (N = 63) remained significant due to population division into high and low yield (Table 2). They were also completed by the S-Cu association in the high-yield population and by the Ca-S association in the low-yield one.
Table 2.
Correlation between leaf nutrient concentrations and yield in high and low yield vineyards.
Population division into high and low yield did not ensure the safe indication of appropriate nutritional content bands.
It is possible to point out that the minimum, maximum, and mean values of nutrients in leaves assessed in the high and low yield populations (Supplementary Materials available, Table S1) did not show differences in their classification in the interpretation of appropriate nutrient concentration bands, based on Brunetto et al. [41]. In addition to the correlations between nutrients and yield (Supplementary Materials available, Table S1), the findings described above evidenced the need of using bi- or multivariate methods to diagnose nutritional status. It is so, because the average of nutrient concentrations in any of the assessed populations did not explain the yield rates recorded for the vineyards, but the ratio of each nutrient in regards to balance. It is also possible to highlight that all other nutrients had a normal interpretation, except for Mn and Zn, which showed excessive contents.
It was observed that the univariate indication does not properly represent the determination coefficients, not even the significant correlations (Table 2). The indication of association between the CND-r2 and the Mahalanobis distance in the reference population can be observed in Figure 2. This outcome evidenced that the longer the distance (D2), the greater the nutritional balance (CND-r2). Similar results were reported in a study on potato plants [42], where the reference population also showed a great nutritional imbalance (R2 = 0.34), showing that populations with adequate productivity may have the potential to improve further.
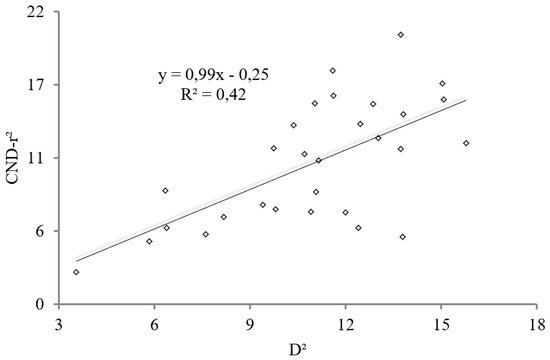
Figure 2.
Nutritional composition diagnosis (CND-r2) and Mahalanobis distance (D2) of the reference population (n = 29).
With regards to the present database, despite the high yields, there were nutritional disturbances, mostly because a significant part of observations were concentrated in the quadrant presenting the longest Mahalanobis distances (Figure 2). Thus, it is important to notice that winegrowers must make soil and leaf analyses on a yearly basis and compare the results to CND-r2 standards, although it is also possible to observe some unbalance in the reference population.
The CND technique generated standards and statistical parameters of CND indices for grapevines (Table 3). Thus, all samples can be compared to the standards, which comprise the mean and standard deviation of the high-yield population. This comparison generated indices to each nutrient.
Table 3.
Nutritional composition diagnosis (CND) standards of the reference population (n = 29).
It was possible to find IN, IP, IK, ICa, IMg, IS, IB, IFe, IMn, and IZn indices based on the mean concentration, recommended as appropriate for grapevines [41], and by analyzing the mean normal concentration in leaf samples to set appropriate standards (Table 3), assessed through CND standards. Results showed a CND-r2 = 63.72. Concentration of N, Fe, and Zn were underestimated under the herein tested conditions based on standards set for the CND method (Figure 3); in other words, by following the recommendations one would find a shortage of these elements in comparison to the high-yield population. On the other hand, the concentrations of some elements, such as K, Ca, Mg, and S, were overestimated (Figure 3); this outcome points out that the aforementioned recommendations may induce the excess of fertilization with these nutrients.
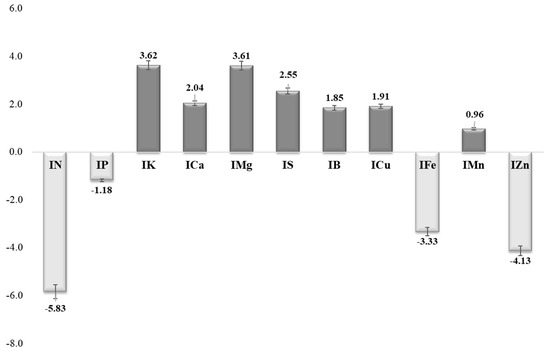
Figure 3.
Comparison between the mean concentrations recommended as appropriate for grapevines [34], and the nutritional unbalance index (CND-r2) of the reference population.
Similarly to the insertion of the mean concentration values recommended as appropriate to grapevines [41], which relies on the approximation of nutrient concentrations found through univariate experimentation, winegrowers can use this instrument by inserting leaf analysis of their vineyards, and accomplish evaluations in compliance with reality in their property. This process would allow the application of actually necessary nutrients through fertilization, which would enable high yield, decrease the potential of soil and water contamination [18], and ensure higher profitability, since it would allow the application of nutrients really demanded by grapevines.
There was highly significant correlation between the concentrations and indices of all nutrients (Table 4) and between CND-r2 index and yield in all vineyards, as showed by Pearson’s correlation coefficient (R2 = 0.006), with decreasing adjustment. Thus, nutrients all together only explain a little of the recorded yield; this outcome goes against that recorded by Nowaki et al., [14], who used CND in a tomato crop and found 0.17 adjustment. These contradictory outcomes likely happened because the assessed vineyards grew different cultivars [43]. This finding suggests specific standards for each cultivar.
Table 4.
Statistical models used to find critical nutrient levels among nutritional composition diagnosis (CND) indices set for different cultivars of Vitis vinifera.
Critical nutrient levels in grapevine leaves were similar to those observed by Melo et al. [22], (Table 5). The establishment of sufficiency bands allowed comparisons to the literature about the herein assessed culture (Table 5).
Table 5.
Normal ranges (appropriate levels) of nutrients in grapevine leaf samples (Vitis vinifera) in comparison to content recommendations based on Brazilian reports.
Compositional nutrient diagnosis standard levels were related to levels reported for grapevines grown in Rio Grande do Sul State [22,41], where the present study was carried out. They were also related to outcomes found by Quaggio and Raij [44], in São Paulo State, Brazil. There are great divergences about standards recommended in the handbook guiding the biggest grape producer state [41], on the appropriate contents of N, Ca, Mn, and Zn. The greatest divergences were observed in the bands of Mn and Zn concentrations. These elements derive from fungicide applications carried out to control and prevent leaf and cluster diseases [45]. However, they can also result from mineral fertilization, including contaminants, as well as organic fertilizers applied in vineyards as macro-nutrient source, mainly of N, P, and K [46,47].
Overall, the CND method showed nutritional band amplitude closer to that observed by Melo et al. [22]; however, it was smaller than that reported in the literature (Table 5). Serra et al. [48], considered the smallest amplitude band as positive information, because it allows greater accuracy to understand leaf content outcomes. This process reduces the possibility of dealing with low incomes, but it does not impair plant nutrition.
4. Conclusions
The CND-r2 indices were effective in establishing the Vitis vinifera grapevine cultivars nutritional status of N, P, K, Ca, Mg, B, Cu, Fe, Mn, and Zn as sub-optimal, excessive, or balanced concentrations. The CND methodology established the critical level and the appropriate nutrient bands in the current yield basis of Vitis vinifera grapevine cultivars. The multi-nutrient associations were more effective than the single nutrient analysis in expressing that the limitation of a given element can reduce Vitis vinifera grapevine cultivars yield.
Supplementary Materials
The following are available online at https://www.mdpi.com/2311-7524/6/3/56/s1.
Author Contributions
Data organization and analysis, B.V.d.P., D.E.R., E.M.H.d.S.; Field collection and laboratory analysis, E.T., C.M., L.O.S.d.S., A.T., L.D., F.N.d.O.; Writing, original draft preparation, B.V.d.P., D.E.R., E.M.H.d.S., W.N., E.B., M.T., G.B.; Manuscript revision, G.W.B.d.M. All authors have read and agreed to the published version of the manuscript.
Funding
The authors are grateful to Coordenação de Aperfeiçoamento de Pessoal de Nível Superior (CAPES) Financial code 001; to Conselho Nacional de Desenvolvimento Científico e Tecnológico (CNPq)—Projeto Universal (process n. 407757/2016-3; 307586/2017-0) and to Fundação de Amparo à Pesquisa do Rio Grande do Sul (FAPERGS) for partially funding the research. We are also thankful to CNPq, for granting the research productivity scholarship to three authors: Gustavo Brunetto, Danilo Eduardo Rozane and William Natale.
Conflicts of Interest
The authors declare no conflict of interest.
References
- AGRIANUAL. Anuário da Agricultura Brasileira, 23rd ed.; Agribusiness Intelligence: São Paulo, Brazil, 2019. [Google Scholar]
- Piccin, R.; Couto, R.D.R.; Bellinaso, R.J.S.; Gatiboni, L.C.; De Conti, L.; Rodrigues, L.A.T.; Michelon, L.S.; Kulmann, M.S.D.S.; Brunetto, G. Phosphorus forms in leaves and their relationships with must composition and yield in grapevines. Pesquisa Agropecuária Brasileira 2017, 52, 319–327. [Google Scholar] [CrossRef]
- Sparks, D.L.; Page, A.L.; Helmke, P.A.; Loepper, R.H. Methods of Soil Analysis, Part 3: Chemical Methods, 14th ed.; John Wiley & Sons: Hoboken, NJ, USA, 2020; ISBN 0891188258. [Google Scholar]
- Dematte, J.A.; Dotto, A.C.; Bedin, L.G.; Sayão, V.M.; E Souza, A.B. Soil analytical quality control by traditional and spectroscopy techniques: Constructing the future of a hybrid laboratory for low environmental impact. Geoderma 2019, 337, 111–121. [Google Scholar] [CrossRef]
- Carranca, C.; Brunetto, G.; Tagliavini, M. Nitrogen nutrition of fruit trees to reconcile productivity and environmental concerns. Plants 2018, 7, 4. [Google Scholar] [CrossRef] [PubMed]
- Brunetto, G.; Ceretta, C.A.; Melo, G.W.B.; Girotto, E.; Ferreira, P.A.A.; Lourenzi, C.R.; Couto, R.D.R.; Tassinaria, A.; Hammerschmitt, R.K.; Da Silva, L.O.S.; et al. Contribution of nitrogen from urea applied at different rates and times on grapevine nutrition. Sci. Hortic. 2016, 207, 1–6. [Google Scholar] [CrossRef]
- Marschner, P. Marschner’s Mineral Nutrition of Higher Plants, 3rd ed.; Academic Press: London, UK, 2012; ISBN 9780123849052. [Google Scholar]
- Oliveira-Stefanello, L.; Schwalbert, R.; De-Conti, L.; Tassinari, A.; Paula-Garlet, L.; Lourenzi, C.R.; Comin, J.; Loss, A.; Schmitt, D.; Borghezan, M.; et al. Yield and must composition of ’Cabernet Sauvignon’ grapevines subjected to nitrogen application in soil with high organic matter content. Idesia (Arica) 2019, 37, 27–36. [Google Scholar] [CrossRef]
- Parent, L.; Dafir, M. A Theoretical concept of compositional nutrient diagnosis. J. Am. Soc. Hortic. Sci. 1992, 117, 239–242. [Google Scholar] [CrossRef]
- Egozcue, J.J.; Pawlowsky-Glahn, V. Groups of parts and their balances in compositional data analysis. Math. Geol. 2005, 37, 795–828. [Google Scholar] [CrossRef]
- García-Hernández, J.L.; Valdez-Cepeda, R.D.; Murillo-Amador, B.; Morales, F.A.B.; Ruiz-Espinoza, F.H.; Orona-Castillo, I.; Flores-Hernández, A.; Troyo-Diéguez, E. Preliminary compositional nutrient diagnosis norms in Aloe vera L. grown on calcareous soil in an arid environment. Environ. Exp. Bot. 2006, 58, 244–252. [Google Scholar] [CrossRef]
- Wadt, P.G.S.; Anghinoni, I.; Guindani, R.H.P.; De Lima, A.S.T.; Puga, A.P.; Da Silva, G.S.; Prado, R.D.M. Padrões nutricionais para lavouras arrozeiras irrigadas por inundação pelos métodos da CDN chance matemática. Revista Brasileira Ciência Solo 2013, 37, 145–156. [Google Scholar] [CrossRef]
- Urano, E.O.M.; Kurihara, C.H.; Maeda, S.; Vitorino, A.C.T.; Goncalves, M.C.; Marchetti, M.E. Soybean nutritional status evaluation. Pesquisa Agropecuaria Bresileira 2006, 4, 1421–1428. [Google Scholar] [CrossRef]
- Nowaki, R.H.D.; Parent, S.-É.; Filho, A.B.C.; Rozane, D.E.; Meneses, N.B.; Silva, J.A.D.S.D.; Natale, W.; Parent, L.E. Phosphorus over-fertilization and nutrient misbalance of irrigated tomato crops in brazil. Front. Plant Sci. 2017, 8, 825. [Google Scholar] [CrossRef] [PubMed]
- De Souza, H.A.; Vieira, P.F.D.M.J.; Rozane, D.E.; Sagrilo, E.; Leite, L.F.C.; Ferreira, A.C.M. Critical levels and sufficiency ranges for leaf nutrient diagnosis by two methods in soybean grown in the Northeast of Brazil. Revista Brasileira Ciência Solo 2020, 44. [Google Scholar] [CrossRef]
- Da Silva, G.G.C.; Neves, J.C.L.; Alvarez, V.H.; Leite, F.P. Nutritional diagnosis for eucalypt by DRIS, M-DRIS, and CND. Sci. Agricola 2004, 61, 507–515. [Google Scholar] [CrossRef]
- De Paula, B.V.; Arruda, W.S.; Parent, L.E.; De Araujo, E.F.; Brunetto, G. Nutrient diagnosis of Eucalyptus at the factor-specific level using machine learning and compositional methods. Plants 2020, 9, 1049. [Google Scholar] [CrossRef]
- Parent, S.-É.; Parent, L.E.; Rozane, D.E.; Natale, W. Plant ionome diagnosis using sound balances: Case study with mango (Mangifera indica). Front. Plant Sci. 2013, 4, 449. [Google Scholar] [CrossRef]
- Hernandes, A.; Parent, S.-É.; Natale, W.; Parent, L.E. Balancing guava nutrition with liming and fertilization. Rev. Bras. de Frutic. 2012, 34, 1224–1234. [Google Scholar] [CrossRef]
- Rozane, D.E.; Prado, R.D.M.; Natale, W.; Romualdo, L.M.; Franco, C.F. Caracterização biométrica e acúmulo de nutrientes em porta-enxertos de caramboleira cultivada em solução nutritiva. Revista Ciência Agronômica 2013, 44, 426–436. [Google Scholar] [CrossRef]
- De Oliveira, C.T.; Rozane, D.E.; De Amorim, D.A.; De Souza, H.A.; Fernandes, B.S.; Natale, W. Diagnosis of the nutritional status of ‘Paluma’ guava trees using leaf and flower analysis. Rev. Bras. Frutic. 2020, 42, 1–9. [Google Scholar] [CrossRef]
- Melo, G.; Rozane, D.; Brunetto, G. Identification of the critical levels, sufficiency ranges and potential response to nutrient fertilization in vineyards by the DRIS method. Acta Hortic. 2018, 423–430. [Google Scholar] [CrossRef]
- E Parent, L.; Natale, W.; Ziadi, N. Compositional nutrient diagnosis of corn using the Mahalanobis distance as nutrient imbalance index. Can. J. Soil Sci. 2009, 89, 383–390. [Google Scholar] [CrossRef]
- Parent, S.-É.; Parent, L.E.; Egozcue, J.J.; Rozane, D.E.; Hernandes, A.; Lapointe, L.; Gentile, V.H.; Naess, K.; Marchand, S.; Lafond, J.; et al. The plant ionome revisited by the nutrient balance concept. Front. Plant Sci. 2013, 4, 39. [Google Scholar] [CrossRef] [PubMed]
- CQFS-RS/SC. Manual de Calagem e Adubação do RS/SC; Comissão de Quimica e Fertilidade, 11th ed.; Comissão de Quimica e Fertilidade: Porto Alegre, Brazil, 2016. [Google Scholar]
- Tedesco, M.J.; Gianello, C.; Bissani, C.A.; Bohnen, H. Análises de Solo, Plantas e Outros Materiais; UFRGS: Porto Alegre, Brazil, 1995. [Google Scholar]
- Bremner, J.M.; Mulvaney, C.S. Nitrogen total in methods of soil analysis. In Methods of Soil Analysis, Part 2; Page, A.L., Miller, R.H., Keeney, D.R., Eds.; American Society of Agronomy: Madison, WI, USA, 1982; pp. 595–624. [Google Scholar]
- EMBRAPA. Manual de Análises Químicas de Solos, Plantas e Fertilizantes, 2nd ed.; Embrapa Informação Tecnológica: Brasilia, Brasisl, 2009. [Google Scholar]
- Isaac, R.A.; Kerber, J.D.; Walsh, L.M. Atomic Absorption and Flame Photometry: Techniques and Uses in Soil, Plant, and Water Analysis. In Pesticides in Soil and Water; Soil Science Society of America: Madison, WI, USA, 2015; pp. 17–37. [Google Scholar]
- Murphy, J.; Riley, J. A modified single solution method for the determination of phosphate in natural waters. Anal. Chim. Acta 1962, 27, 31–36. [Google Scholar] [CrossRef]
- Krug, F.J.; Mortatti, J.; Pessenda, L.; Zagatto, E.A.G.; Bergamin, H. Flow injection spectrophotometric determination of boron in plant material with azomethine-H. Anal. Chim. Acta 1981, 125, 29–35. [Google Scholar] [CrossRef]
- Gaines, T.P.; Mitchell, G.A. Boron determination in plant tissue by the azomethine H method. Commun. Soil Sci. Plant Anal. 1979, 10, 1099–1108. [Google Scholar] [CrossRef]
- Aitchison, J. The Statistical Analysis of Compositional Data. J. R. Stat. Soc. Ser. B (Stat. Methodol.) 1982, 44, 139–160. [Google Scholar] [CrossRef]
- Aitchison, J. Principles of compositional data analysis. Inst. Math. Stat. Lect. Notes Monogr. Ser. 1994, 73–81. [Google Scholar] [CrossRef]
- Khiari, L.; Parent, L.-É.; Tremblay, N. Selecting the high-yield subpopulation for diagnosing nutrient imbalance in crops. Agron. J. 2001, 93, 802–808. [Google Scholar] [CrossRef]
- Hair, J.J.F.; Black, W.C.; Sant’Anna, A.S. Análise Multivariada De Dados, 6th ed.; Grupo A—Bookman: Porto Alegre, Brazil, 2005; ISBN 9788577805341. [Google Scholar]
- Kurihara, C.H.; Venegas, V.H.A.; Neves, J.C.L.; Novais, R.F.; Staut, L.A. Sufficiency range for nutrient concentration in cotton and soybean leaves, defined through DRIS indexes. Ceres 2013, 60. [Google Scholar] [CrossRef]
- De Souza, H.A.; Rozane, D.E.; Amorim, D.A.; Dias, M.J.T.; Modesto, V.C.; Natale, W. Assessment of nutritional status of guava seedlings using preliminary DRIS norms and sufficiency ranges. J. Plant Nutr. 2015, 38, 1611–1618. [Google Scholar] [CrossRef]
- Van Den Boogaart, K.; Tolosana, R.; Bren, M. “Compositions”: Compositional data analysis in R package. Comput. Geosci. 2013. [Google Scholar] [CrossRef]
- Rozane, D.E.; Mattos, D.; Parent, S.-É.; Natale, W.; Parent, L.É. Meta-analysis in the selection of groups in varieties of citrus. Commun. Soil Sci. Plant Anal. 2015, 46, 1948–1959. [Google Scholar] [CrossRef]
- Brunetto, G.; Ernani, P.; Melo, G.W.B.; Nava, G. Adubação de Videira. In Manual de Calagem e Adubação Para os Estados do Rio Grande do Sul e Santa Catarina; Comissão de Química e Fertilidade do Solo RS/SC; Comissão de Quimica e Fertilidade: Porto Alegre, Brazil, 2016; pp. 189–232. [Google Scholar]
- Khiari, L.; Parent, L.-É.; Tremblay, N. The phosphorus compositional nutrient diagnosis range for potato. Agron. J. 2001, 93, 815–819. [Google Scholar] [CrossRef]
- Dahal, K.; Bhattarai, S.P.; Midmore, D.; Oag, D.R.; Walsh, K. Temporal yield variability in subtropical table grape production. Sci. Hortic. 2019, 246, 951–956. [Google Scholar] [CrossRef]
- Quaggio, J.A.; Raij, B.V. Frutíferas. In Recomendação de Adubação e Calagem Para o Estado São Paulo—Boletim Técnico 100; Raij, B.V., Cantarella, H., Quaggio, J.A., Furlani, A.M.C., Eds.; Instituto Agronômico: Campinas, Brazil, 1997; pp. 121–125. [Google Scholar]
- De Conti, L.; Ceretta, C.A.; Melo, G.W.B.; Tiecher, T.L.; Stefanello, L.; Garlet, L.P.; Mimmo, T.; Cesco, S.; Brunetto, G. Intercropping of young grapevines with native grasses for phytoremediation of Cu-contaminated soils. Chemosphere 2019, 216, 147–156. [Google Scholar] [CrossRef] [PubMed]
- Khan, M.N.; Mobin, M.; Abbas, Z.K.; Alamri, S.A. Fertilizers and Their Contaminants in Soils, Surface and Groundwater. In Encyclopedia of the Anthropocene; Elsevier: Amsterdam, The Netherlands, 2018; Volume 5, pp. 225–240. ISBN 9780128096659. [Google Scholar]
- Latifi, Z.; Jalali, M. Trace element contaminants in mineral fertilizers used in Iran. Environ. Sci. Pollut. Res. 2018, 25, 31917–31928. [Google Scholar] [CrossRef]
- Serra, A.P.; Marchetti, M.E.; Vitorino, A.C.T.; Novelino, J.O.; Camacho, M.A. Desenvolvimento de normas DRIS e CND e avaliação do estado nutricional da cultura do algodoeiro. Revista Brasileira de Ciência do Solo 2010, 34, 97–104. [Google Scholar] [CrossRef]


© 2020 by the authors. Licensee MDPI, Basel, Switzerland. This article is an open access article distributed under the terms and conditions of the Creative Commons Attribution (CC BY) license (http://creativecommons.org/licenses/by/4.0/).