Article

Investigating Evolution and Balance of Grape Sugars and Organic Acids in Some New Pathogen-Resistant White Grapevine Varieties

Department of Sustainable Crops Production, Università Cattolica del Sacro Cuore, 29122 Piacenza, Italy
*
Author to whom correspondence should be addressed.
Horticulturae 2021, 7(8), 229; https://doi.org/10.3390/horticulturae7080229
Submission received: 13 July 2021 / Revised: 30 July 2021 / Accepted: 2 August 2021 / Published: 6 August 2021

Abstract

:
Breeding technologies exploiting marker-assisted selection have accelerated the selection of new cross-bred pathogen-resistant grapevine varieties. Several genotypes have been patented and admitted to cultivation; however, while their tolerance to fungal diseases has been the object of several in vitro and field studies, their productive and fruit composition traits during ripening are still poorly explored, especially in warm sites. In this study, five white pathogen-resistant varieties (PRV) listed as UD 80–100, Soreli, UD 30–080, Sauvignon Rytos, Sauvignon Kretos were tested over two consecutive seasons in a site with a seasonal heat accumulation of about 2000 growing degree days (GDDs), and their performances were compared to two Vitis vinifera L. traditional varieties, Ortrugo and Sauvignon Blanc. Berries were weekly sampled from pre-veraison until harvest to determine total soluble solids (TSS) and titratable acidity (TA) dynamics. All tested PRV exhibited an earlier onset of veraison and a faster sugar accumulation, as compared to Ortrugo and Sauvignon Blanc, especially in 2019. At harvest, Sauvignon Blanc was the cultivar showing the highest titratable acidity (8.8 g/L). Ortrugo and PRV showed very low TA (about 4.7 g/L), with the exception of Sauvignon Rytos (6.5 g/L). However, data disclose that Sauvignon Rytos higher acidity at harvest relies on higher tartrate (+1.1 to +2.2 g/L, as compared to other PRV), whereas in Sauvignon Blanc, high TA at harvest is due to either tartaric (+1 g/L, compared to PRV) and malic (+2.5 g/L, compared to PRV) acid retention. Overall, Sauvignon Rytos is the most suited PRV to be grown in a warm climate, where retaining adequate acidity at harvest is crucial to produce high-quality white wines. Nevertheless, canopy and ripening management strategies must be significantly adjusted, as compared to the standard practice employed for the parental Sauvignon Blanc.

1. Introduction

Warming trends are severely endangering viticulture and its sustainability [1,2]. In many wine regions, the incidence of drought and the rise of temperature are affecting vineyard performances by compromising vine physiology, compressing phenology, and boosting grapes’ metabolism. In white varieties, especially when intended for sparkling wine, accelerated ripening leads to excessive sugars and inadequate acidity and aromas at harvest, resulting in unbalanced wines [1,3]. Moreover, the advancement of veraison increases the susceptibility of grapes to sunburn and dehydration phenomena by exposing ripening berries to the hottest days of the year, when the evaporative demand is maximum [2]. As a consequence, several wine regions are seeking either new cultural practices viable to decompress sugar accumulation and acidity decrease, or late-ripening cultivars, especially when the target hits white and/or sparkling wines [1,4,5,6]. In addition, contrary to what one might think, fungal diseases are a serious issue also in warm and hot regions. Pathogen spread varies according to the seasonal weather evolution; the increase of average temperatures broadens the time window available for pathogens to complete additional biological cycles within one year [7]. Consequently, numerous pesticides applications are still frequently needed during the season to control downy mildew (DM) and powdery mildew (PM), even in warm climates. For instance, in northern Italy, where average heat accumulation easily exceeds >2000 growing degree days (GDDs), several pesticides residues have been detected in the groundwater [8].
Pathogen-resistant grapevine varieties (PRV) are complex interspecific hybrids obtained by multiple crossings of resistant Vitis spp. accessions (mostly V. amurensis, V. rupestris, and V. berlandieri) with selected cultivars of Vitis vinifera which, conversely, lacks genetic resistance towards Plasmopara viticola (Pv) and Erisyphae necator (En). In most Mediterranean grape growing regions, adoption of PRV has been hindered for many decades. Hindrance to PRV was not merely due to their botanical origins, yet to the fact that non-vinifera genotypes often carry undesired or atypical flavour, and wines are not appreciated [9,10,11,12].
Over the last decades, however, the increasing concerns of consumers about ecological issues and product safety, the rapid surge of organic (or environmentally certified) wines, and the spread of new awareness and values in modern society, have led to a renovated interest in PRV. Moreover, new breeding technologies have opened up new frontiers [9,11]. For instance, in Italy, a few breeding programmes have originated new pathogen-resistant varieties by marker-assisted selection (MAS) sorted out within progenies obtained by crossing Vitis vinifera cultivars with complex hybrids having genetic resistance to DM and PM. MAS has considerably shortened the time needed to identify the crossings carrying one or more quantitative trait loci (QTL), inducing higher tolerance to Pv and En. Within this pool of individuals, the genotypes having the most similar must biochemical composition to the V. vinifera parentals were identified. Currently, several selected resistant cultivars are available for growers [11,13,14,15]. At the same time, also national and European regulations changed and, from 2009 to date, many hybrids PRV have been admitted for cultivation.
A fairly high number of papers have described the tolerance to DM and PM of these new PRV under various environmental conditions. Depending upon the number and types of QTLs, these PRV exhibit a different degree of tolerance to Pv and En; nonetheless, these varieties have been confirmed to be more tolerant than traditional V. vinifera [9,14,15,16,17,18,19].
Conversely, the literature shows a paucity of scientific papers evaluating the productive performances and fruit composition of such new PRV. Poni et al. [20] have reported that potted vines of the red resistant accession UD 72–096 (Sangiovese x Bianca) had comparable yield with a standard susceptible Sangiovese clone but, when harvested on the same date, UD 72–096 showed significantly higher TSS and TA than Sangiovese. Moreover, UD 72–096 grapes had higher concentrations of skin acylated and coumarated anthocyanins, lower mono-glucosidic, and higher di-glucosidic anthocyanin forms, as well as lower quercetin 3-O-glucoside concentration, as compared to the susceptible Sangiovese. In north-eastern Spain, the resistant genotype Sauvignon Kretos (Sauvignon Blanc x Kozma 20-3) exhibited a similar yield and must composition to the parental Sauvignon Blanc. In this case, the two varieties were picked at different dates, but the date of harvest of Sauvignon Blanc was not provided [21].
To the best of our knowledge, no other scientific papers have tested fruit ripening kinetics or enological parameters of new PRV. Several technical reports suggest that these varietals are poor in di-glucoside anthocyanin forms and free from furaneol and other undesired volatile compounds typical of non-vinifera cultivars [22,23]. Analytical and sensorial traits of musts and wines are overall promising and confirm that these varietals, if adequately managed in the field and the winery, can produce wines comparable to those obtained from the V. vinifera parentals [22,23,24,25].
A shared result of these technical reports is the earlier annual cycle of PRV [22]. The high heritability of earliness traits, when crossing grapevine cultivars, is something well known, and some PRV originating from pioneer breeding programmes, such as Bronner, Solaris, or Souvignier Gris, show accelerated ripening and fast sugar accumulation [9,22,26,27,28,29,30,31]. This can be linked to the locations and the times of the selection of these genotypes, obtained by breeding programmes set in cool climates, and well before warming trends affected Mediterranean wine regions. PRV introduction in warm regions, where global warming has already caused a significant compression of the annual growth cycle and a consistent advancement of phenological stages, seems to be an additional matter of concern.
The aim of this work was to evaluate vine performances and fruit-ripening dynamics of five new white PRV, in a region where local viticulture is suffering the negative effects of warming trends on grape biochemical balance. The resistant genotypes were compared to Sauvignon Blanc and Ortrugo, two of the most cultivated white Vitis vinifera genotypes in the area. Our hypothesis was that the tested PRV might have a different degree of suitability to warm and hot sites according to three specific traits, namely, (i) onset of veraison time, (ii) malic acid degradation rates, and(iii) maintenance of a minimum acid pool at harvest.

2. Materials and Methods

2.1. Experimental Site and Treatment Layout

The study was carried out for two years (2019–2020) in a varietal collection located at Vicobarone (Ziano Piacentino, Italy, 44°59′31.7″ N 9°21′27.8″ E, 268 m a.s.l.). In the vineyard, 5 recently obtained white PRV were planted in 2016. The PRV present in the collection were obtained by crossing a V. vinifera parental (namely Sauvignon Blanc or Friulano) with an interspecific Vitis hybrid (namely, Kozma 20-3 or Bianca) able to confer resistance to PM and DM [32,33]. The five PRV were UD 80–100 (Friulano x Bianca), Soreli (Friulano x Kozma 20-3), UD 30–080 (Sauvignon Blanc x Kozma 20-3), Sauvignon Kretos (Sauvignon Blanc x Kozma 20-3), and Sauvignon Rytos (Sauvignon Blanc x Bianca) (Figure S1). To date, Sauvignon Rytos, Sauvignon Kretos, and Soreli are already admitted for cultivation in Italy, whereas UD 80–100 and UD 30–080 are still under evaluation. Ortrugo (VCR245) and Sauvignon Blanc (R3) vines, planted in the same year nearby these 5 PRV, were selected as V. vinifera references. Ortrugo was chosen since it is the most common white variety in the region and also is susceptible to summer temperatures in terms of fast acidity loss [6]. Sauvignon Blanc was instead included in the study since it was one of the parentals of three PRV among the five planted in the vineyard. All the cultivars, grafted on SO4 rootstock, were planted at 2.4 m × 0.8 m spacing (between row and within row distance, respectively) for a resulting density of 5125 plants/hectare. The vineyard has a soft slope (about 6°) and an east-facing aspect, with rows following E–W orientation. Vines were trained to a unilateral Guyot with about 10 nodes on the primary horizontal cane and two more on a spur left for annual cane renewal.
Each cultivar was present in one row of 80 m, encompassing 100 vines. The vineyard was divided into three uniform blocks along the rows. Nine test vines per varietal (three vines per cultivar per block) were randomly chosen in 2019, tagged, and then maintained also for the following season. These selected vines were used for detailed assessment of vegetative growth, yield components, and grape composition at harvest. The vineyard is typically non-irrigated, whereas fertilisation was uniform across all the vineyard surfaces and conducted based on local sustainable practices. Vines were trimmed once shoots outgrew 20 cm above the top wire. In order to prevent the spread of pathogens on both PRV and reference varieties, control of diseases was differentiated based on the degree of tolerance of the different genotypes. Details of pest management layout are provided in Table S1. In both seasons, none of the experimental vines showed symptoms of DM and PM at harvest. The minimum, mean, and maximum daily air temperature (°C) and daily rainfall (mm) from 1 January (DOY 1) to 31 December (DOY 365) were recorded in each season by a nearby weather station. Cumulative GDDs were then calculated according to Winkler [34].

2.2. Phenological Stages, Vegetative Growth, and Yield Components

In both years, bud break (BBCH09) and the onset of veraison (BBCH81) were assessed on each tagged vine according to Lorenz et al. [35]. Each season, in late spring (end of May–beginning of June), the number of inflorescences bore on each shoot was recorded according to the position of the shoot onto the horizontal cane. Total vine fruitfulness was then calculated as total inflorescences/total shoots ratio for the entire vine and for basal nodes (base node + count nodes 1 and 2).
All the experimental vines were picked on the same day, when a berry total soluble solids concentration of about 20 °Brix was achieved for Ortrugo, according to the optimal ripening threshold for this cultivar identified by Gatti et al. [36]. At harvest, tagged vines were individually picked, the mass of grapes was weighed, and the total bunch number per vine was counted. The average bunch weight was then calculated. Concurrently, three representative bunches per vine, usually inserted on basal, median, and apical cane portions, were taken to the laboratory. On each bunch, the number of berries was counted, and the mass of berries was weighed. Rachis length was measured, and bunch compactness was expressed as the ratio of total berry mass to rachis length. Berries were crushed, and the obtained must was then used for technological maturity and organic acids determination (see next paragraphs).
At harvest, the leaves inserted at nodes 3, 6, 9, 12, 15, 18, and 21 of the distal shoot of each tagged vine were collected with all the leaves from two lateral shoots developing below the trimming cut. The area of each leaf was measured with an LI-3000A leaf area meter (LI-COR Biosciences, Lincoln, NE, USA). Immediately after leaf fall, the number of nodes per cane and the number of nodes of each lateral cane were counted. The final leaf area was then estimated from the main and lateral shoots per vine on the basis of node counts and leaf-blade areas. Total vine leaf area was calculated as a sum of the two components. Leaf area to yield ratio (LA/Y) was finally calculated by dividing the total leaf area and yield of each tagged vine.

2.3. Grape Composition

Each year, from veraison (TSS ~4.5 to 5 °Brix) until harvest, three 100-berry samples were taken weekly from untagged vines of each varietal. These samples were not taken from the tagged vines so that the natural dynamic of grape ripening would not be altered due to the progressive reduction of the pending yield. During sampling, it was assured that the removed berries were taken from bunches located on both sides of the row and, within each bunch, the top, median, and bottom portions were also represented. In 2020, untagged Ortrugo and Sauvignon Blanc were not picked, and two additional post-harvest samplings were conducted. Sampled berries were brought to the laboratory, weighed, and crushed to obtain a must. Musts were analysed immediately for TSS using a temperature-compensated desk refractometer, whereas pH and TA were measured by titration with 0.1 N NaOH to a pH 8.2 end point and expressed as g/L of tartaric acid equivalents. TSS/TA ratio at harvest was then calculated.
TSS accumulation rates (°Brix day−1) were calculated from pre-veraison to harvest dividing the difference in TSS between two subsequent samplings by the number of elapsed days. The same procedure was carried out based on malic acid concentration in order to calculate degradation rates (g/L day−1).
For better readability of data, when appropriate, seasonal trends and correlations of specific parameters were graphed separately for PRV having Sauvignon Blanc as V. vinifera parental (UD 30–080, Sauvignon Kretos, and Sauvignon Rytos, compared with Sauvignon Blanc) and for PRV obtained crossing Friulano (UD 80–100 and Soreli, compared with Ortrugo).

2.4. HPLC Analysis

To assess tartaric and malic acid concentrations in all samples taken seasonally and at harvest, an aliquot of the must was diluted four times, then filtered through a 0.22 µm polypropylene syringe for high-performance liquid chromatography (HPLC) analysis and transferred to auto-sampler vials. All solvents were of HPLC grade. Water Milli-Q quality, acetonitrile, and methanol were obtained from VWR. L-(+)-tartaric acid and L-(-)-malic acid standards were purchased from Sigma-Aldrich. The chromatographic method was developed using an Agilent 1260 Infinity Quaternary LC (Agilent Technology) consisting of a G1311B/C quaternary pump with an inline degassing unit, G1329B autosampler, G1330B thermostat, G1316B thermostated column compartment, and a G4212B diode array detector (DAD) fitted with a 10 mm path, 1 µL volume Max-Light cartridge flow cell. The instrument was controlled using the Agilent Chemstation software version A.01.05. The organic acids analysis used an Allure Organic Acid Column, 300 × 4.6 mm, 5 µm (Restek). Separation was performed in isocratic conditions using water, pH-adjusted to 2.5 using ortho-phosphoric acid, at a flow rate of 0.8 mL/min. The column temperature was maintained at 30 ± 0.1 °C, and 15 µL of the sample was injected. The elution was monitored at 200 to 700 nm and detected by UV–Vis absorption with DAD at 210 nm. Organic acids were identified using authentic standards, and quantification was based on peak areas and performed by external calibration with standards. The ratio between tartaric acid and malic acid (HT/HM) was then calculated.

2.5. Statistical Analysis

Vine performance data were subjected to a two-way analysis of variance (ANOVA) using IBM SPSS 25 (IBM, Chicago, IL, USA). Treatment comparison was performed using the Student–Neuman–Keuls test at p ≤ 0.05. Year × treatment interaction was partitioned only when the F test was significant.
Repeated measures of the same parameters (TSS, pH, TA, tartaric acid, malic acid) taken at different dates along the season were analysed with the repeated-measure analysis of variance (ANOVA) routine embedded in IBM SPSS Statistics 25. Equality of variances of the differences between all possible pairs of within-subject conditions was assessed via Mauchly’s sphericity test. The least squared (LS) mean method at p ≤ 0.05 was used for multiple comparisons within dates.
Data about grapes TSS, TA, malic acid, and tartaric acid progression were also re-elaborated to predict fruit composition at the thresholds of TSS = 20 °Brix and, separately, TA = 7.5 g/L, for all the tested varieties. The balance among malate, tartrate, and TA or TSS for grapes harvested at those thresholds was compared by a one-way analysis of variance (ANOVA) using IBM SPSS 25 (IBM, Chicago, IL, USA).
The correlations existing between TSS and TA values of grapes sampled during the season were subjected to regression analysis, using SigmaPlot 11 (Systat Software Inc., San Jose, CA, USA).

3. Results

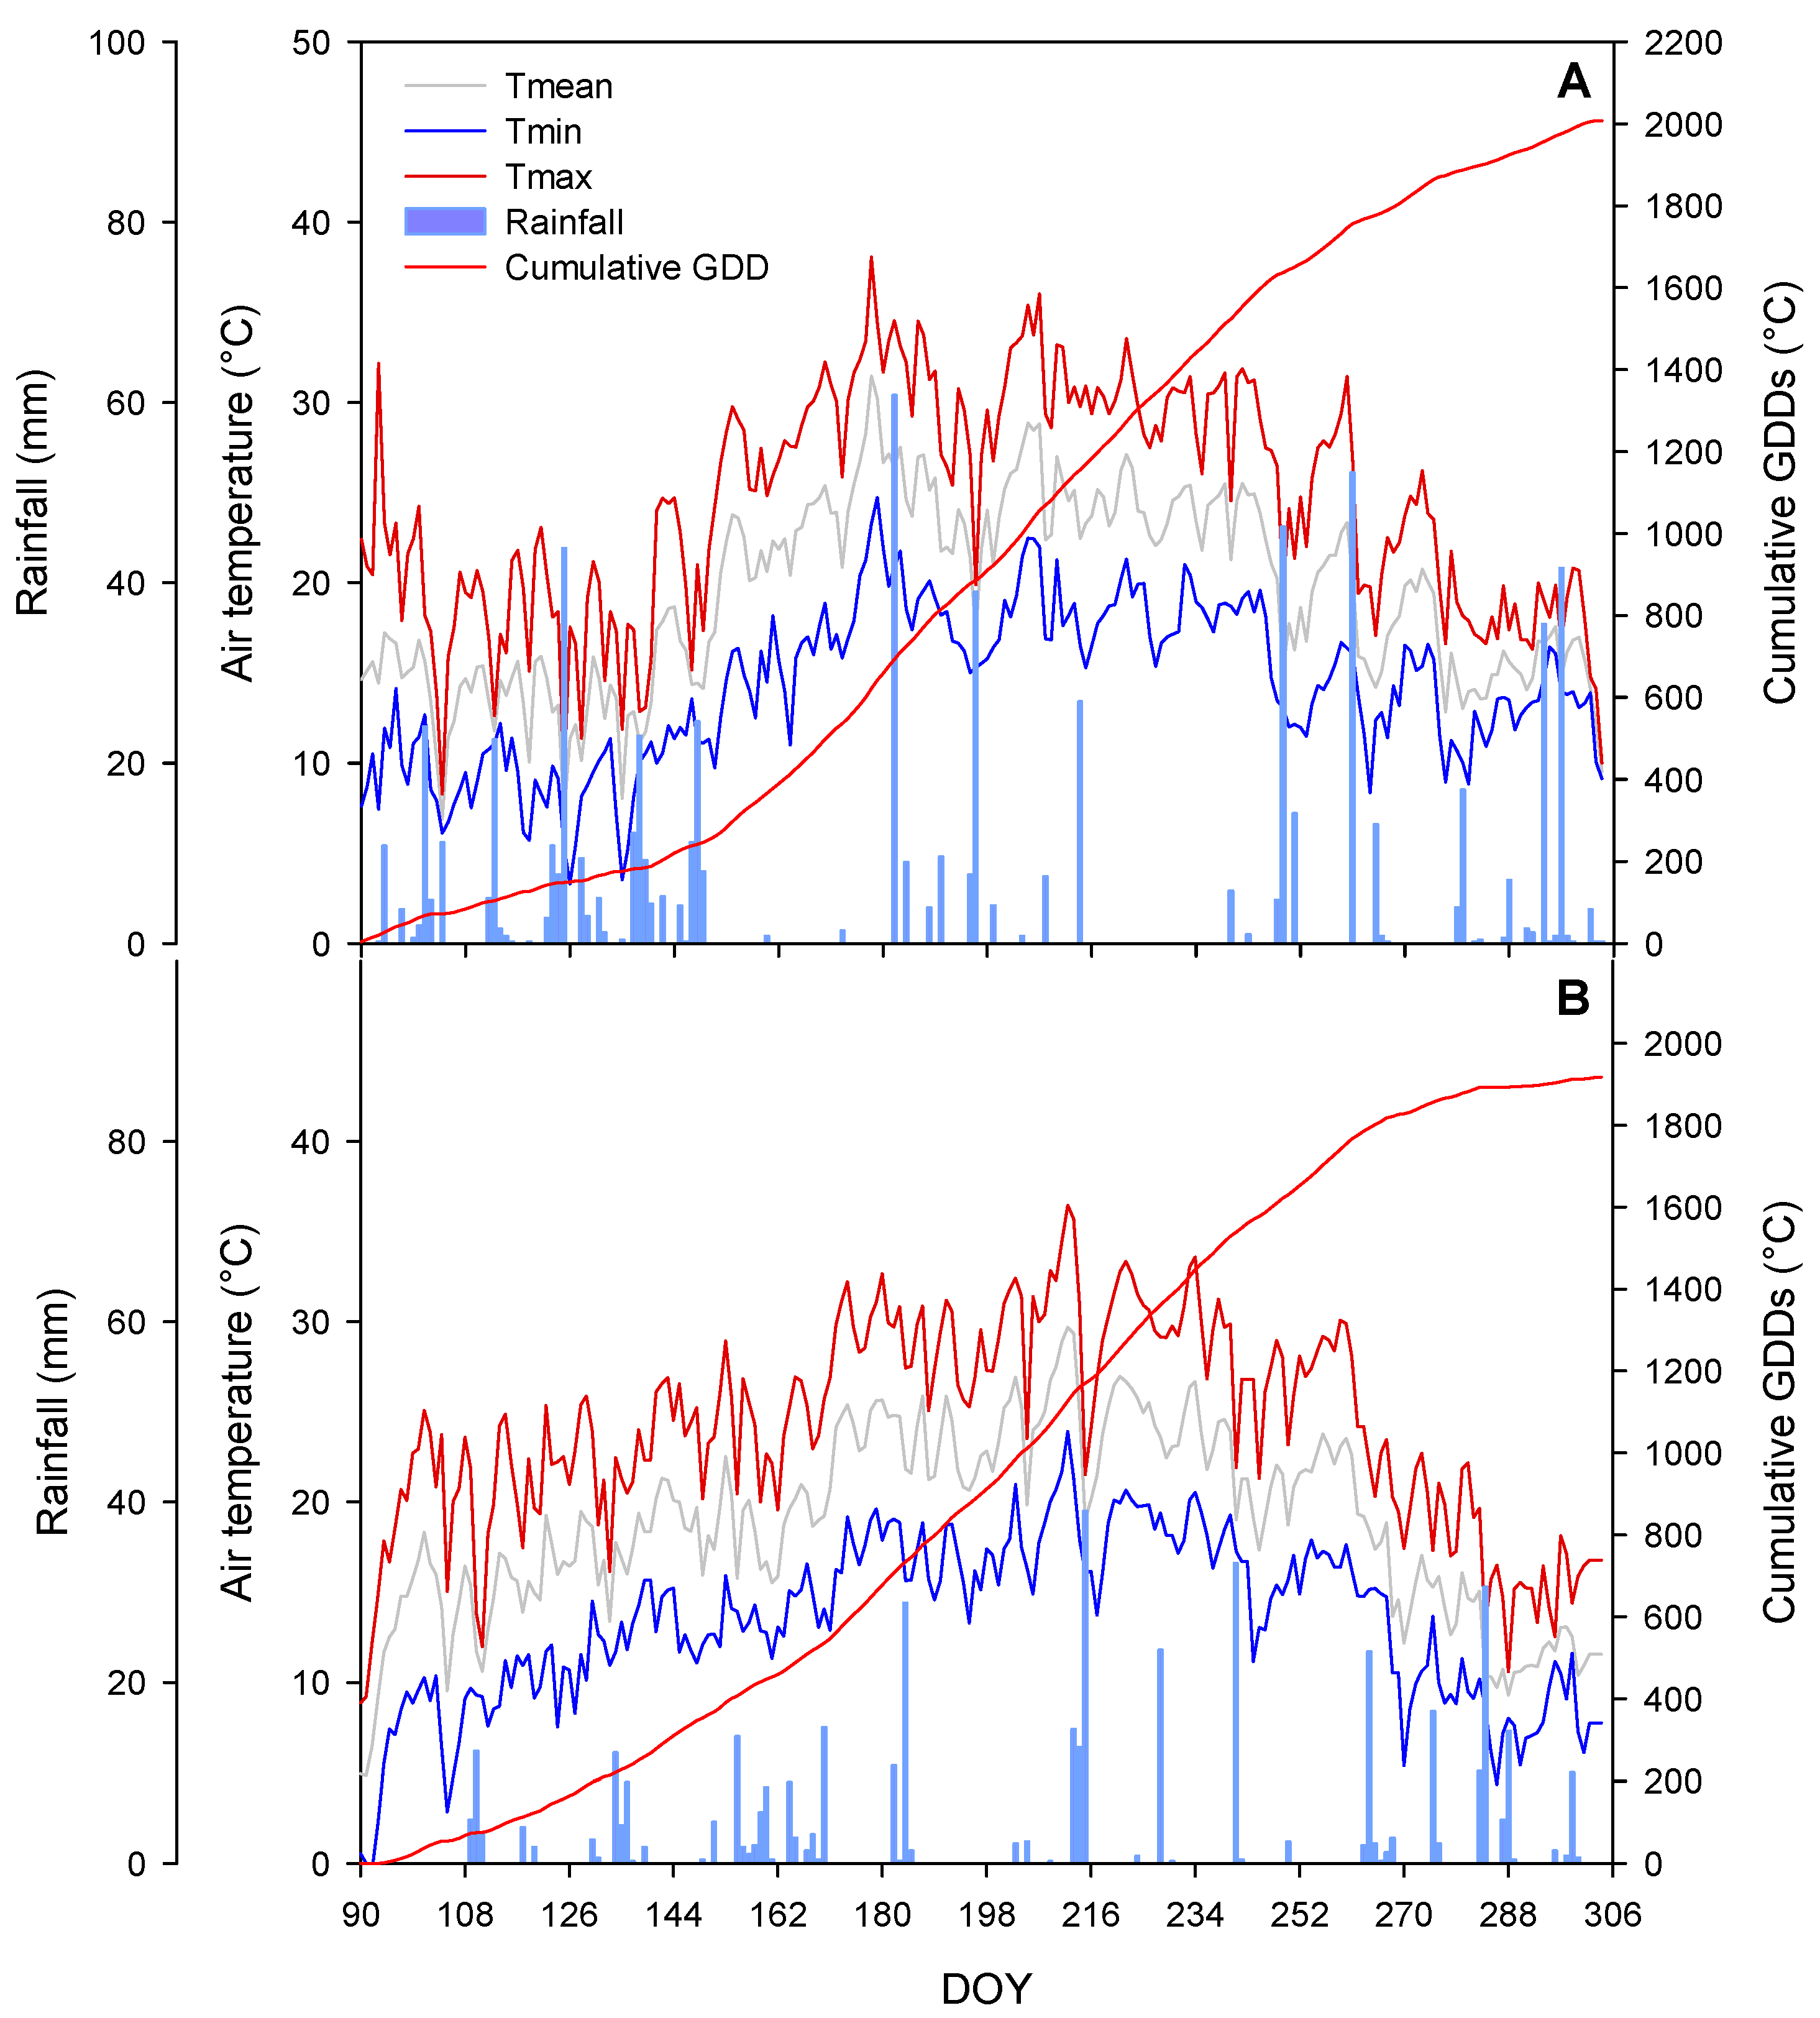
3.1. Weather Conditions and Phenology

At the experimental site, 2019 was marked by a wet and cold spring (Figure 1A). From 1 April to the end of May, 274 mm of rain and only 260 GDDs were recorded, vs. 62 mm and 369 GDDs recorded in the same period of 2020 (Figure 1B). Then, summer 2019 was conversely hotter than summer 2020, so that at the end of August, a comparable amount of GDDs were accumulated from 1 April in the two years (1568 GDDs in 2019, 1571 GDDs in 2020). From 1 April to 31 October, 2007 GDDs were accumulated in 2019 vs. 1917 GDDs in 2020.
All the genotypes tested in the trial had a similar bud-break date (BBCH09) in both seasons, with cv. Ortrugo showing a delay of a few days, as compared to other varieties (Table 1). Sauvignon Kretos was the cultivar showing the earliest onset of veraison (BBCH81) on both seasons (between DOYs 195–197). The onset of veraison was anticipated in 2020 in Sauvignon Rytos, Sauvignon Blanc, and Ortrugo by 8 days, compared to the previous year, whereas other genotypes did not exhibit a similar variation between seasons. Considering only resistant varieties, UD 30–080 was the cultivar exhibiting, in both years, the later onset of veraison.

3.2. Vegetative Growth and Shoot Fruitfulness

UD 30–080 had a significantly higher main shoot leaf area/vine at the end of the season, as compared to Sauvignon Rytos and UD 80–100, with other genotypes scoring intermediate values (Table 2). Lateral shoot leaf area/vine was unaffected by the genotype, so that differences in total vine leaf area mostly tracked those in the main shoot leaf area.
Soreli and Sauvignon Rytos exhibited the highest shoot fruitfulness (1.76 and 1.73 inflorescences per shoot, respectively). UD 80–100 and UD 80–030 showed a slightly lower shoot fruitfulness (Table 2), with Sauvignon Kretos setting at intermediate levels. Sauvignon Blanc and Ortrugo were the two cultivars having the lowest number of inflorescences per shoot (1.23 and 0.93, respectively). This trend was substantially confirmed when considering only basal nodes’ fruitfulness (i.e., base bud until count node 2).

3.3. Yield, Bunch Morphology, and Vine Balance

Harvest was performed on DOY 245 in 2019 and on DOY 238 in 2020. Soreli was the variety having the highest yield per vine (3.53 kg). All the remaining cultivars exhibited a significantly lower yield (from 2.08 to 2.43 kg/vine), with the sole exception of Sauvignon Blanc (Table 3). The high productivity of Soreli was associated with the high number of bunches per vine (30). However, the number of bunches per vine in Sauvignon Rytos and Sauvignon Kretos was not significantly lower than Soreli; rather, these two genotypes had a lower bunch weight and number of berries per bunch (−29% and −23%, respectively). Ortrugo was the variety with the lower number of bunches per vine (13), paralleled by the highest bunch weight (181 g) and number of berries per bunch (170). Sauvignon Rytos had small bunches (85 g) with a low number of berries per bunch (83). All PRV had medium bunch compactness, significantly lower than Ortrugo.
UD 30–080 showed the highest LA/Y ratio (1.64 m2/kg), whereas all the other cultivars had a lower LA/Y ratio (from 0.92 to 1.33 m2/kg), except for Ortrugo, which set at intermediate levels (1.42 m2/kg).

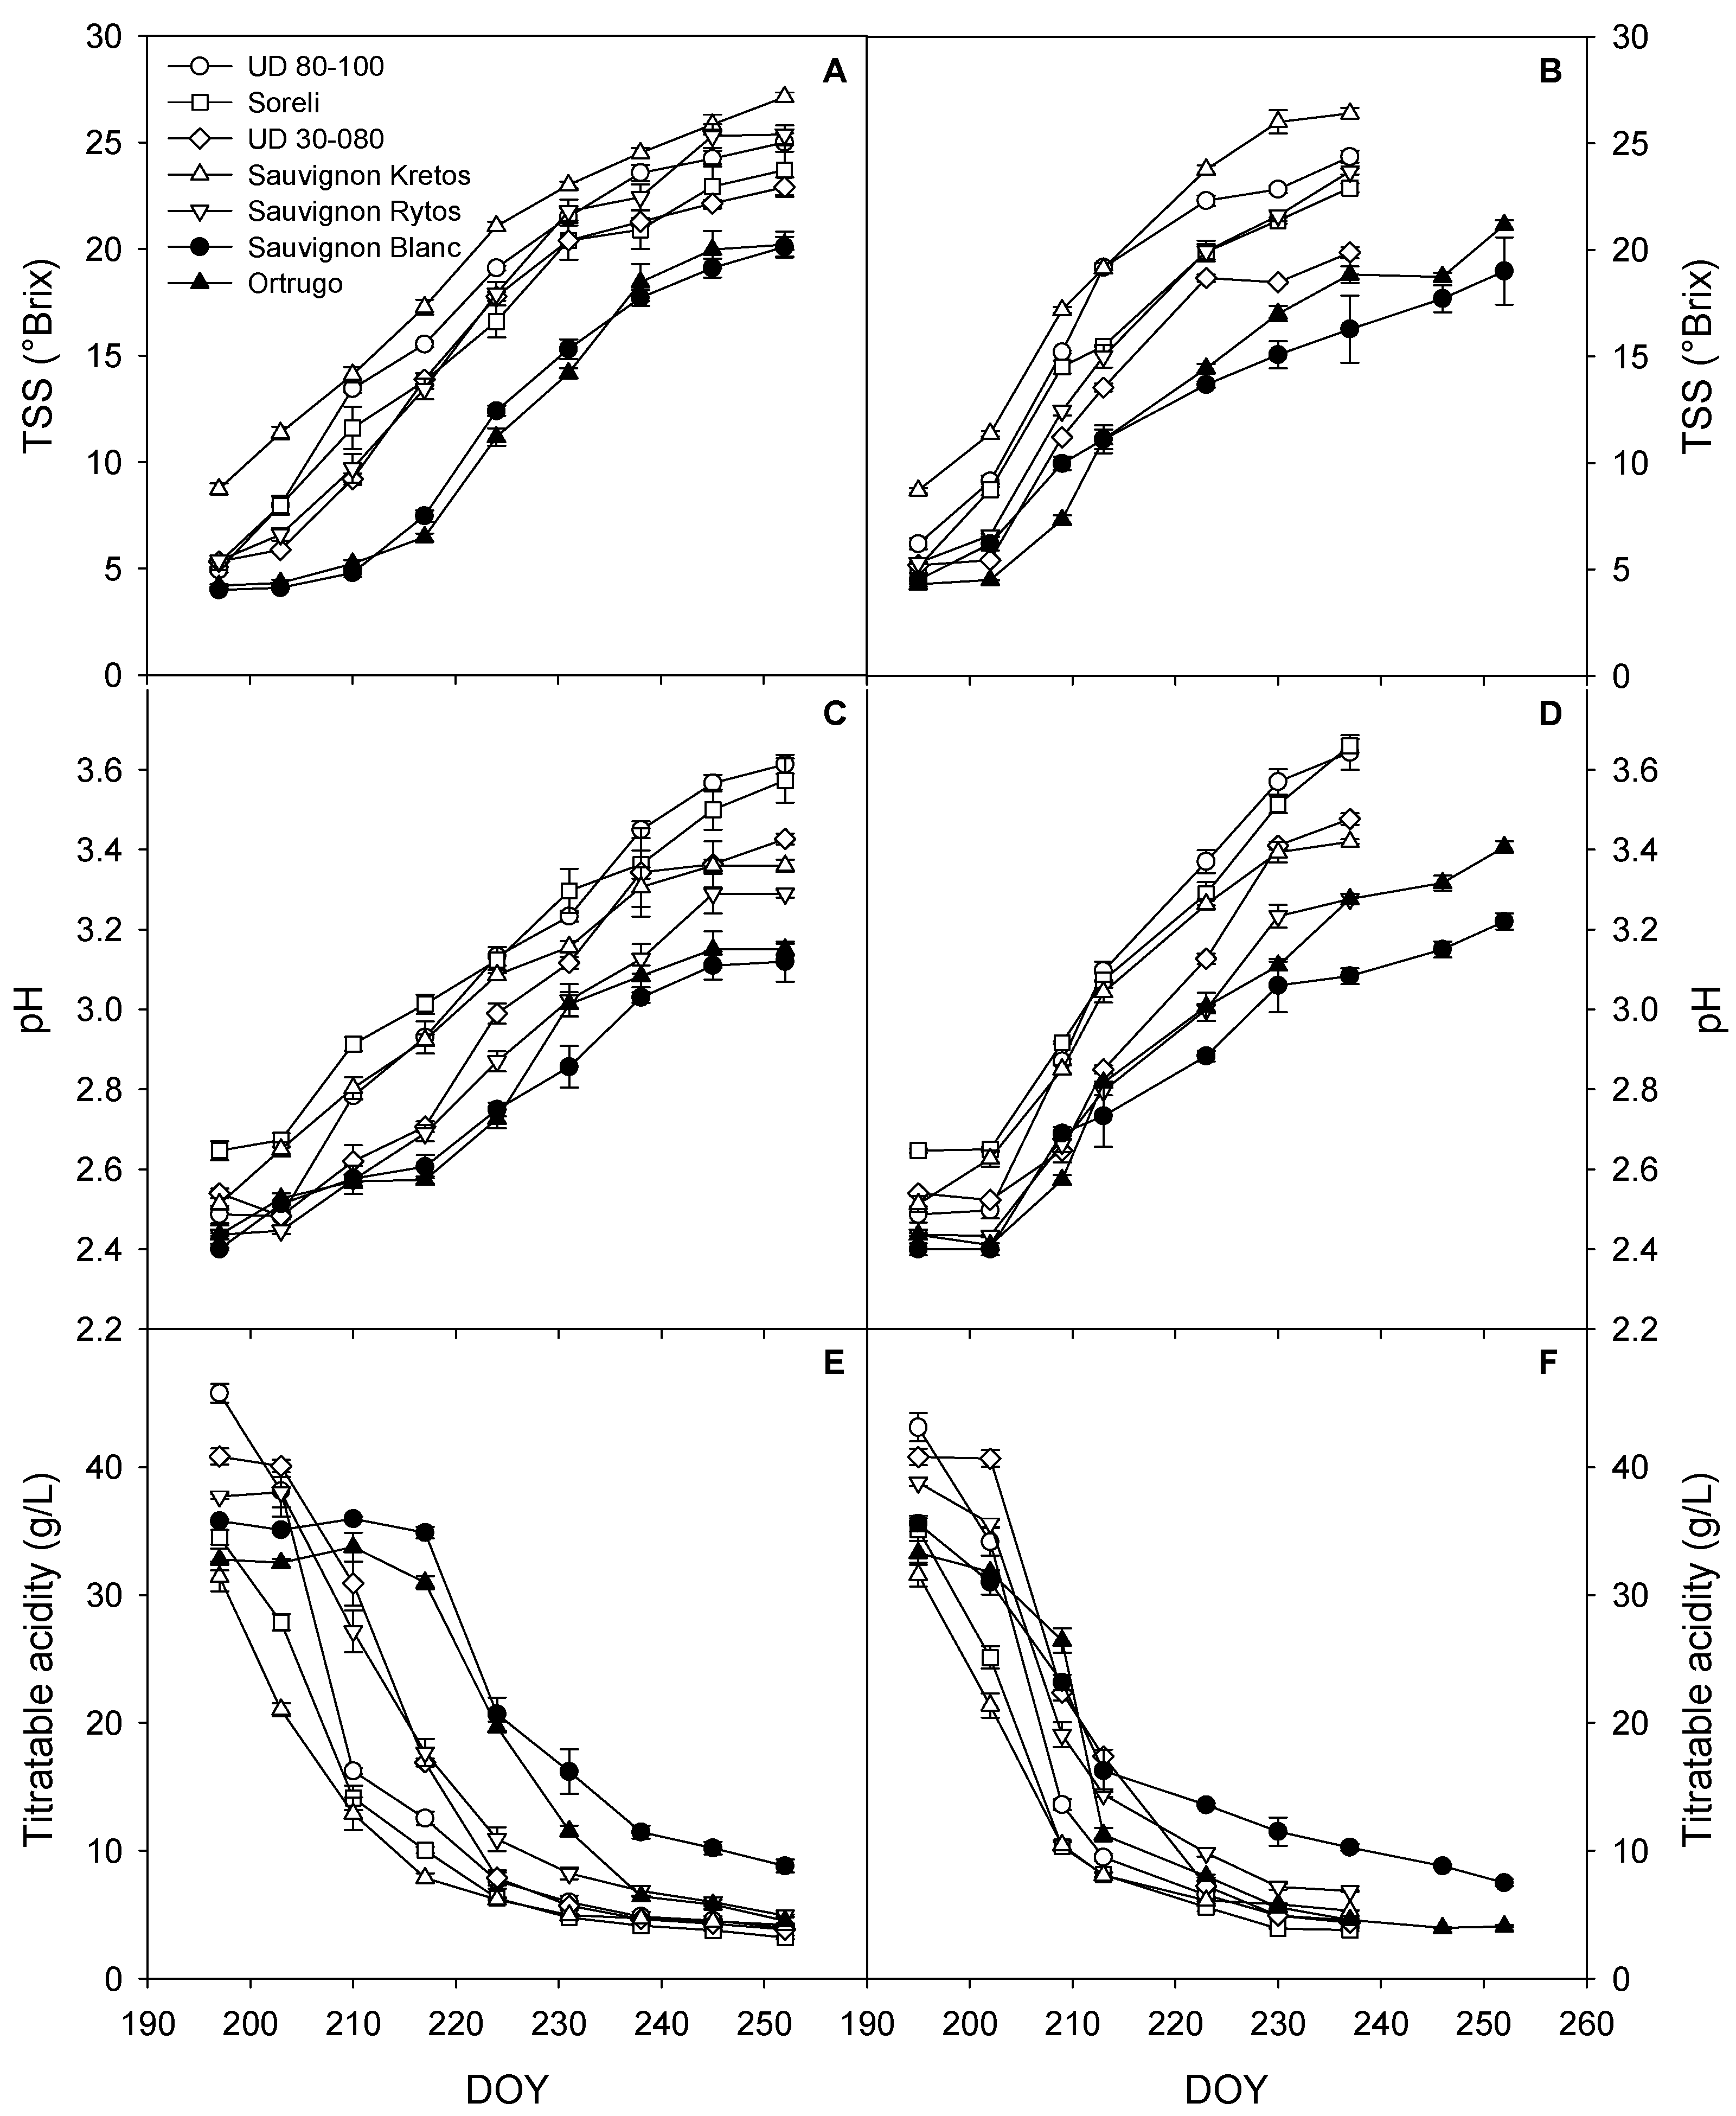
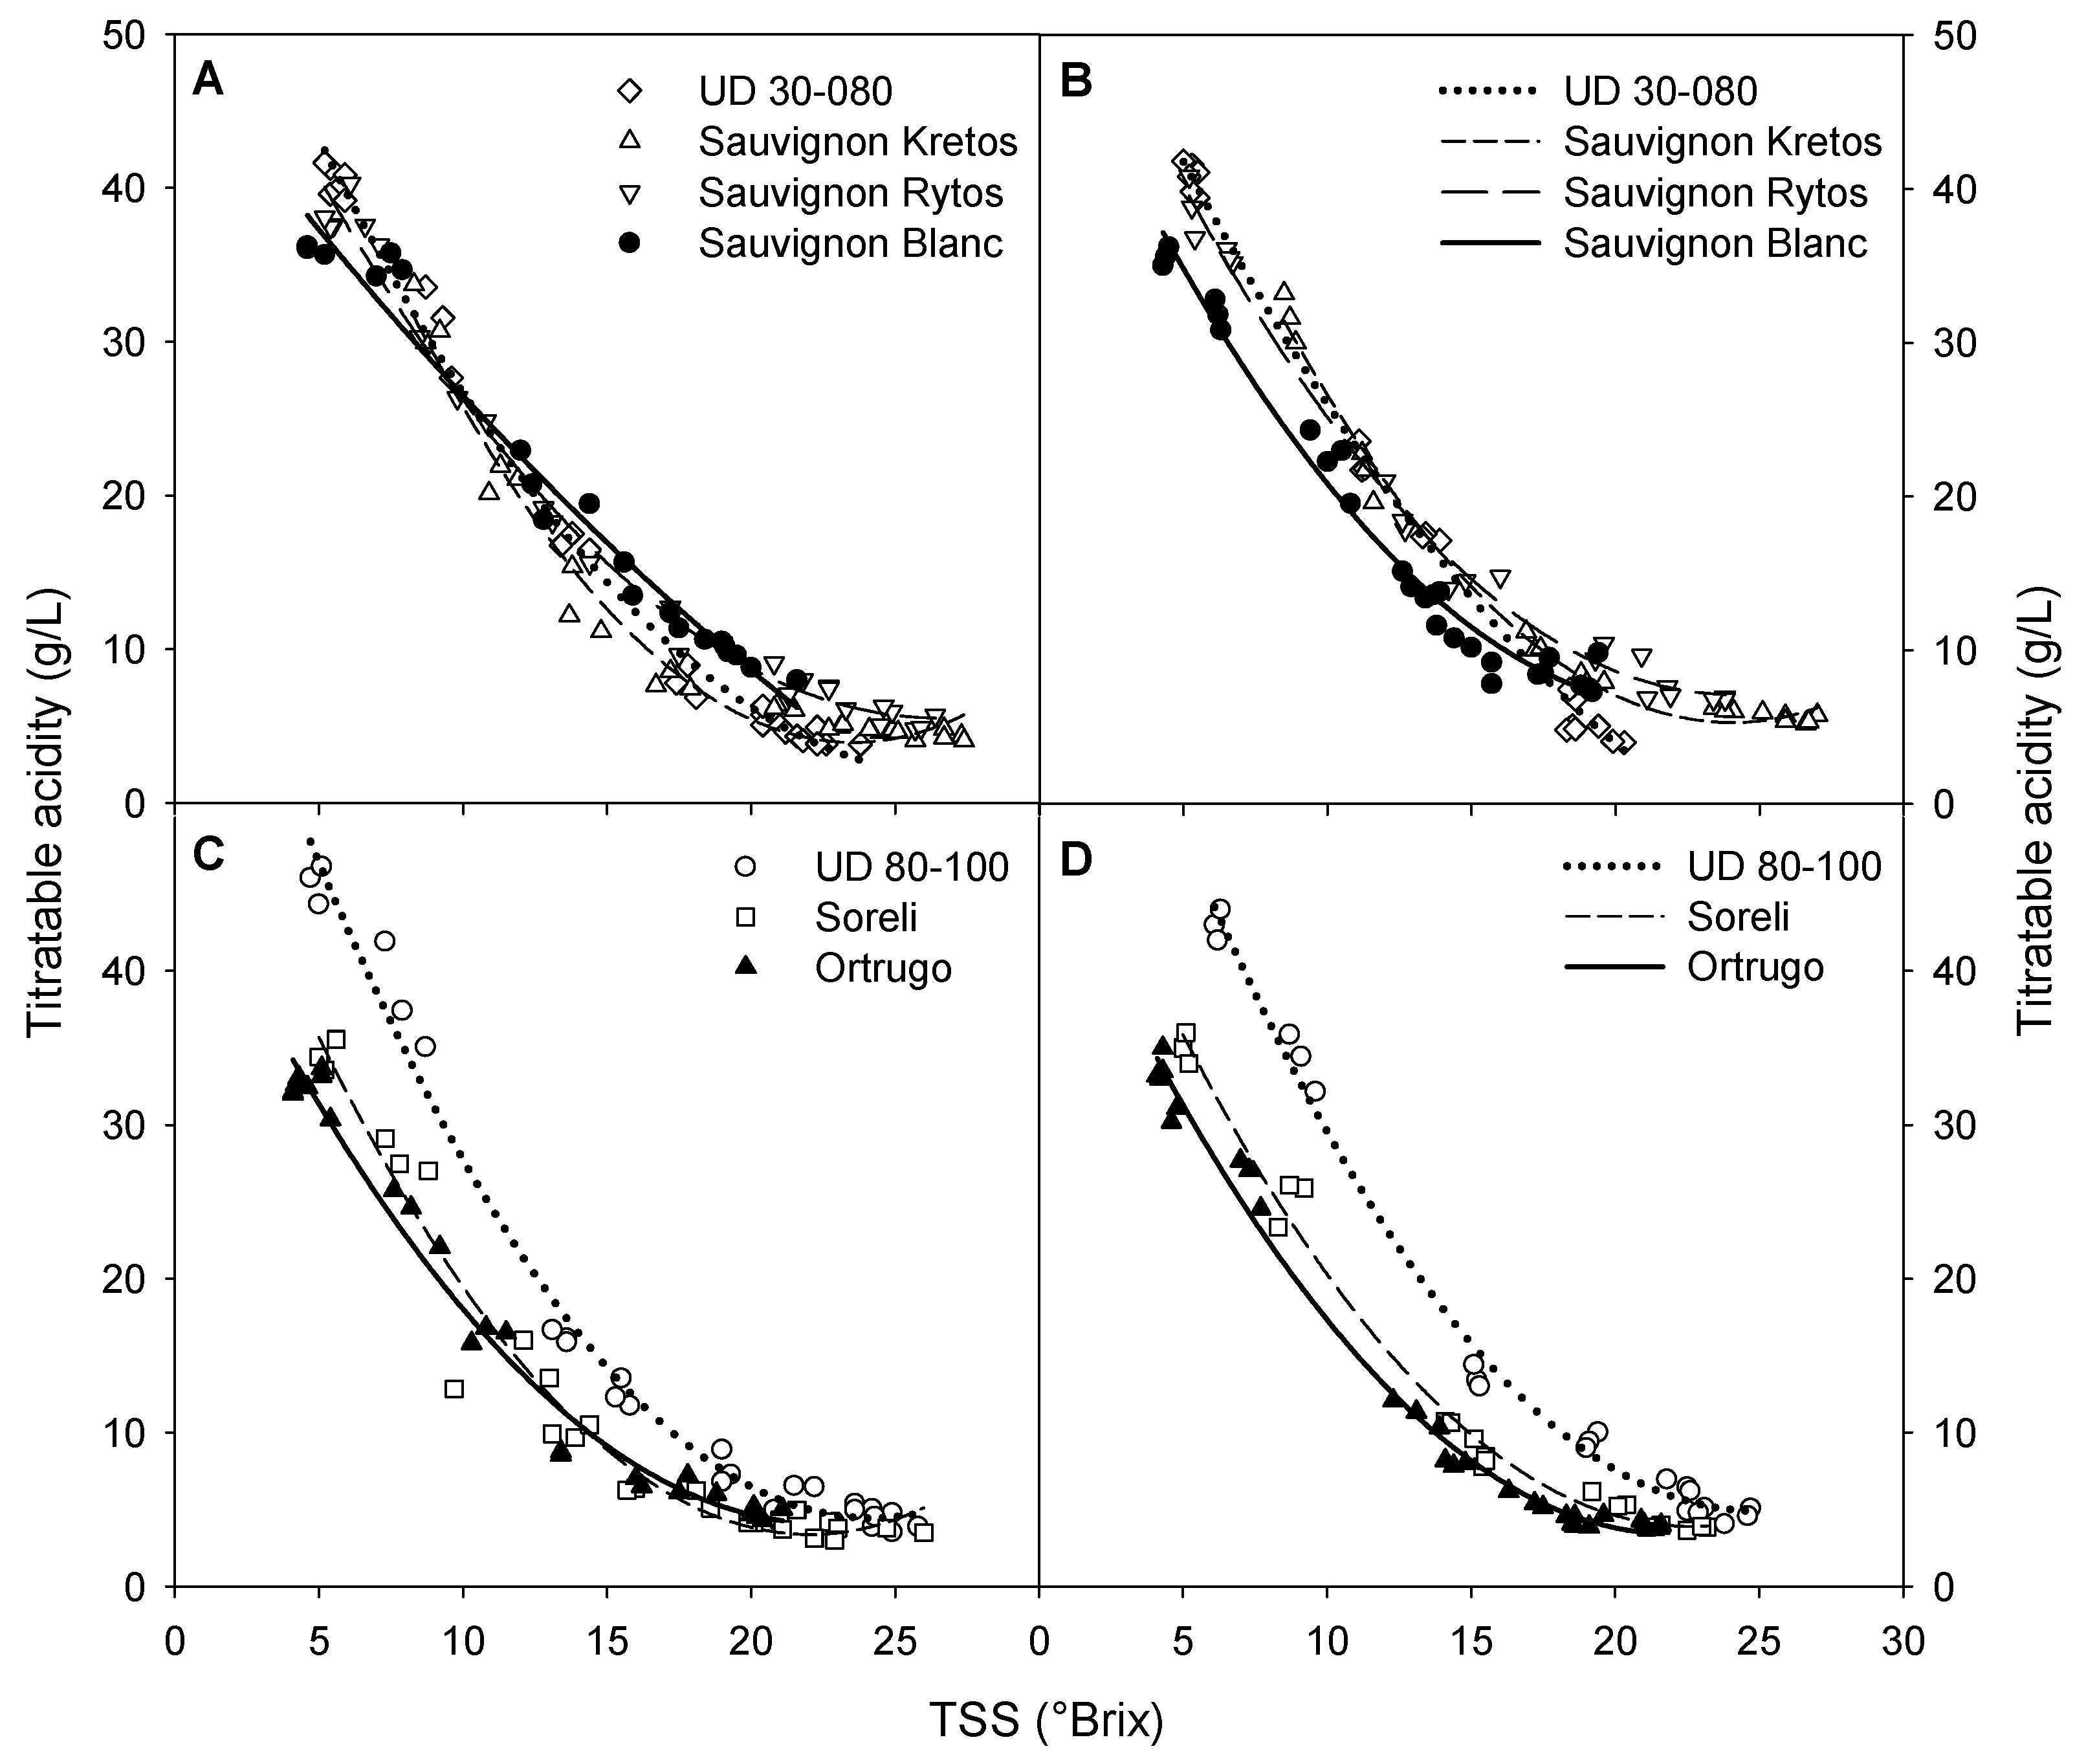
3.4. Grapes’ TSS, pH, and TA during Ripening

All PRV showed earlier berry sugar accumulation than Ortrugo and Sauvignon Blanc (Figure 2). In both years, Sauvignon Kretos had a significantly higher TSS than any of the other genotypes at any sampling date. UD 30–080 and Sauvignon Rytos had lower sugars than the other PRV right after veraison. However, later on, both genotypes showed a faster TSS accumulation rate, reducing the gap with other PRV. The threshold of 20 °Brix was achieved much earlier by the PRV in both years (Table 1). Overall, Sauvignon Blanc and Ortrugo lagged behind PRV by 15 days in 2019, and by approximately 10 days in 2020.
Similarly, must pH in PRV was constantly higher in both years (Figure 2C,D). In Sauvignon Rytos, only the dynamic of pH was more similar to the one of Ortrugo and Sauvignon Blanc, especially in 2020.
Figure 2E,F shows the early loss of TA by UD 80–100, Soreli and Sauvignon Kretos. In both years, Sauvignon Rytos maintained higher TA than other PRV until the end of the season. Ortrugo and Sauvignon Blanc showed a delayed acidity loss than Sauvignon Rytos, especially in 2019; however, Ortrugo crossed values lower than 5 g/L (on DOY 245 in 2019, on DOY 230 in 2020), whilst Sauvignon Blanc maintained a TA higher than 8 g/L until the end of the season. Over the last sampling dates, in 2019, Sauvignon Rytos tracked Ortrugo in terms of TA, whereas, in 2020, it set at intermediate levels between Ortrugo (and PRV) and Sauvignon Blanc.
All correlations between TSS and TA fit a quadratic model for any of the tested cultivars (Figure 3). The model shows that in 2019 Sauvignon Blanc, Sauvignon Kretos and UD 30–080 had similar TA for any TSS level, up to the threshold of 15 °Brix (Figure 3A). At higher TSS, Sauvignon Kretos and UD 30–080 had a TA lower than Sauvignon Rytos and Sauvignon Blanc. In 2020 (Figure 3B), conversely, Sauvignon Blanc had lower TA for any TSS below 15 °Brix, whereas, above this threshold, Sauvignon Blanc, Sauvignon Rytos, and Sauvignon Kretos grouped together and only UD 30–080 had lower TA. In both years, Ortrugo and Soreli had quite low TA for any TSS level, whereas, conversely, UD 80–100 exhibited the opposite behaviour (Figure 3C,D).

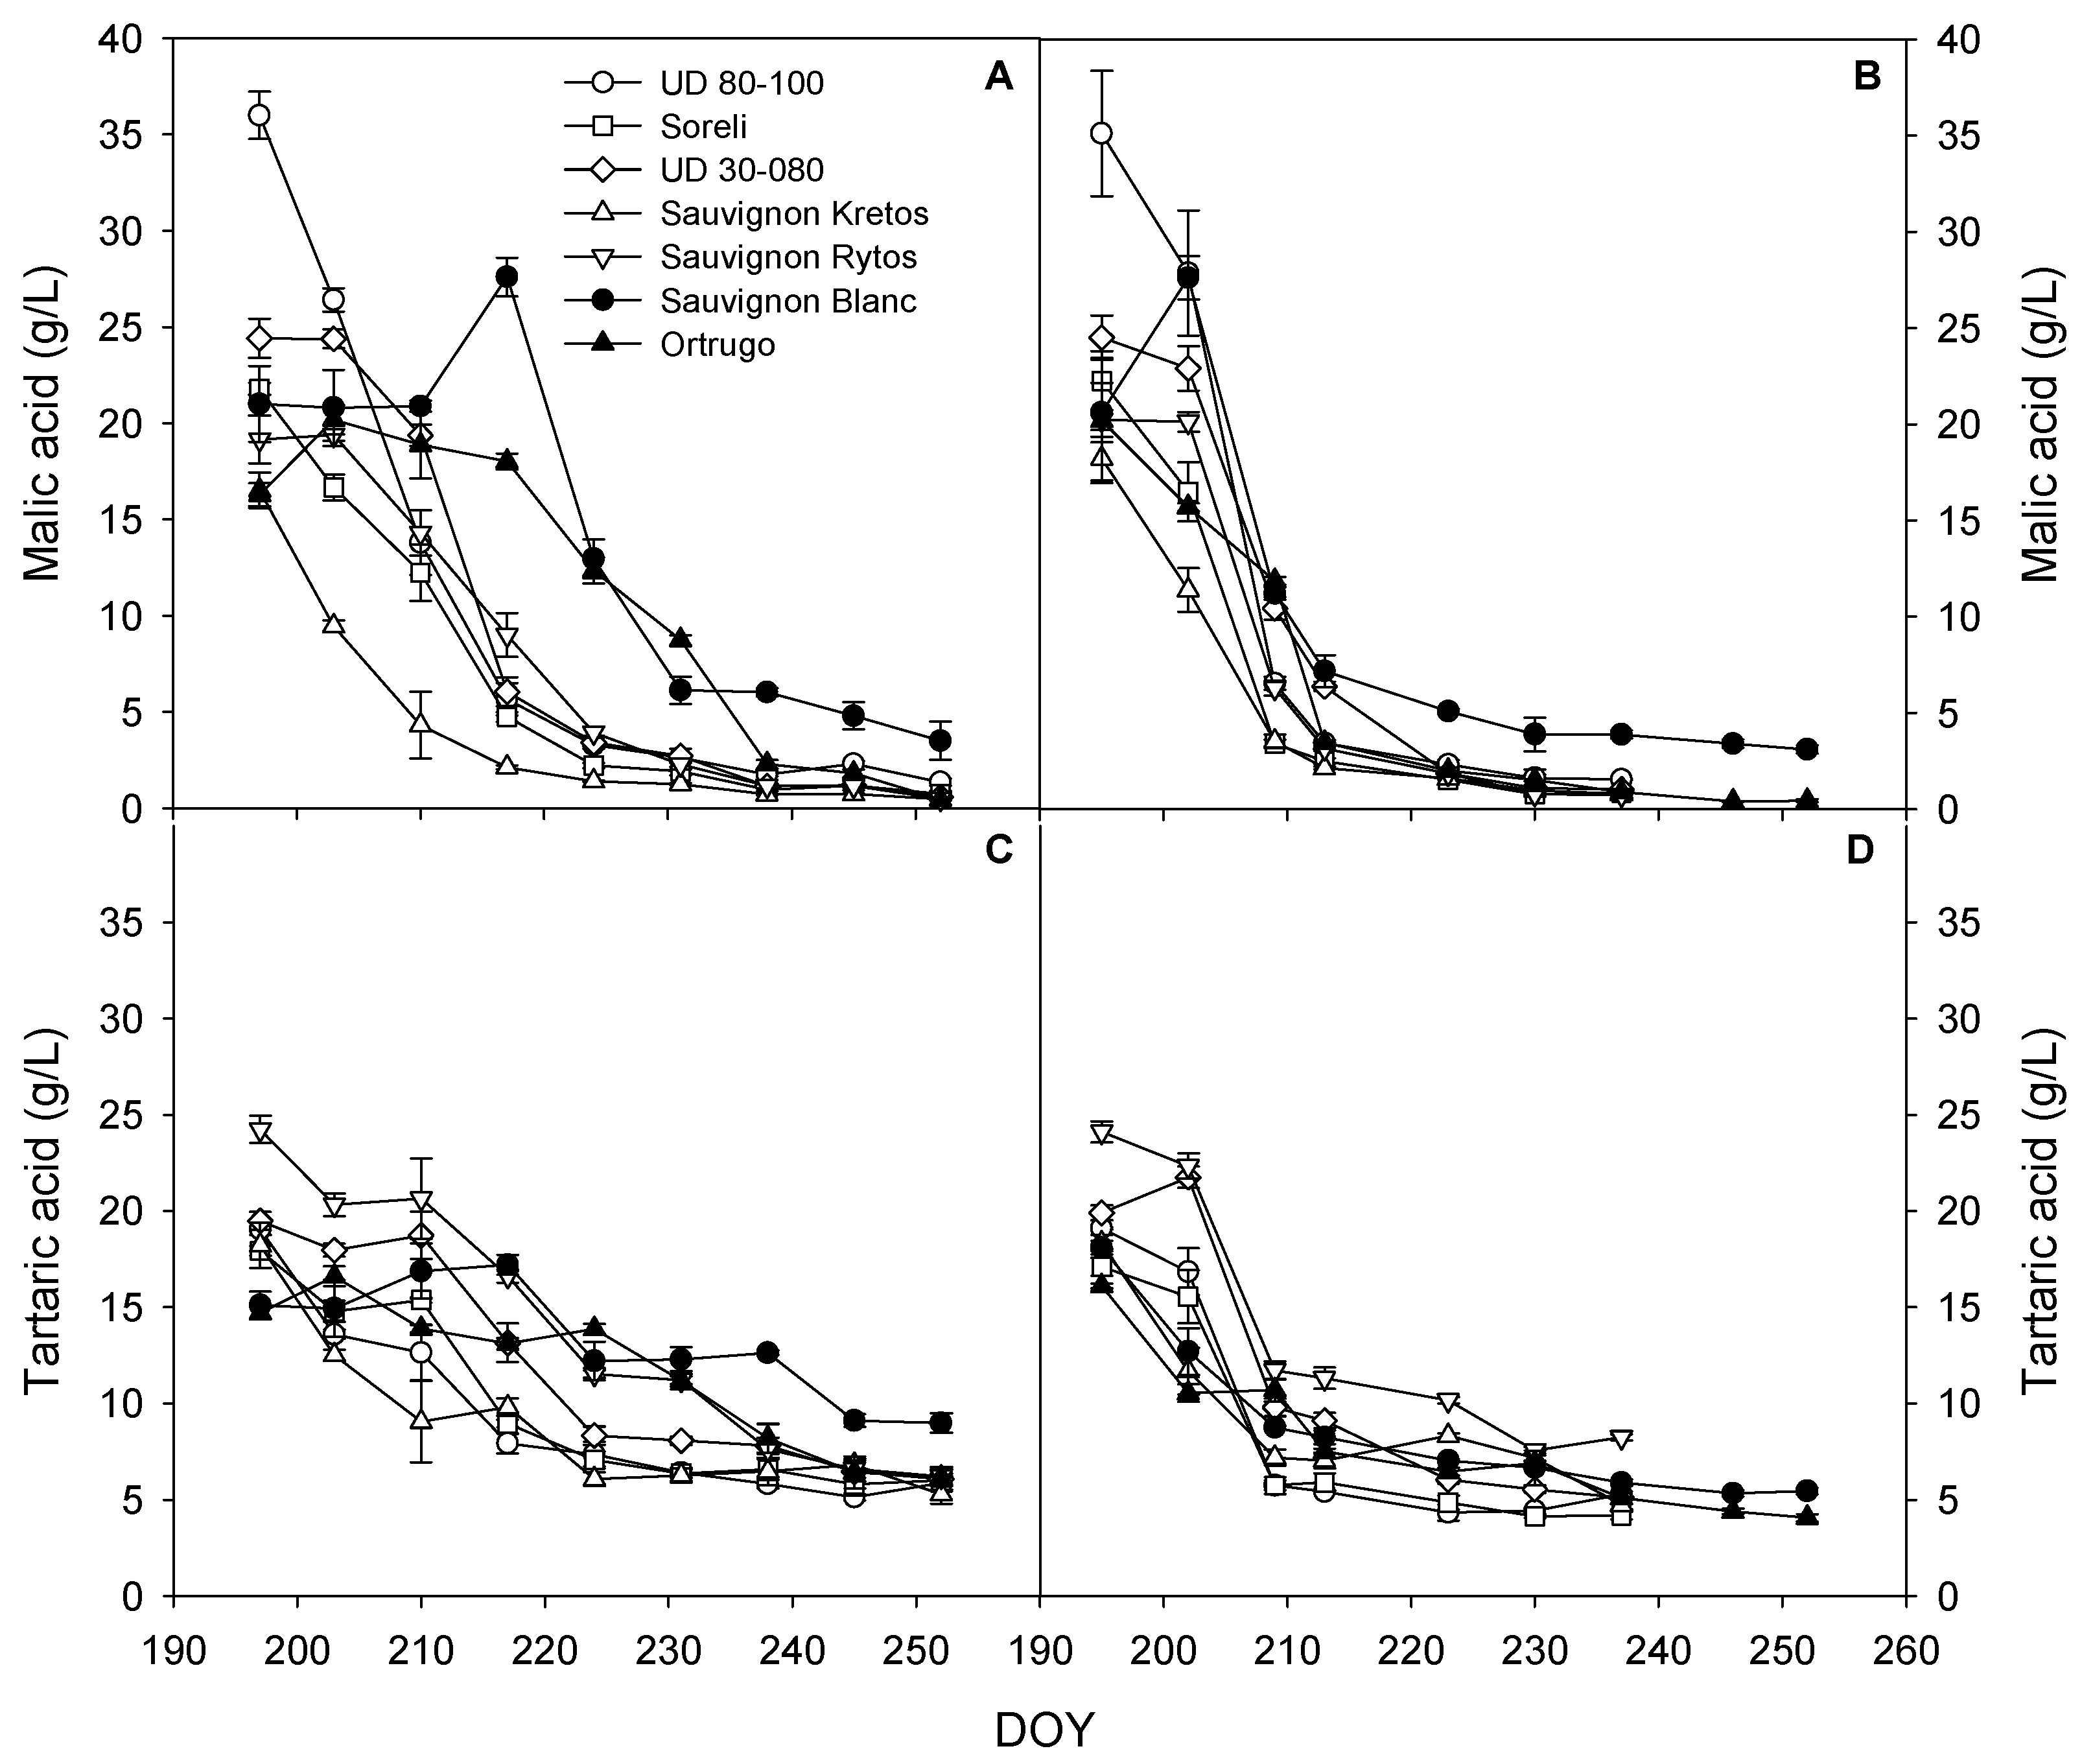
3.5. Trends for Grapes Organic Acids Concentration

In both years, UD 80–100 was the variety showing the highest malic acid concentration pre-veraison (about 35 g/L). Sauvignon Kretos had the earliest decrease of malic acid, achieving the threshold of 2.5 g/L on DOY 217 in 2019 and on DOY 213 in 2020 (Figure 4A,B, Table 1). In 2019 all the PRV had an earlier peak of malic acid and onset of its degradation, as compared to Ortrugo and Sauvignon Blanc. In 2020, this was confirmed as related to Sauvignon Blanc, even if the gap was ostensibly narrower, whereas in Ortrugo the trend of malic acid degradation was comparable to the one exhibited by Soreli and Sauvignon Rytos. In both years, at the end of the season, Ortrugo reached a minimum malic acid concentration comparable to those of PRV (below 1 g/L), whereas Sauvignon Blanc maintained significantly higher malic acid concentrations (above 2.5 g/L).
In both years, Sauvignon Rytos had the highest grapes tartaric acid concentration during ripening, if considering only PRV (Figure 4C,D). In 2019, Ortrugo and Sauvignon Blanc had lower tartaric acid than Sauvignon Rytos after veraison, even if later in the season Sauvignon Blanc maintained significantly higher tartaric acid than Ortrugo and Sauvignon Rytos (approximately +3 g/L). In 2020, conversely, Sauvignon Blanc had a similar decrease of tartaric acid to the one exhibited by Ortrugo, whereas in Sauvignon, Rytos tartaric acid concentration was consistently higher (+3.3 g/L on DOY 237).

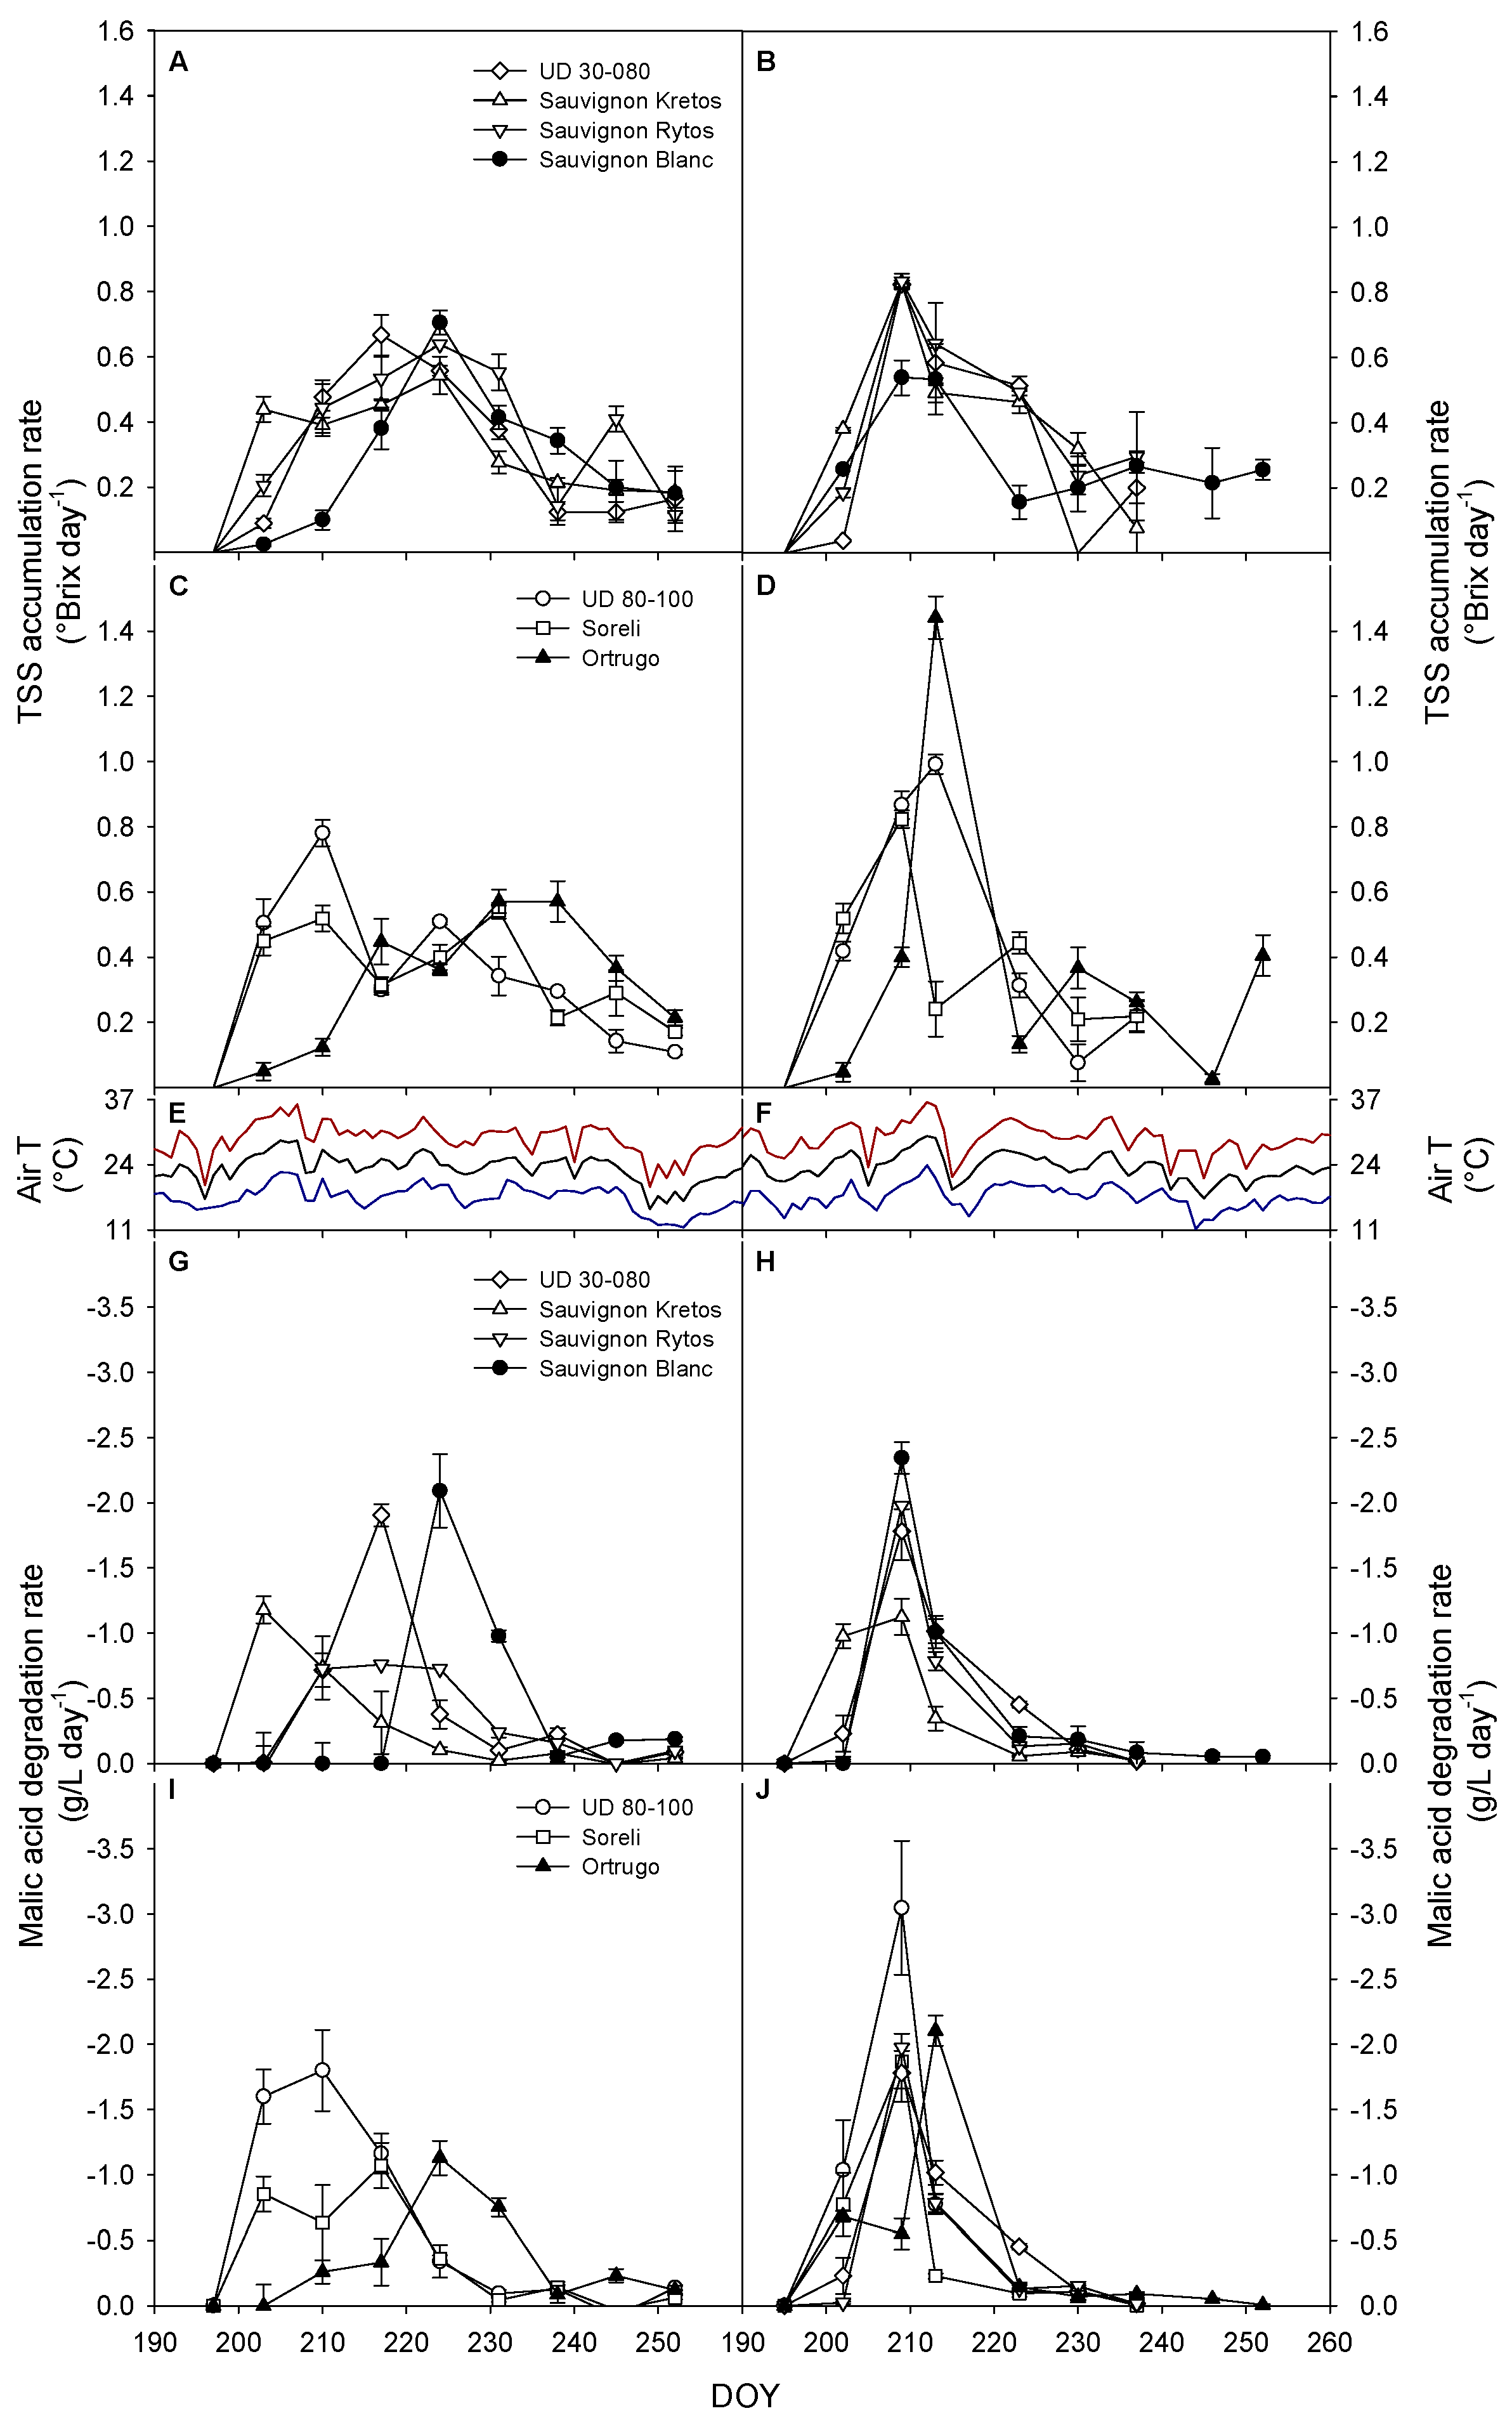
3.6. Sugar Accumulation and Malic Acid Degradation Rates

In 2019, UD-30–080, Sauvignon Kretos and Sauvignon Rytos exhibited relatively high TSS accumulation rates (Figure 5A), ranging between 0.40 and 0.65 °Brix day−1 until DOY 231. Conversely, Sauvignon Blanc jumped from 0.1 to 0.4 TSS day−1 on DOY 217 and, after peaking at 0.65 TSS day−1 on DOY 224, it decreased, together with the PRV. On the other hand, Ortrugo did not exceed 0.6 °Brix day−1, although it maintained higher sugar accumulation rates late in the season (Figure 5C). In 2020 (Figure 5B,D), PRV had a higher peak of TSS accumulation rates (0.8–1.0 °Brix day−1), as compared to the previous year, yet occurring approximately at the same DOYs (209–223). Conversely, in Sauvignon Blanc and Ortrugo, maximum TSS accumulation rates occurred much earlier than in 2019 (approximately 15–20 days). Moreover, in Ortrugo, the maximum TSS accumulation rate, recorded on DOY 214, reached the peak of 1.4 °Brix day−1, before declining to values comprised between 0.2 and 0.4 °Brix day−1 for the rest of the season.
Sauvignon Kretos was also the cultivar showing the earliest peak of malic acid degradation rate, in both years (Figure 5G,H). In 2019, Sauvignon Blanc was the variety showing the most delayed onset of malic acid degradation, with a sudden peak of 2.1 g/L day−1 occurring only on DOY 224. UD 30–080 and Sauvignon Rytos set at intermediate levels between Sauvignon Blanc and Sauvignon Kretos, in terms of timing and magnitude of malic acid degradation rates increase.
In 2020, UD 30–080 and Sauvignon Rytos had a dynamic of the degradation of malic acid comparable to the one exhibited by Sauvignon Blanc, even if this latter peaked at 2.4 g/L day−1 vs. 1.6–2.0 g/L day−1 exhibited by UD 30–080 and Sauvignon Rytos. UD 80–100 and Soreli had a malic-acid-degradation-rate dynamic comparable to other PRV (Figure 5I,J). In 2020, UD 80–100 scored, on DOY 209, the highest malic acid degradation rate recorded during the experiment (3.1 g/L day−1).

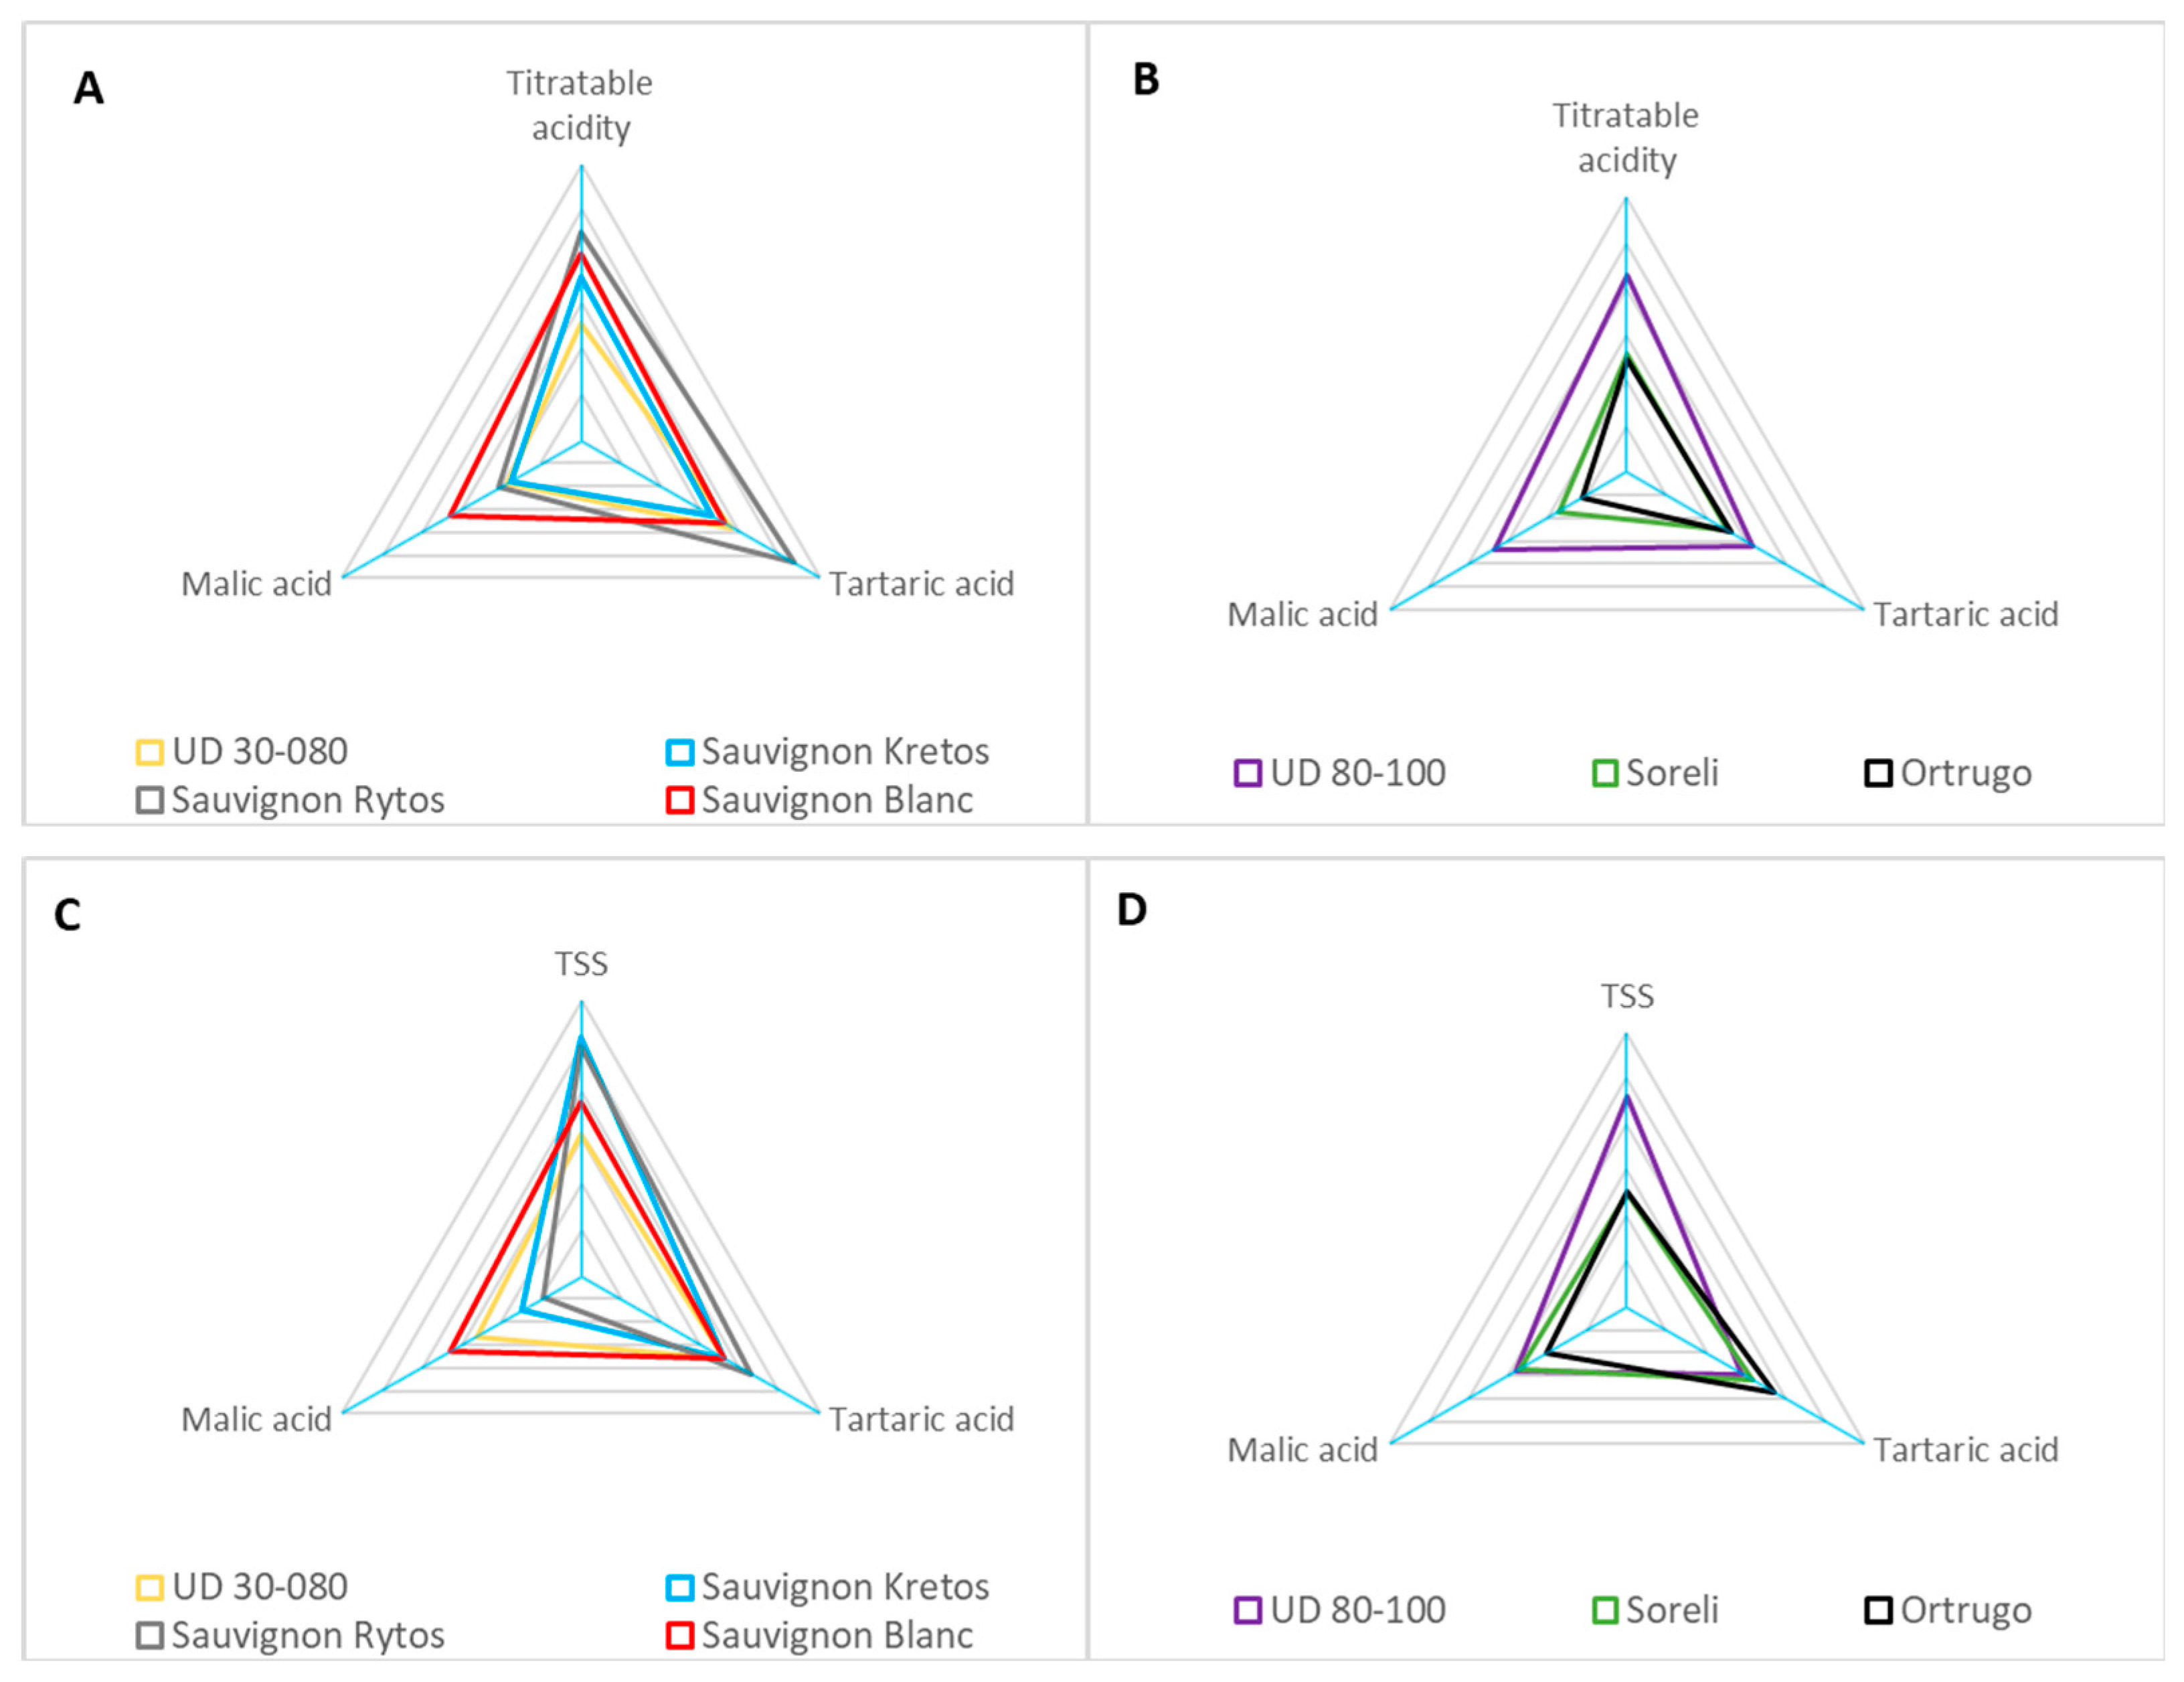
3.7. Fruit Composition at Harvest

At harvest, all the PRV had higher TSS than Ortrugo and Sauvignon Blanc (from +2.5 °Brix in Soreli to +5.5 °Brix in Sauvignon Kretos), with the sole exception of UD 30–080 (Table 4). Sauvignon Blanc was the variety showing the higher TA at harvest (8.81 g/L). Ortrugo, UD 30–080, Soreli, UD 80–100 had quite low TA, comprised between 4.08 and 5.07 g/L. By contrast, Sauvignon Rytos maintained a TA of 6.50 g/L, halfway between this group of cultivars and Sauvignon Blanc. The high TA of Sauvignon Blanc is linked to a high malic acid concentration (3.45 g/L). Conversely, in Sauvignon Rytos, the malic acid concentration at harvest was similar to those of cultivars having low TA. Sauvignon Rytos had, instead, the highest tartaric acid concentration (7.44 g/L), together with Sauvignon Blanc.
Sauvignon Blanc was the variety scoring the lowest TSS/TA and HT/HM ratio (2.16 and 2.21, respectively). Sauvignon Rytos had a TSS/TA ratio of 3.60, comparable to Ortrugo, and an HT/HM of 8.36, similar to Sauvignon Kretos (8.48). Ortrugo had a lower HT/HM than Sauvignon Rytos and Sauvignon Kretos (6.93), yet higher than all the other PRV.
Figure 6A shows that, if the tested varieties had been harvested at TSS = 20 °Brix, the acid pool of Sauvignon Rytos would be mostly contributed by tartaric acid, whereas the acidity of Sauvignon Blanc would be also driven by higher malic acid. Sauvignon Kretos and UD 30–080 would exhibit comparable tartaric acid to Sauvignon Blanc but lower malic acid, resulting in a lower TA. Figure 6B shows the low TA of Ortrugo and Soreli at 20 °Brix, linked to a very low malic acid concentration and relatively low tartaric acid level. Conversely, UD 80–100 would have retained a good balance between organic acids and total acids.
Simulated harvest at TA of 7 g/L reveals that both Sauvignon Kretos and Sauvignon Rytos would have shown higher TSS than Sauvignon Blanc, but the TA would be again linked to high tartaric acid and low malic acid, compared to Sauvignon Blanc (Figure 6C). Ortrugo and Soreli would exhibit instead very low TSS, whereas UD 80–100 shows again a good balance among TSS, malic acid, and tartaric acid (Figure 6D).

4. Discussion

Compared to Ortrugo and Sauvignon Blanc (Table 2), all tested PRV had a medium-to-high yield per vine linked to a higher shoot fruitfulness. Nowadays, remunerative productivity is a necessary requirement for new genotypes and it should be associated with desired grape quality and low to moderate susceptibility to biotic and abiotic stress [2]. Moreover, high basal bud fruitfulness allows the implementation of spur-pruning systems prone to the mechanisation of winter operations [2,37,38].
Although bud break of all tested genotypes occurred within a quite narrow time window (i.e., 4–5 days), the unseasonal low temperatures recorded in 2019 between DOYs 100–160 likely pushed back veraison in Ortrugo and Sauvignon Blanc, whereas PRV were substantially unaffected by this weather trend. This suggests that PRV have lower requirements in terms of heat accumulation to shift from vegetative activity to a prioritised reproductive activity. This trait could indicate, at the same time, a weak point or an advantage. In fact, if the advancement of phenological stages might indeed increase grapes susceptibility to sunburn and biochemical unbalances in several traditional wine districts [1,39], the PRV early veraison observed in 2019 renders these varieties more suitable to exploit cool climates or areas located at higher altitudes [40,41,42].
Overall, TSS accumulation had an earlier onset and faster pace in PRV varieties, as compared to Ortrugo and Sauvignon Blanc. The two reference varieties lagged behind PRV by 10 to 20 days in terms of TSS accumulation (Figure 2A,B), and sugar accumulation never caught up to the final TSS of any of the PRV in both seasons. Moreover, the time interval when TSS accumulation rates were higher than 0.3 °Brix day−1 was much longer in PRV than in Ortrugo and Sauvignon Blanc, especially in 2020 (Figure 5A–D). While Ortrugo and Sauvignon Blanc are well known for their slow sugar accumulation and low maximum sugar thresholds [42,43], such fast sugar accumulation dynamic exhibited especially by Sauvignon Kretos and UD 80–100 could easily lead to excessive wine alcohol content and unbalanced aroma, especially in white wines [1]. Our results are overall similar to the findings of Poni et al. [20], who compared Sangiovese and UD 72–096 (a Sangiovese x Bianca PRV).
Interestingly, the fostered sugar accumulation found in Sauvignon Kretos and some others PRV was not associated with a higher LA/Y ratio when compared to Sauvignon Blanc and Ortrugo. The only variety showing a higher LA/Y ratio was UD 30–080 (1.64 m2/kg) that, concurrently, was the PRV having the most delayed TSS pattern in both years and the lowest TSS at harvest (Figure 2A,B and Table 3). Therefore, the fast sugar accumulation observed in PRV was likely due to the actual genotype efficiency in accumulating sugars and not to differential source/sink relations among cultivars. Moreover, our data suggest that canopy management of PRV should substantially differ from that of V. vinifera cultivars such as Ortrugo and Sauvignon Blanc. For instance, Gatti et al. [44] demonstrated the effectiveness of bunch thinning in promoting faster sugar accumulation making it possible to target the enological standards required for producing Ortrugo sparkling wines (TSS of 20–21 °Brix and TA of 6.5 g/L). Accordingly, if, in the two reference cultivars, a good choice could be increasing the LA/Y ratio in order to promote TSS concentration corresponding to optimal TA, then in the PRV tested in this trial, the best strategy should be, on the contrary, to reduce LA/Y ratio trying to slow down sugar accumulation rates [37].
In ripening fruits, acidity is driven by the relative changes in the abundance of organic acids [4]. Malic acid is one of the main substrates for respiration in grapevine berries, and it is maximum pre-veraison and minimum at the end of the season [45,46]. Malic acid respiration rates are mainly driven by temperatures and the abundance of the substrate [47]. However, each genotype has a specific pattern in malic acid degradation rates and, perhaps more importantly, a different maximum and minimum organic acid concentration [48,49]. For instance, our study shows that UD 80–100 boasts the highest pre-veraison malic acid concentration among the tested varieties and that all PRV retain very low malic acid at high TSS concentrations (Figure 4A,B). The dynamic of malate degradation rates (Figure 5G–J) reveals that daily loss of malic acid is a complex function of the onset of veraison time, the pool of pre-veraison malic acid, and air temperature. In fact, in 2019, Sauvignon Blanc and Ortrugo grapes, due to their later onset of veraison, somewhat mitigated the loss of malic acid under the high temperatures recorded between DOYs 200 and 210. Contrariwise, on the same dates, all PRV had already crossed veraison and suffered a drastic malic acid loss. However, in 2019, maximum malic acid loss per day was exhibited by Sauvignon Blanc immediately after veraison, confirming that air temperature is not the only factor driving degradation rates. In 2020, when the onset of veraison time was similar for all tested cultivars, a stronger role was likely played by the availability of malate for respiration. In fact, genotypes showing the highest malic acid degradation rates corresponded with those varieties showing the highest pre-veraison malic acid pool (Figure 4B and Figure 5H,J). Moreover, our data demonstrate that malic acid degradation rates are not the main factor determining final malic acid at the end of the season. Sauvignon Blanc was indeed the variety that exhibited in both years the more intense malic acid degradation rates and the highest minimum malic acid concentration rates at the end of the season (Figure 4A,B and Figure 5G,H).
If the primary goal is screening for varieties capable to maintain adequate acidity in a hot region, two cultivars seem to be of some interest among the five tested PRV: UD 80–100 and Sauvignon Rytos. UD 80–100 shows adequate acidity at high TSS levels and optimal balance between malic and tartaric acid (Figure 3C,D and Figure 6C,D, and Table 4); however, its sugar accumulation is excessively fast, and grapes should be harvested very early (Figure 2A,B and Figure 5C,D). Sauvignon Rytos was the only PRV showing higher TA than Ortrugo in 2020, whereas, in 2019, these two varieties showed very similar malate concentration from DOY 208 to the end of the season (Figure 2A,B). Ortrugo is a variety that suffers a fast acidity loss after veraison to very low values, often not compatible with white and sparkling wine-making standards [6,44]. This is also confirmed by our data, showing poor balance among sugars, acidity, and malic vs. tartaric acid in Ortrugo, either if harvested at optimal TSS or at optimal TA thresholds (Figure 6B,D). However, Table 1 and Figure 2 show that in 2019, Ortrugo had a delayed veraison and TA loss, together with higher minimum acidity, compared to data recorded in the subsequent season. Notably, in Sauvignon Rytos, as compared to Ortrugo, optimal acidity matched higher TSS concentration, meaning that harvest might be anticipated with no detrimental effects on sugars (Table 4 and Figure 6C,D). However, data also support that Sauvignon Rytos acidity cannot be even close to that of Sauvignon Blanc, a variety that is known for the high acidity retained late in the season [50], a trait confirmed by our results (Figure 2E,F). If our data suggest that, in our conditions, Sauvignon Rytos was the PRV more capable to retain some acidity, Figure 4 reveals a relevant difference between Sauvignon Rytos and its parental Sauvignon Blanc: the former holds high acidity mostly due to the high concentration of tartaric acid, with a very limited contribution of malic acid; Sauvignon Blanc acidity at harvest relies instead on both malate and tartrate high concentration late at the end of the season (Figure 4A,B and Table 4). Different from malic acid, tartaric acid is not subjected to respiration, and changes in its abundance are mainly due to dilution and salts formation with K+ [4,45,47]. Interestingly, QTL, responding to grapes’ cation mobility and organic acid metabolism, and catabolism have been identified, and today, several breeding programmes based on MAS or new breeding technologies are in progress to obtain new varieties less responsive to organic acid depletion under high temperatures [51,52,53,54,55].
Comparing balance between organic acids at optimal TSS or TA confirms that the difference in the ratio between organic acid concentration in Sauvignon Rytos and Sauvignon Blanc grapes is consistent, either choosing optimal TSS or optimal TA as the key parameter for placing harvest time (Figure 6A,C). This is quite essential information because it suggests that acidity preservation in these two varieties should be pursued based upon contrasting strategies: in Sauvignon Blanc, in order to preserve malic acid from respiration, grapes should be protected from excessive radiation and temperature, choosing trellis system shielding bunches from direct radiation and selecting appropriate aspects and locations [42,56,57,58]. Contrariwise, in Sauvignon Rytos actions should aim at limiting berry dilution, for instance, by calibrating adequate competition for water and nutrients, and by carefully managing K+ availability and nutrition in order to contrast potassium salts formation [47].

5. Conclusions

To the best of our knowledge, ripening patterns and organic acid depletion rates in new PRV were never studied in detail. Even if many technical reports suggest that wines obtained from these varieties could have similar aromatic traits to their Vitis vinifera parentals, our data demonstrate that, in regions with significant heat summation during the summer (~2000 GDDs), PRV exhibit anticipated veraison, as compared to early ripening V. vinifera cultivars, and that their organic acids balance and sugar accumulation rates largely differ from those observed in vinifera genotypes. Sauvignon Kretos, Sauvignon Rytos, Soreli, and UD 80–100 exhibited an early and fast grape sugar accumulation. Among the tested PRV genotypes, Sauvignon Rytos was the only one capable of maintaining higher titratable acidity at harvest, due to a significant tartaric acid pool. Conversely, in the Sauvignon Blanc parental, the high acidity at harvest was linked to high final malic acid concentration, resulting in a different acidic balance.
Our work also suggests that all new PRV should be subjected to different canopy and ripening management strategies, as compared to the two reference V. vinifera cultivars, given the faster sugar accumulation rates at comparable levels of LA/Y ratio.
Overall, our data indicate that PRV could perform better in north-facing hillsides, in cooler climates, or at higher altitudes, where their good resistance to mildews could match an adequate grapes’ biochemical balance.

Supplementary Materials

The following are available online at https://www.mdpi.com/article/10.3390/horticulturae7080229/s1, Table S1: Integrated pest management protocol applied for pathogen-resistant varieties (PRV) and non-resistant cultivars, Figure S1: Ripe clusters of the five resistant cultivars evaluated in the study and their parentals with respective pedigree.

Author Contributions

Conceptualisation, T.F. and S.P.; methodology, S.P. and M.G.; investigation, T.F., C.S., F.D.Z. and P.G.; resources, S.P.; data curation, T.F.; writing—original draft preparation, T.F.; writing—review and editing, M.G., S.P., A.V., C.S, F.D.Z. and P.G.; funding acquisition, S.P. All authors have read and agreed to the published version of the manuscript.

Funding

Research partially supported by the ValorInVitis project, funded by the Emilia Romagna Region under the RDP program (PSR Emilia Romagna 2014–2020 Mis. 16.1.01 FA 2A), Grant No. 5004320, and by Catholic University of Sacred Heart D1 funds.

Institutional Review Board Statement

Not applicable.

Informed Consent Statement

Not applicable.

Data Availability Statement

The data presented in this study are available on request from the corresponding author.

Acknowledgments

The authors would like to thank Cantina Sociale di Vicobarone, Vivai Cooperativi Rauscedo, and Roberto Miravalle, for establishing the experimental vineyard; Stefano Carrà and Luca Ampeli, for the technical support in the vineyard; Maria Giulia Parisi, Lily Ronney, and Alessandra Garavani, for the technical help; Alice Richards, for revising the written English manuscript; Roberto Miravalle, Marco Profumo, Mauro Mazzocchi, Claudio Gazzola, Andrea Pradelli, and Andrea Illari, for topic discussion.

Conflicts of Interest

The authors declare no conflict of interest.

References

  1. Palliotti, A.; Tombesi, S.; Silvestroni, O.; Lanari, V.; Gatti, M.; Poni, S. Changes in vineyard establishment and canopy management urged by earlier climate-related grape ripening: A review. Sci. Hortic. 2014, 178, 43–54. [Google Scholar] [CrossRef]
  2. Poni, S.; Gatti, M.; Palliotti, A.; Dai, Z.; Duchêne, E.; Truong, T.T.; Ferrara, G.; Matarrese, A.M.S.; Gallotta, A.; Bellincontro, A.; et al. Grapevine quality: A multiple choice issue. Sci. Hortic. 2018, 234, 445–462. [Google Scholar] [CrossRef] [Green Version]
  3. Bernardo, S.; Dinis, L.T.; Machado, N.; Moutinho-Pereira, J. Grapevine abiotic stress assessment and search for sustainable adaptation strategies in Mediterranean-like climates. A review. Agron. Sustain. Dev. 2018, 38, 66. [Google Scholar] [CrossRef] [Green Version]
  4. Duchêne, E.; Huard, F.; Dumas, V.; Schneider, C.; Merdinoglu, D. The challenge of adapting grapevine varieties to climate change. Clim. Res. 2010, 41, 193–204. [Google Scholar] [CrossRef] [Green Version]
  5. Moran, M.A.; Sadras, V.O.; Petrie, P.R. Late pruning and carry-over effects on phenology, yield components and berry traits in Shiraz. Aust. J. Grape Wine Res. 2017, 23, 390–398. [Google Scholar] [CrossRef]
  6. Frioni, T.; Bertoloni, G.; Squeri, C.; Garavani, A.; Ronney, L.; Poni, S.; Gatti, M. Biodiversity of Local Vitis vinifera L. Germplasm: A Powerful Tool Toward Adaptation to Global Warming and Desired Grape Composition. Front. Plant Sci. 2020, 11, 608. [Google Scholar] [CrossRef] [PubMed]
  7. Garrett, K.A.; Nita, M.; De Wolf, E.D.; Esker, P.D.; Gomez-Montano, L.; Sparks, A.H. Plant pathogens as indicators of climate change. In Climate Change; Elsevier: Amsterdam, The Netherlands, 2021; pp. 499–513. [Google Scholar]
  8. Zambito Marsala, R.; Capri, E.; Russo, E.; Bisagni, M.; Colla, R.; Lucini, L.; Gallo, A.; Suciu, N.A. First evaluation of pesticides occurrence in groundwater of Tidone Valley, an area with intensive viticulture. Sci. Total Environ. 2020, 736, 139730. [Google Scholar] [CrossRef] [PubMed]
  9. Pedneault, K.; Provost, C. Fungus resistant grape varieties as a suitable alternative for organic wine production: Benefits, limits, and challenges. Sci. Hortic. 2016, 208, 57–77. [Google Scholar] [CrossRef]
  10. Töpfer, R.; Hausmann, L.; Harst, M.; Maul, E.; Zyprian, E.; Eibach, R. New horizons for grapevine breeding. Fruit Veg. Cereal Sci. Biotechnol. 2011, 5, 79–100. [Google Scholar]
  11. Montaigne, E.; Coelho, A.; Khefifi, L. Economic issues and perspectives on innovation in new resistant grapevine varieties in France. Wine Econ. Policy 2016, 5, 73–77. [Google Scholar] [CrossRef]
  12. Pertot, I.; Caffi, T.; Rossi, V.; Mugnai, L.; Hoffmann, C.; Grando, M.S.; Gary, C.; Lafond, D.; Duso, C.; Thiery, D.; et al. A critical review of plant protection tools for reducing pesticide use on grapevine and new perspectives for the implementation of IPM in viticulture. Crop Prot. 2017, 97, 70–84. [Google Scholar] [CrossRef]
  13. Bavaresco, L.; Gardiman, M.; Brancadoro, L.; Espen, L.; Failla, O.; Scienza, A.; Vezzulli, S.; Zulini, L.; Velasco, R.; Stefanini, M.; et al. Grapevine breeding programs in Italy. In Grapevine Breeding Programs for the Wine Industry; Elsevier Inc.: Amsterdam, The Netherlands, 2015; pp. 135–157. ISBN 978-1-78242-080-4. [Google Scholar]
  14. Di Gaspero, G.; Foria, S. Molecular grapevine breeding techniques. In Grapevine Breeding Programs for the Wine Industry; Elsevier Inc.: Amsterdam, The Netherlands, 2015; pp. 23–37. ISBN 978-1-78242-080-4. [Google Scholar]
  15. Vezzulli, S.; Dolzani, C.; Migliaro, D.; Banchi, E.; Stedile, T.; Zatelli, A.; Dallaserra, M.; Clementi, S.; Dorigatti, C.; Velasco, R.; et al. The Fondazione Edmund Mach grapevine breeding program for downy and powdery mildew resistances: Toward a green viticulture. Acta Hortic. 2019, 1248, 109–113. [Google Scholar] [CrossRef]
  16. Bove, F.; Bavaresco, L.; Caffi, T.; Rossi, V. Assessment of Resistance Components for Improved Phenotyping of Grapevine Varieties Resistant to Downy Mildew. Front. Plant Sci. 2019, 10, 1559. [Google Scholar] [CrossRef]
  17. Casagrande, K.; Falginella, L.; Castellarin, S.D.; Testolin, R.; Di Gaspero, G. Defence responses in Rpv3-dependent resistance to grapevine downy mildew. Planta 2011, 234, 1097–1109. [Google Scholar] [CrossRef] [PubMed]
  18. Vezzulli, S.; Vecchione, A.; Stefanini, M.; Zulini, L. Downy mildew resistance evaluation in 28 grapevine hybrids promising for breeding programs in Trentino region (Italy). Eur. J. Plant Pathol. 2018, 150, 485–495. [Google Scholar] [CrossRef]
  19. Zanghelini, J.A.; Bogo, A.; Dal Vesco, L.L.; Gomes, B.R.; Mecabô, C.V.; Herpich, C.H.; Welter, L.J. Response of PIWI grapevine cultivars to downy mildew in highland region of southern Brazil. Eur. J. Plant Pathol. 2019, 154, 1051–1058. [Google Scholar] [CrossRef]
  20. Poni, S.; Chiari, G.; Caffi, T.; Bove, F.; Tombesi, S.; Moncalvo, A.; Gatti, M. Canopy physiology, vine performance and host-pathogen interaction in a fungi resistant cv. Sangiovese x Bianca accession vs. a susceptible clone. Sci. Rep. 2017, 7, 1–14. [Google Scholar] [CrossRef] [Green Version]
  21. Casanova-Gascón, J.; Ferrer-Martín, C.; Bernad-Eustaquio, A.; Elbaile-Mur, A.; Ayuso-Rodríguez, J.M.; Torres-Sánchez, S.; Jarne-Casasús, A.; Martín-Ramos, P. Behavior of vine varieties resistant to fungal diseases in the Somontano region. Agronomy 2019, 9, 738. [Google Scholar] [CrossRef] [Green Version]
  22. Zambon, Y.; Khavizova, A.; Colautti, M.; Georgofili, E.S. Varietà di Vite Resistenti Alle Malattie e Rame: Opportunità e Limiti. In Riflessioni Sull’uso del Rame per la Protezione Delle Piante; Accademia dei Georgofili, Quaderni 2019-III, Società Editrice Fiorentina: Firenze, Italy, 2020. [Google Scholar]
  23. Gratl, V.; Sturm, S.; Zini, E.; Letschka, T.; Stefanini, M.; Vezzulli, S.; Stuppner, H. Comprehensive polyphenolic profiling in promising resistant grapevine hybrids including 17 novel breeds in northern Italy. J. Sci. Food Agric. 2021, 101, 2380–2388. [Google Scholar] [CrossRef]
  24. Gelmetti, A.; Roman, T.; Bottura, M.; Stefanini, M.; Pedò, S. Performance agronomiche di viti resistenti. Primi risultati di un progetto poliennale. Vite e Vino 2019, 2, 54–61. [Google Scholar]
  25. Nicolini, G.; Barp, L.; Roman, T.; Larcher, R.; Malacarne, M.; Bottura, M.; Tait, F.; Battisti, F.; Mereles, M.S.; Battistella, R. Resistenti bianchi e rossi: Primi dati da esperienze trentine sulla concentrazione nei vini di shikimico e flavonoidi. L’Enologo 2018, 3, 89–93. [Google Scholar]
  26. Ruehl, E.; Schmid, J.; Eibach, R.; Töpfer, R. Grapevine breeding programmes in Germany. In Grapevine Breeding Programs for the Wine Industry; Elsevier Inc.: Amsterdam, The Netherlands, 2015; pp. 77–101. ISBN 978-1-78242-080-4. [Google Scholar]
  27. Frioni, T.; Green, A.; Emling, J.E.; Zhuang, S.; Palliotti, A.; Sivilotti, P.; Falchi, R.; Sabbatini, P. Impact of spring freeze on yield, vine performance and fruit quality of Vitis interspecific hybrid Marquette. Sci. Hortic. 2017, 219, 302–309. [Google Scholar] [CrossRef]
  28. Teissedre, P.L. Composition of grape and wine from resistant vine varieties. OENO One 2018, 52, 197–203. [Google Scholar] [CrossRef]
  29. Pedò, S.; Bottura, M.; Porro, D. Development, yield potential and nutritional aspects of resistant grapevine varieties in Trentino Alto Adige. BIO Web Conf. 2019, 13, 02004. [Google Scholar] [CrossRef]
  30. Smith, M.S.; Centinari, M. Young grapevines exhibit interspecific differences in hydraulic response to freeze stress but not in recovery. Planta 2019, 250, 495–505. [Google Scholar] [CrossRef]
  31. Hed, B.; Centinari, M. Gibberellin application improved bunch rot control of vignoles grape, but response to mechanical defoliation varied between training systems. Plant Dis. 2021, 105, 339–345. [Google Scholar] [CrossRef]
  32. Tóth-Lencsés, A.K.; Kozma, P.; Szőke, A.; Kerekes, A.; Veres, A.; Kiss, E. Parentage analysis in Hungarian grapevine cultivars of “Seibel’-’Seyve-Villard” origin. Vitis 2015, 54, 27–29. [Google Scholar]
  33. Venuti, S.; Copetti, D.; Foria, S.; Falginella, L.; Hoffmann, S.; Bellin, D.; Cindrić, P.; Kozma, P.; Scalabrin, S.; Morgante, M.; et al. Historical Introgression of the Downy Mildew Resistance Gene Rpv12 from the Asian Species Vitis amurensis into Grapevine Varieties. PLoS ONE 2013, 8, e61228. [Google Scholar] [CrossRef] [PubMed]
  34. Winkler, A. General Viticulture; University of California Press: Berkeley, CA, USA, 1965. [Google Scholar]
  35. Lorenz, D.H.; Eichhorn, K.W.; Bleiholder, H.; Klose, R.; Meier, U.; Weber, E. Growth Stages of the Grapevine: Phenological growth stages of the grapevine (Vitis vinifera L. ssp. vinifera)—Codes and descriptions according to the extended BBCH scale. Aust. J. Grape Wine Res. 1995, 1, 100–103. [Google Scholar] [CrossRef]
  36. Gatti, M.; Garavani, A.; Krajecz, K.; Ughini, V.; Parisi, M.G.; Frioni, T.; Poni, S. Mechanical mid-shoot leaf removal on ortrugo (Vitis vinifera L.) at pre-or mid-veraison alters fruit growth and maturation. Am. J. Enol. Vitic. 2019, 70, 88–97. [Google Scholar] [CrossRef]
  37. Kliewer, W.M.; Dokoozlian, N.K. Leaf Area/Crop Weight Ratios of Grapevines: Influence on Fruit Composition and Wine Quality. Am. J. Enol. Vitic. 2005, 56, 170–181. [Google Scholar]
  38. Poni, S.; Tombesi, S.; Palliotti, A.; Ughini, V.; Gatti, M. Mechanical winter pruning of grapevine: Physiological bases and applications. Sci. Hortic. 2016, 204, 88–98. [Google Scholar] [CrossRef]
  39. Jarvis, C.; Darbyshire, R.; Goodwin, I.; Barlow, E.W.R.; Eckard, R. Advancement of winegrape maturity continuing for winegrowing regions in Australia with variable evidence of compression of the harvest period. Aust. J. Grape Wine Res. 2018, 25, 101–108. [Google Scholar] [CrossRef] [Green Version]
  40. Gladstones, J. Viticulture and Environment; Winetitles: Adelaide, Australia, 1992. [Google Scholar]
  41. Kemp, B.; Pedneault, K.; Pickering, G.; Usher, K.; Willwerth, J. Red Winemaking in Cool Climates. In Red Wine Technology; Elsevier: Amsterdam, The Netherlands, 2018; pp. 341–356. ISBN 978-0-12814-400-8. [Google Scholar]
  42. Frioni, T.; Bronzoni, V.; Moncalvo, A.; Poni, S.; Gatti, M. Evaluation of local minor cultivars and marginal areas to improve wines and increase the sustainability of the district ‘Colli Piacentini’. Acta Hortic. 2020, 1276, 111–118. [Google Scholar] [CrossRef]
  43. Nistor, E.; Dobrei, A.G.; Dobrei, A.; Camen, D. Growing Season Climate Variability and its Influence on Sauvignon Blanc and Pinot Gris Berries and Wine Quality: Study Case in Romania (2005–2015). S. Afr. J. Enol. Vitic. 2018, 39, 196–207. [Google Scholar] [CrossRef]
  44. Gatti, M.; Garavani, A.; Cantatore, A.; Parisi, M.G.; Bobeica, N.; Merli, M.C.; Vercesi, A.; Poni, S. Interactions of summer pruning techniques and vine performance in the white Vitis vinifera cv. Ortrugo. Aust. J. Grape Wine Res. 2015, 21, 80–89. [Google Scholar] [CrossRef]
  45. Hale, C.R. Synthesis of Organic Acids in the Fruit of the Grape. Nature 1962, 195, 917–918. [Google Scholar] [CrossRef]
  46. Sweetman, C.; Deluc, L.G.; Cramer, G.R.; Ford, C.M.; Soole, K.L. Regulation of malate metabolism in grape berry and other developing fruits. Phytochemistry 2009, 70, 1329–1344. [Google Scholar] [CrossRef]
  47. Ford, C.M. The Biochemistry of organic acids in the Grape. In The Biochemistry of the Grape Berry; Geròs, H., Chaves, M.M., Delrot, S., Eds.; Bentham Books: Dubai, United Arab Emirates, 2012; pp. 67–88. [Google Scholar]
  48. Famiani, F.; Farinelli, D.; Frioni, T.; Palliotti, A.; Battistelli, A.; Moscatello, S.; Walker, R.P. Malate as substrate for catabolism and gluconeogenesis during ripening in the pericarp of different grape cultivars. Biol. Plant. 2016, 60, 155–162. [Google Scholar] [CrossRef]
  49. Famiani, F.; Battistelli, A.; Moscatello, S.; Cruz-Castillo, J.G.; Walker, R.P. The organic acids that are accumulated in the flesh of fruits: Occurrence, metabolism and factors affecting their contents—A review. Rev. Chapingo. Ser. Hortic. 2015, 21, 97–128. [Google Scholar] [CrossRef]
  50. Ewart, A.J.W.; Gawel, R.; Thistlewood, S.P.; McCarthy, M.G. Evaluation of must composition and wine quality of six clones of Vitis vinifera cv. Sauvignon Blanc. J. Exp. Agric. 1993, 33, 945–951. [Google Scholar] [CrossRef]
  51. Costantini, L.; Battilana, J.; Lamaj, F.; Fanizza, G.; Grando, M.S. Berry and phenology-related traits in grapevine (Vitis vinifera L.): From Quantitative Trait Loci to underlying genes. BMC Plant Biol. 2008, 8, 1–17. [Google Scholar] [CrossRef] [Green Version]
  52. Duchêne, É. How can grapevine genetics contribute to the adaptation to climate change? OENO One 2016, 50, 113–124. [Google Scholar] [CrossRef] [Green Version]
  53. Bayo-Canha, A.; Costantini, L.; Fernández-Fernández, J.I.; Martínez-Cutillas, A.; Ruiz-García, L. QTLs Related to Berry Acidity Identified in a Wine Grapevine Population Grown in Warm Weather. Plant Mol. Biol. Report. 2019, 37, 157–169. [Google Scholar] [CrossRef]
  54. Bigard, A.; Berhe, D.T.; Maoddi, E.; Sire, Y.; Boursiquot, J.M.; Ojeda, H.; Péros, J.P.; Doligez, A.; Romieu, C.; Torregrosa, L. Vitis vinifera L. fruit diversity to breed varieties anticipating climate changes. Front. Plant Sci. 2018, 9, 455. [Google Scholar] [CrossRef] [Green Version]
  55. Bigard, A.; Romieu, C.; Sire, Y.; Torregrosa, L. Vitis vinifera L. Diversity for Cations and Acidity Is Suitable for Breeding Fruits Coping With Climate Warming. Front. Plant Sci. 2020, 11, 1175. [Google Scholar] [CrossRef] [PubMed]
  56. Bernizzoni, F.; Gatti, M.; Civardi, S.; Poni, S. Long-term Performance of Barbera Grown under Different Training Systems and Within-Row Vine Spacings. Am. J. Enol. Vitic. 2009, 60, 339–348. [Google Scholar]
  57. Reynolds, A.G.; Vanden Heuvel, J.E. Influence of Grapevine Training Systems on Vine Growth and Fruit Composition: A Review. Am. J. Enol. Vitic. 2009, 60, 251–268. [Google Scholar]
  58. Dinis, L.T.; Malheiro, A.C.; Luzio, A.; Fraga, H.; Ferreira, H.; Gonçalves, I.; Pinto, G.; Correia, C.M.; Moutinho-Pereira, J. Improvement of grapevine physiology and yield under summer stress by kaolin-foliar application: Water relations, photosynthesis and oxidative damage. Photosynthetica 2018, 56, 641–651. [Google Scholar] [CrossRef]
Figure 1. Seasonal daily trends of minimum temperature (Tmin), mean temperature (Tmean), maximum temperature (Tmax), rainfall (blue bars), and heat accumulation (cumulative GDDs) calculated following Winkler [34] in 2019 (A) and 2020 (B). DOY = day of the year.
Horticulturae 07 00229 g001
Figure 2. Seasonal evolution of grapes total soluble solids (TSS, panels A,B), pH (C,D) and titratable acidity (E,F) in 2019 (A,C,E) and 2020 (B,D,F) for 5 pathogens-resistant varieties (white symbols) and 2 reference V. vinifera cultivars (black symbols). Each point represents the average of three replicates ± SE. DOY = day of year.
Horticulturae 07 00229 g002
Figure 3. Seasonal variation of titratable acidity expressed as a function of total soluble solids (TSS) in 2019 (A,C), and 2020 (B,D), for 5 pathogens-resistant varieties (white symbols) and 2 reference V. vinifera cultivars (black symbols). Data were fit to the following equations: UD 30–080 2019 y = 70.07 − 5.62x + 0.12x2, R2 = 0.994; UD 30–080 2020 y = 60.68 − 4.10x + 0.06x2, R2 = 0.996; Sauvignon Kretos 2019 y = 67.86 − 5.21x + 0.11x2, R2 = 0.976; Sauvignon Kretos 2020 y = 63.80 − 4.54x + 0.08x2, R2 = 0.991; Sauvignon Rytos 2019 y = 58.94 − 4.03x + 0.08x2, R2 = 0.991; Sauvignon Rytos 2020 y = 59.89 − 4.39x + 0.09x2, R2 = 0.993; Sauvignon Blanc 2019 y = 49.32 − 2.53x + 0.02x2, R2 = 0.971; Sauvignon Blanc 2020 y = 53.47 − 4.20x + 0.09x2, R2 = 0.980; UD 80–100 2019 y = 72.20 − 5.60x + 0.12x2, R2 = 0.989; UD 80–100 2020 y = 73.80 − 5.53x + 0.11x2, R2 = 0.992; Soreli 2019 y = 57.47.86 − 4.91x + 0.11x2, R2 = 0.966; Soreli 2020 y = 56.61 − 4.66x + 0.10x2, R2 = 0.989; Ortrugo 2019 y = 49.13 − 4.00x + 0.09x2, R2 = 0.983; Ortrugo 2020 y = 50.06 − 4.23x + 0.10x2, R2 = 0.991. All the correlations listed were significant per p < 0.05.
Horticulturae 07 00229 g003
Figure 4. Seasonal evolution of grapes malic acid (panels A,B) and tartaric acid (C,D) in 2019 (A,C) and 2020 (B,D) for 5 pathogens-resistant varieties (white symbols) and 2 reference V. vinifera cultivars (black symbols). Each point represents the average of three replicates ± SE. DOY = day of year.
Horticulturae 07 00229 g004
Figure 5. Seasonal evolution of grapes total soluble solids accumulation rates (panels AD), malic acid degradation rate (panels GJ) and minimum temperature (blue line), mean temperature (grey line), and maximum temperatures (red lines) of the period (panels E,F) in 2019 (A,C,E,G,I) and 2020 (B,D,F,H,J) for 5 pathogens-resistant varieties (white symbols) and 2 reference V. vinifera cultivars (black symbols). Each point represents the average of three replicates ± SE. DOY = day of year. T = temperature.
Horticulturae 07 00229 g005
Figure 6. Balance among titratable acidity and organic acids in grapes of 5 pathogens-resistant varieties and 2 reference V. vinifera cultivars, at the total soluble solids threshold of about 20 °Brix (panels A,B) and balance among total soluble solids and organic acids in grapes of the same varieties, at the titratable acidity threshold of about 7 g/L (panels C,D). Scaling for titratable acidity and tartaric acid is 0–12 g/L, for malic acid is 0–6 g/L, and for total soluble solids is 12–24 °Brix. Data pooled over two seasons.
Horticulturae 07 00229 g006
Table 1. Date of achievement of main phenological stages and key ripening thresholds for five pathogen-resistant grapevine genotypes and two non-resistant Vitis vinifera cultivars in 2019 and 2020.
Cultivar
UD 80–100SoreliUD 30–080Sauvignon KretosSauvignon RytosSauvignon BlancOrtrugo
2019(DOY) 1
BBCH09 292909293929294
BBCH81 2203203210197210217217
TSStr 3224231231224231252245
Matr 3224224231217231252238
2020
BBCH09 290909292929295
BBCH81 2202202209195202209209
TSStr 3213223237213223252252
Matr 3223213223213213252223
1 DOY = day of the year. 2 Phenological stages were identified according to Lorenz et al. [35]. 3 TSStr = achievement of grapes total soluble solids threshold of 20 ± 1 °Brix; MAtr = achievement of grapes malic acid threshold of 2.5 ± 0.5 g/L.
Table 2. Vegetative growth and shoot fruitfulness of five pathogen-resistant grapevine genotypes and two non-resistant Vitis vinifera cultivars in 2019 and 2020.
CultivarMain Shoots Leaf AreaLateral Shoots Leaf AreaVine Total Leaf AreaShoot FruitfulnessShoot Fruitfulness
Nodes 0–2
(m2/Vine)(m2/Vine)(m2/Vine)(N. Inflorescences/Shoot)(N. Inflorescences/Shoot)
UD 80–1002.38 b 20.352.73 ab1.36 b1.16 ab
Soreli2.96 ab0.323.27 ab1.76 a1.51 a
UD 30–0803.17 a0.243.41 a1.47 b1.20 ab
Sauvignon Kretos3.01 ab0.233.24 ab1.58 ab1.19 ab
Sauvignon Rytos2.27 b0.122.39 b1.73 a1.44 a
Sauvignon Blanc3.12 ab0.453.55 a1.23 bc0.75 b
Ortrugo2.95 ab0.393.34 a0.93 c0.33 c
20193.120.38 a3.50 a1.62 a1.26 b
20202.580.24 b2.82 b1.17 b1.02 a
V 1** 3ns*******
Yns*********
VxYnsns****ns
1 V = variety; Y = year. 2 Means within columns noted by different letters are different by SNK test. 3 *, ** and *** indicate significant difference per p ≤ 0.05, p ≤ 0.01 and p ≤ 0.001, respectively. ns: not significant.
Table 3. Yield, vine balance, and bunch morphology of five pathogen-resistant grapevine genotypes and two non-resistant Vitis vinifera cultivars in 2019 and 2020.
CultivarYieldBunches Per vineLeaf Area to Yield RatioBunch WeightBerry MassBerries Per BunchBunch Compactness
(kg/vine)(n.)(m2/kg)(g)(g)(n.)(g/cm)
UD 80–1002.31 b 222 b1.18 b110 ab1.17 ab106 b12.4 b
Soreli3.53 a30 a0.92 b120 ab1.15 ab104 b11.1 b
UD 30–0802.08 b22 b1.64 a103 bc1.36 a76 c10.4 b
Sauvignon Kretos2.43 b25 ab1.33 b107 ab1.33 ab80 c10.1 b
Sauvignon Rytos2.41 b29 a0.99 b85 c1.02 b83 c9.3 b
Sauvignon Blanc2.86 ab20 b1.24 b143 ab1.45 a99 bc13.5 ab
Ortrugo2.35 b13 c1.42 ab181 a1.06 b170 a17.1 a
20192.28 b25 a1.6192 b1.11 a83 b10.1 b
20202.82 a20 b1.40141 a1.32 b126 a13.3 a
V 1*** 3*****************
Y******ns********
VxYnsnsns*****ns
1 V = variety; Y = year. 2 Means within columns noted by different letters are different by SNK test. 3 *, ** and *** indicate significant difference per p ≤ 0.05, p ≤ 0.01 and p ≤ 0.001, respectively. ns: not significant.
Table 4. Fruit composition at harvest of five pathogen-resistant grapevine genotypes and two non-resistant Vitis vinifera cultivars in 2019 and 2020.
CultivarTSSpHTATSS/TAMalic AcidTartaric AcidHT/HM
(°Brix) (g/L) (g/L)(g/L)
UD 80–10022.6 ab 23.43 a5.07 c4.46 a1.38 b5.34 bc3.87 d
Soreli22.0 b3.42 a4.08 d5.39 a0.90 c4.67 c5.19 c
UD 30–08020.1 bc3.32 ab4.66 cd4.29 ab1.04 bc5.35 bc5.14 c
Sauvignon Kretos24.5 a3.33 ab5.07 c4.83 a0.75 c6.36 b8.48 a
Sauvignon Rytos23.4 ab3.23 b6.50 b3.60 b0.89 c7.44 a8.36 a
Sauvignon Blanc19.0 c3.06 c8.81 a2.16 c3.45 a7.61 a2.21 e
Ortrugo19.5 c3.15 bc4.95 cd3.94 b0.81 c5.61 bc6.93 b
201921.63.264.564.741.246.154.96
202021.43.355.593.831.395.924.26
V 1*** 3******************
Ynsnsnsnsnsnsns
VxYnsnsnsnsnsnsns
1 V = variety; Y = year. 2 Means within columns noted by different letters are different by SNK test. 3 *, ** and *** indicate significant difference per p ≤ 0.05, p ≤ 0.01 and p ≤ 0.001, respectively. ns: not significant.
Publisher’s Note: MDPI stays neutral with regard to jurisdictional claims in published maps and institutional affiliations.

