1. Introduction
Virginia tomato farmers produced an average of 25 tons/acre (62,500 kg/ha), with nearly 2800 acres (1120 ha) planted across the state in 2020. The Virginia tomato market produced almost USD 25 million in 2018, with most of the fruit intended for wholesale markets and distributed across the east coast of the USA [
1]. Open-field tomatoes are planted in a single row per bed, with 2 ft of in-row spacing, resulting in 4356 plants/acre [
2]. However, throughout the last 10 years, there has been increasing interest in high tunnels among small and medium farmers in the Mid-Atlantic region [
3]. High tunnels can help farmers extend their production season, protect plants and fruits from heavy rain, wind, and drastic changes in temperature, and increase overall yield and quality through more efficient management of irrigation water and fertilizers [
4,
5,
6]. However, to take advantage of the potential benefits of producing under a protected system and improve profitability, farmers must focus on maximizing their yield per unit area and increasing their input management efficiency [
7]. In many cases, these two constraints may lead to the establishment of a specific production system for high tunnels, compared with open-field production. Nevertheless, many farmers in the USA still extrapolate some open-field production practices to high tunnels, as they see the structure as a complement to their traditional system, partially neglecting the potential yield increases related to high tunnel production.
The selection of plant density has a direct effect on yield per unit area, light interception, and efficiency of resources, as plants actively compete for space and solar radiation above ground, and for water and essential nutrients below ground, in a rhizosphere restricted by the perimeter of the planting bed. There is a direct relationship between plant density, interception of solar radiation, and biomass production [
8,
9,
10]. Variations in light quality and quantity due to high-planting-density environments can trigger changes in plant photomorphogenesis. Plant-to-plant shading promotes changes in light quality, resulting in increasing far-red light and triggering hormonal changes that can result in the elongation of the stem cells of the plants being shaded [
11]. Below ground, plants compete for water and nutrients in an environment delimited by the planting bed and plastic mulch. Under high tunnels, plants are restricted to the water and nutrients applied through the irrigation system, forcing farmers to adopt a strict management program to secure their expected yield. In the USA, farmers have empirically developed a hybrid system for high tunnels that combines practices from both open fields and greenhouses. Traditionally, many high tunnel farmers apply fertilizer through the irrigation system once per day, but not with every irrigation event. This is a clear improvement in efficiency from the weekly fertilizer applications commonly used in open fields, but it is not as efficient as the continuous application of fertilizer with each irrigation event commonly used in greenhouses. Additionally, many farmers detach from this approach and develop their own system which can vary from one application of fertilizer per week to daily applications. The lack of clear guidelines for high tunnels has created inconsistencies in farmers’ approaches to managing their crops, leading to yield restrictions and economic losses, and has uncovered a clear need for research-based and location-specific recommendations that aim to maximize farmers’ profitability.
Under greenhouse conditions, increasing the planting density in combination with a highly efficient regimen of water and fertilizer is a common approach to increase yield. Like greenhouses, high tunnels offer protection to plants against rainfall and high wind while allowing the integration of fertigation into the production system multiple times per week, which in turn could allow a higher planting density compared with open fields. Conversely, irrigation and fertilization under high tunnels are not traditionally managed to the same level of detail as within a greenhouse, and plants established at an unsustainable high density might underperform if the system is not modified accordingly. There are many recommendations for tomato planting density in open fields and under greenhouse conditions across most producing areas of the USA, ranging from 3.6 to 1.1 plants per square meter. However, there are no research-based plant-density recommendations for the mid-Atlantic U.S. for high tunnel conditions. Our hypothesis is that tomato plants under high tunnels could be planted at a higher density than in open-field systems, given the higher frequency of application of water and fertilizer. Hence, the objective of this study was to identify the effect of high planting density on tomato plant nutrient status under high tunnels on the Eastern Shore of Virginia.
2. Materials and Methods
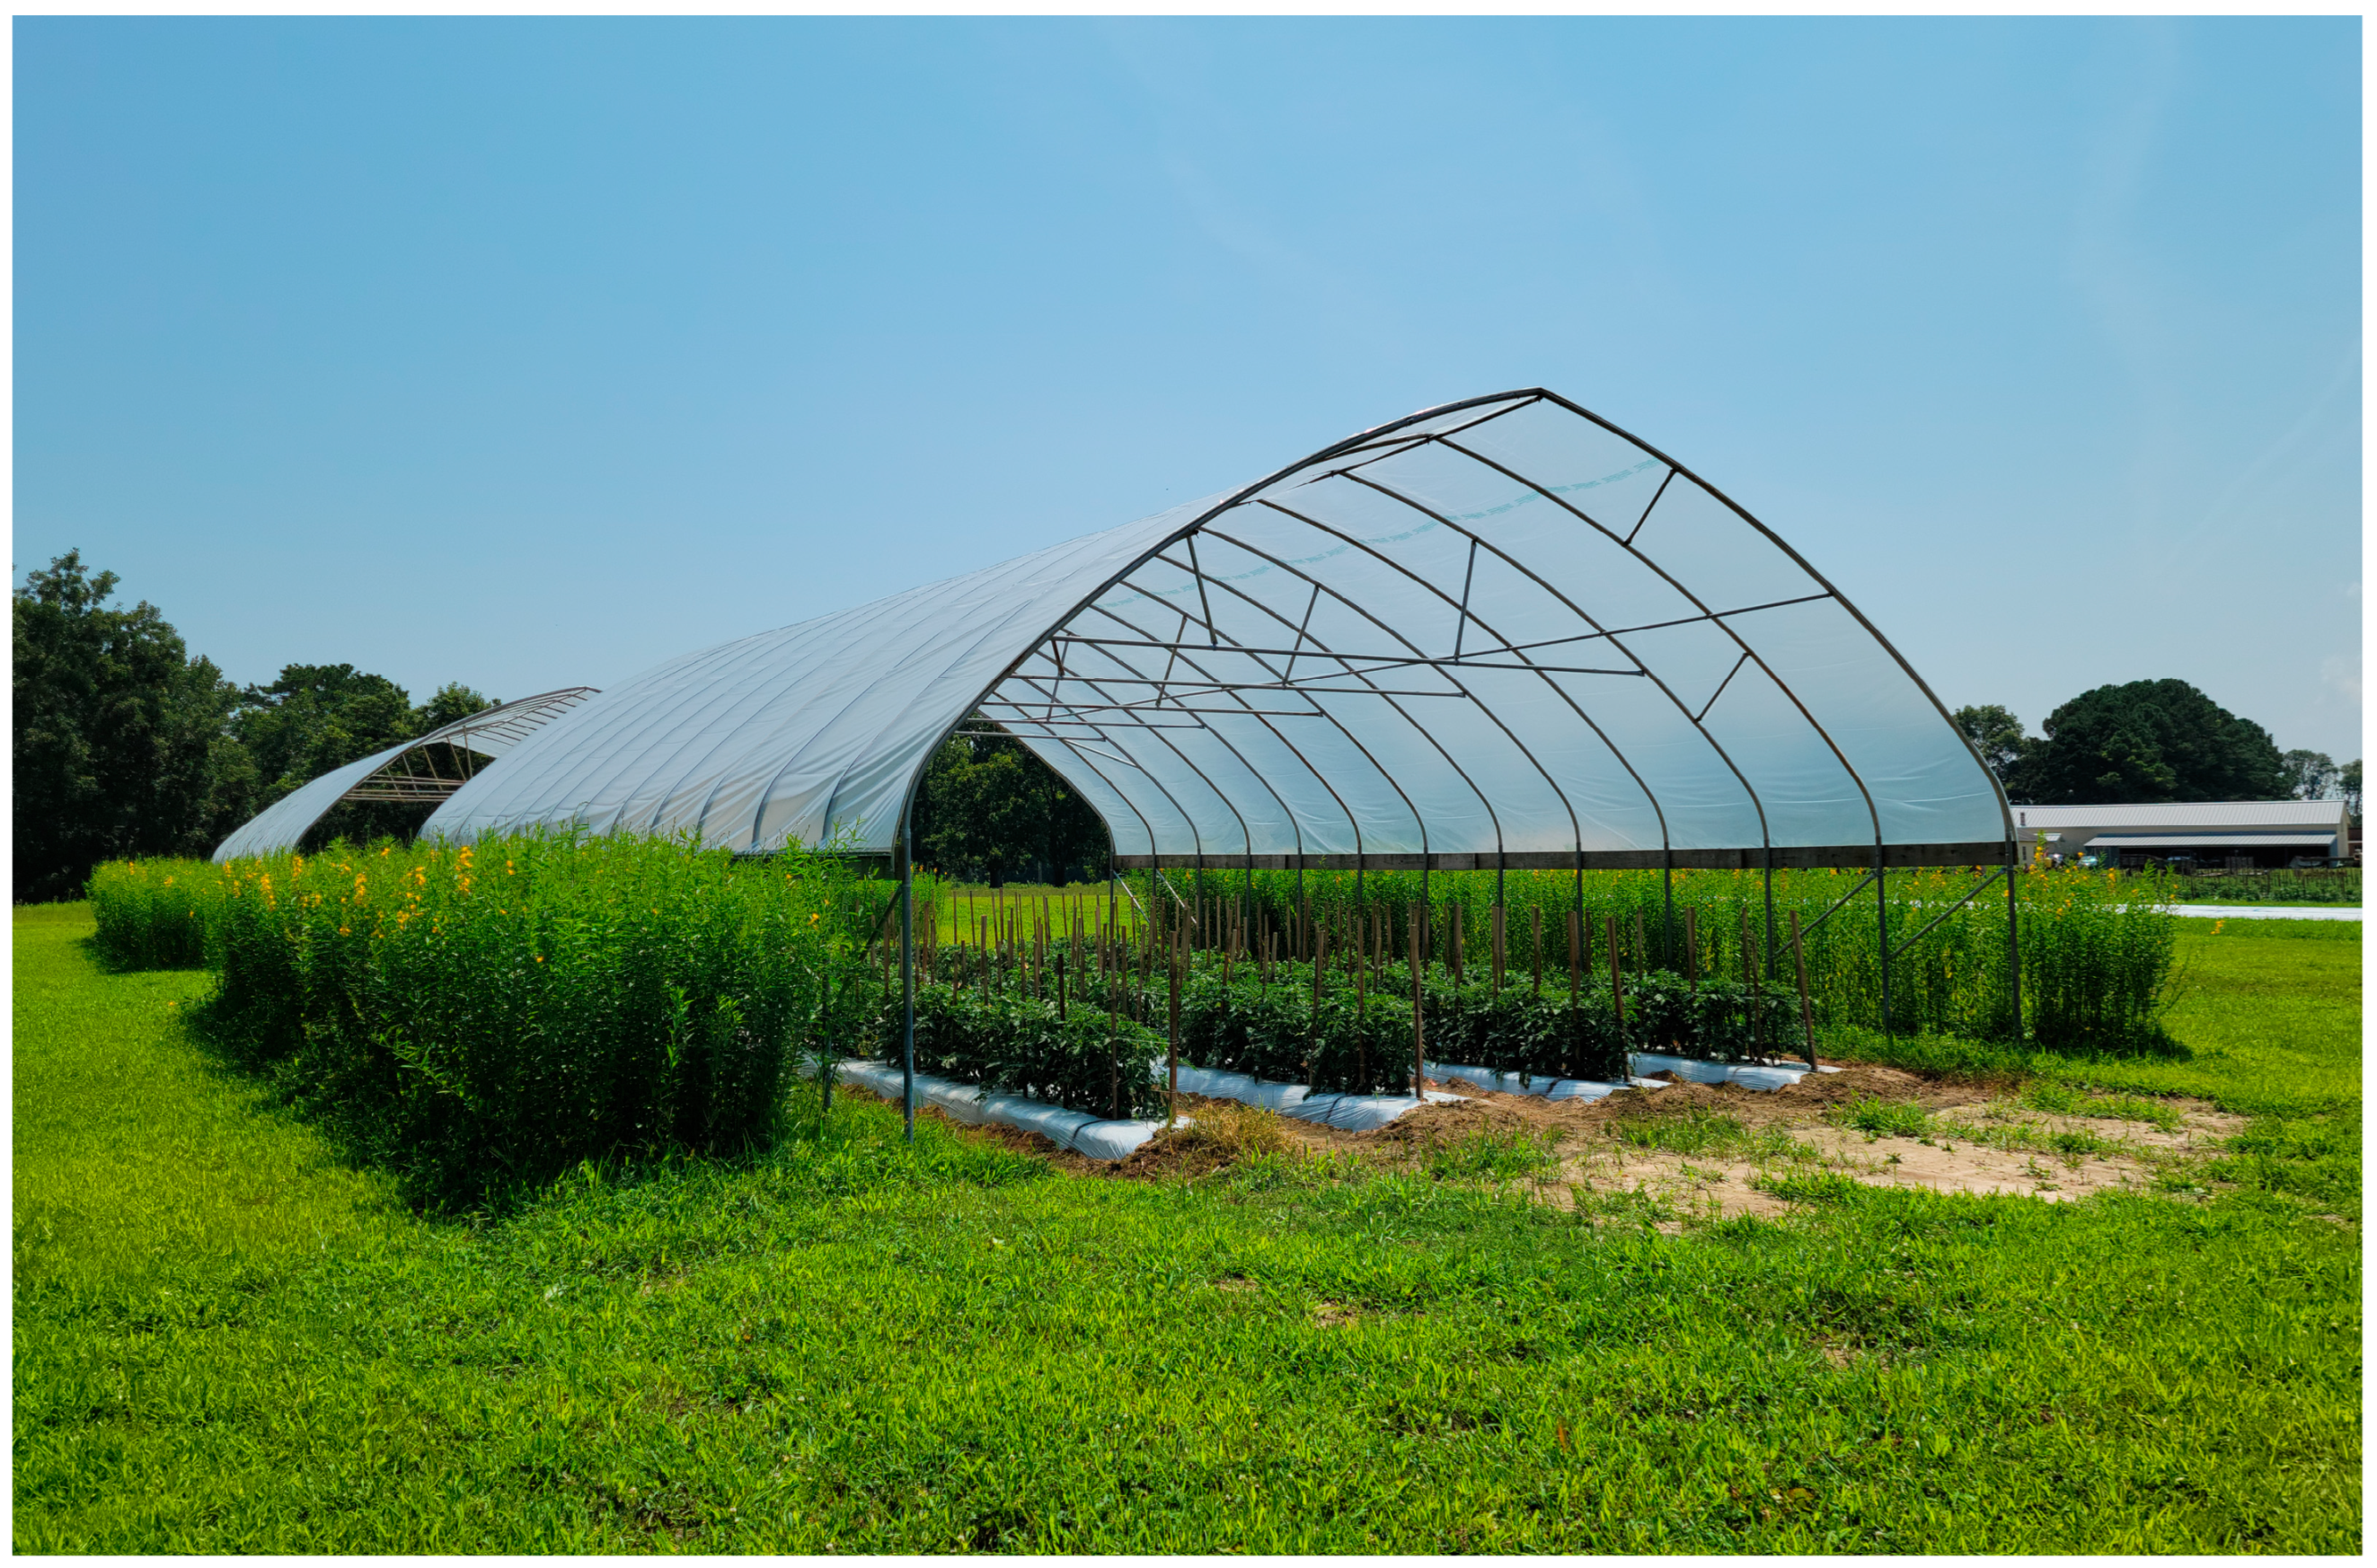
A field experiment was established between June and October 2021 at the Eastern Shore Agricultural Research and Extension Center (Lat. 37.5845, Long. −75.8190) of Virginia Tech. The study was established under two single-bay high tunnels, with individual dimensions of 30 ft (9.14 m) width by 45 ft (13.71 m) length (1350 ft
2 [125.41 m
2]), separated by a 30 ft (9.14 m) uncovered aisle. The structures were 6 ft (1.82 m) in height on both sides and 15 ft (4.57 m) in height on the center top, with a traditional chapel shape (
Figure 1). The tunnels were covered with a translucent single-layer polyethylene plastic cover 0.1524 mm thick and no drop-down curtains on the sidewalls, front, or back. The soil at the experimental area is a Bojac sandy loam soil (thermic typic hapludults), with less than 5% organic matter. Soil samples were collected at 8 inches (20.3 cm) depth and sent to the laboratory before the establishment of the experiment. The soil presented an average pH of 6.7 and soluble salt content of 0.18 mmho/cm. Additionally, soil samples contained 10.9 ppm of nitrate-N, 3.8 ppm of ammonium-N, 169 ppm of phosphorus, 70 ppm of potassium, 44 ppm of magnesium, and 315 ppm of calcium. The soil was composed of 57% sand, 30% silt, and 13% clay, with a field capacity of 25.8% at 6 kPa and a permanent wilting point of 4.7% at 1500 kPa. The area under the tunnels was tilled twice and sprayed with glyphosate (0.75 lb/acre [1.87 kg/ha]), 3 weeks before the establishment of the experiment. Planting beds were 24 inches (61 cm) at the base, 22 inches (56 cm) at the top, and 8 inches (20.3 cm) in height, with a trapezoidal shape, and covered with a white-on-black plastic mulch, 0.0317 mm thick (Berry Hill Drip Irrigation, Buffalo Junction, VA 24529). The white surface of the mulch was placed facing toward the outside of the planting bed to maximize light reflectance and reduce the soil temperature. Additionally, during the bed preparation process, a single drip line (0.381 mm, 0.94 LPH) with emitters every 12 inches (30.48 cm) (AquaTraxx Drip Tape, Berry Hill Drip Irrigation, Buffalo Junction, VA 24529), was buried 1 inch (2.5 cm) deep into the planting bed, and approximately 1.5 (3.81 cm) inches to the right of the top center of the bed, under the plastic mulch.
Six-week-old “Crimson Red 145307” tomato plants were transplanted under the tunnels on 12 July 2021. The experiment was established on a completely randomized block design with four replications, with 20 ft long experimental plots. Planting density treatments were defined as the combination of two in-row distances and single and double planting rows per bed, with treatments consisting of 2 ft of in-row distance in a single row (4356 plants/acre), 1.5 ft of in-row distance in a single row (5808 plants/acre), 2 ft of in-row distance in a double row (8712 plants/acre), and 1.5 ft of in-row distance in a double row (11,616 plants/acre) (
Figure 2).
Tomato plants were irrigated once per day, between 9:00 and 14:00, for a minimum of 40 min (equivalent to ≈ 1.4 mm/day). Pre-plant fertilizer was applied at 60 lb/acre of nitrogen (N), phosphate (P2O5), and potash (K2O), using a dry formulation of 10-10-10 at a rate of 600 lb/acre (681 kg/ha), during the process of bed preparation. After transplanting, tomato plants were fertilized three times per week using a formulation of urea–ammonium nitrate (32%N), triple super phosphate (46% P2O5), and potassium chloride (60% K2O) at a rate of 1-0.5-0.5 lb/acre (2.5-1.25-1.25 kg/ha) of N-P2O5-K2O per day. The dry fertilizer for weekly injections was diluted and injected through the irrigation system using a piston injector at a rate of 1:150 (151.4 L Dosatron Fertilizer Injector, Berry Hill Drip Irrigation, Buffalo Junction, VA 24529). The combination of the pre-plant fertilizer and weekly fertilizer applications resulted in a total applied fertilizer rate per acre of 145 lb (164 kg/ha) of N, 102 lb (115.9 kg/ha) of P2O5, and 102 lb (115.9 kg/ha) of K2O (throughout ≈ 3 months). All irrigation and fertilization practices were in accordance with the commercial standard for tomatoes, based on the recommendation of the Mid-Atlantic Commercial Vegetable Production Recommendation Handbook.
We collected daily average, maximum, and minimum air temperature data inside the high tunnel, using a Temp/RH data logger located at the center of the structure, between the tomato plants at 6 inches (15.2 cm) above the planting bed surface (MX2301A; OnSet, Bourne, MA, USA). We also collected plant height and tissue samples for foliar nutrient concentration analysis at 4, 8, and 12 weeks after transplant (WAT), using five randomly selected plants from each plot. Tissue samples were composed of five true leaves per plot, collected from the middle of the plant and avoiding apical leaves, damaged leaves, and leaves showing signs of senescence. Tissue samples were dried to a constant weight and sent to an external laboratory for concentration analysis of N, phosphorus (P), potassium (K), sulfur (S), calcium (Ca), and magnesium (Mg). Total N was determined by oxygen combustion gas chromatography with subsequent quantification using a thermal conductivity detector. Total P, K, Ca, and Mg concentrations were determined with inductively coupled plasma–optical emission spectrometry (ICP-OES), after closed-vessel nitric acid (HNO3) digestion in a microwave digestion system. Tomato plants were harvested four times in the season, starting at 13 WAT. A marketable fruit was defined as a tomato without visible blemishes, with a minimum diameter of 54 mm, and more than 10% but not more than 30% of the surface showing a definite change in color from green to tannish yellow, pink, red, or a combination of those colors. Fruits with visible blemishes, mechanical damage, or deformation, and/or smaller than the minimum requirement were considered unmarketable. Average fruit weight was calculated from the total marketable weight divided by the total marketable fruit number per plot. All variables were analyzed using an analysis of variance at 5% confidence (Statistix10) for interaction and single-factor effect. In the case of identifying differences among treatment means, data were separated using Fisher’s least significant difference test at 0.05%.
3. Results
Throughout our study, tomato plants were subjected to slightly above-adequate growing temperatures until 2 September 2023 (
Figure 3). The recommended average air temperature for tomato production ranges between 60 °F–80 °F (15.5 °C–26.6 °C). In our case, the average daily temperature in July was 79.2 °F (26.2 °C), with average minimum and maximum daily temperatures of 70.5 °F (21.4 °C) and 88 °F (31.1 °C), respectively. Similarly, in August, the average daily air temperature was 78.6 °F (25.8 °C), with a minimum of 70.9 °F (21.6 °C) and a maximum of 86.3 °F (30.1 °C) (
Figure 3). After early September, the average air temperature started to steadily decrease until the end of the study. The average daily air temperature in September was 72.1 °F (22.2 °C), with a minimum of 63.3 °F (17.4 °C) and a maximum of 81 °F (27.2 °C). The maximum, minimum, and average air temperatures throughout the study were recorded at 95 °F (35 °C), 42 °F (5.5 °C), and 74.1 °F (23.4 °C), respectively (
Figure 3).
There was no main-factor effect nor interaction between in-row distance and the number of planting rows for plant height at 4, 8, and 12 WAT, with an average plant height of 22.5 inches (57.1 cm) at 4 WAT, 44.9 inches (114 cm) at 8 WAT, and 47.4 inches (120.4 cm) at 12 WAT (
Table 1). Additionally, there was no main-factor effect nor interaction between the independent variables for marketable fruit number per plant, marketable fruit weight per plant, average fruit weight, unmarketable fruit number and weight per plant, and average unmarketable fruit weight (
Table 2). Tomato plants under high tunnels produced an average of 108,882 marketable fruits per acre (272,205 fruits/ha), with an average fruit weight of 202 g, resulting in a total marketable yield of 49.2 tons/acre (123 Mg/ha) (
Table 2). Additionally, plants produced 39,939 unmarketable fruits per acre (99,847 fruits/ha), with an average fruit weight of 96.3 g per fruit, producing an average unmarketable yield of 8.1 tons/acre (20.2 Mg/ha). On average, the total yield of the high tunnel system was 57.3 tons/acre (143.2 Mg/ha), with 85.8% marketable yield and 14.2% unmarketable production (
Table 2).
There was no interaction between the in-row spacing treatments and the number of planting rows in terms of yield per plant. However, decreasing the in-row spacing from 2 ft to 1.5 ft significantly decreased marketable fruit number and weight, with no effect on unmarketable yield (
Table 3). Tomato marketable fruit number and weight per plant decreased by 32% and 35%, respectively, when planted at 1.5 ft of in-row spacing, compared with 2 ft. In-row spacing treatments did not affect unmarketable fruit number nor weight per plant, with an average of 14.3 fruits and 2.8 lb per plant (1.27 kg/plant) (
Table 3). Similarly, increasing the number of tomato rows from one to two rows per planting bed decreased marketable fruit number and weight per plant by 45% and 44%, respectively. Unmarketable fruit number and weight per plant also decreased by 60% and 56% when tomatoes were planted in two rows per bed (
Table 3). However, this was probably related to the overall decrease in yield as the total yield per plant was 46% lower for treatments planted in two rows per bed (13.8 lb/plant [6.2 kg/plant]), compared with one row per bed (25.6 lb/plant [11.6 kg/plant]). Tomatoes planted at 1.5 ft of in-row distance (15.8 lb/plant [7.1 kg/plant]) resulted in 33% lower yield than those planted at 2 ft of in-row distance (23.7 lb/plant [10.7 kg/plant]).
Plant tissue analysis showed no main-factor nor interaction effect of in-row distance and number of planting rows on N (avg. 3.46%), P (avg. 0.28%), K (avg. 3.14%), Ca (avg. 2.71%), Mn (avg. 0.53%), and S (avg. 0.26%) tissue concentrations (
Table 4). However, we did identify an effect of the sample collection date on the tissue nutrient concentration. At 4 WAT, tissue concentrations of N, P, K, Ca, Mn, and S were higher than at 8 and 12 WAT for all treatments (
Table 4). Nitrogen and K tissue concentrations decreased by 42% and 46%, respectively, from 4 WAT to 12 WAT, across all treatments. Phosphorus, Ca, and Mn concentrations decreased at 8 WAT, compared with 4 WAT. However, concentrations stayed stable through 12 WAT (
Table 4). Sulfur concentration decreased by 20% at 8 WAT sampling compared with 4 WAT. However, concentrations came back up at 12 WAT sampling compared with 8 WAT (
Table 4).
There was an interaction between in-row distance and sampling date for Ca and S concentrations. Treatments with an in-row spacing of 2 ft resulted in the highest S concentration in tissue at 4 WAT (0.32%). There was no difference among treatments with in-row spacing of 1.5 ft at 4 (0.27%), 8 (0.26%), and 12 WAT (0.26%), and 2 ft of in-row spacing at 12 WAT (0.25%). In-row spacing of 2 ft at 8 WAT (0.22%) resulted in the lowest S tissue concentration. Similarly, there was an interaction between the number of planting rows and the sampling date, and in-row spacing and sampling date for Ca tissue concentration. In-row spacing of 2 ft at 4 WAT resulted in the highest Ca concentration in tissue with 3.3%, while there was no difference among the rest of the treatments, with an average of 2.6%. Tomato treatments planted at double rows and sampled at 4 WAT resulted in the highest Ca concentration in tissue with 3.2%, followed by the single row treatment at 4 WAT with 2.8%. There was no difference among the rest of the treatments, with an average of 2.6% of Ca in tissue.
4. Discussion
Data indicate a detrimental effect in yield per plant when the tomato plant population increased outside the traditional recommendation of 2 ft of in-row spacing with plants in a single row. Yield losses ranged between 32% and 46% when the total population of plants increased from 4356 plants per acre to any of the plant densities evaluated in this study (5808, 8712, or 11,616 plant/acre), either through decreasing the in-row distance between plants or increasing the number of planting rows. Increasing the density of tomato plants compared with the traditional recommendation is likely to create an environment of competition among plants for basic resources. However, our data suggest that there was minimal competition for solar radiation and fertilizer. A common indicator of plant-to-plant shading or competition for solar radiation is the increase in plant height. Etiolation in plants is a process of morphological changes that occur when a plant is grown in low light or far-red light conditions. In optimal conditions, plants develop sturdy stems and leaves to support their overall growth and reproduction. Etiolation is a specific growth response of plants to low light conditions. Plants grown in low light or complete darkness, undergo certain morphological changes to increase their chances of capturing available light. Etiolation is characterized by increased internode length, leading to taller and spindly stems as the plant reaches for available light, as well as reduced leaf expansion and apical dominance. At the molecular level, the plant’s response to low light is mediated by a complex signaling network that involves the interaction of several hormones, including auxins and gibberellins [
12,
13]. The accumulation of auxins in the plant’s stem promotes cell elongation, leading to the characteristic tall and spindly appearance of etiolated plants [
14,
15,
16]. At the same time, gibberellins stimulate the production of enzymes that break down cell walls, further promoting stem elongation. Red and far-red light play a role in regulating plant etiolation.
Far-red light conditions, detected by phytochromes, trigger a shade-avoidance response in plants. This response includes elongation growth, enhanced apical dominance, and changes in leaf morphology, collectively leading to etiolation. Under normal light conditions, phytochromes are in a state where they are more sensitive to red light than to far-red light. This means that when a plant receives sufficient red light, the phytochromes signal to the plant that there is enough light available, and the plant grows normally. However, if a plant receives more far-red light than red light, a common condition of plant-to-plant shading, or if it receives very low levels of both red and far-red light, the phytochromes will signal to the plant that light is limited, and the plant will undergo etiolation [
14,
15,
16].
In our study, there was no indication of tomato plants undergoing etiolation, given that all treatments resulted in similar plant height, regardless of the moment of data collection. Moreover, the annual average solar radiation on the Eastern Shore of Virginia ranges from 4.0 to 4.5 kWh/m²/day, which is generally considered adequate for tomato production, supporting the premise that solar radiation was not a defining factor for yield losses.
Similarly, tissue sample analysis at multiple periods during the study showed that nutrient concentration inside the plants was not affected by the planting density treatments. All values of N, P, K, Ca, Mn, and S were above the accepted adequate average levels for tomatoes of 2.5%, 0.2%, 2.5%, 1%, 0.3%, and 0.3%, respectively [
17,
18], suggesting that the selected fertilization program (rate, placement, source, and frequency of application) for the study supplied the required nutrients in a timely manner, without affecting growth and yield parameters. Additionally, the soil analysis at the experimental site was considered low in N, K, Ca, and Mg, supporting the hypothesis that the crop consumed most of the nutrients provided throughout the fertilization program and was not overfertilized.
Our assessment suggests that the source of the reduction in yield per plant could have been related to water availability near the root zone. Water plays a critical role in the processes of flowering and fruit production. Photosynthesis can be inhibited by a reduction in water availability, which can lead to poor growth, reduced flowering, and lower fruit production. In addition, fruit cells require sufficient water for expansion, maintenance of turgor pressure and hormone balance, and nutrient uptake. Sufficient irrigation water helps maintain turgor pressure within the fruit cell, which in turn helps to preserve the structural integrity of the cell and prevent collapsing or shrinking [
19,
20]. Additionally, water stress can affect the regulation of plant hormones, including the production of abscisic acid, which can inhibit fruit growth and development, resulting in smaller fruit. It is plausible that available water near the root zone provided by the irrigation system combined with the restriction of rainfall under the high tunnel, constrained plant development within the high-density treatments.
Alternately, high planting densities could have limited the ability of plants to correctly pollinate. Tomato plants are typically self-pollinating plants, with both male and female reproductive structures that often achieve pollination with minimal interference from external pollinators like insects or wind. Tomatoes can also benefit from vibration-producing bee species and wind-induced movement of the flower cluster to elicit full pollen release. Cooley and Vellejo-Marin (2021) [
21] showed that both supplemental pollination by buzz-pollinating bees and open pollination by assemblages of bees, including buzz pollinators, significantly increased tomato fruit weight compared with a no-pollination control. Correct pollination is a key factor related to seed production and size, which in turn are highly correlated to fruit weight [
22,
23,
24]. Under greenhouse conditions, it is common for farmers to introduce pollinators to the structure to maximize the potential yield of their system. However, it is plausible that the high-density treatments in our study limited the reach of natural pollinators to the flower clusters, as flowers could have been produced within the dense foliage of the treatment, resulting in a reduced yield per plant.
The concept of high-density planting under protective structures is not new, as most recommendations for tomato planting densities under greenhouse conditions average 3.6 plants per square meter for plants with indeterminate growth habits [
25,
26,
27,
28,
29,
30], compared with 1.1 plants for open-field plants with a determinate growth habit [
31,
32,
33]. However, these systems are characterized by a high frequency of application of water and fertilizer, and specialized pruning activities which are not yet a common practice for high tunnels. Greenhouse recommendations have not been traditionally applied to high tunnel conditions, as it is a common belief among farmers and agricultural professionals that high tunnels closer resemble open-field conditions rather than other protective or controlled structure systems. Nevertheless, farming under high tunnels requires a higher initial investment than open-field conditions and provides partial protection to the plants, allowing better control of fertilizer and water applications, application of pruning and training practices, and installation of trellising systems. Hence, it is necessary to develop a specific production system for high tunnels designed to maximize the potential profitability for the farmer.
Similar work has been conducted in different locations around the globe, with results varying with the locations, cultivars, and confounding factors under evaluation. Zahid et al. (2020) [
34] evaluated in-row spacings of 45, 60, and 75 cm in a single row in combination with two irrigation regimens [standard and deficit irrigation] for tomatoes under high tunnels in Rachna Doab, Pakistan. Their data indicated that the highest yield per unit area was obtained with 45 cm of in-row spacing (equivalent to 1.5 ft), with no interaction with the irrigation regimen. The authors hypothesized that low levels of potassium in the soil lead to a reduction in yield in the high-density treatments. Reid et al. (2023) [
35] evaluated grafted tomatoes under high tunnels in three in-row spacings in single rows [40, 50, and 60 cm]. Tomato plants produced the highest yield at 60 (equivalent to 2 ft) and 50 cm (equivalent to 1.64 ft), compared with 40 cm, while grafted tomatoes overperformed compared with non-grafted ones. Wells (1994) [
36] compared in-row spacings of 30 cm, 45 cm, and 60 cm, with 1 m between planting rows, in combination with different levels of removal of side shoots. They identified that the highest yield per area was at 12 inches (equivalent to 1 ft) with no side shots, while the lowest yield per area was at 24 inches (2ft) and one side shot. Another study in Turkey evaluated 15 cm, 25 cm, and 35 cm of in-row distance in a single row in combination with different treatments of truss pruning (3, 4, 5, and 6 trusses per plant). The authors found that 35 cm (equivalent to 1.14 ft) of in-row distance produced more fruits per plant and heavier individual fruit weight than the rest of the treatments, although yield per unit area was increased with the closer spacing [
37]. Conversely, Rashid et al. (2016) [
38] investigated the interaction between three in-row spacings [60, 90, and 120 cm] and four N rates [0, 60, 100, 140 kg/ha] for tomatoes under high tunnels. Their research concluded that tomato plants under high tunnels produced the highest yield with a combination of 90 cm (equivalent to 2.95 ft) of in-row spacing and 100 kg/ha of N. Overall, the variation across results in the literature suggests that in-row spacing recommendations should not be generalized across production regions and systems, but rather, should be based on locally generated research data.
The objectives of our study were to identify planting density recommendations for tomatoes under high tunnel conditions for the mid-Atlantic USA and to evaluate their influence on plant nutrient status. Our results demonstrated that farmers should not seek to increase tomato plant density in high tunnels under their current production system in Virginia, as it will not result in increased yield per area. Furthermore, a simple economic estimation of the cost of implementation of high densities suggests that increasing the plant density from the standard recommendation of 4256 to 11,616 plants per acre requires an additional investment of approximately $5971 per acre ($14,927 per hectare) when considering seeds, trays, and stakes for trellising. This estimation does not account for the additional labor cost required for transplanting and maintenance of the plants. Future research should focus on the further identification of the current limitations and their potential interactions in the traditional high tunnel system and the required corresponding adjustments to maximize farmers’ profits, as well as the integration of a holistic analysis during the reevaluation of the traditional production practices.


