Article

Genome-Wide Identification of Selenium-Responsive MicroRNAs in Tea Plant (Camellia sinensis L. O. Kuntze)

1
Fruit and Tea Research Institute, Hubei Academy of Agricultural Sciences, Wuhan 430064, China
2
Key Laboratory of Tea Science of Ministry of Education, National Research Center of Engineering and Technology for Utilization of Botanical Functional Ingredients & Co-Innovation Center of Education Ministry for Utilization of Botanical Functional Ingredients & Key Laboratory for Evaluation and Utilization of Gene Resources of Horticultural Crops, Ministry of Agriculture and Rural Affairs of China, Hunan Agricultural University, Changsha 410128, China
*
Authors to whom correspondence should be addressed.
These authors contributed equally to this work.
Horticulturae 2023, 9(12), 1278; https://doi.org/10.3390/horticulturae9121278
Submission received: 31 August 2023 / Revised: 15 November 2023 / Accepted: 21 November 2023 / Published: 28 November 2023
(This article belongs to the Special Issue Tea Tree: Cultivation, Breeding and Their Processing Innovation)

Abstract

:
Anadequate selenium (Se) intake can enhance human immunity and prevent diseases development. About one billion people in the world have varying degrees of Se deficiency in the world. Organic Se from tea infusion is the most easily absorbed and utilized Se form by the human body. Therefore the production of tea plants rich in Se is an effective way to increase Se dietary intake, but there are few studies on the involvement and functions of miRNAs in the responses of tea plants after Se treatment. MicroRNAs (miRNAs) are endogenous (non-coding) single-stranded RNAs that play crucial roles in regulating plant nutrient element acquisition and accumulation. Physiological analysis discovered that the total Se content in tea plant roots markedly increased under 0.05 mmol·L−1 selenite treatment, with no toxicity symptoms in the leaves and roots. To screen the miRNAs responsive to Se treatment in tea plants, miRNA libraries were constructed from the tea cultivar “Echa 1”. Using high-throughput sequencing, 455 known miRNAs and 203 novel miRNAs were identified in this study. In total, 13 miRNAs were selected that were differentially expressed in tea plants’ roots under 0.05 mmol·L−1 selenite treatments. Gene Ontology enrichment analysis revealed that the target genes of the differentially expressed miRNAs mainly belonged to the metabolic process, membrane, and catalytic activity ontologies. Kyoto Encyclopedia of Genes and Genomes pathway enrichment analysis suggested that beta-alanine, taurine, hypotaurine, and sulfur metabolism were the most enriched pathways among the differentially expressed miRNAs, implying their involvement in Se accumulation and tolerance in tea plants. Further characterization of the data revealed that the number of novel miRNAs was comparable to that of known miRNAs, indicating that novel miRNAs significantly contributed to the regulation of Se accumulation in tea plant roots. Thisstudy lays the foundation for further research on the regulatory mechanisms underlying Se accumulation and tolerance in tea plants, providing targets to molecular breeding strategies for improving tea nutritional properties.

1. Introduction

miRNAs are a class of single-stranded RNAs with a length of about 20 nt. They predominantly play negative regulatory roles by inducing mRNA degradation of target genes or inhibiting their translation. Since the first miRNA gene (lin-4) was identified in the nematode C. elegans heterochromatin in 1993 [1], an ever-increasing number of miRNAs and their target genes have been uncovered. The main approaches used for miRNA identification are forward genetic screening, bioinformatics analysis, direct cloning, EST (expressed sequences tag) analysis and high-throughput sequencing [2]. According to the updated Sanger miRBase 22.1 (https://mirbase.org/ (accessed on 8 January 2019)), currently 48,860 mature miRNAs and 38,589 miRNA precursor sequences have been identified in 271 species. miRNAs are widely present in plants and animals, and they are involved in numerous biological and metabolic processes, including growth, development, metabolism, protein degradation, signal transduction, and adversity stress tolerance [3,4,5].
Nutrient elements have critical functions in the life activities of plants, and numerous studies have revealed that miRNAs are related with nutrient element tolerance and play key roles in plant responses to nutrient stress. Phosphorus deficiency induced the downregulation of miR398 in Arabidopsis [6]. miR778 overexpression promoted primary root growth and increased phosphate uptake under Pi deficiency [7]. In soybean, certain miRNAs (e.g., miRNA894, miR159, miR1509, miR1507) were up-regulated, while other miRNAs (e.g., miR398, miR165, miR166, miR1511, miR1450) were down-regulated under low phosphorus stress [8]. Overexpression of miR168 improved low phosphorus stress tolerance in tobacco, exhibiting a potential involvement in abscisic acid (ABA)- and jasmonic acid (JA)-mediated regulation of seed germination signaling [9]. Overexpression of miR5090 and miR826 in Arabidopsis thaliana resulted in a stronger tolerance to nitrogen deficiency compared to the wild type. This was, evidenced by the increased biomass and nitrogen content in vivo, the increased growth of the primary and lateral roots and increased expression of AtNRT2;1 and AtNRT1;5, which indicated an enhanced nitrogen absorption capacity [10]. Moreover, the known miRNA gma-miR156aa and nta-miR156i were shown to be involved in regulating theanine metabolism under nitrogen deficiency by targeting the glutamate receptor (GLK) and pyruvate kinase (PK)in tea plants [11]. Sulfur deficiency promoted the accumulation of acetylserine and induced the miR395 expression. Exogenous application of cysteine to plants inhibited the absorption and assimilation of sulfate and increased miR395 expression. However, the glutathione synthesis inhibitor buthionine sulfoximine (BSO) inhibited the expression of miR395. Therefore, miR395 was considered part of the sulfate synthesis regulatory network [12]. Selenium (Se) is an essential trace element for the growth and development of humans and animals. The minimum daily intakes of Se recommended by Chinese Nutrition Society and International Society for Selenium Research are 50 μg and 60 μg, respectively [13], studies have shown that a daily intake of 200 μg of Se can prevent many diseases and delay aging [14], and a daily intake of more than 400 μg of Se may pose a safety risk [15]. About one billion people worldwide have varying degrees of Se deficiency [16], and it has been demonstrated that Se deficiency is linked to numerous diseases, such as Keshan disease, myocardial degeneration, hepatitis, cataract, and multiple cerebrospinal sclerosis, which seriously threaten human health [17]. Plants are the main source of dietary Se and can convert the inorganic Se in the environment into an organic form that is safe for humans, which is of great importance to improving human Se uptake and nutrition. The tea plant, Camellia sinensis L. O. Kuntze, is an important cash crop. Tea is a widely popular beverage, and the organic Se present in tea (about 80% of the total Se) is the most easily absorbed and utilized form by the human body [18]. Therefore, drinking Se-rich tea is a safe and effective way of Se supplementation. Therefore, comprehensively investigating the Se absorption and transport mechanism in tea plants is important for improving human Se nutrition. Several studies have been recently conducted on Se uptake, transport, and plant metabolism [19,20,21]. Many miRNAs associated with adversity and secondary metabolite have been identified in tea plants [22,23,24], However, few studies on the roles of miRNAs related to Se metabolism, accumulation and tolerance exist in tea plants and other plants. Only a few Se-related miRNAs, such as miR399h-5p, miR395, miR166, and miR171a-5p, have been identified thus far [25]. Therefore, more studies are necessary for the identification of additional key miRNAs involved in Se accumulation. In the present study, miRNAs related to Se accumulation in tea plants were identified and analyzed using the Illumina HiSeq 2500 sequencing platform and bioinformatics technology. This study provides a theoretical basis for further studies on the miRNA regulation of Se uptake and assimilation in tea plant leaves, and it lays the foundation for selecting and breeding new Se-enriched tea varieties.

2. Materials and Methods

2.1. Plant Materials and Treatments

One-year-old cuttings of the tea cultivar Echa 1, offered by the tea germplasm resource nursery in Hubei province, were used as the experimental materials. The experiment was conducted under hydroponic culture conditions, and the culture solution was 1/3 hoagland nutrient solution containing 5.00 mmol·L−1 KNO3, 5.00 mmol·L−1 Ca(NO3)2·4H2O, 1.00 mmol·L−1 NH4NO3, 2.00 mmol·L−1 MgSO4·7H2O, 1.00 mmol·L−1 KH2PO4, 0.10 mmol·L−1 FeSO4·7H2O, 0.01 mmol·L−1 KI, 0.10 mmol·L−1 C10H14N2Na2O8·2H2O, 0.10 mmol·L−1 H3BO3, 0.03 mmol·L−1 ZnSO4·7H2O, 0.15 mmol·L−1 MnSO4, 1.00 µmol·L−1 Na2MoO4·2H2O, 0.20 µmol·L−1 CoCl2, 0.10 µmol·L−1 CuSO4·5H2O [26], with or without 0.05 mmol·L−1 selenite [20]. Each treatment was carried out with 25 cuttings per pot containing 10 L culture solution with three biological replications. The pH of the nutrient solution was adjusted to 5.0 with NaOH or HCl. After a week of growth in the solution, a portion of young roots composed of the tertiary and secondary lateral roots were sampled for the Se content assay, and apart of these roots was quickly frozen in liquid nitrogen and stored at −80 °C for sequencing.

2.2. Total Se Content Testing and Data Analysis

A HNO3 and HClO4 (4:1, v/v) solution was used for the digestion of roots, and the digestion temperature was controlled at 180 °C. The digestion solution was reduced in 6 mol·L−1 HCl, cooled, and filtered to a fixed volume. The total Se content was measured by hydridegeneration atomic fluorescence spectrometry (HG-AFS-8220) [27]. The trial data were statistically analyzed using Microsoft Office 2010 and SPSS 19.0.

2.3. Total RNA Isolation, Small RNA Library Construction and Sequencing

The total RNA from the young roots of tea plants was extracted using theTrizol method. The purity and concentration of total RNA were assessed using a Nanodrop 2000 spectrophotometer (ThermoScientific, Wilmington, NC, USA), and the RNA integrity was determined by 1% agarose gel electrophoresis.
The sRNA library was constructed and sequenced by the Biomarker TechnologiesCorporation (Beijing, China). The sRNA sequencing libraries were prepared using the NEB Next Ultra small RNA Sample Library Prep Kit for Illumina. After the samples passed the quality control, 3′ SR and 5′ SR Adaptors were ligated to the sRNA, And cDNA was synthesized by reverse transcription and amplified by Polymerase Chain Reaction (PCR). Polyacrylamide gel electrophoresis (PAGE) was used for fragment excision, and the corresponding bands were excised and purified to get the small RNA libraries. At last, PCR products were purified (AMPure XP system), and library quality was assessed. The clustering of the index-coded samples was performed on a cBot Cluster Generation System using the TruSeq PE Cluster Kit v4-cBot-HS (Illumina, San Diego, CA, USA) per the manufacturer’s instructions. After cluster generation, the library preparations were sequenced with Illumina Hiseq 2500, with a single-end sequencing read length of 50nt (SE50).

2.4. miRNA Analysis of Sequences

Clean reads were obtained by removing ploy-N, adapters, and low-quality reads from the raw data. The reads were further cleaned and trimmed by removing sequences longer than 30 nt and smaller than 18 nt. Then, the GC content, Q20 (1% sequencing error rate), Q30 (0.1% sequencing error rate), and sequence duplications were calculated in the clean data. Bowtie software tools (v1.0.0, -v0) [28] were used to align the clean reads with the Silva, GtRNAdb, Rfam, and Repbase databases, and filter the ribosomal RNA (rRNA), transfer RNA (tRNA), small nuclear RNA (snRNA), small nucleolar RNA (snoRNA) and other ncRNA and repeats. The remaining reads were used to detect known miRNAs and novel miRNAs, as predicted by comparing with the tea plant Genome (http://eplant.njau.edu.cn/tea/ahau.html (accessed on 21 April 2018)) and known miRNAs from miRBase. Possible precursor sequences were obtained by using the position information of reads compared to the tea plant genome, and novel miRNAs were obtained by scoring based on the distribution information of reads on the precursor sequences and precursor structure energy information using Bayesian model. The Randfold tools (v2.0, -s99) were used for pre-miRNA secondary structure prediction. R language was used to calculate the base information of miRNAs and conduct base preference analysis.

2.5. MiRNA Differential Expression Analysis, Target Genes Prediction and Functional Annotation

MiRNA expression in each sample was normalized using the transcripts per kilobase of exon model per million mapped reads (TPM) algorithm [29]. The differentially expressed miRNA sets among samples were obtained using DESeq2 software (1.6.3, default) [30], and differential folds indicated the ratio of expression. The miRNAs with false discovery rates (FDR) < 0.05 and |log2FC| > 1 were considered differentially expressed miRNAs. Based on the identified known and novel miRNAs and the tea plant genome sequence information, target gene prediction was performed using theTargetFinder software (v1.6, -c3) [31]. The functional annotation of the target genes was performed using the National Center for Biotechnology Information (NCBI)non-redundant protein (Nr) database [32], Clusters of Orthologous Groups of proteins (KOG/COG) database [33,34], the Protein family (Pfam) [35], a manually annotated and reviewed protein sequence (Swiss-Prot) database [36], theKyoto Encyclopedia of Genes and Genomes (KEGG) database [37] and Gene Ontology (GO) [38]. GO enrichment analysis of the differentially expressed miRNAs’ target genes was performed by the GOseq R packages based on Wallenius non-central hyper-geometric distribution. The KOBAS software (2.0) was used to evaluate the statistical enrichment of the differentially expressed miRNAs’ target genes in KEGG pathways [39].

2.6. Quantitative Real Time PCR Analysis of miRNAs

The miRNAs were reverse transcribed using Mir-XTM miRNA First-Strand Synthesis Kit (TaKaRa, Kusatsu, Japan), and the cDNAs obtained were used for further quantification of miRNAs. The differential expression of randomly selected miRNAs in roots under different treatments was verified and analyzed by qRT-PCR using TB GreenTMPremixExTaqTM II kit (TaKaRa, Japan). U6 was used as reference gene [40], and three replicates were set for each sample. The relative expression levels of miRNAs were calculated by the 2−ΔΔCt relative quantification method. The primer sequences of miRNAs were listed in Table S1.

3. Results

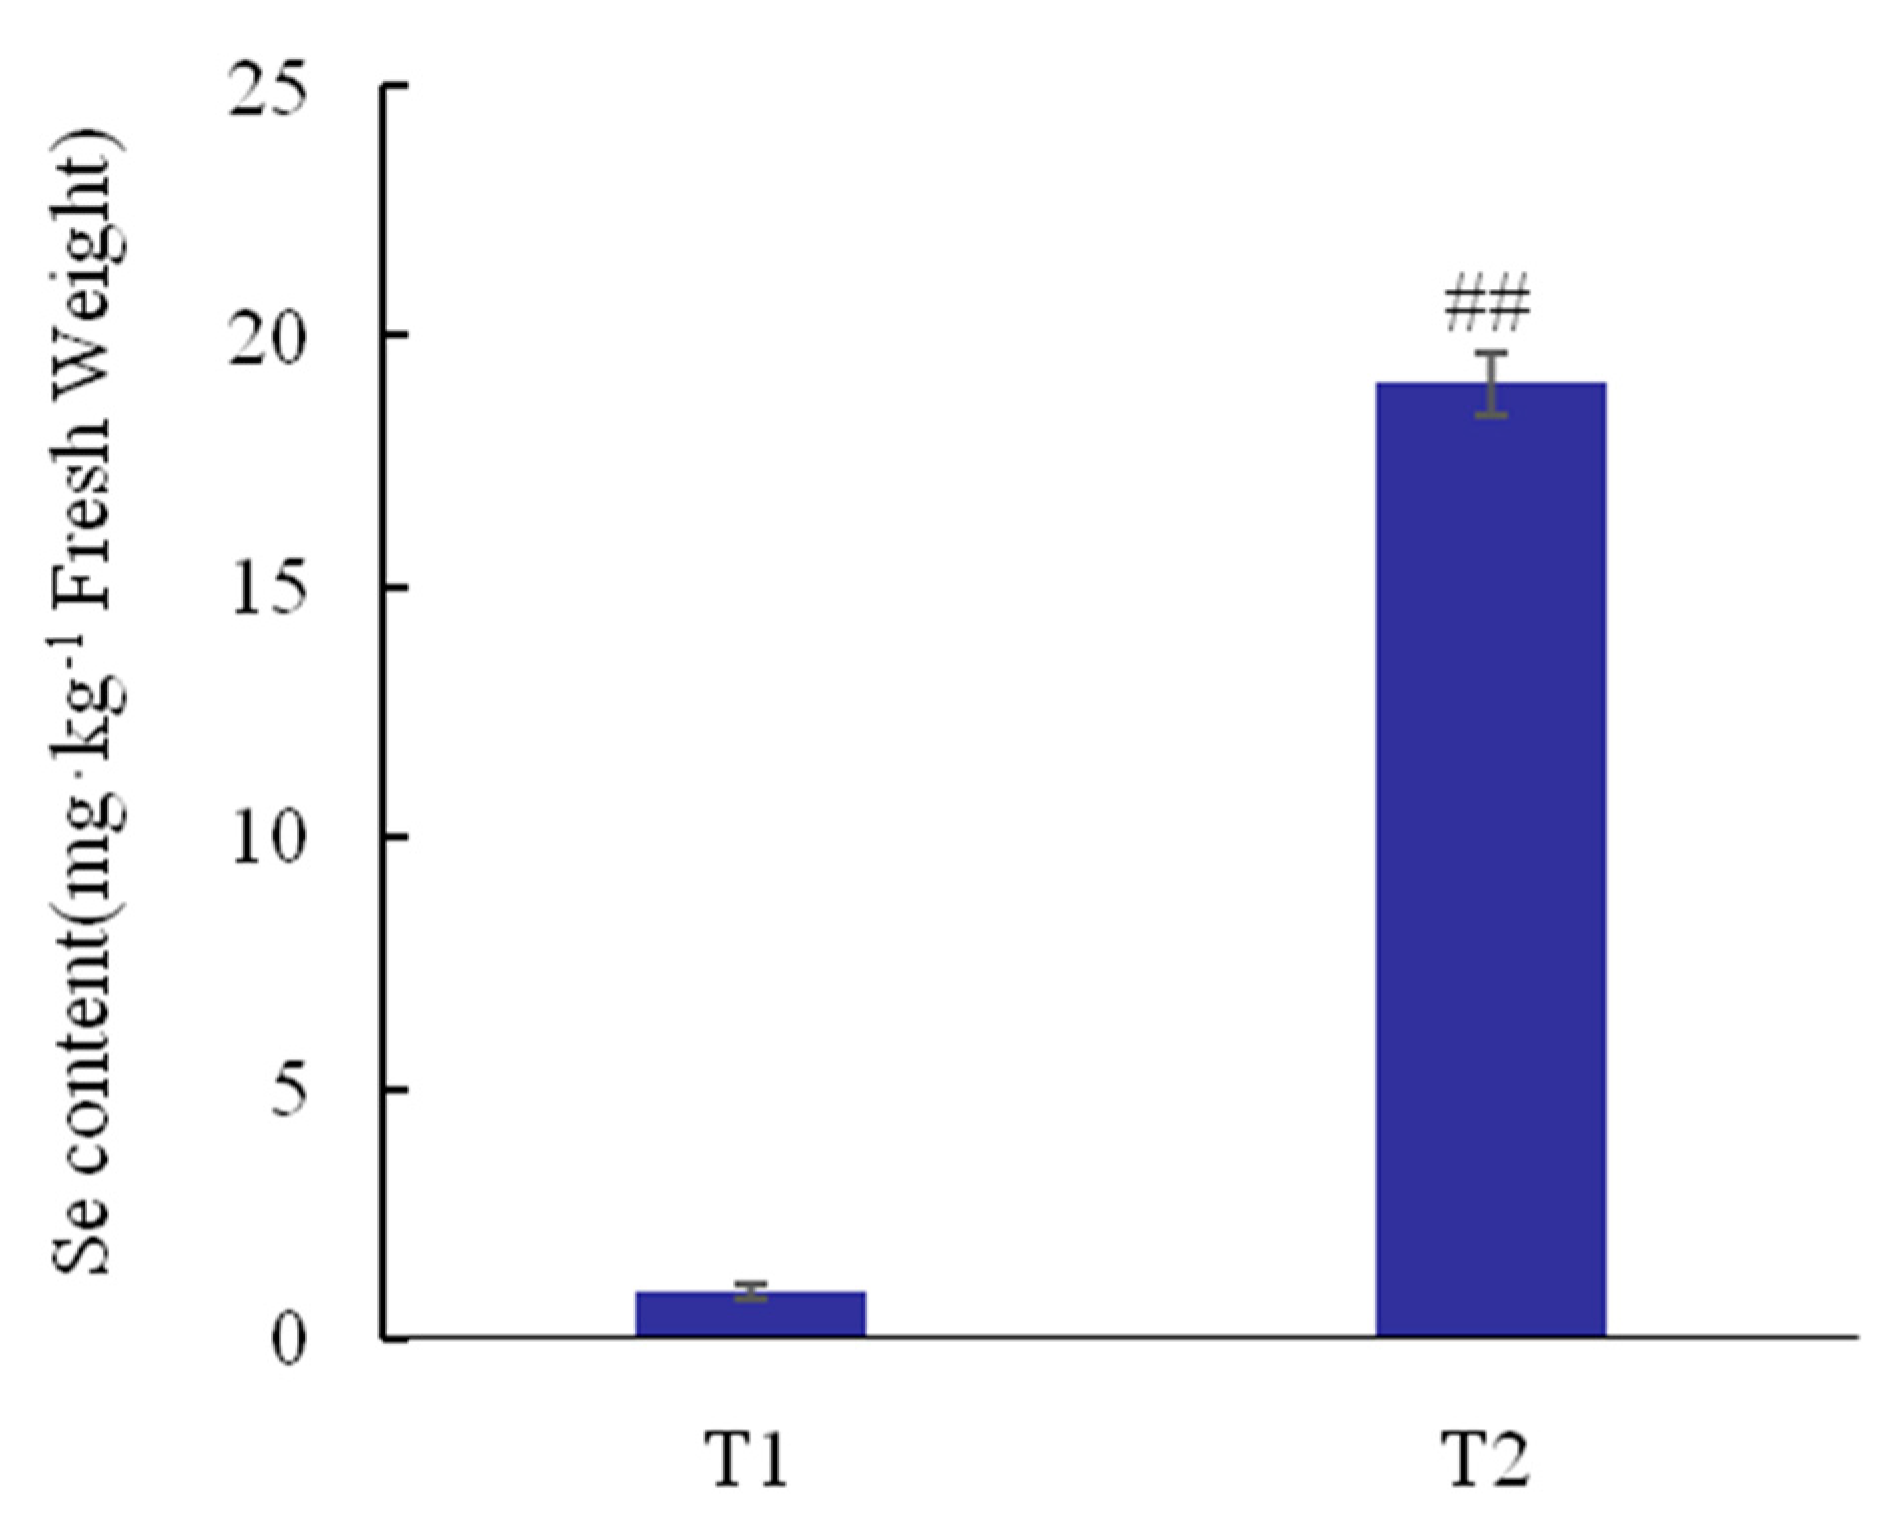
3.1. Total Se Content Analyses

No toxicity symptoms were observed in the leaves and roots of tea plants when the selenite concentration in nutrient solutions was 0 or 0.05 mmol·L−1. Moreover, the total Se content of tea plants roots increased obviously by 20.28-fold under selenite treatment (p < 0.01; Figure 1).

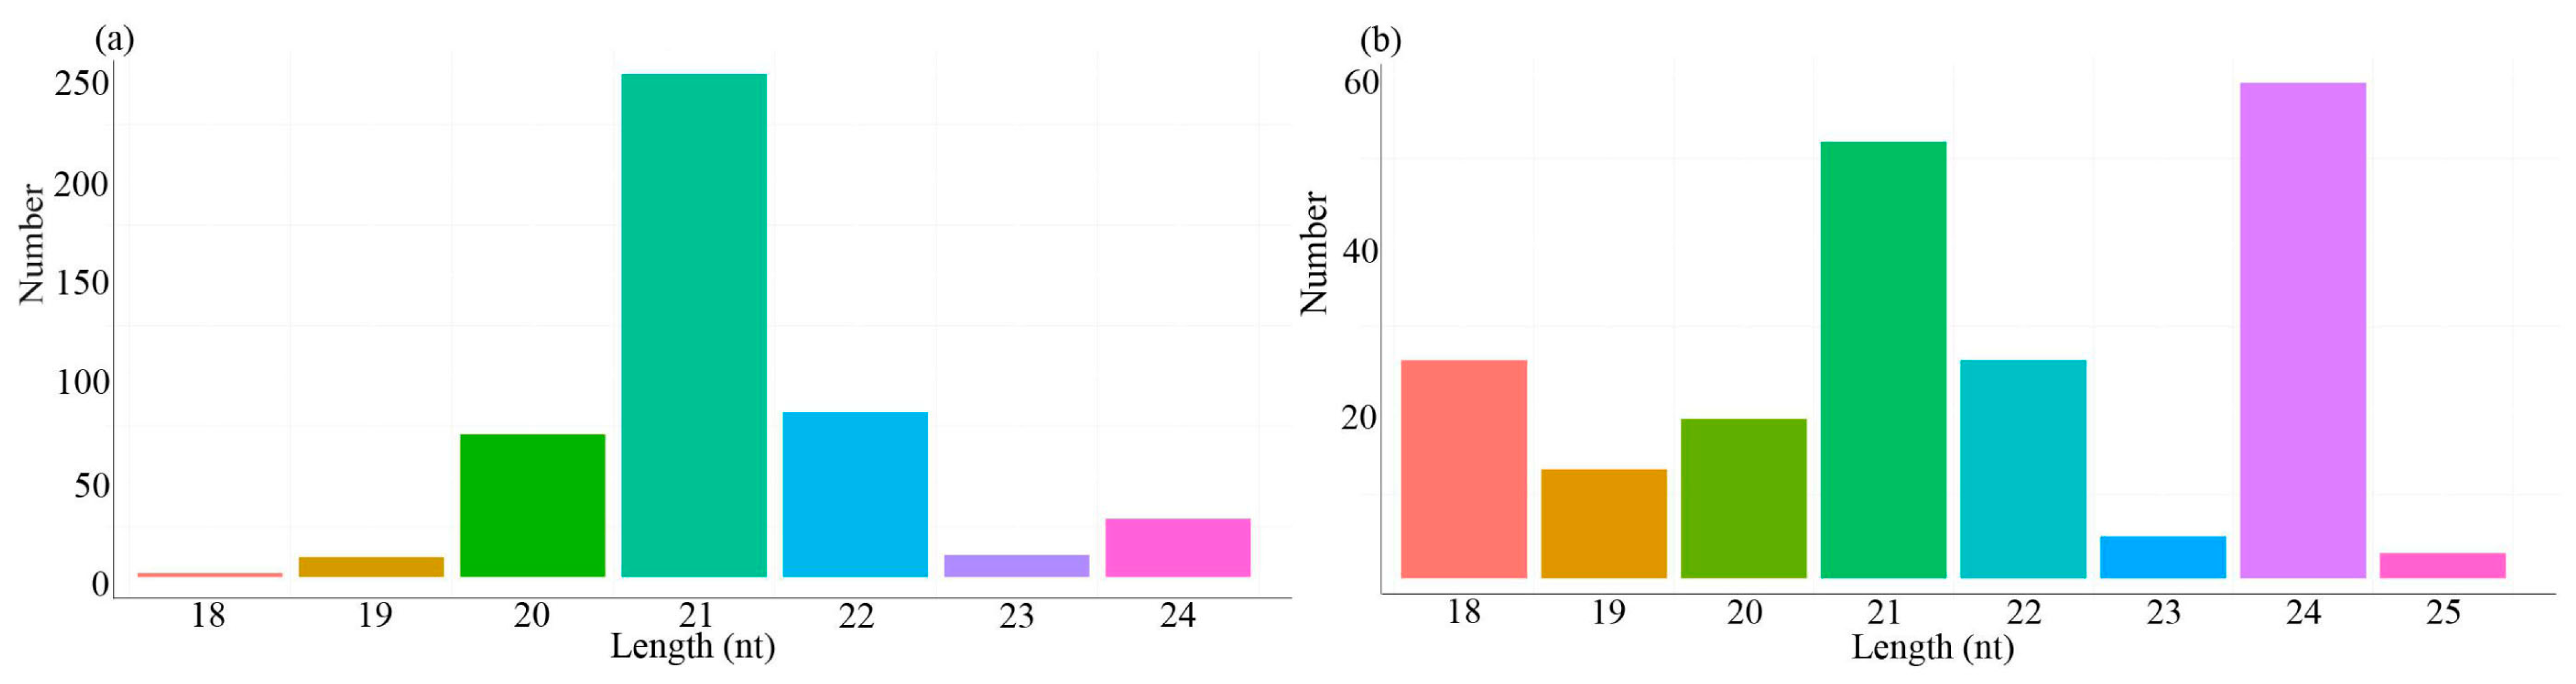
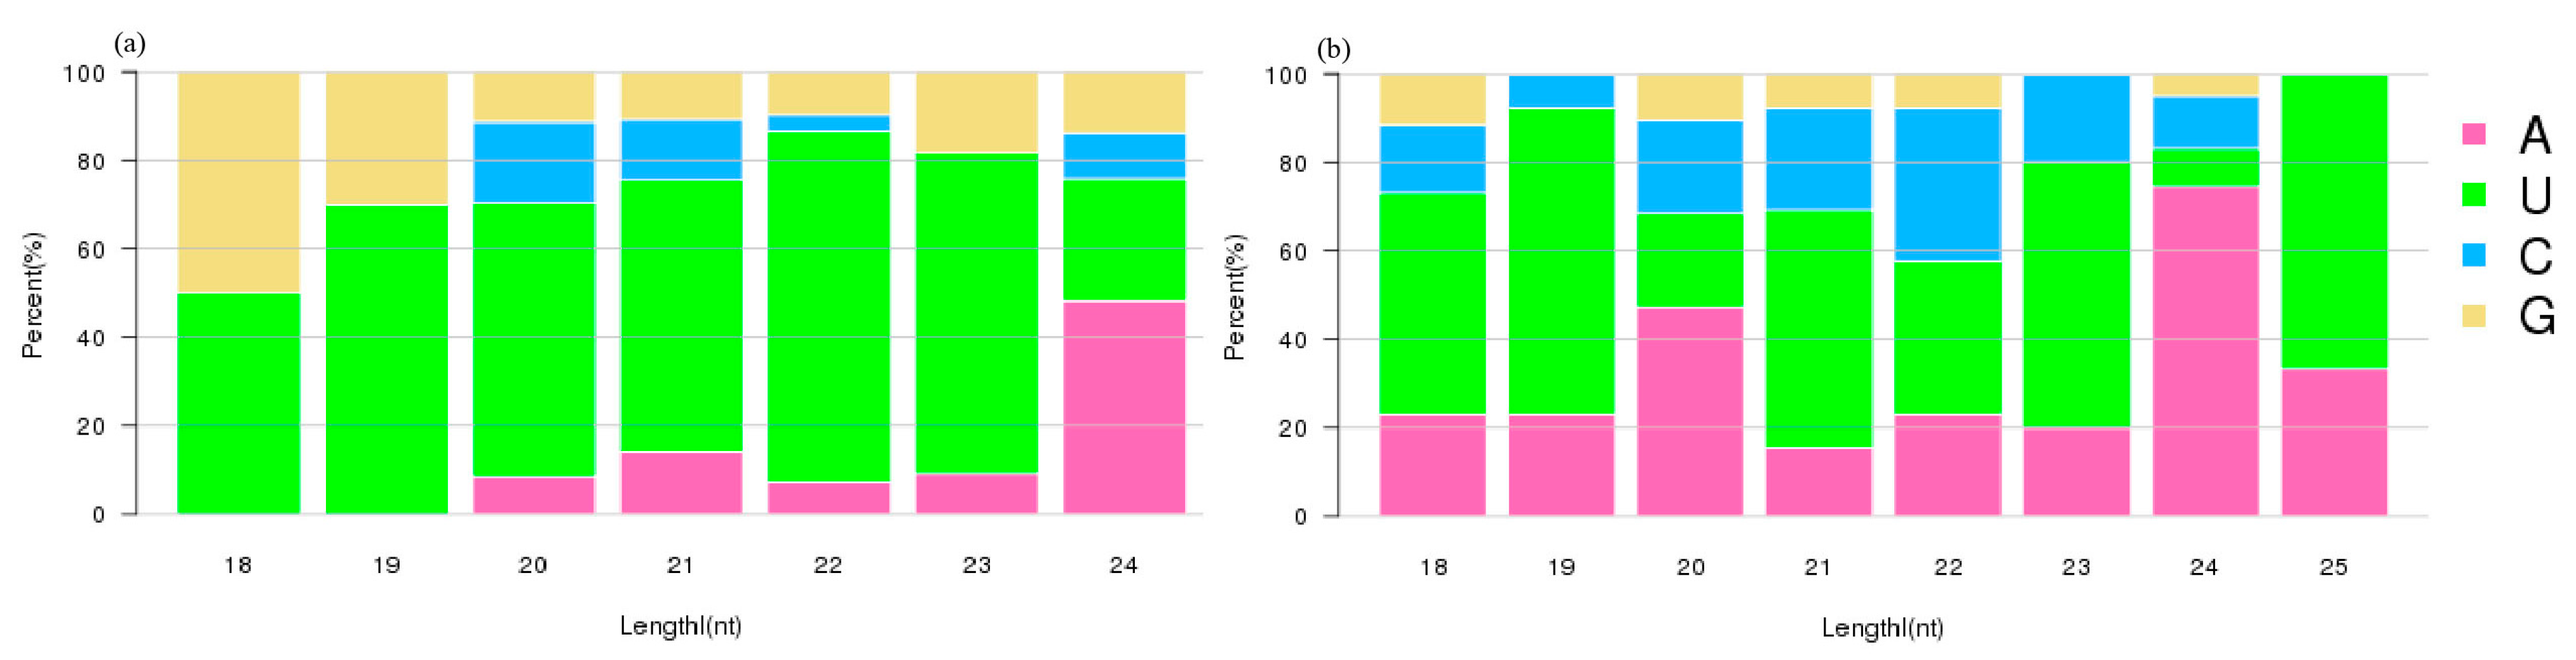
3.2. Sequencing of miRNA in Tea Plant Roots

Six small RNA libraries were constructed from tea plant roots with and without selenite treatment in the nutrient solution (three replicates, respectively), miRNAs were detected by high-throughput sequencing. The 6 libraries generated 18,596,150, 17,112,260, 20,020,521, 17,986,979, 18,063,864, and 20,471,991 raw reads, respectively (Table 1). After removing the low-quality sequences and adapter sequences, 13,692,729, 10,829,622, 15,534,063, 14,192,770, 12,214,380, and 15,444,869 clean reads (18–30 nt) were obtained. The sRNA information were shown in Table S3.

3.3. Identification of Tea Plant miRNAs

The obtained miRNAs sequences were used as queries in the miRBase, and the tea plant genome, and known miRNAs and novel miRNAs were identified, as shown in Table 2.
The length of the known and novel miRNAs ranged from 18 to 25 nt. 21-nt miRNAs were the most abundant among the known miRNAs (Figure 2a), while 24-nt miRNAs were most abundant among the novel miRNAs (Figure 2b). The formation of miRNA mature bodies was achieved by shearing of the Dicer enzyme and Dicer-like enzyme (DCL), and 21-nt or 24-nt dominated miRNAs were eventually generated due to the characteristic nature of the two enzymes. The nucleotide length distribution of miRNAs was similar to previous studies in Gossypium hirsutum and Chinese cabbage [41,42].
Different base positions across the miRNA molecule have different nucleotide bases preferences. Based on the results, the 5′ end bases of the known miRNAs of 19–23 nt in length were mostly U, while the miRNAs of 24 nt in length were mostly A (Figure 3a). Among the novel miRNAs, those with lengths of 20 nt and 24 nt had A in higher frequency in the 5′ end, while those with a length of 22 nt had C and U, and those with a length of 18–19 nt, 21 nt, 23 nt, and 25 nt had mostly U in higher frequency, respectively (Figure 3b).

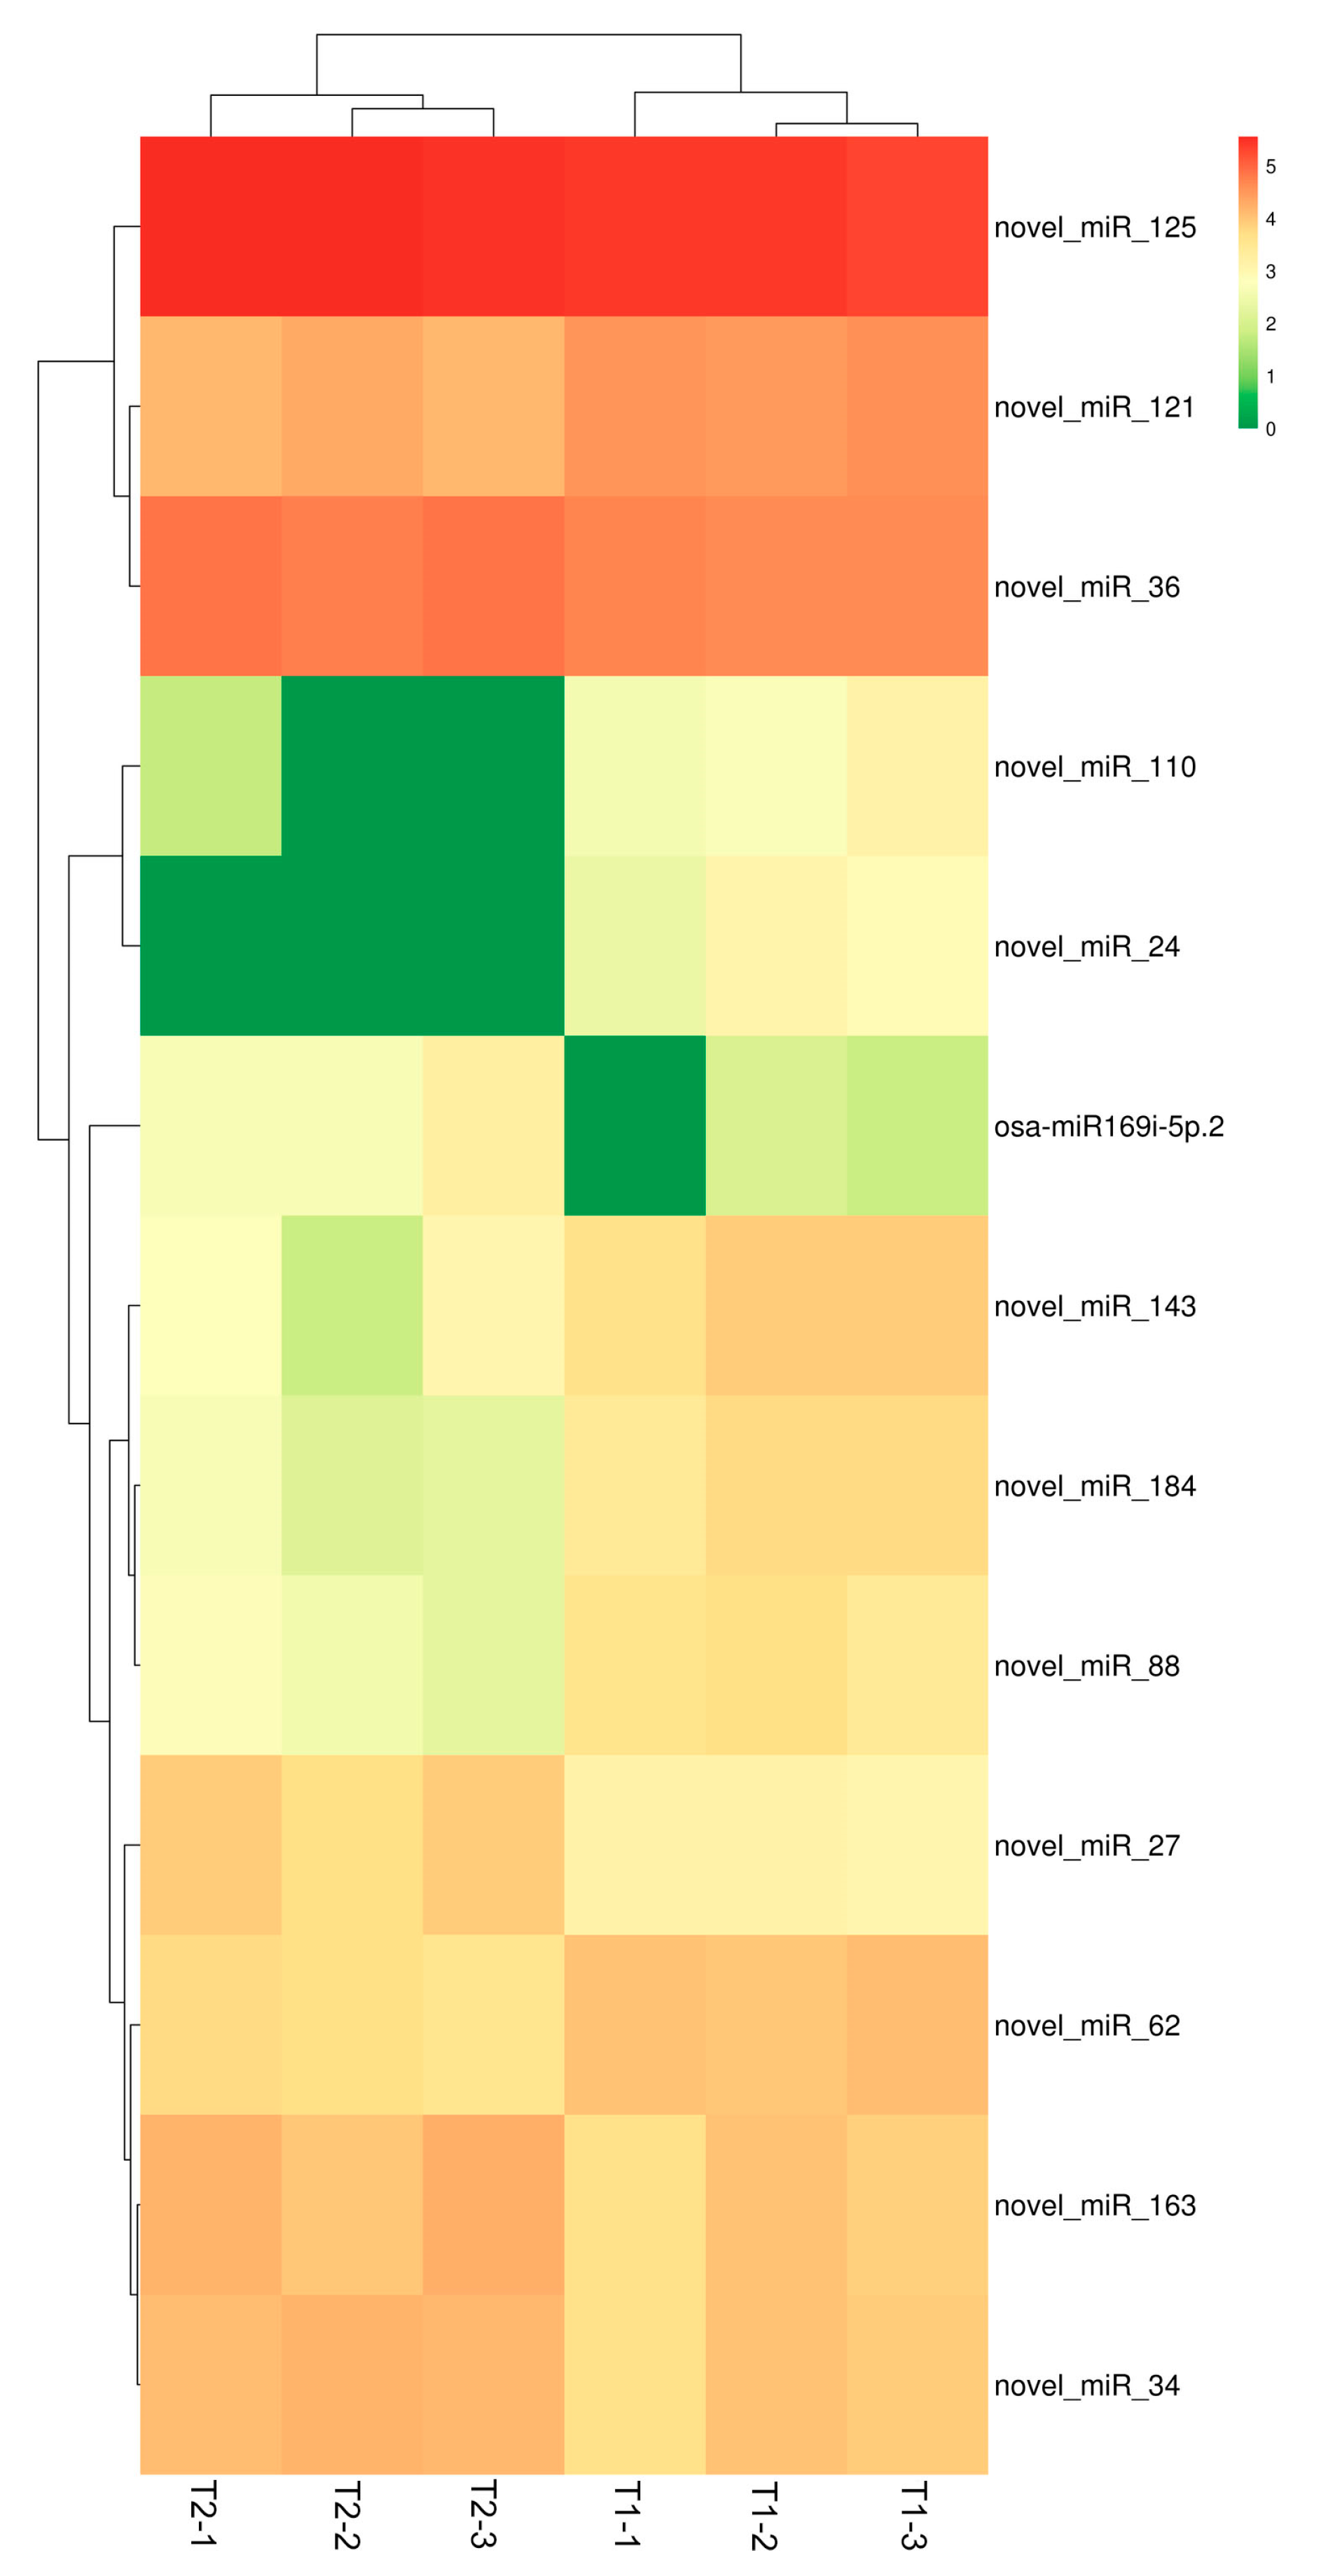
3.4. Analysis of Differentially Expressed miRNAs

By comparing the miRNAsequence data in the two libraries corresponding to the different treatments, 6 miRNAs (osa-miR169i-5p.2, novel_miR_125, novel_miR_163, novel_miR_27, novel_miR_34, novel_miR_36) were identified with up-regulated expression, among which 2 miRNAs (osa-miR169i-5p.2, novel_miR_27) were more than 2-fold up-regulated under selenite treatment. On the other hand,7 miRNAs (novel_miR_110, novel_miR_121, novel_miR_143, novel_miR_184, novel_miR_24, novel_miR_62, novel_miR_88) were down-regulated, among which 5 miRNAs (novel_miR_110, novel_miR_143, novel_miR_184, novel_miR_24, novel_miR_88) were more than 2-fold down-regulated under selenite treatment (Figure 4). The sequences of differentially expressed miRNAs were shown in the Table S4, and the sample correlation relationship was shown in the Figure S1.

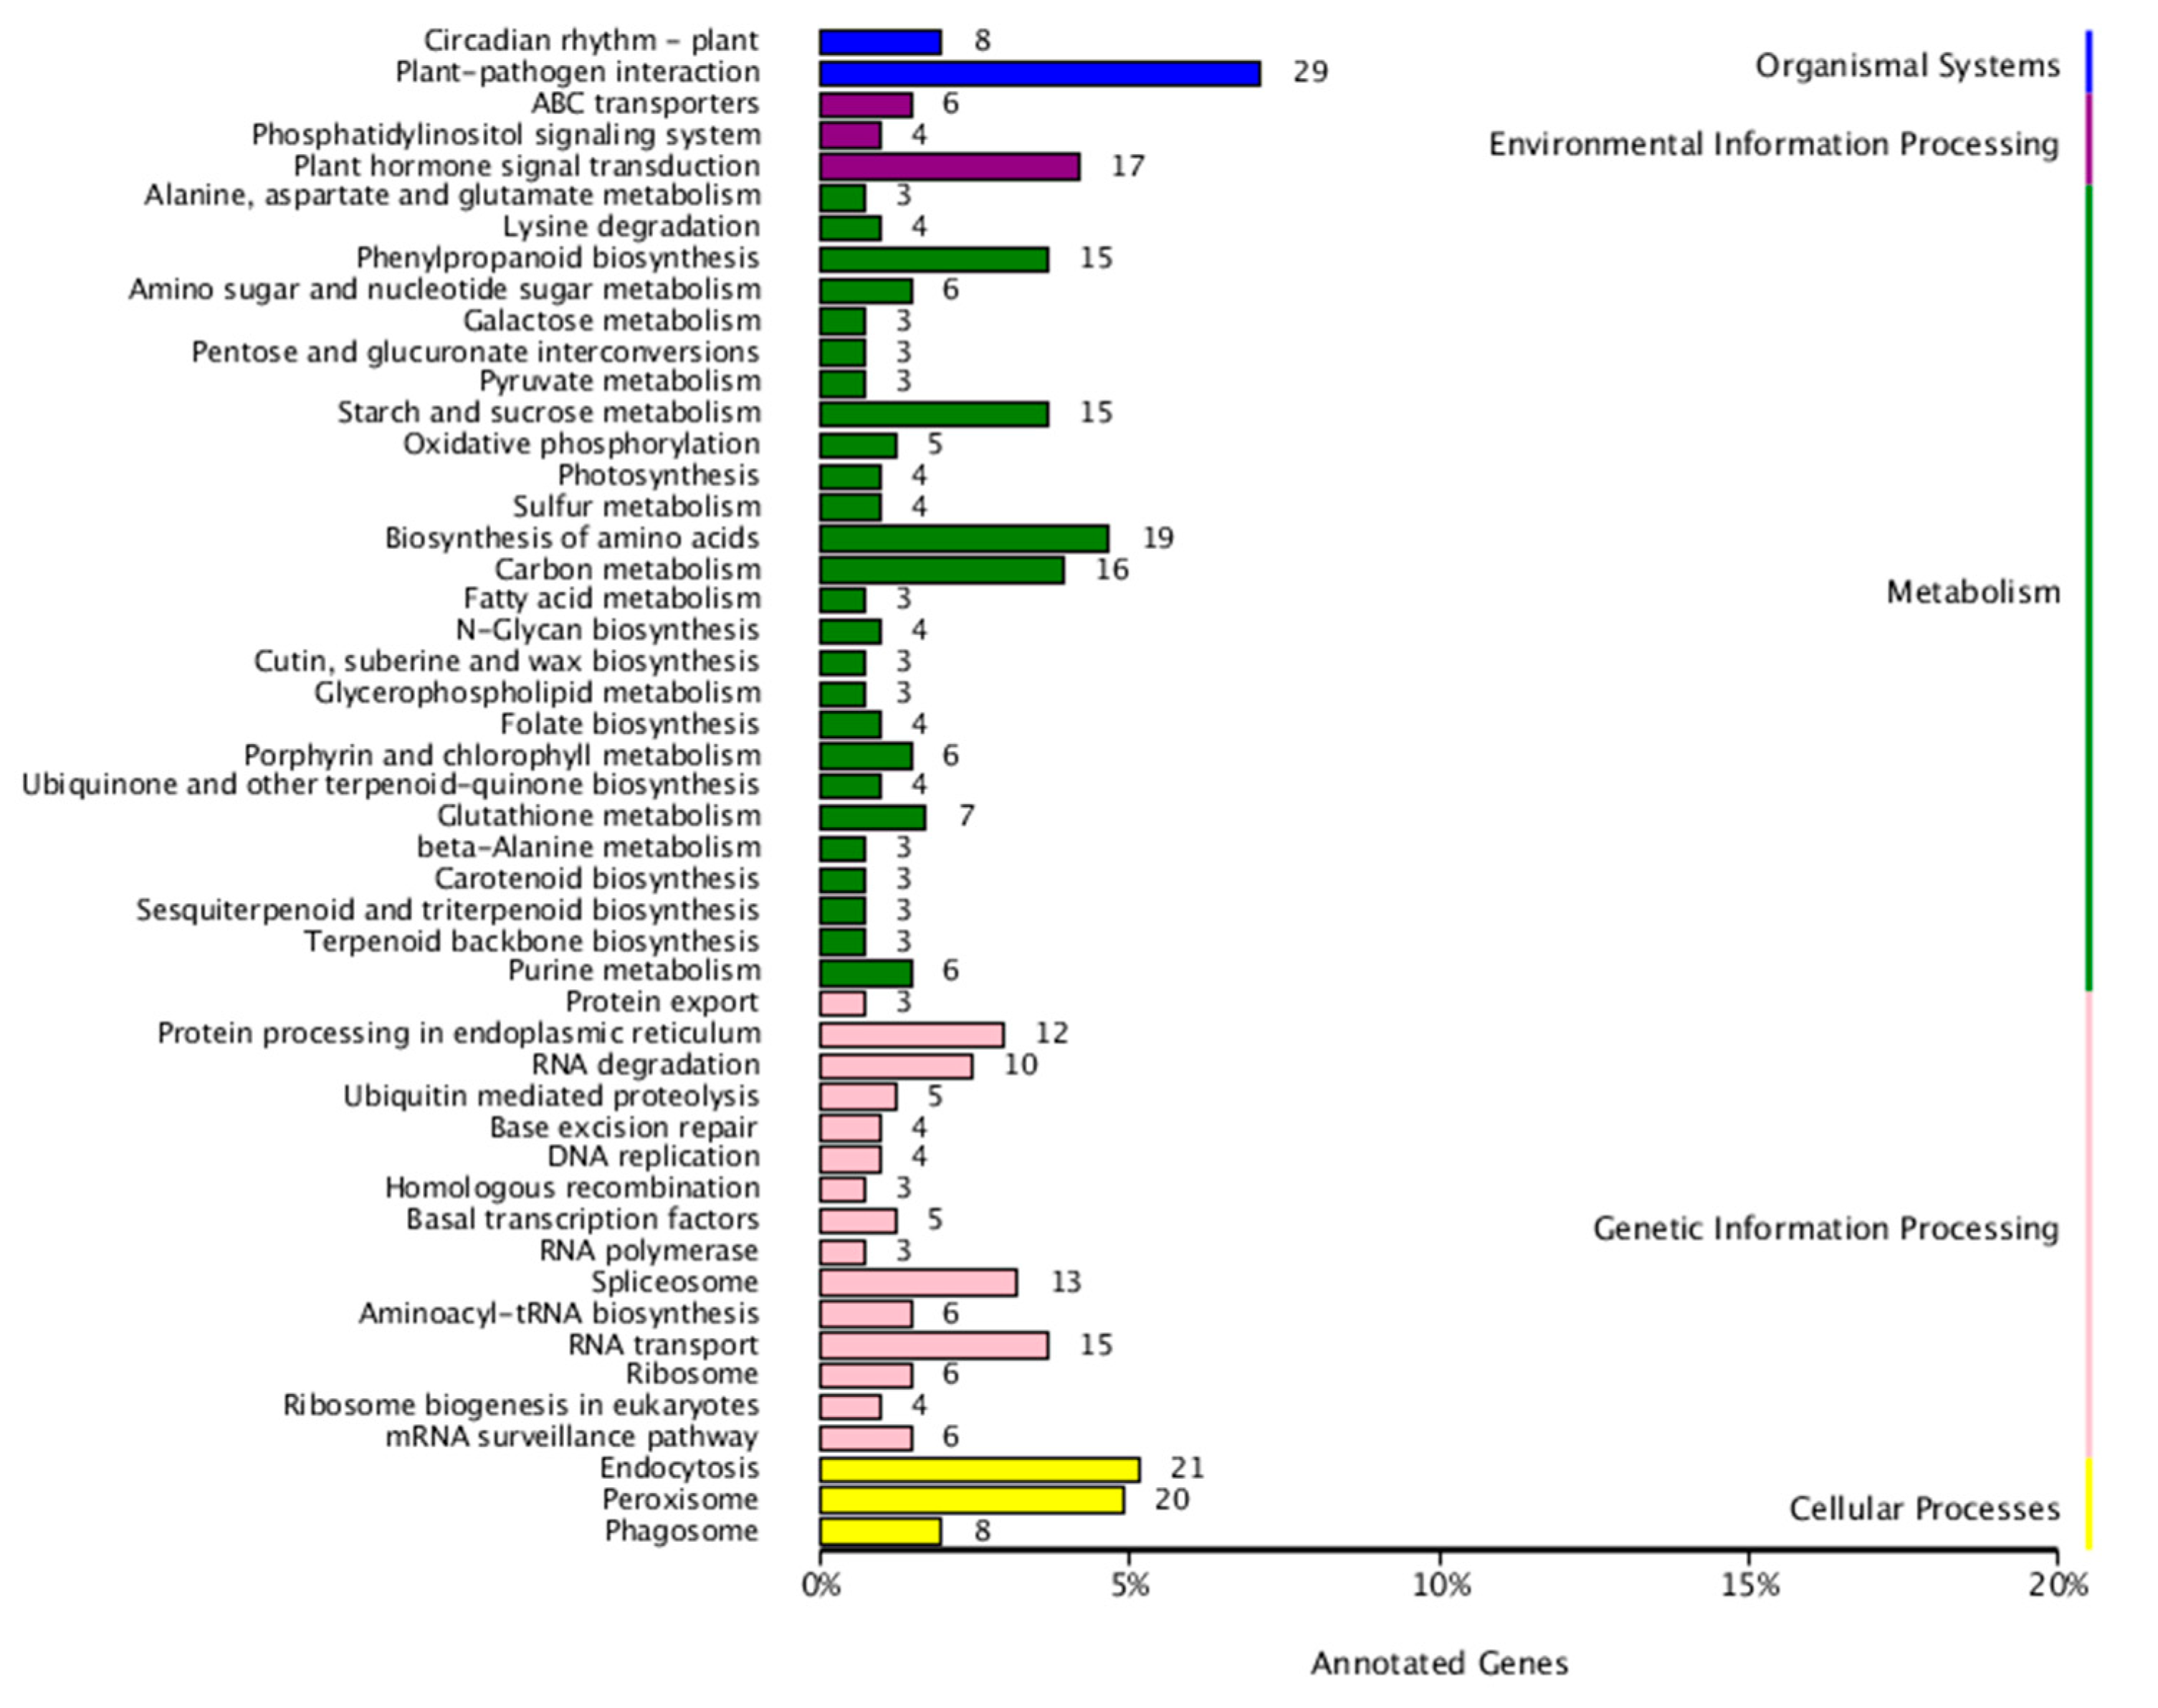
3.5. Identification of Target Genes of Differentially Expressed miRNAs

A total of 11,770 genes were annotated in the eight databases (Table 3), among which 914 miRNA target genes were annotated in the COG database, 1003 genes in the GO database, 866 genes in the KEGG database, 1107 genes in the KOG database, 1836 genes in Pfam database, 1788 genes in Swissprot database, 2094 genes in EggNOG database, 2162 genes in Nr database, respectively.
To assess GO term enrichment, the target genes of differentially expressed miRNAs were classified into the three gene ontology categories, i.e., biological process, cellular component, and molecular function. GO enrichment analysis revealed that the metabolic process, membrane, and catalytic activity categories were the most enriched among the differentially expressed miRNAs’ target genes in the roots of the tea plant (Figure 5).
KEGG pathway enrichment analysis was conducted on the differentially expressed miRNAs’ target genes (Figure 6). The target genes were enriched in forty-nine pathways. The top 5 KEGG pathways in terms of enriched target genes were plant-pathogen interaction (29 genes), endocytosis (21 genes), peroxisome (20 genes), biosynthesis of amino acids (19 genes), and plant hormone signal transduction (17 genes).
The degree of pathway enrichment was assessed using the Enrichment Factor, and the enrichment significance was calculated using Fisher’s exact test. KEGG pathway analysis revealed 20 pathways with significant enrichment (Figure 7), including sulfur metabolism, peroxisome, beta-alanine metabolism, ABC transporters, alanine, aspartate and glutamate metabolism, base excision repair, circadian rhythm-plant, DNA replication, endocytosis, folate biosynthesis, galactose metabolism, lysine degradation, N-Glycan biosynthesis, other types of O-glycan biosynthesis, pentose and glucuronate interconversions, porphyrin and chlorophyll metabolism, purine metabolism, pyruvate metabolism, taurine and hypotaurine metabolism and ubiquinone and other terpenoid-quinone biosynthesis. The top 3 pathways were beta-alanine metabolism, taurine and hypotaurine metabolism, and sulfur metabolism, implying that these metabolic pathways played important roles in tea plants’ metabolic response under selenite treatment.

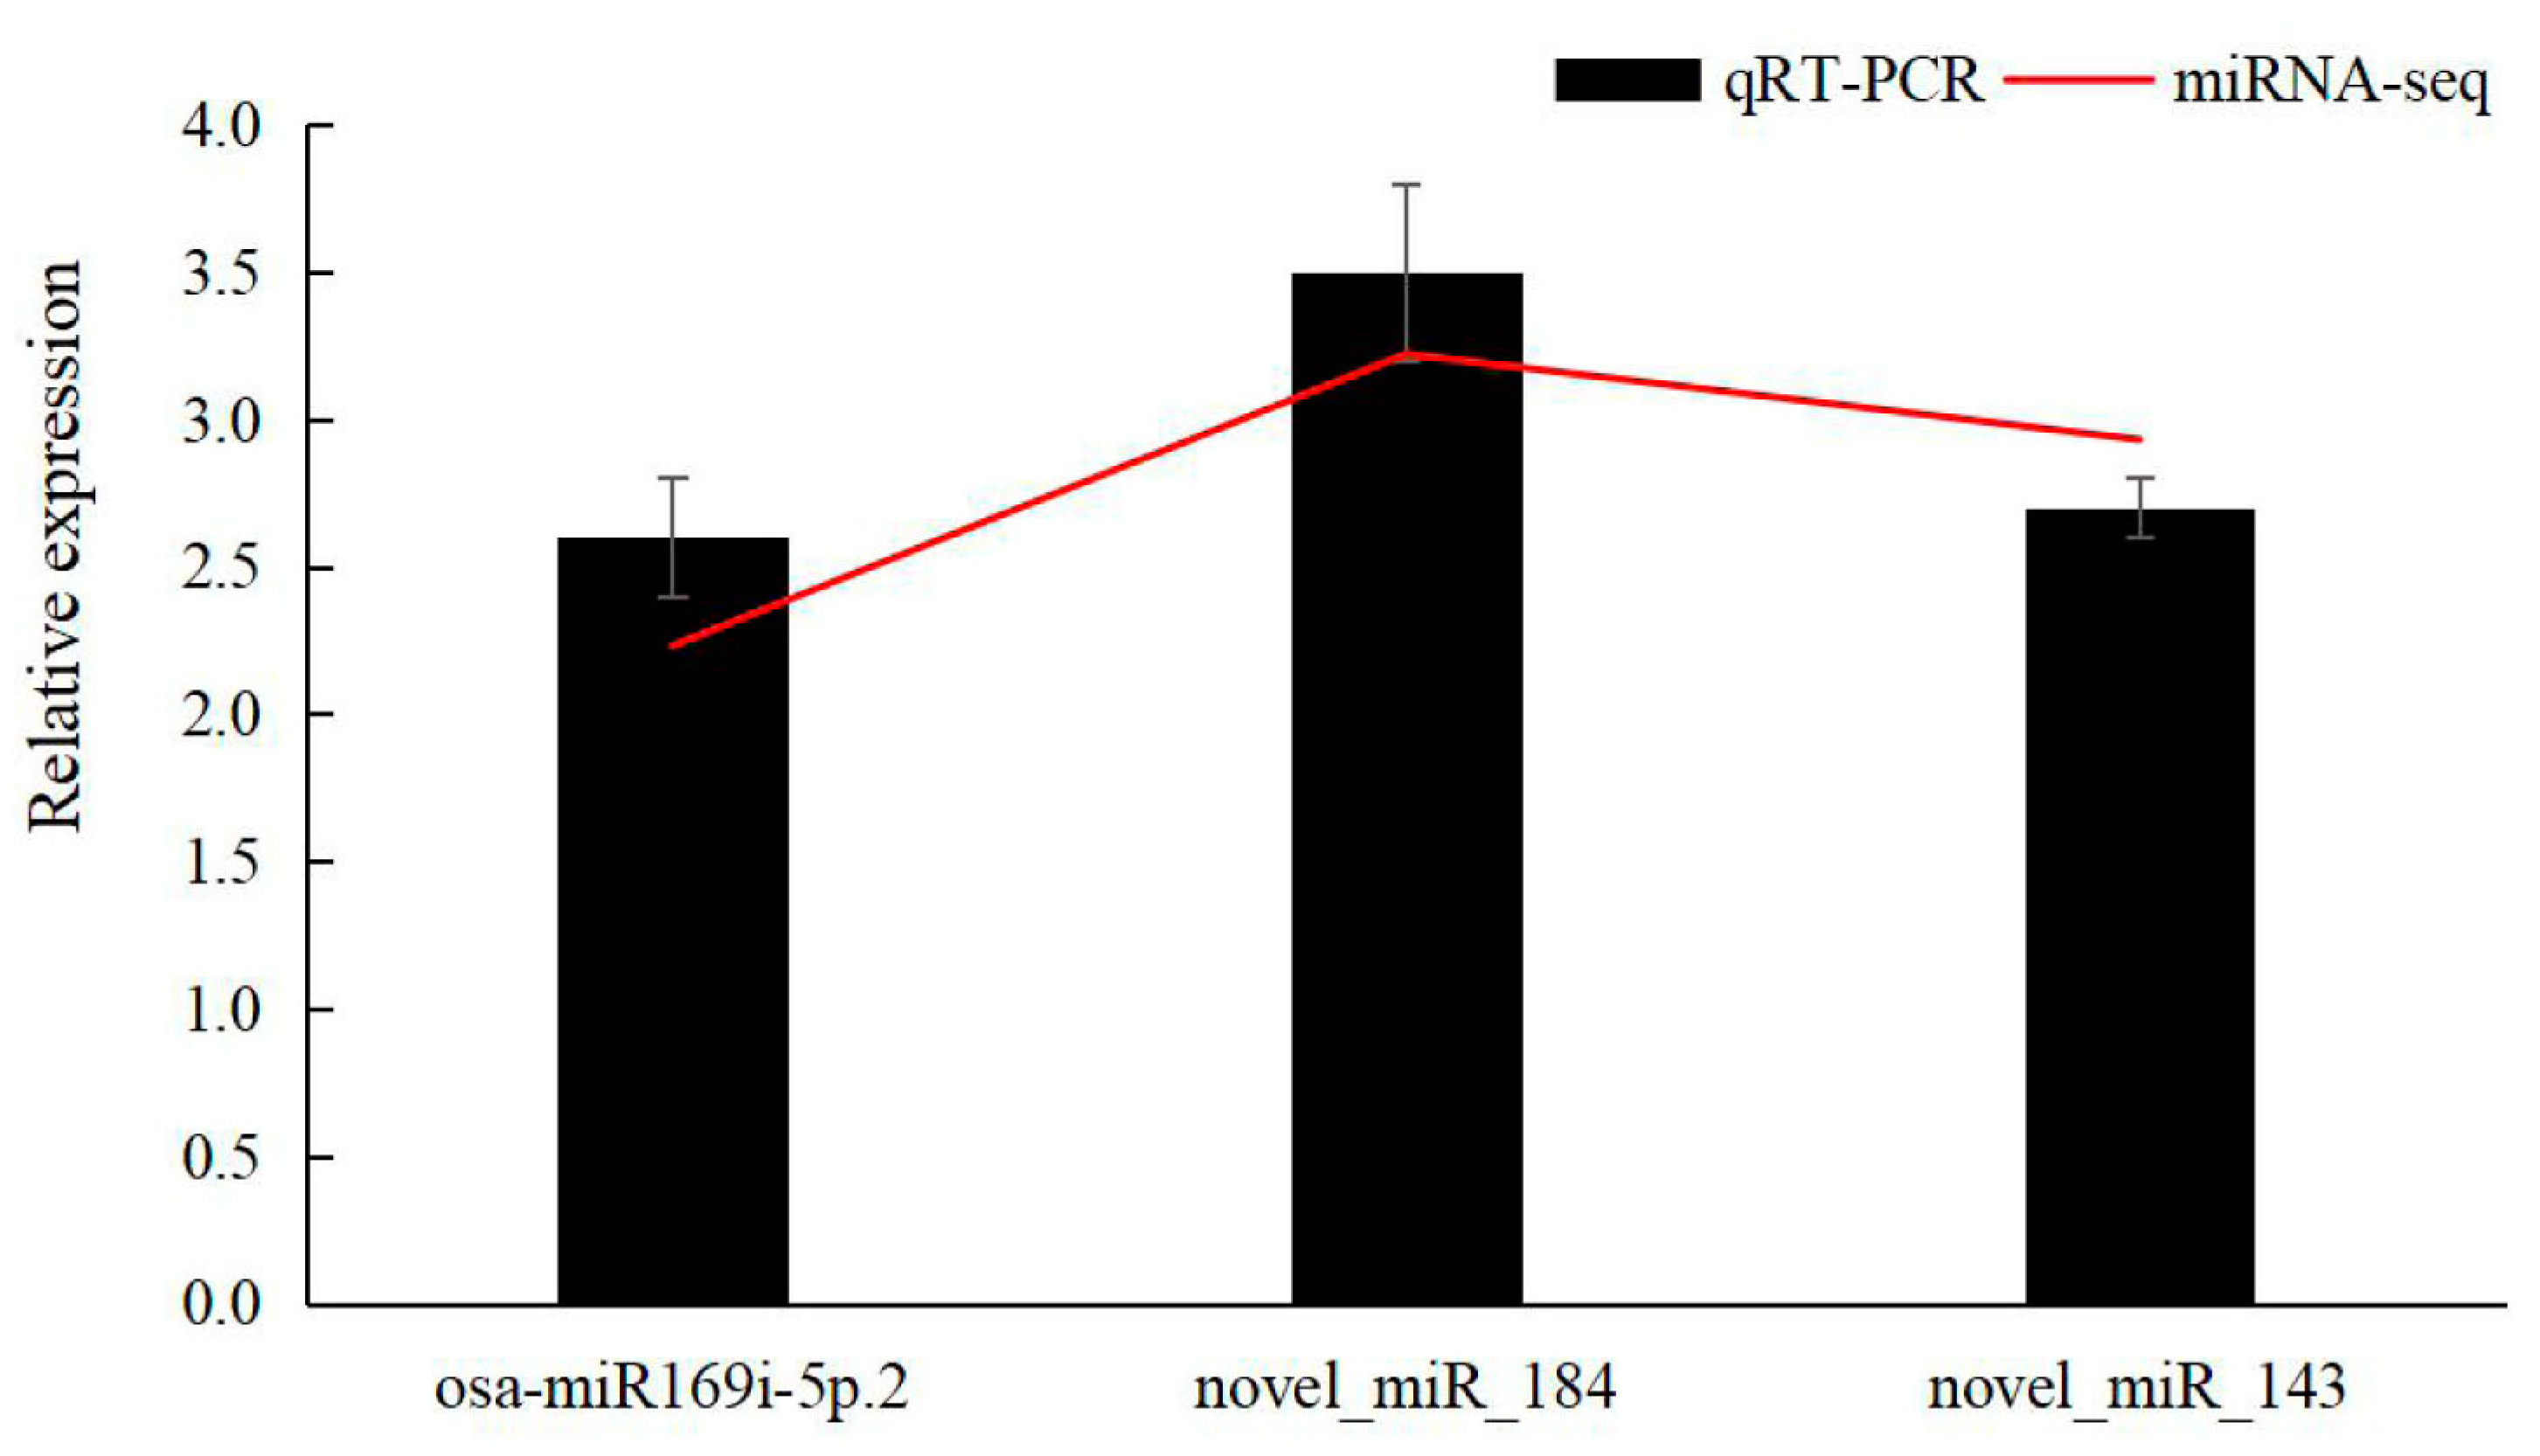
3.6. qRT-PCR Validation

To verify the accuracy of sequencing, 3 miRNAs were randomly selected for fluorescence quantitative PCR analysis. Among them, osa-miR169i-5p.2 was up-regulated, and novel_miR_184 and novel_miR_143 were down-regulated (Figure 8). These fluorescence quantitative PCR results validated the trends identified by sequencing.

4. Discussion

4.1. Se Content in Tea Plants

Numerous studies have confirmed that the antioxidant activity of Se-rich green tea is much higher than regular green tea, providing a better nutritional value for the human body [43,44]. Gallated catechins and key aroma compounds of Se-enriched green tea strongly correlated with Se, suggesting that Se is beneficial to tea quality [45]. Besides, many researches have demonstrated that tea plants have a strong enrichment capacity and tolerance to Se [19,20,21]. In our early studies [27], tea plant grew well in the selenite concentration from 0 to 0.05 mmol·L−1, but when the concentration was higher than 0.10 mmol·L−1, tea plant showed poisoning symptoms. Se was migrated to the upper part of the ground after absorbed by tea plant roots. And the total Se content in tea leaves (one bud and two leaves) increased significantly after treatment with 0.05 mmol·L−1 selenite for 48 h. So Se was supplied at the concentration of 0.05 mmol·L−1 in this study. 0.05 mmol·L−1 selenite significantly increased the Se content in tea plant roots and did not cause any toxicity symptoms in this study, in agreement with our previous findings [20,27].

4.2. miRNAs Associated with Se Accumulation in Tea Plants

With the continuous improvement of high-throughput sequencing technologies and tea plant genome sequencing, an ever-increasing number of miRNAs have been discovered in tea plants [46,47]. Six libraries (T1-1, T1-2, T1-3, T2-1, T2-2, T2-3) were constructed and sequenced in this study to investigate the regulatory mechanism of miRNAs on Se accumulation and metabolism in tea plants. In total, 455 known miRNAs and 203 novel miRNAs were identified, respectively. However, among the differentially expressed miRNAs, the novel miRNAs identified were comparable to the known miRNAs, indicating that novel miRNAs had greater involvement in the regulation of Se accumulation and metabolism in tea plant roots, similar to other study in tea plants [48]. Base analysis of the known miRNAs and novel miRNAs sequences revealed a clear preference for U, which may be a result of the natural evolution of miRNAs. Research has shown that Arabidopsis AGO1 protein has better binding ability to miRNAs with the first base U [49]. However, miRNA can only exercise its ability to negatively regulate its target after binding to AGO1 protein. Therefore, it is possible that AGO1 protein has a preference for the first base of miRNA due to its selectivity towards miRNA bases. KEGG pathway enrichment analysis found that peroxisome was significantly enriched, which might presumably be related to the fact that moderate concentration of Se enhanced peroxidase activity (Glutathione Peroxidase, GSH-Px) and increased the antioxidant capacity of plants [50].
More than 400 members of the miR169 gene family have been identified in 35 species, including monocotyledonous, dicotyledonous and certain ancient gymnospermspecies. The miR169 gene family is the largest miRNA gene family in Arabidopsis thaliana, poplar, grape, soybean, and other plants, indicative of its critical involvement in the regulation of plant growth and development [51]. The target genes of miR169 containchaperone, aminotransferase, protein-phosphatase, RNA-binding protein, tetratricopeptide-repeat-protein and transcription factors such as NF-YA, SEPELLATA-3 and ARF-9B [52]. Currently, most studies on the regulatory functions of miR169 focus on the downstream expression regulation of transcription factor NF-YA in regulating plant growth and development, stress induction, and flowering time through miRNA-target interactions [53,54,55]. In the present study, compared with the control group (T1), miR169i-5p.2 was up-regulated 2.23-fold in the selenite-treated group (T2), and 9 targets of miR169i-5p.2 involved in oligopeptide transporter, transmembrane protein and vacuolar-sorting receptor. The exact mechanism of action needs to be further investigated.
According to previous studies, the miR395 was shown to target the sulfate transporter (Sultr2;1) and ATP sulfase genes (APS1, APS3 and APS4). Studies in Arabidopsis and tea plantsdemonstrated that sulfur starvation induced the expression of Sultr2;1, which promoted Se uptake and transport in the plants [56,57]. Moreover, low concentrations of Se significantly increased the expression of superoxide dismutase genes, increased the activity of the corresponding enzymes, and elevated the antioxidant capacity, which improved Se accumulation and tolerance in tea plants [19]. Another study demonstrated that two superoxide dismutase enzyme genes (CSD1 and CSD2) were both targeted by miR398 [58]. Furthermore, phosphate transporter genes were shown to be differentially expressed in different tissues under a series of selenite concentrations, implying their importance in Se absorption, transport, and homeostasis [21]. Multiple miRNAs, such as miR399d and miR2275f, might regulate phosphate transporter genes [59]. In the present study, miR395, miR398, miR399d and miR2275f were not found to be differentially expressed, which may be related to potential tissue or temporal-specific expression of these genes. In addition, the relationship between the differentially expressed miRNAs of unknown function identified in this study and Se accumulation in tea plants must be confirmed and determined by expression and functional studies.

4.3. Pathways Associated with Se Uptake and Accumulation in Tea Plants

ATP-binding cassette (ABC) and nitrate transporters were responsive to selenite in plants. ABC transporters rely on the energy generated by the breakdown of ATP to drive the transmembrane transport of substances. Selenite treatment upregulated ABCA subfamily genes in perennial ryegrass [60]. Integrated transcriptome and proteome analyses found that the genes ABCA2 and ABCC4 were upregulated under selenite treantment in tea plants [61]. In rice, overexpression of NRT1.1B facilitated selenomethinone (SeMet) translocation from roots to shoots [62]. In this study, KEGG analysis found that the ABC transporter pathway was highly enriched (Figure 7), implying that this pathway might be involved in selenite uptake in tea plants. However, miRNAs that potentially target nitrate transporters were not identified to be differentially expressed, which may be related to the experimental conditions.
In plants, beta-alanine, taurine and hypotaurine, and Sufur metabolism have been shown to be associated with adversity stress, element metabolism, and uptake. For instance, 4 amino acids (β-alanine, L-glutamine, L-threonine, and L-serine) produced under molybdenum stress may form chelates with molybdenum in the vacuole to reduce its cellular toxicity and enhancing molybdenum tolerance in wheat [63]. Metabolic pathway enrichment analysis in broccoli sprouts revealed that the β-alanine metabolic pathway was most affected under Se treatment, which in turn affected the synthesis of thioglycosides [64]. Moreover, taurine and hypotaurine metabolism pathways were significantly enriched in the leaves in response to nitrogen treatment in Nitraria tangutorum [65]. In wheat, sulfur is involved in Se uptake and assimilation [66]. Adenosine-5′-phosphate reductase (APR2) is a key enzyme for sulfate and selenate reduction. Notably, differences of four orders of magnitude in the catalytic capacity of APR2 have been observed among Arabidopsis species, resulting in significant differences in sulfur and Se metabolism [67]. Further, numerous studies have shown that sulfur metabolism significantly impacts plant development, cellular signaling, and oxidative stress responses induced under high light and drought conditions [68,69]. In our previous transcriptome study, KEGG pathway analysis revealed that sulfur metabolism in leaves and taurine and hypotaurine metabolism in both leaves and roots were significantly enriched, hinting that these pathways were involved in Se accumulation and tolerance in tea plants [20], and similar conclusions were obtained in this study at the microRNA level. Specifically, KEGG pathway enrichment analysis implied that beta-alanine metabolism, taurine and hypotaurine metabolism, and sulfur metabolism were the most enriched pathways among the differentially expressed miRNAs’ target genes. A possible mechanism of action that could be implied is that Se is assimilated through the sulfur metabolic pathway. At the same time, the products of these three metabolic pathways could chelate with the Se absorbed by the root system, improving the Se tolerance of tea plants.

5. Conclusions

In this study, total Se content of tea plant roots was significantly increased under 0.05 mmol·L−1 selenite treatment. Then, we further identified the selenite-responsive miRNAs in the roots of the tea plant. 6 miRNA libraries were constructed using the roots of the tea cultivar “Echa 1”. 13 miRNAs were differentially expressed in tea plant roots, suggesting that they might be involved in Se accumulation and metabolism. GO enrichment analysis of target genes of the differentially expressed miRNAs revealed that metabolic process, membrane, and catalytic activity were the most enriched GO categories in the tea plant roots. KEGG pathway enrichment analysis suggested that beta-alanine, taurine, hypotaurine, and sulfur metabolism might be involved in Se accumulation and tea plant tolerance. These results have an important significance for guiding the use of molecular biology and biotechnological approaches to regulate the Se content of tea and also provide functional gene resources and a theoretical basis for selecting and breeding of new Se-enriched tea varieties.

Supplementary Materials

The following supporting information can be downloaded at: https://www.mdpi.com/article/10.3390/horticulturae9121278/s1, Figure S1: Correlation diagram of six treatments; Table S1: Primer sequences of miRNAs used for qRT-PCR, Table S2: The total Se content of six treatments; Table S3: sRNA information, Table S4: Sequences of 13 differentially expressed miRNAs.

Author Contributions

D.C. performed the experiment and wrote the draft manuscript, J.L. designed the experiment, L.M. conducted evidence collection, Y.L. analyzed the data, J.H. reversed the manuscript and X.J. obtained the funding acquisition. All authors have read and agreed to the published version of the manuscript.

Funding

The work was financially supported by the National key research and development program of China (2021YFD1601103, 2022YFD1200505, 2022YFD1201602), the National Key Research and Development Program in Hubei province of China (2023BBB043, 2021BBA241) and the Innovation Center Fund for Agricultural Science and Technology in Hubei Province of China (2021-620-000-001-024).

Data Availability Statement

The raw data presented in this study have been deposited in NCBI database and the SRA number is PRJNA1013500. The data are available upon request.

Conflicts of Interest

The authors declare no conflict of interest.

References

  1. Lee, R.C.; Feinbaum, R.L.; Ambros, V. The C. elegans heterochronic gene lin-4 encodes small RNAs with antisense complementarity to lin-14. Cell 1993, 75, 843. [Google Scholar] [CrossRef] [PubMed]
  2. Zhang, B.H.; Pan, X.P.; Cobb, G.P.; Anderson, T.A. Plant microRNA: A small regulatory molecule with big impact. Dev. Biol. 2006, 289, 3–16. [Google Scholar] [CrossRef] [PubMed]
  3. Mallory, A.C.; Vaucheret, H. Functions of microRNAs and related small RNAs in plants. Nat. Gene 2006, 38, S31–S36. [Google Scholar] [CrossRef] [PubMed]
  4. Huang, S.Q.; Peng, J.; Qiu, C.X.; Yang, Z.M. Heavy metal-regulated new microRNAs from rice. J. Inorg. Biochem. 2009, 103, 282–287. [Google Scholar] [CrossRef] [PubMed]
  5. Shivaprasad, P.V.; Chen, H.M.; Patel, K.; Bond, D.M.; Santos, B.; Baulcombe, D.C. A microRNA superfamily regulates nucleotide binding site-leucine-rich repeats and other miRNAs. Plant Cell 2012, 24, 859–874. [Google Scholar] [CrossRef] [PubMed]
  6. Phillips, J.R.; Dalmay, T.; Bartels, D. The role of small RNAs in abiotic stress. Febs Lett. 2007, 581, 3592–3597. [Google Scholar] [CrossRef] [PubMed]
  7. Wang, L.; Zeng, J.H.Q.; Song, J.; Feng, S.J.; Yang, Z.M. miRNA778 and SUVH6 are involved in phosphate homeostasis in Arabidopsis. Plant Sci. 2015, 238, 273–285. [Google Scholar] [CrossRef]
  8. Zeng, H.Q.; Zhu, Y.Y.; Huang, S.Q.; Yang, Z.M. Analysis of phosphorus-deficient responsive miRNAs and cis-elements from soybean (Glycine max L.). J. Plant Physiol. 2010, 167, 1289–1297. [Google Scholar] [CrossRef]
  9. Lyu, C.Y.; Sha, A.H. Response to phosphorus deficiency regulated by microRNA168 in soybean plant. Chin. J. Oil Crop Sci. 2017, 39, 321–325. [Google Scholar] [CrossRef]
  10. He, H.; Liang, G.; Li, Y.; Wang, F.; Yu, D. Two young microRNAs originating from target duplication mediate nitrogen starvation adaptation via regulation of glucosinolate synthesis in Arabidopsis thaliana. Plant Physiol. 2014, 164, 853–865. [Google Scholar] [CrossRef]
  11. Liu, Z.W.; Li, H.; Liu, J.X.; Wang, Y.; Zhuang, J. Integrative transcriptome, proteome, and microRNA analysis reveals the effects of nitrogen sufficiency and deficiency conditions on theanine metabolism in the tea plant (Camellia sinensis). Hortic. Res. 2020, 7, 1865–1877. [Google Scholar] [CrossRef] [PubMed]
  12. Matthewman, C.A.; Kawashima, C.G.; Húska, D.; Csorba, T.; Dalmay, T.; Kopriva, S. miR395 is a general component of thesulfate assimilation regulatory network in Arabidopsis. Febs Lett. 2012, 586, 3242–3324. [Google Scholar] [CrossRef] [PubMed]
  13. Tang, Y.X.; Wang, H.M.; Liu, Q.L.; Meng, C.X. Summary of selenium in soil and plant. J. Hebei Agric. Sci. 2008, 12, 43–45. [Google Scholar] [CrossRef]
  14. Wang, Y.D.; Wang, X.; Ngai, S.M.; Wong, Y.S. Comparative proteomics analysis of selenium responses in selenium-enrichedricegrains. J. Proteome Res. 2013, 12, 808–820. [Google Scholar] [CrossRef] [PubMed]
  15. Fordyce, F. Selenium geochemistry and health. AMBIO A J. Hum. Environ. 2007, 36, 94–97. [Google Scholar] [CrossRef]
  16. Paul, N.; Williams, E.L.; Sun, G.X.; Scheckel, K.; Zhu, Y.G.; Feng, X.B.; Zhu, J.M.; Carey, A.M.; Adomako, E.; Lawgali, Y.; et al. Selenium Characterisation in the Global Rice Supply Chain. Environ. Sci. Technol. 2009, 43, 6024–6030. [Google Scholar] [CrossRef]
  17. Rayman, M.P. Selenium and human health. Lancet 2012, 379, 1256–1268. [Google Scholar] [CrossRef]
  18. Du, Q.Z.; Shen, X.R.; Fang, X.H. Analysis on selenium compositions in tea leaves. J. Tea Sci. 1991, 11, 133–137. [Google Scholar]
  19. Zhao, H.; Huang, J.; Li, Y.; Song, X.W.; Luo, J.L.; Yu, Z.; Ni, D.J. Natural variation of selenium concentration in diverse tea plant (Camellia sinensis) accessions at seedling stage. Sci. Hortic. 2016, 198, 163–169. [Google Scholar] [CrossRef]
  20. Cao, D.; Liu, Y.L.; Ma, L.L.; Jin, X.F.; Guo, G.Y.; Tan, R.R.; Liu, Z.; Ye, F.; Liu, W. Transcriptome of differentially expressed genes involved in selenium accumulation in tea plant (Camellia sinensis). PLoS ONE 2018, 13, E0197506. [Google Scholar] [CrossRef]
  21. Cao, D.; Liu, Y.L.; Ma, L.L.; Liu, Z.H.; Li, J.; Wen, B.B.; Zhang, X.N.; Yin, P.; Jin, X.F.; Huang, J.A. Genome-wide identificationand characterization of phosphate transporter gene family members in tea plants (Camellia sinensis L.O. Kuntze) underdifferent selenite levels. Plant Physiol. Biochem. 2021, 166, 668–676. [Google Scholar] [CrossRef] [PubMed]
  22. Zhang, Y.; Zhu, X.J.; Chen, X.; Song, C.N.; Zou, Z.W.; Wang, Y.H.; Wang, M.L.; Fang, W.P.; Li, X.H. Identification and characterization of cold-responsive microRNAs in tea plant (Camellia sinensis) and their targets using high-throughput sequencing and degradome analysis. BMC Plant Biol. 2014, 14, 271. [Google Scholar] [CrossRef] [PubMed]
  23. Jeyaraj, A.; Elango, T.; Li, X.H.; Guo, G.Y. Utilization of microRNAs and their regulatory functions for improving biotic stress tolerance in tea plant [Camellia sinensis (L.)O. Kuntze]. RNA Biol. 2020, 17, 1365–1382. [Google Scholar] [CrossRef] [PubMed]
  24. Li, H.; Lin, Q.Q.; Yan, M.L.; Wang, M.L.; Wang, P.; Zhao, H.; Wang, Y.; Ni, D.J.; Guo, F. Relationship between secondary metabolism and mirna for important flavor compounds in different tissues of tea plant (Camellia sinensis) as revealed by genome-wide mirna analysis. J. Agric. Food Chem. 2021, 69, 2001–2012. [Google Scholar] [CrossRef] [PubMed]
  25. Çakır, Ö.; Turgutkara, N.; Arı, S.; Zhang, B.H. De novo transcriptome assembly and comparative analysis elucidate complicated mechanism regulating Astragalus chrysochlorus response to selenium stimuli. PLoS ONE 2015, 10, E0135677. [Google Scholar] [CrossRef]
  26. Elberse, I.A.M.; VanDamme, J.M.M.; VanTienderen, P.H. Plasticity of growth characteristics in wild barley (Hordeum spontaneum) in response to nutrient limitation. J. Ecol. 2003, 91, 371–382. [Google Scholar] [CrossRef]
  27. Cao, D.; Ma, L.L.; Liu, Y.L.; Gong, Z.M.; Jin, X.F. Absorption and accumulation characteristics of selenium in tea plant (Camellia sinensis) and expression analysis of genes related to selenium regulation. J. Tea Sci. 2020, 40, 77–84. [Google Scholar] [CrossRef]
  28. Langmead, B.; Trapnell, C.; Pop, M.; Salzberg, S.L. Ultrafast and memory-efficient alignment of short DNA sequences to the human genome. Genome Biol. 2009, 10, R25. [Google Scholar] [CrossRef]
  29. Li, B.; Ruotti, V.; Stewart, R.M.; Thomson, J.A.; Dewey, C.N. RNA-Seq gene expression estimation with read mapping uncertainty. Bioinformatics 2009, 26, 493–500. [Google Scholar] [CrossRef]
  30. Love, M.I.; Huber, W.; Anders, S. ModeratedestimationoffoldchangeanddispersionforRNA-seqdatawithDESeq2. Genome Biol. 2014, 15, 550. [Google Scholar] [CrossRef]
  31. Allen, E.; Xie, Z.; Gustafson, A.M.; Carrington, J.C. microRNA-directed phasing during trans-acting siRNA biogenesis in plants. Cell 2005, 121, 207–221. [Google Scholar] [CrossRef] [PubMed]
  32. Deng, Y.Y.; Li, J.Q.; Wu, S.F.; Zhu, Y.P.; Chen, Y.W.; He, F.C. Integrated nr database in protein annotation system and its Localization. Comput. Eng. 2006, 32, 71–74. [Google Scholar] [CrossRef]
  33. Koonin, E.V.; Fedorova, N.D.; Jackson, J.D.; Jacobs, A.R.; Krylov, D.M.; Makarova, K.S.; Mazumder, R.; Mekhedov, S.; Nikolskaya, A.N.; Rao, B.S.; et al. A comprehensive evolutionary classification of proteins encoded in complete eukaryotic genomes. Genome Biol. 2004, 5, R7. [Google Scholar] [CrossRef] [PubMed]
  34. Tatusov, R.L.; Galperin, M.Y.; Natale, D.A.; Koonin, E.V. The COG database: A tool for genome scale analysis of protein functions and evolution. Nucleic Acids Res. 2000, 28, 33–36. [Google Scholar] [CrossRef]
  35. Eddy, S.R. Profile hidden Markov models. Bioinformatics 1998, 14, 755–763. [Google Scholar] [CrossRef] [PubMed]
  36. Apweiler, R.; Bairoch, A.; Wu, C.H.; Yeh, L.S.L. UniProt: The Universal Protein Knowledgebase. Nucleic Acids Res. 2017, 45, D158–D169. [Google Scholar] [CrossRef]
  37. Minoru, K.; Susumu, G.; Shuichi, K.; Yasushi, O.; Masahiro, H. The KEGG resource for deciphering the genome. Nucleic Acids Res. 2004, 32, D277. [Google Scholar] [CrossRef]
  38. Ashburner, M.; Ball, C.A.; Blake, J.A.; Botstein, D.; Cherry, J.M. Gene ontology: Tool for the unification of biology. The gene ontology consortium. Nat. Genet. 2000, 25, 25–29. [Google Scholar] [CrossRef]
  39. Chen, X.; Mao, X.; Huang, D.; Wu, J.; Dong, S.; Lei, K.; Ge, G.; Li, C.Y.; Wei, L. KOBAS2.0: A web server for annotation andidentification of enriched pathways and diseases. Nucleic Acids Res. 2011, 39, 316–322. [Google Scholar] [CrossRef]
  40. Zhang, L.B.; Zou, J.; Li, S.S.; Wang, B.S.; Raboanatahiry, N.; Li, M.T. Characterization and expression profiles of miRNAs in the triploid hybrids of Brassica napus and Brassica rapa. BMC Genom. 2019, 20, 649. [Google Scholar] [CrossRef]
  41. Guo, N.; Zhang, Y.J.; Sun, X.; Fan, H.H.; Gao, J.S.; Chao, Y.P.; Liu, A.F.; Yu, X.T.; Cai, Y.P.; Un, Y. Genome-wide identificationof differentially expressed miRNAs induced by ethephon treatment in abscission layer cells of cotton (Gossypium hirsutum). Gene 2018, 676, 263–268. [Google Scholar] [CrossRef] [PubMed]
  42. Li, P.R.; Su, T.B.; Zhang, D.S.; Wang, W.H.; Zhang, F.L. Genome-wide analysis of changes in miRNA and target gene expression reveals key roles in heterosis for Chinese cabbage biomass. Hortic. Res. 2021, 8, 39. [Google Scholar] [CrossRef] [PubMed]
  43. Yu, F.; Sheng, J.C.; Xu, J.; An, X.X.; Hu, Q.H. Antioxidant activities of crude tea polyphenols, polysaccharides and proteins ofselenium-enriched tea and regular green tea. Eur. Food Res. Technol. 2007, 225, 843–848. [Google Scholar] [CrossRef]
  44. Hu, Q.; Pan, G.; Zhu, J. Effect of fertilization on selenium content of tea and the nutritional function of Se-enriched tea in rats. Plant Soil 2002, 238, 91–95. [Google Scholar] [CrossRef]
  45. Ye, Y.Y.; Yan, W.; Peng, L.J.; Zhou, J.J.; He, J.L.; Zhang, N.; Cheng, S.Y.; Cai, J. Insights into the key quality components in Se-Enriched green tea and their relationship with Selenium. Food Res. Int. 2023, 165, 112460. [Google Scholar] [CrossRef]
  46. Zhao, S.Q.; Wang, X.W.; Yan, X.M.; Guo, L.X.; Mi, X.Z.; Xu, Q.S.; Zhu, J.Y.; Wu, A.L.; Liu, L.L.; Wei, C.L. Revealing of the microRNA involved regulatory gene networks on terpenoid biosynthesis in Camellia sinensis in different growing time points. J. Agr. Food Chem. 2018, 66, 12604–12616. [Google Scholar] [CrossRef]
  47. Jeyaraj, A.; Wang, X.W.; Wang, S.S.; Liu, S.R.; Wei, C.L. Identification of regulatory networks of microRNAs and their targets in response to colletotrichum gloeosporioides in tea plant (Camellia sinensis L.). Front. Plant Sci. 2019, 10, 1096. [Google Scholar] [CrossRef]
  48. Chen, L.B.; Xia, L.F.; Liu, Y.; Sun, Y.N.; Jiang, H.B.; Tian, Y.L.; Chen, L. Screening of miRNA related to anthocyanin synthesis in tea cultivar ‘Zijuan’ based on high throughput sequencing. J. Tea Sci. 2019, 39, 681–691. [Google Scholar]
  49. Mi, S.; Cai, T.; Hu, Y.; Chen, Y.; Hodges, E.; Ni, F.; Wu, L.; Shan, L.; Zhou, H.; Ling, C. Sorting of small RNAs into Arabidopsis argonaute complexes is directed by the 5′terminal nucleotide. Cell 2008, 133, 116–127. [Google Scholar] [CrossRef]
  50. Mroczek-Zdyrska, M.; Magorzata, W. The Influence of selenium on root growth and oxidative stress induced by lead in viciafabal. minor plants. Biol. Trace Elem. Res. 2012, 147, 320–328. [Google Scholar] [CrossRef]
  51. Xu, M.Y.; Zhu, J.X.; Zhang, M.; Wang, L. Advances on plant miR169/NF-YA regulation modules. Hereditas 2016, 38, 700–706. [Google Scholar] [CrossRef] [PubMed]
  52. Rao, S.; Balyan, S.; Jha, S.; Mathur, S. Novel insights into expansion and functional diversification of MIR169 family in tomato. Planta 2020, 251, 55. [Google Scholar] [CrossRef] [PubMed]
  53. Jiao, Z.Y.; Lian, C.L.; Han, S.; Huang, M.B.; Shen, C.; Li, Q.; Niu, M.X.; Yu, X.; Yin, W.L.; Xia, X.L. PtmiR169o plays a positive role in regulating drought tolerance and growth by targeting the PtNF-YA6 gene in poplar. Environ. Exp. Bot. 2021, 189, 104549. [Google Scholar] [CrossRef]
  54. Zhao, M.; Ding, H.; Zhu, J.K.; Zhang, F.S.; Li, W.X. Involvement of miR169 in the nitrogen-starvation responses in Arabidopsis. New Phytol. 2011, 190, 906–915. [Google Scholar] [CrossRef] [PubMed]
  55. Luan, M.D.; Xu, M.Y.; Lu, Y.M.; Zhang, Q.X.; Zhang, L.; Zhang, C.Y.; Fan, Y.L.; Lang, Z.H.; Wang, L. Family-wide survey of miR169s and NF-YAs and their expression profiles response to abiotic stress in maize roots. PLoS ONE 2014, 9, E91369. [Google Scholar] [CrossRef] [PubMed]
  56. Buchner, P.; Parmar, S.; Kriegel, A. The sulfate transporter family in wheat: Tissue-specific gene expression inrelation tonutrition. Mol. Plant 2010, 3, 374–389. [Google Scholar] [CrossRef]
  57. Freeman, J.L.; Tamaoki, M.; Stushnoff, C.; Yuinn, C.F.; Cappa, J.J.; Devonshire, J.; Fakra, S.C.; Marcus, M.A.; McGrath, S.P.; Hoewyk, D.V.; et al. Molecular mechanisms of selenium tolerance and hyperaccumulation in Stanleya pinnata. Plant Physiol. 2010, 153, 1630–1652. [Google Scholar] [CrossRef]
  58. Hsieh, L.C.; Lin, S.I.; Kuo, H.F.; Chiou, T.J. Uncovering small RNA-mediated responses to phosphate deficiency in Arabidopsis by deep sequencing. Plant Physiol. 2009, 151, 2120. [Google Scholar] [CrossRef]
  59. Han, L.H.; Liu, C.; Zhao, M.Y.; Hu, L.J.; Hu, Y.S. Genomic identification and characterization analysis of the phosphate transporter protein 1 family gene in pineapple. Guihaia 2021, 41, 1955–1963. [Google Scholar] [CrossRef]
  60. Byrne, S.L.; Durandeau, K.; Nagy, I.; Barth, S. Identification of ABC transporters from Lolium perenne L. that are regulated by toxic levels of selenium. Planta 2010, 231, 901–911. [Google Scholar] [CrossRef]
  61. Ren, H.; Li, X.M.; Guo, L.; Wang, L.; Hao, X.Y.; Zeng, J.M. Integrative transcriptome and proteome analysis reveals the absorption and metabolism of selenium in tea plants [Camellia sinensis (L.) O. Kuntze]. Front. Plant Sci. 2022, 13, 848349. [Google Scholar] [CrossRef]
  62. Zhang, L.H.; Hu, B.; Deng, K.; Gao, X.K.; Sun, G.X.; Zhang, Z.L.; Li, P.; Wang, W.; Li, H.; Zhang, Z.H.; et al. NRT1.1B improves selenium concentrations in rice grains by facilitating selenomethinone translocation. Plant Biotechnol. J. 2019, 17, 1058–1068. [Google Scholar] [CrossRef]
  63. Li, Q.B.; Li, L.; Hu, C.X.; Tan, Q.L.; Sun, X.C. Metabolism response and molybdenum tolerance mechanism of winter wheat to excess molybdenum stress. J. Huazhong Agric. Univ. 2021, 40, 54–61. [Google Scholar] [CrossRef]
  64. Tian, M.; Xu, X.Y.; Liu, F.X.; Fan, X.; Pan, S.Y. Untargeted metabolomics reveals predominant alterations in primary metabolites of broccoli sprouts in response to pre-harvest selenium treatment. Food Res. Int. 2018, 111, 205–211. [Google Scholar] [CrossRef]
  65. Duan, N. Growth and Physiological and Transcriptomic Studies in Response to Nitrogen Addition and Drought Stressin Nitraria tangutorum. 2019. Available online: https://kns.cnki.net/KCMS/detail/detail.aspx?dbname=CDFDLAST2020&filename=1019211118.nh (accessed on 6 June 2019).
  66. Li, H.F.; Zhao, F.J. Selenium uptake, translocation and speciation in wheat supplied with selenate or selenite. New Phytol. 2008, 178, 92–102. [Google Scholar] [CrossRef]
  67. Chao, D.Y.; Baraniecka, P.; Danku, J.; Koprivova, A.; Lahner, B.; Luo, H.B.; Yakubova, E.; Dilkes, B.; Kopriva, S.; Salt, D. Variation in sulfur and selenium accumulation is controlled by naturally occurring isoforms of the key sulfur assimilation enzyme adenosine 5′-phosphosulfate reductase 2 across the Arabidopsis species range. Plant Physiol. 2014, 163, 1593–1608. [Google Scholar] [CrossRef]
  68. Kopriva, J.K.; Malagoli, M.; Takahashi, H. Sulfur nutrition: Impacts on plant development, metabolism, and stress responses. J. Exp. Bot. 2019, 70, 4069–4073. [Google Scholar] [CrossRef]
  69. Chan, K.X.; Phua, S.Y.; Breusegem, F.V. Secondary sulfur metabolism in cellular signalling and oxidative stress responses. J. Exp. Bot. 2019, 70, 4237–4250. [Google Scholar] [CrossRef]
Figure 1. Total Se content in tea plant roots under different selenite treatments. Selenite treatments were 0.00 mmol·L−1 (T1), 0.05 mmol·L−1 (T2), respectively. The data were statistically analyzed using Microsoft office 2010 and SPSS 19.0, and multiple comparisons were performed using Duncan’s model, which was used to analyze the significance of differences between treatments. The value of T1 treatmentgroup is the average of the T1-1, T1-2, and T1-3 treatment group values, the value of T2 treatmentgroup is the average of the T2-1, T2-2, and T2-3 treatment group values. The total Se content of each treatment was shown in the Table S2. ## means significant difference at 0.01 level.
Horticulturae 09 01278 g001
Figure 2. Length distribution of known (a) and novel (b) miRNAs. The X-axis represents the length of miRNAs, while the Y-axis represents the number of miRNAs.
Horticulturae 09 01278 g002
Figure 3. The first nucleotide bias of the known (a) and novel (b) miRNAs in tea plant roots. The relative percentages of four nucleotides (A, U, C, G) are shown in different colors. The X-axis represents the sequence length, while the Y-axis represents the relative percentage of different nucleotides.
Horticulturae 09 01278 g003
Figure 4. Heatmap showing the differentially expressed miRNAs in the roots of tea plants under different selenite treatments. Transcript levels were normalized to separate corresponding levels using the TPM algorithm. Columns represent different samples, rows represent different miRNAs, and clustering is performed based on log10 (TPM + 1) values. High and low expression levels are colored red and green, respectively.
Horticulturae 09 01278 g004
Figure 5. Function classifications of GO terms of target genes of the differentially expressed miRNAs. The X-axis corresponds to the GO classification, the left side of the Y-axis indicates the percentage of genes of each term within the GO category, and the right side indicates the number of genes. This graph showed the gene enrichment of each secondary function of GO in the background of differentially expressed miRNA target genes and the background of all the genes, reflecting the status of each secondary function in the two backgrounds, and the secondary functions with obvious differences in the proportions indicated that the enrichment trend of differentially expressed miRNA target genes is different from that of all the genes.
Horticulturae 09 01278 g005
Figure 6. KEGG enrichment analysis of target genes of the differentially expressed miRNAs. The X-axis indicates the number of genes annotated to each KEGG pathway and their proportion to the total number of genes annotated on to that pathway, and the Y-axis indicates the names of the KEGG metabolic pathways.
Horticulturae 09 01278 g006
Figure 7. Scatterplot of KEGG pathway enrichment of target genes of the differentially expressed miRNAs. Each point in the figure represents a KEGG pathway, the pathway names are shown in the legend on the right. The horizontal coordinate corresponds to the enrichment factor, indicating the proportion of target genes of differentially expressed miRNAs annotated to a pathway to the total number of genes annotated to that pathway. Higher enrichment factor values indicate a more significant enrichment of target genes of differentially expressed miRNA in that pathway. The Y-axis corresponds to the −log10 (Q value), where the Q value corresponds to the p value after correction for multiple hypothesis testing. As a result, therefore, a higher −log10 (Q value) indicates a more reliable enrichment factor in the pathway.
Horticulturae 09 01278 g007
Figure 8. Validation of 3 miRNAs using qRT-PCR. Red lines represent the miRNA sequencing results and black bars respresent the qRT-PCR results.
Horticulturae 09 01278 g008
Table 1. Sequencing data from the 6 miRNA libraries.
SamplesRaw Data‘N’-Containing ReadsLength < 18Length > 30Clean-ReadsQ30 (%)
T1-118,596,150554,273,479629,88713,692,72998.86
T1-217,112,260405,855,775426,82310,829,62298.77
T1-320,020,521503,045,7241,440,68415,534,06398.73
T2-117,986,979442,127,4621,666,70314,192,77098.79
T2-218,063,864565,012,324837,10412,214,38098.86
T2-320,471,991424,127,683899,39715,444,86998.86
T1-1, T1-2, T1-3: control samples; T2-1, T2-2, T2-3: 0.05 mmol·L−1 selenite treated samples.
Table 2. Statistics of the known and novel miRNAs.
SamplesKnown miRNAsNovel miRNAsTotal
T1-1260164424
T1-2267187450
T1-3261189450
T2-1230153383
T2-2253163416
T2-3216158374
Total455203658
T1-1, T1-2, T1-3: control samples; T2-1, T2-2, T2-3: 0.05 mmol·L−1 selenite treated samples.
Table 3. The number of annotated differential miRNA target genes in different database.
TypeCOGGOKEGGKOGPfamSwissprotEggNOGNr
T1 vs. T2914100386611071836178820942162
Disclaimer/Publisher’s Note: The statements, opinions and data contained in all publications are solely those of the individual author(s) and contributor(s) and not of MDPI and/or the editor(s). MDPI and/or the editor(s) disclaim responsibility for any injury to people or property resulting from any ideas, methods, instructions or products referred to in the content.

