Article

Comprehensive Transcriptome and Metabolome Characterization of Peony ‘Coral Sunset’ Petals Provides Insights into the Mechanism of Pigment Degradation

Horticultural Research Institute, Henan Academy of Agricultural Sciences, Zhengzhou 450002, China
*
Author to whom correspondence should be addressed.
Horticulturae 2023, 9(12), 1295; https://doi.org/10.3390/horticulturae9121295
Submission received: 4 November 2023 / Revised: 24 November 2023 / Accepted: 29 November 2023 / Published: 30 November 2023
(This article belongs to the Section Genetics, Genomics, Breeding, and Biotechnology (G2B2))

Abstract

:
The petals of Paeonia lactiflora ‘Coral Sunset’ change color from coral pink to pale yellow after flower opening. Pigment-targeted metabolomic analysis showed that the carotenoid and anthocyanin contents rapidly decreased after petal fading. SMART-sequencing and next-generation-sequencing analyses were performed to identify differentially expressed transcripts to characterize the candidate genes involved in petal fading. The expression of certain genes associated with anthocyanin and carotenoid synthesis and degradation was correlated with the petal-fading phenotype. The anthocyanin synthesis (AS) structural genes, CHS, F3H, F3′H, DFR, and ANS, and the carotenoid synthesis genes, LCYB and LCYE, were strongly expressed before fading, but their expression significantly declined after fading. In contrast, the expression of certain genes associated with oxidase activity and light signaling significantly increased after fading. Therefore, inhibition of pigment synthesis and accelerated pigment degradation may be crucial for petal fading. A R2R3-MYB family member of subgroup 4 (MYBs-SG4) showed the same expression pattern as the AS structural genes and functioned in the positive regulation of anthocyanin synthesis by forming the MBW protein complex. This is the first report of a SG4 member with a positive regulatory function. This study provides a foundation for elucidation of the mechanisms of pigment synthesis and metabolism, and a theoretical basis for flower-color-directed breeding.

1. Introduction

Paeonia lactiflora, a perennial herbaceous plant, is widely cultivated around the world on account of its bright floral colors and variety of floral forms and is especially favored as a garden ornamental and cut flower. Flower pigmentation is an extremely important focus of molecular genetic research on ornamental plants. P. lactiflora ‘Coral Sunset’ was raised by Samuel Wissing by crossing P. officinalis ‘Otto Froebel’ and P. lactiflora ‘Minnie Shaylor’ in 1965 and won the APS Gold Award in 2003 (https://www.americanpeonysociety.org, accessed on 15 May 2023). ‘Coral Sunset’ is popular as a cut flower because of its characteristic fading of the petals. The floral pigmentation of this cultivar changes from coral pink to light yellow during blooming, which enhances its ornamental value. The main aim of the present study was to examine the mechanism for the change in floral pigmentation and provide a theoretical basis for targeted molecular breeding of flower color.
Flower coloration is associated with the composition and content of pigments, physical and chemical properties, vacuole pH, and petal epidermal cell shape [1,2,3]. Based on differences in the chemical structure, pigments are divided into three main classes: flavonoids, carotenoids, and betalains. Flavonoids and carotenoids are the most widely distributed pigments in the plant kingdom, whereas betalains are only known in certain members of the Caryophyllales [4,5]. In recent years, details of the biosynthesis and regulatory pathways of pigments have been elaborated, and our understanding of their functional patterns has continued to expand [6,7,8]. Flavonoids, including anthocyanins, represent a large group of plant secondary metabolites and their synthesis is dependent on a suite of structural genes, such as PAL (phenylalanine ammonia lyase), C4H (cinnamate 4-hydroxylase), 4CL (4-coumaroyl-CoA ligase), CHS (chalcone synthase), CHI (chalcone isomerase), F3H (flavanone 3-hydroxylase), F3’H (flavonoid 3′-hydroxylase), F3’5’H (flavonoid 3′,5′-hydroxylase), DFR (dihydroflavonol 4-reductase), ANS (anthocyanidin synthase), and UFGT (UDP-glucosyl transferase) [6,9]. Expression of these structural genes is coordinately regulated by the MBW transcriptional complex, which is composed of three types of proteins: R2R3-MYB, basic helix-loop-helix (bHLH), and WD-repeat proteins [10]. The R2R3-MYB family members belonging to subgroups SG5, SG6, and SG20 are crucial elements in the MBW complex that determine upregulation of flavonoid biosynthesis [11,12], whereas SG4 members are negative regulatory factors of the MBW complex and can repress anthocyanin synthesis [13,14]. In contrast to anthocyanin biosynthesis, the mechanisms of anthocyanin degradation have been much less studied and are less well understood, although accumulating evidence supports in planta degradation of anthocyanins [15,16,17,18]. Anthocyanin degradation has mainly been investigated in fruits. In grape, polyphenol oxidase and peroxidase are involved in the degradation of anthocyanins, leading to changes in fruit color [19,20]. Luo et al., determined that a laccase (ADE/LAC) was responsible for anthocyanin degradation during litchi pericarp browning [21]. In flowers of Brunfelsia calycina, a basic class III peroxidase, BcPrx01, is responsible for the degradation of anthocyanins [22]. Interestingly, in petunia, mutation of a R2R3-MYB SG20 member, ph4, results in a distinct corolla color-fading phenotype [18,23]. These results imply that a shift toward degradation occurs during fading, which may be caused by downregulation of anthocyanin biosynthesis, leading to a decrease in anthocyanin contents and, ultimately, their disappearance.
Carotenoids are a class of lipid-soluble pigments that are mainly synthesized in the plastids [1]. The genes involved in carotenoid synthesis include PSY, PDS, Z-ISO, ZDS, LCYB, LCYE, and CHYB [24]. The expression of genes associated with carotenoid synthesis is primarily responsible for the coloration of some plant tissues. Changes in the expression of certain metabolic genes, such as carotenoid cleavage dioxygenase (CCD) or 9-cis-epoxycarotenoid dioxygenase (NCED), may also play a role in the accumulation of carotenoids [25,26,27]. Similar to the regulatory mechanism for flavonoids, the regulatory factors, especially those in the light-signaling pathway, are also involved in the regulation of carotenoid biosynthesis or metabolism [7,28,29,30,31]. Therefore, the significant up- or down-regulation of the regulatory factors accords with the elevated expression level of structural genes and flavonoid/carotenoid contents, and vice versa.
The present study aims to examine the mechanism of petal fading of peony ‘Coral Sunset’ and reveal the dynamic changes of pigments and the gene expression pattern in this progress. A full-length transcriptome analysis was performed with the combined petals at four stages of floral development. To identify differentially expressed transcripts associated with pigment degradation, we then performed high-throughput sequencing of the second-generation transcriptome of petals before and after fading. Recently, the strategy of combining SMART-seq and Illumina RNA-seq has been applied to generate comprehensive information at the transcriptional level, which has been successfully applied in many species. The transcriptome data provided the full-length sequence and gene subtypes of the transcripts, which shed light on the expression patterns and structure of the transcripts during flowering [32]. Transcripts involved in anthocyanin synthesis, carotenoid synthesis, oxidase activity, and light signal transduction were associated with petal fading. In addition, MYBs-SG4, a member of the R2R3-MYB family, played a role in the pigmentation of the petals. This study provides valuable data for exploration of the molecular mechanism of floral pigment synthesis and degradation during flowering. Moreover, it provides important information for targeted breeding of flower color in the future.

2. Materials and Methods

2.1. Plant Material

Five-year-old transplants of Paeonia lactiflora ‘Coral Sunset’ were planted outdoors in the ground in an open site at the experimental station of the Henan Academy of Agricultural Sciences (Xinxiang, China, latitude 35.303004, longitude 113.926800, altitude 58.1 m). During the flowering period in mid-April, petals were sampled at four developmental stages (S1 to S4) (Figure 1a), ranging from flower opening to fully faded petals, ground in liquid nitrogen to powder, and stored at −80 °C until use.

2.2. Identification of Petal Pigments

For pigment layering, 50 mg of the powdered petal sample was placed in a 2 mL centrifuge tube containing 600 μL of methanol, 100 μL of purified water, and 700 μL of dichloromethane, thoroughly shaken, and mixed. The mixed samples were centrifuged at 13,400× g for 30 s to stratify the solution. Based on differences in the dissolution of different pigment types, the upper layer contained flavonoids soluble in water and methanol, whereas the lower layer contained carotenoids or chlorophyll soluble in dichloromethane.
Determination of the carotenoid, flavonoid, and anthocyanin/anthocyanidin composition was conducted by Metware Biotechnology Co., Ltd. (Wuhan, China). For carotenoid determination, 50 mg of powder was extracted with 0.5 mL of N-hexane:acetone:ethanol (1:1:1, v/v/v). The extract was vortexed at room temperature for 20 min, then centrifuged at 13,400× g for 5 min. The supernatant was collected and evaporated to dryness, and then resuspended in methanol:methyl tert-butyl ether solution (1:1, v/v). The supernatant of the carotenoid extraction was filtered through a 0.22 μm membrane filter for subsequent liquid chromatography–tandem mass spectrometry (LC-MS/MS) analysis. The filtered extracts were analyzed using a UPLC-APCI-MS/MS system (UPLC, ExionLC™ AD; MS, Applied Biosystems 6500 Triple Quadrupole). The analytical conditions were as follows: LC column, YMC C30 (3 μm, 100 mm × 2.0 mm i.d.); solvent system, methanol:acetonitrile (1:3, v/v) with 0.01% BHT and 0.1% formic acid (A), methyl tert-butyl ether with 0.01% BHT (B); gradient program, started at 0% B (0–3 min), increased to 70% B (3–5 min), then increased to 95% B (5–9 min), and finally ramped back to 0% B (10–11 min); flow rate, 0.8 mL/min; temperature, 28 °C; injection volume, 2 μL. Linear ion trap (LIT) and triple quadrupole (QQQ) scans were acquired on a triple quadrupole-linear ion trap mass spectrometer (QTRAP), QTRAP® 6500+ LC-MS/MS System, equipped with an APCI Heated Nebulizer, operating in positive ion mode and controlled by Analyst 1.6.3 software (Sciex, Shanghai, China). The APCI source operation parameters were as follows: ion source, APCI+; source temperature, 350 °C; curtain gas (CUR), set at 25.0 psi. Carotenoids were analyzed using scheduled multiple-reaction monitoring (MRM). Data acquisitions were performed using Analyst 1.6.3 software (Sciex). Multiquant 3.0.3 software (Sciex) was used to quantify all metabolites. Mass spectrometer parameters, including the de-clustering potentials (DP) and collision energies (CE), for individual MRM transitions were performed with further DP and CE optimization. A specific set of MRM transitions was monitored for each period according to the metabolites eluted within this period.
For flavonoid extraction, 20 mg of powder was extracted with 0.5 mL of 70% methanol. The internal standard (10 μL of a 4000 nmol/L solution, MedChemExpress, Shanghai, China) was added to the extract. The extract was sonicated for 30 min and centrifuged at 12,000× g at 4 °C for 5 min. The supernatant was then filtered through a 0.22 μm membrane for LC-MS/MS analysis. The UPLC analytical conditions were as follows: UPLC column, Waters ACQUITY UPLC HSS T3 C18 (1.8 µm, 100 mm × 2.1 mm i.d.), and solvent system, water with 0.05% formic acid (A) and acetonitrile with 0.05% formic acid (B). The gradient elution program was set as follows: 0–1 min, 10–20% B; 1–9 min, 20–70% B; 9–12.5 min, 70–95% B, 12.5–13.5 min, 95% B; 13.5–13.6 min, 95–10% B, 13.6–15 min, 10% B; flow rate, 0.35 mL/min; temperature, 40 °C; injection volume, 2 μL. Linear ion trap and triple quadrupole scans were also acquired on the QTRAP® 6500+ LC-MS/MS System, but equipped with an ESI Turbo Ion-Spray interface, operating in positive and negative ion modes. The ESI source operation parameters were as follows: ion source, ESI+/−; source temperature 550 °C; ion spray voltage (IS), 5500 V (positive) and −4500 V (negative); curtain gas (CUR), set at 35 psi, respectively. Flavonoid analysis and data acquisitions were as described for carotenoids.
For anthocyanin/anthocyanidin extraction, 50 mg of powder was extracted with 0.5 mL of methanol:water:hydrochloric acid (500:500:1, v/v/v). The extract was vortexed for 5 min, then ultrasonicated for 5 min, and centrifuged at 12,000× g at 4 °C for 3 min. The supernatant was filtered through a 0.22 μm membrane for LC-MS/MS analysis. UPLC conditions were as follows: Waters ACQUITY BEH C18 (1.7 µm, 2.1 mm × 100 mm); solvent system, water (0.1% formic acid):methanol (0.1% formic acid); gradient program, 95:5 v/v at 0 min, 50:50 v/v at 6 min, 5:95 v/v at 12 min, hold for 2 min, 95:5 v/v at 14 min, hold for 2 min; flow rate, 0.35 mL/min; temperature, 40 °C; injection volume, 2 μL. The ESI-MS/MS conditions for anthocyanin/anthocyanin determination were similar to those used for flavonoids, except for the ESI Turbo Ion-Spray interface using the positive ion mode.

2.3. Illumina Sequencing

Transcriptome sequencing was conducted by Biomarker Technologies Co., Ltd. (Beijing, China). Total RNA was extracted from the peony petal samples at stages S1 to S4 using TRIzol Reagent (Invitrogen, Carlsbad, CA, USA) following the manufacturer’s protocol. Uniformly mixed samples at S1 to S4 were used for third-generation full-length transcriptome sequencing, whereas the S2 and S4 samples were used for comparative transcriptome sequencing. Poly(A) RNA was purified from 5 μg of total RNA using poly-T oligo-attached magnetic beads, using two rounds of purification. Following purification, the mRNAs were fragmented into small fragments using divalent cations under an elevated temperature. The cleaved RNA fragments were used for cDNA synthesis. The double-stranded cDNAs were purified using AMPure XP beads (Beckman Coulter Genomics, Danvers, MA, USA), subjected to end repair and adenylation, and then ligated to modified Illumina multiplex barcode adapters. The adaptor-ligated cDNAs were size-selected with AMPure XP beads and subjected to PCR amplification to enrich the adapter-ligated fragments, which were further purified using AMPure XP beads. The cDNA library quality was assessed with an Agilent Bioanalyzer 2100 system (Agilent Technologies, Santa Clara, CA, USA). Clustering of the index-coded samples was performed on a cBot Cluster Generation System using the HiSeq PE Cluster Kit v4 (Illumina, San Diego, CA, USA) following the manufacturer’s instructions. After cluster generation, the RNA libraries were sequenced using an Illumina HiSeq 4000 system.

2.4. Library Construction and SMART Sequencing

The SMARTer™ PCR cDNA Synthesis Kit (Clontech, Mountain View, CA, USA) was used to synthesize the full-length cDNA of mRNAs. The full-length cDNA was amplified by PCR, then repaired and connected to the SMART dumbbell adapter. The process of obtaining the full-length transcriptome comprised three steps: continuous sequence identification, isoform horizontal clustering to obtain consistent sequences, and consistent sequence polishing. The raw reads were processed into circular consensus reads based on the adaptor. Next, full-length, non-chimeric transcripts were determined by searching for the poly(A) tail signal and the 5′ and 3′ cDNA primers in the circular consensus reads. Clustering of similar full-length sequences was conducted, and each cluster was considered to represent a consistent sequence. The consistent sequences were corrected to obtain high-quality transcript sequences for subsequent analysis.

2.5. Structural Analysis of the Transcriptome

TransDecoder (https://github.com/TransDecoder/TransDecoder/releases, accessed on 15 May 2023) was used to identify candidate coding regions within transcript sequences. We used Iso-Seq™ data directly to perform an all-vs-all BLAST search with high identity settings. BLAST alignments that met all criteria were considered to be products of candidate AS events: there should be two high-scoring segment pairs (HSPs) in the alignment. The two HSPs have the same forward/reverse direction, within the same alignment—one sequence should be continuous, or with a small “Overlap” (smaller than 5 bp), whereas the other sequence should be distinct and show an “AS Gap”, and the continuous sequence should largely align with the distinct sequence. The AS Gap should be larger than 100 bp and at least 100 bp from the 3′ or 5′ end.

2.6. Coding RNA and Long Non-Coding RNA Analysis

Four computational approaches, comprising the coding potential calculator (CPC), coding–non-coding index (CNCI), coding potential assessment tool (CPAT), and the Pfam database, were combined to sort non-protein-coding RNA candidates from putative protein-coding RNAs among the transcripts [33,34,35,36]. Putative protein-coding RNAs were filtered out using a minimum length and exon number threshold. Transcripts with a length exceeding 200 nt and containing more than two exons were selected as long non-coding RNA (lncRNA) candidates, which were further screened using CPC/CNCI/CPAT/Pfam to distinguish protein-coding RNAs from non-coding RNAs.

2.7. Gene Functional Annotation

The raw RNA-Seq reads in fastq format were first processed using in-house Perl scripts. Clean data were obtained by removing reads containing the adapter, reads containing poly-N, and low-quality reads from the raw data. The Q20, Q30, GC content, and sequence duplication level of the clean data were calculated. All downstream analyses were based on the high-quality clean data. The clean reads were mapped to the PacBio reference genome sequence. Only reads with a perfect match or one mismatch against the reference genome were further analyzed and annotated. HISAT2 software was used to map the reads to the reference genome. Functional annotation of genes was based on the following databases: NR (NCBI non-redundant protein sequences, http://www.ncbi.nlm.nih.gov/, accessed on 15 May 2023), Pfam (Protein family, http://pfam.janelia.org/, accessed on 15 May 2023), KOG/COG/eggNOG (Clusters of Orthologous Groups of proteins, http://www.ncbi.nlm.nih.gov/COG/, accessed on 15 May 2023), Swiss-Prot (a manually annotated and reviewed protein sequence database, http://www.uniprot.org/, accessed on 15 May 2023), KEGG (Kyoto Encyclopedia of Genes and Genomes, http://www.genome.jp/kegg/, accessed on 15 May 2023), and GO (Gene Ontology, http://www.geneontology.org/, accessed on 15 May 2023).

2.8. Quantification of Gene Expression Levels and Analysis of Differentially Expressed Genes

Gene expression levels were estimated as fragments per kilobase of transcript per million fragments mapped (FPKM). Analysis of differentially expressed genes (DEGs) between two conditions/groups was performed using the DESeq, DESeq2, and edgeR methods [37,38,39]. The resulting p-values were adjusted using the Benjamini–Hochberg approach to control the false discovery rate. Genes with a false discovery rate < 0.01 and fold change ≥ 2 detected by DESeq were considered to be differentially expressed. A GO enrichment analysis was implemented using the GOseq R packages-based Wallenius non-central hyper-geometric distribution [40]. A KEGG pathways enrichment analysis was performed using the KOBAS software 2.0 [41]. The volcano plot, Venn diagrams, and heat map of gene expression were carried out on the cloud platform of Biomarker company (https://international.biocloud.net/zh/software/tools/list, accessed on 15 May 2023).

2.9. Quantitative Real-Time PCR Analysis

To determine the expression pattern of the genes of interest, the expression profiles of selected candidate genes at the S1–S4 stages were further analyzed using quantitative real-time PCR (qRT-PCR). The qRT-PCR experiments were performed using the SYBR Green PCR Master Mix Kit (Takara Bio, Shiga, Japan) with a Bio-Rad CFX Connect Real-Time PCR System (Bio-Rad, Hercules, CA, USA). Transcript abundance was calculated relative to the Tubulin gene using the 2−ΔΔCt method. The primers used for qRT-PCR are listed in Supplementary Table S1.

2.10. Phylogenetic and Amino Acid Analysis of the Flavonoid Regulatory R2R3-MYBs

Phylogenetic trees were constructed using the maximum likelihood method (http://www.phylogeny.fr/simple_phylogeny.cgi, accessed on 15 May 2023) based on multiple alignments of the predicted amino acid sequences of R2R3-MYB family members associated with flavonoid regulation. The relevant sequences from Arabidopsis and other plant species were downloaded from GenBank or specific genome databases and are referred to by their accession numbers. The amino acid sequence alignments were generated using Clustal Omega (https://www.ebi.ac.uk/Tools/msa/clustalo/, accessed on 15 May 2023) and visualized with the Multiple Align Show online tool (https://www.bioinformatics.org/sms/multi_align.html, accessed on 15 May 2023).

2.11. Yeast Two-Hybrid Assay

The coding fragment of MYBs-SG4 (F01_transcript_11254) from P. lactiflora ‘Coral Sunset’ was inserted into the pDONR207 (V96) vector (Thermo Fisher Scientific, Waltham, MA, USA) by the BP reaction to obtain the entry clone MYBs-SG4:V96 [42]. The entry clone was then used to construct the yeast two-hybrid vector MYBs-SG4:AD by the LR reaction. For the yeast two-hybrid assay, the MYBs-SG4:AD plasmid was first transformed into yeast strain AH109 using the lithium acetate method, and then transformants were screened on synthetic complete minus tryptophan (SC−Leu) culture medium for 2 days. The transformants were used for co-transformation of specific pairs of BD constructs of AN1-like (bHLH):BD and AN11-like (WD40):BD, and the double transformants were screened on SC−Leu/Trp medium for 2 days. The double transformants were further screened on selective SC−Leu/Trp/Ade/His medium supplemented with X-α-gal for 2–3 days as an indicator of protein interactions.

2.12. Transient Transformation and Expression Pattern Analysis of Anthocyanin Synthesis Structural Genes in Petunia Corolla

An overexpression construct was generated by the LR recombination reaction with the pK2GW vector (V137) and the entry clone MYBs-SG4:V96, and then introduced into Agrobacterium tumefaciens strain AGL1. Agrobacteria harboring the MYBs-SG4:137 construct were used for transient agroinfiltration transformation of the corolla of petunia ‘W59×axi’. In each transfection, 35S:AN2 was used as a positive control and the empty vector (EV) was used as a negative control. To verify the effect of the MYBs-SG4 gene on flavonoid synthesis, the expression patterns of anthocyanin synthesis structural genes, comprising CHSa, CHSj, F3H, F3′H, F3′5′H, DFR, ANS, and FLS, were analyzed. For qRT-PCR analysis, at least 10 agroinfiltrated corollas were ground to a thoroughly mixed fine powder, which was divided into 3 portions as replicates for RNA extraction and gene expression analysis. The primers used for qRT-PCR are listed in Supplementary Table S1.

2.13. Data Analysis

Quantitative data were analyzed using SPSS Statistics 25 and statistical comparisons were performed by one-way ANOVA, followed by the Tukey test.

3. Results

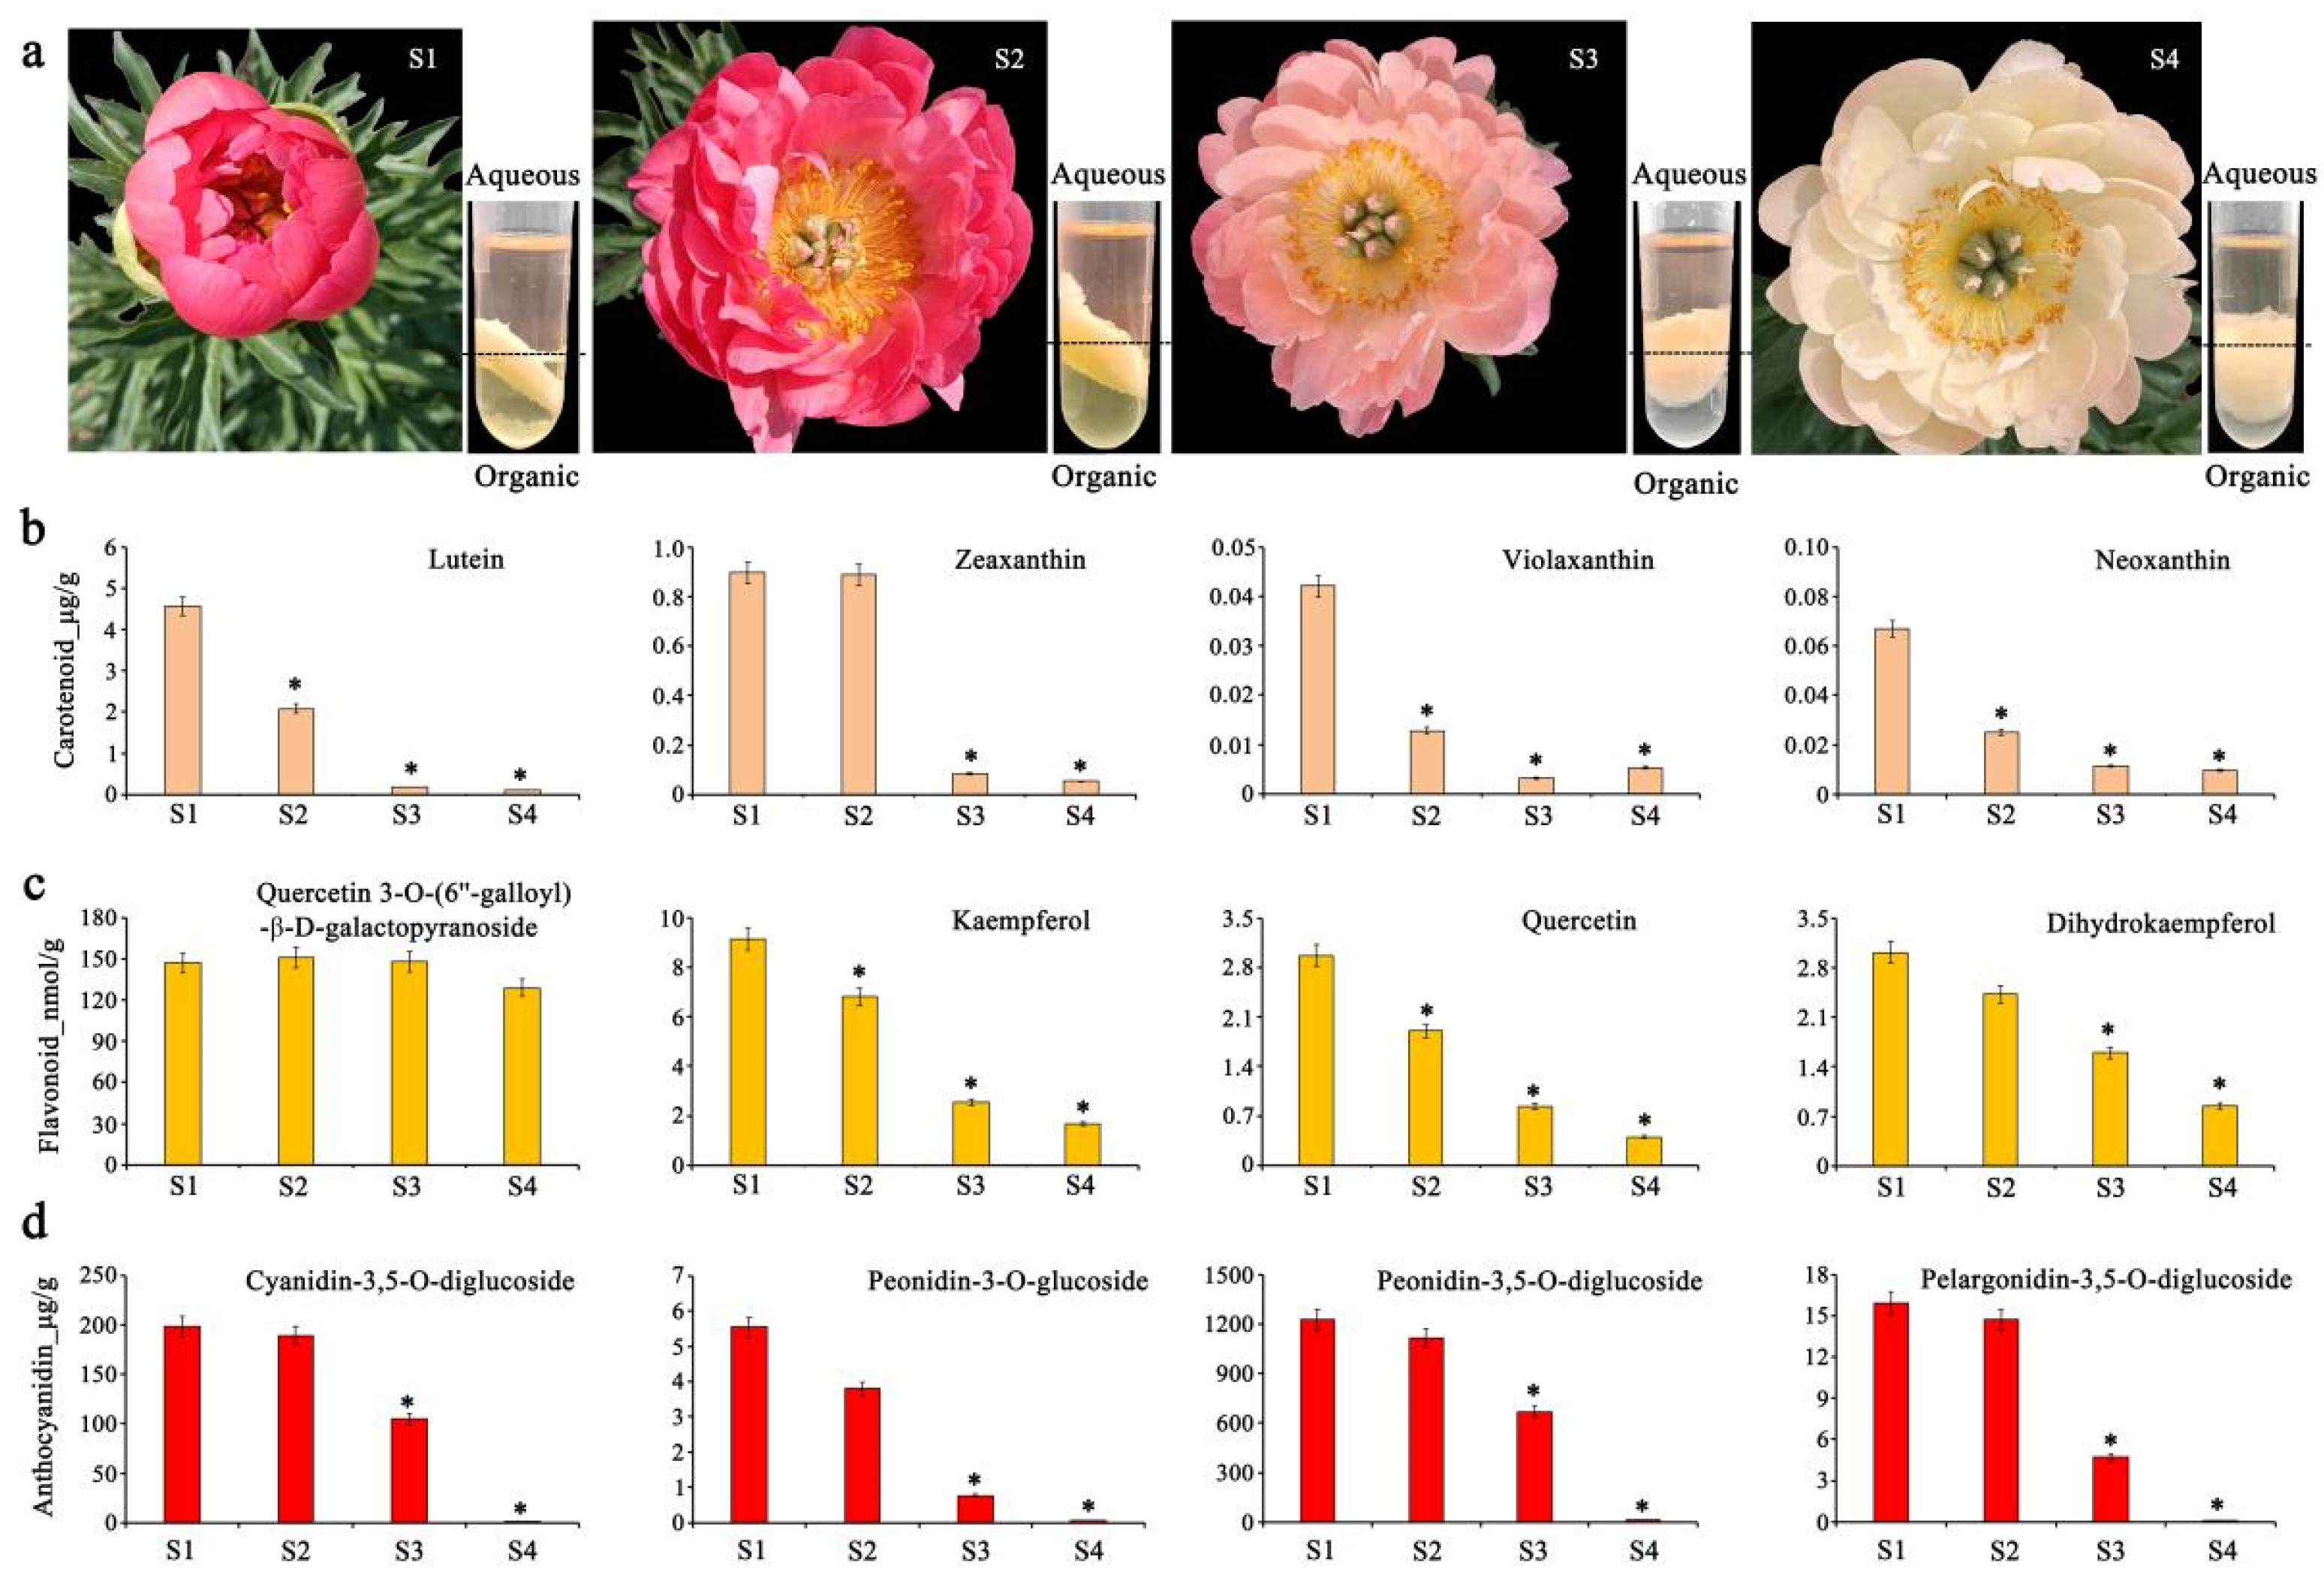
3.1. Pigment Composition and Changes in Paeonia lactiflora ‘Coral Sunset’ Petals

As the flowers of P. lactiflora ‘Coral Sunset’ aged, the color of the petals gradually changed from red to light yellow. Stratification of pigment components in the petals at four developmental stages indicated that, at all stages, the petals contained yellow and green pigment components (carotenoids and chlorophyll) and red pigment components (flavonoids). The carotenoids and chlorophyll were soluble in dichloromethane, whereas the flavonoids were water-soluble. Similar to the pigmentation process in the petals, the accumulation of pigments in both aqueous and organic liquids became increasingly shallow (Figure 1a).
A total of 32 types of carotenoid components, 82 types of flavonoids, and 68 types of anthocyanidins were identified in the pigment extracts (Tables S2–S4). Carotenoids and flavonoids mainly affect the yellow coloration, whereas anthocyanidins mainly result in red coloration, which together determine the overall color of the peony petals. The carotenoids mainly comprised lutein, zeaxanthin, violaxanthin, and neoxanthin and, overall, all compounds showed a downward trend with petal aging. For example, the contents of lutein decreased from 4.56 μg/g to 0.11 μg/g, zeaxanthin decreased from 0.89 μg/g to 0.05 μg/g, violaxanthin decreased from 0.04 μg/g to 0.005 μg/g, and neoxanthin decreased from 0.07 μg/g to 0.016 μg/g (Figure 1b, Table S2). The most abundant flavonoids were hyperoside and quercetin 3-O-(6′′-galloyl)-β-D-galactopyranoside, which were unchanged at the different stages of petal development (Table S3). The contents of kaempferol, quercetin, and dihydrokaempferol, which are crucial components in the flavonoid synthesis pathway, peaked at 9.13, 2.96, and 3.01 μg/g, respectively, at the S1 stage. The contents of these compounds gradually decreased with petal aging to 1.66, 0.39, and 0.84 μg/g at the S4 stage (Figure 1c). The anthocyanin substances detected in the petals mainly comprised glycosylated anthocyanins (Table S4). Among them, the content of cyanidin-3,5-O-diglucoside, peonidin-3-O-glucoside, peonidin-3,5-O-diglucoside, and pelargonidin-3,5-O-diglucoside gradually decreased from 198.26, 5.54, 1227.62, and 15.92 μg/g, respectively, at stage S1, to 1.59, 0.07, 12.46, and 0.04 μg/g, respectively, at stage S4 (Figure 1d).

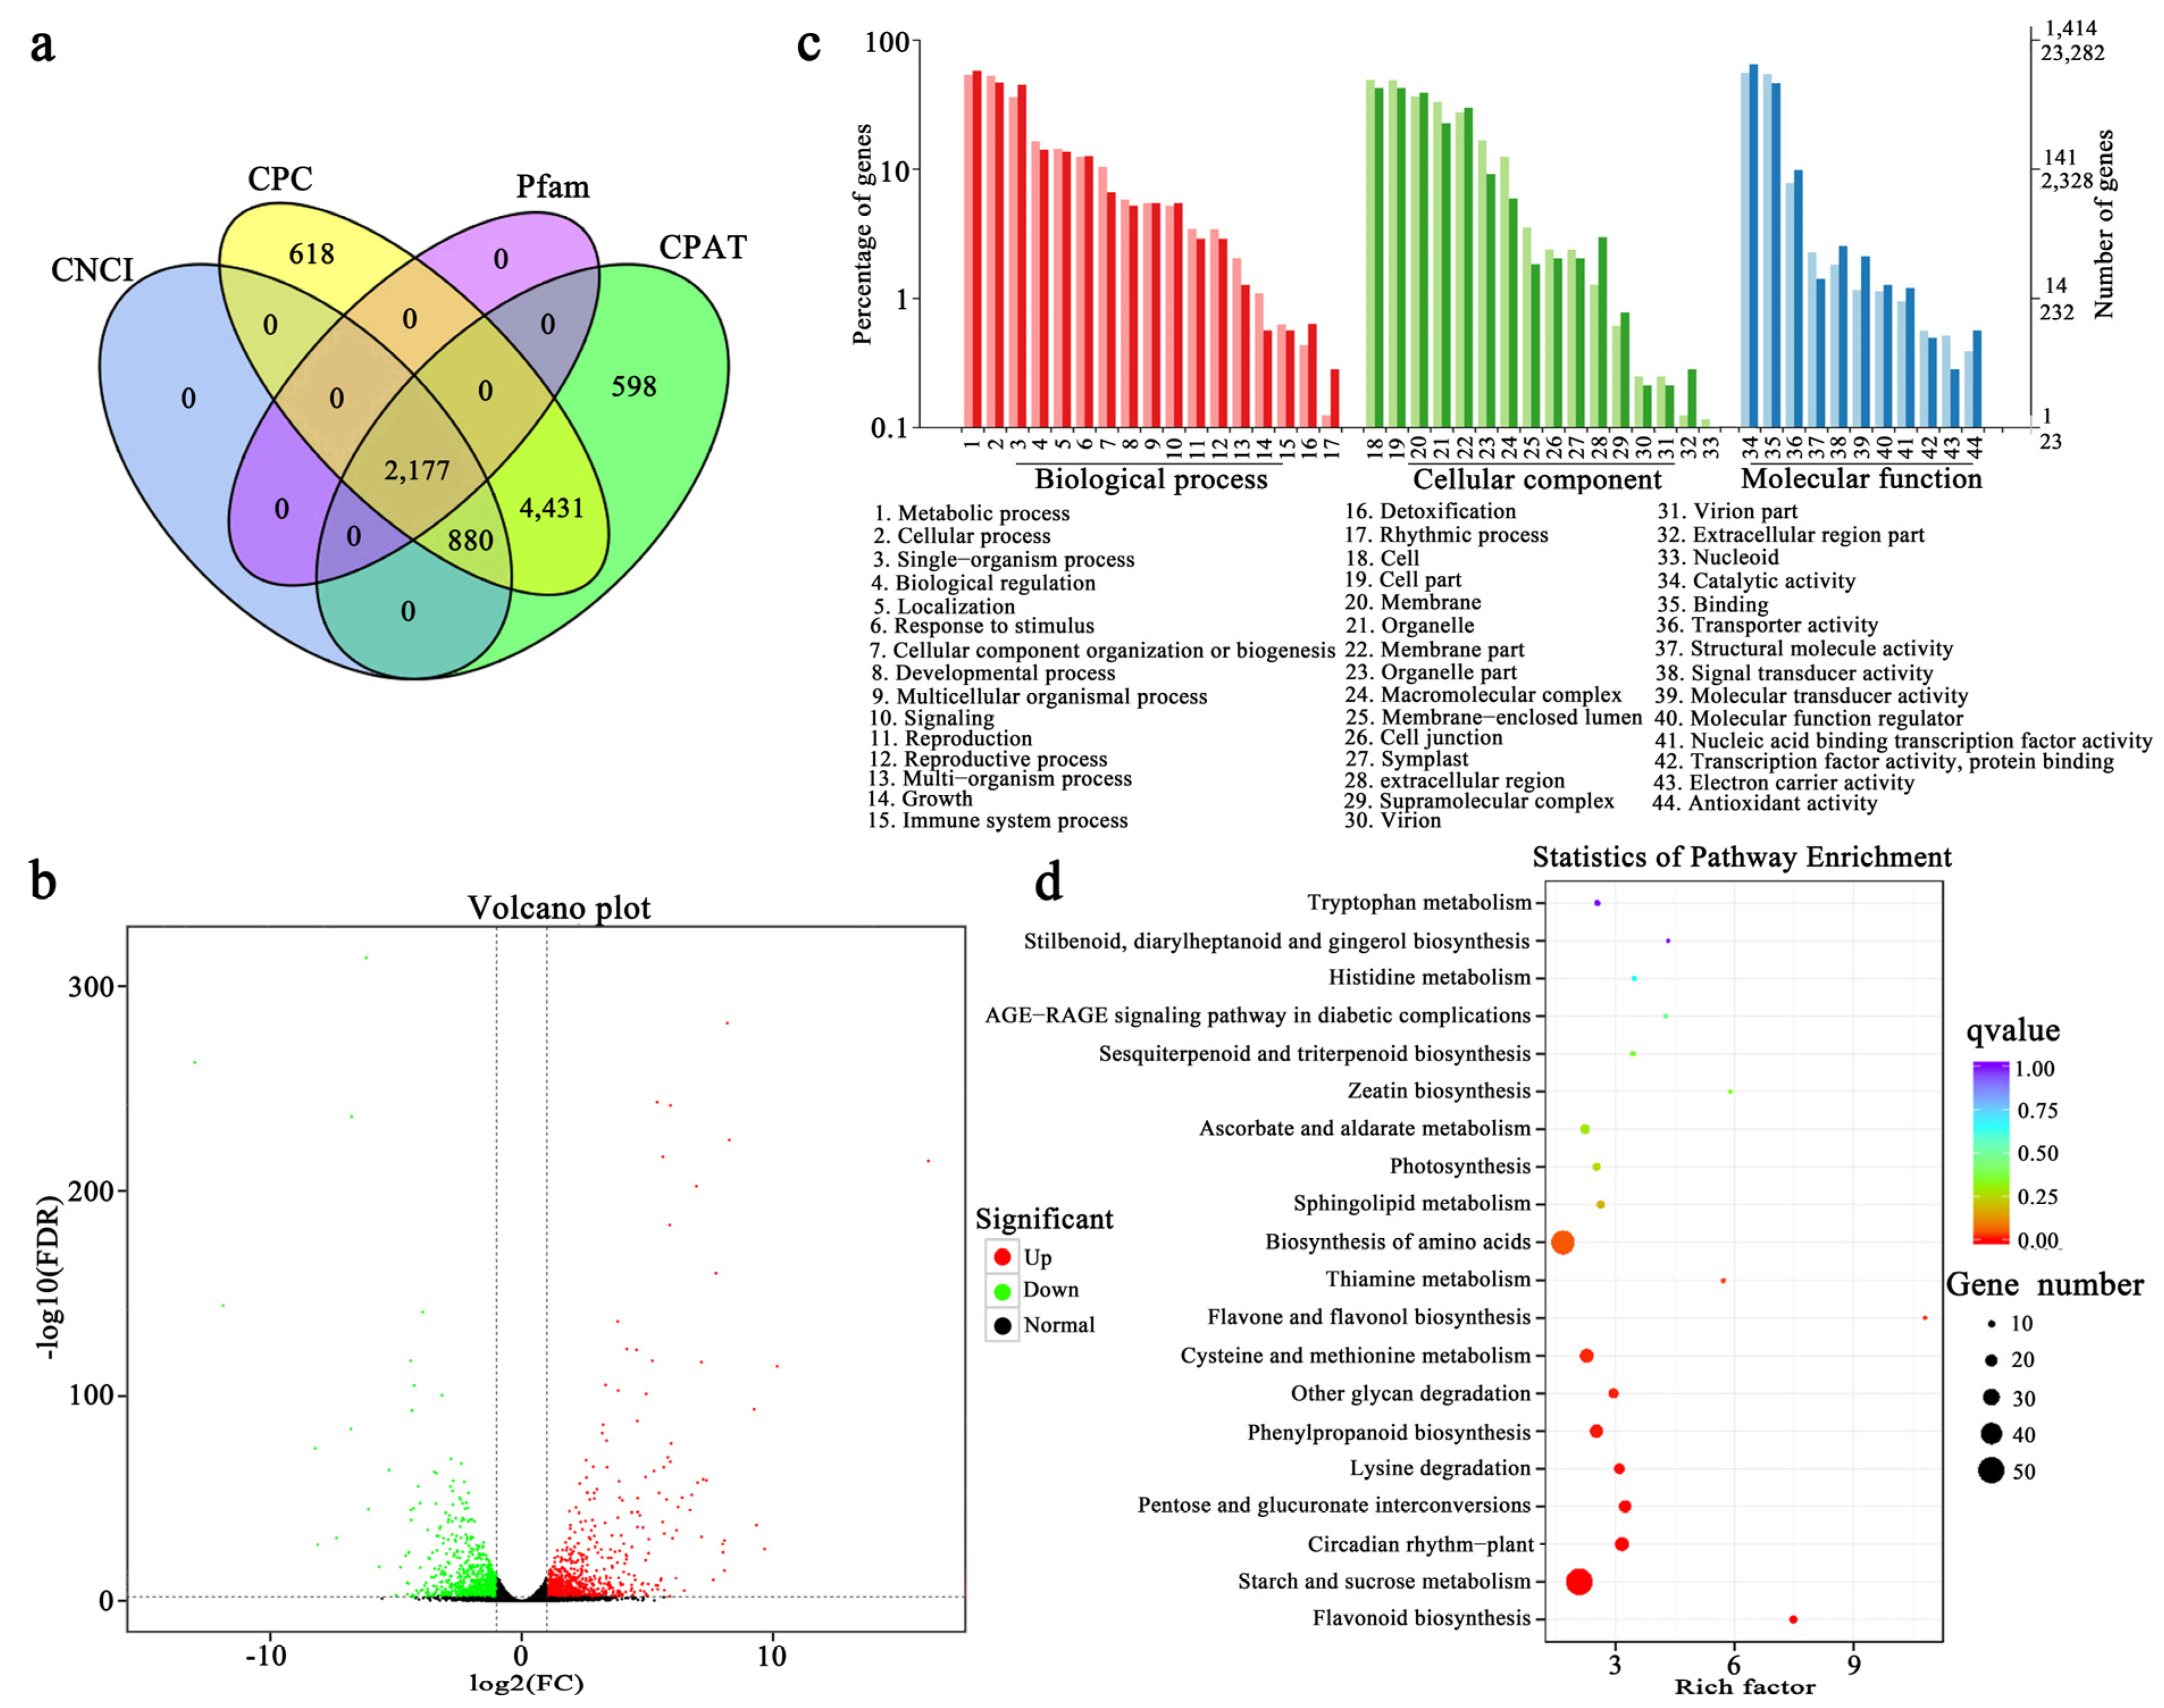
3.2. RNA-Seq and Analysis of DEGs in Paeonia lactiflora ‘Coral Sunset’ Petals

To investigate the molecular mechanism underlying the color changes in P. lactiflora ‘Coral Sunset’ petals, we used the mixed petal samples for SMART sequencing to obtain accurate full-length transcripts. The transcripts before and after fading (stage S2 vs. S4) were compared and analyzed using the second-generation transcriptome. Approximately 92.13 million clean reads and 35,728 non-redundant transcript sequences were obtained. BLAST (version 2.2.26) was used to compare the transcript sequences with the NR, SwissProt, GO, COG, KOG, Pfam, KEGG, and eggNOG databases to obtain annotation information for the transcripts. A total of 33,403 transcripts were annotated (Table 1). The greatest number of isoforms were annotated from the NR database (33,268; 99.60%), followed by EggNOG (32,634; 97.70%), Pfam (26,084; 78.09%), SwissProt (24,900; 74.54%), GO (23,282; 69.70%), KOG (22,574; 67.58%), and KEGG (14,960; 44.79%), and the fewest were from COG (14,040; 42.03%).
Four coding-potential analytical resources, namely, CPC, CNCI, Pfam, and CPAT, were used to predict lncRNAs among the novel transcripts. A total of 2177 lncRNAs were predicted (Figure 2a). Based on the analysis of the RNA-seq data for petals at the S2 and S4 stages, 1918 DEGs were determined. Among these DEGs, 1002 were upregulated and 916 were downregulated (Figure 2b). Combining the 1918 significant DEGs with the 33,403 unigenes, 1806 unigenes had functional annotations. Among the annotated unigenes, 1414 unigenes were annotated with GO terms and 809 unigenes with KEGG pathways. With regard to the GO analysis, in the biological process category, the unigenes were most frequently annotated with the metabolic process (819), cellular process (664), and single-organism process (637). In the cellular component category, cell part (602), membrane (551), and organelle (322) were most frequent. Correlation analysis of these unigenes with significant DEGs revealed that multiple genes associated with peroxidase (GO: 0004601, 6/56), carbon−oxygen lyase (GO: 0004553, 47/517), and photosystem (GO: 0009521, 9/77) were upregulated (Figures S1–S4). In the molecular function category, catalytic activity (922), binding (657), and transporter activity (139) were the most frequent terms (Figure 2c). Among the 809 unigenes annotated with KEGG pathways, the following pathways were the most highly enriched: flavone and flavonol biosynthesis, flavonoid biosynthesis, zeatin biosynthesis, thiamine metabolism, and circadian rhythm (Figure 2d). Thus, the combined GO and KEGG analyses indicated that a decrease in pigment synthesis and accelerated pigment decomposition may be the main reasons for the fading of peony petals.

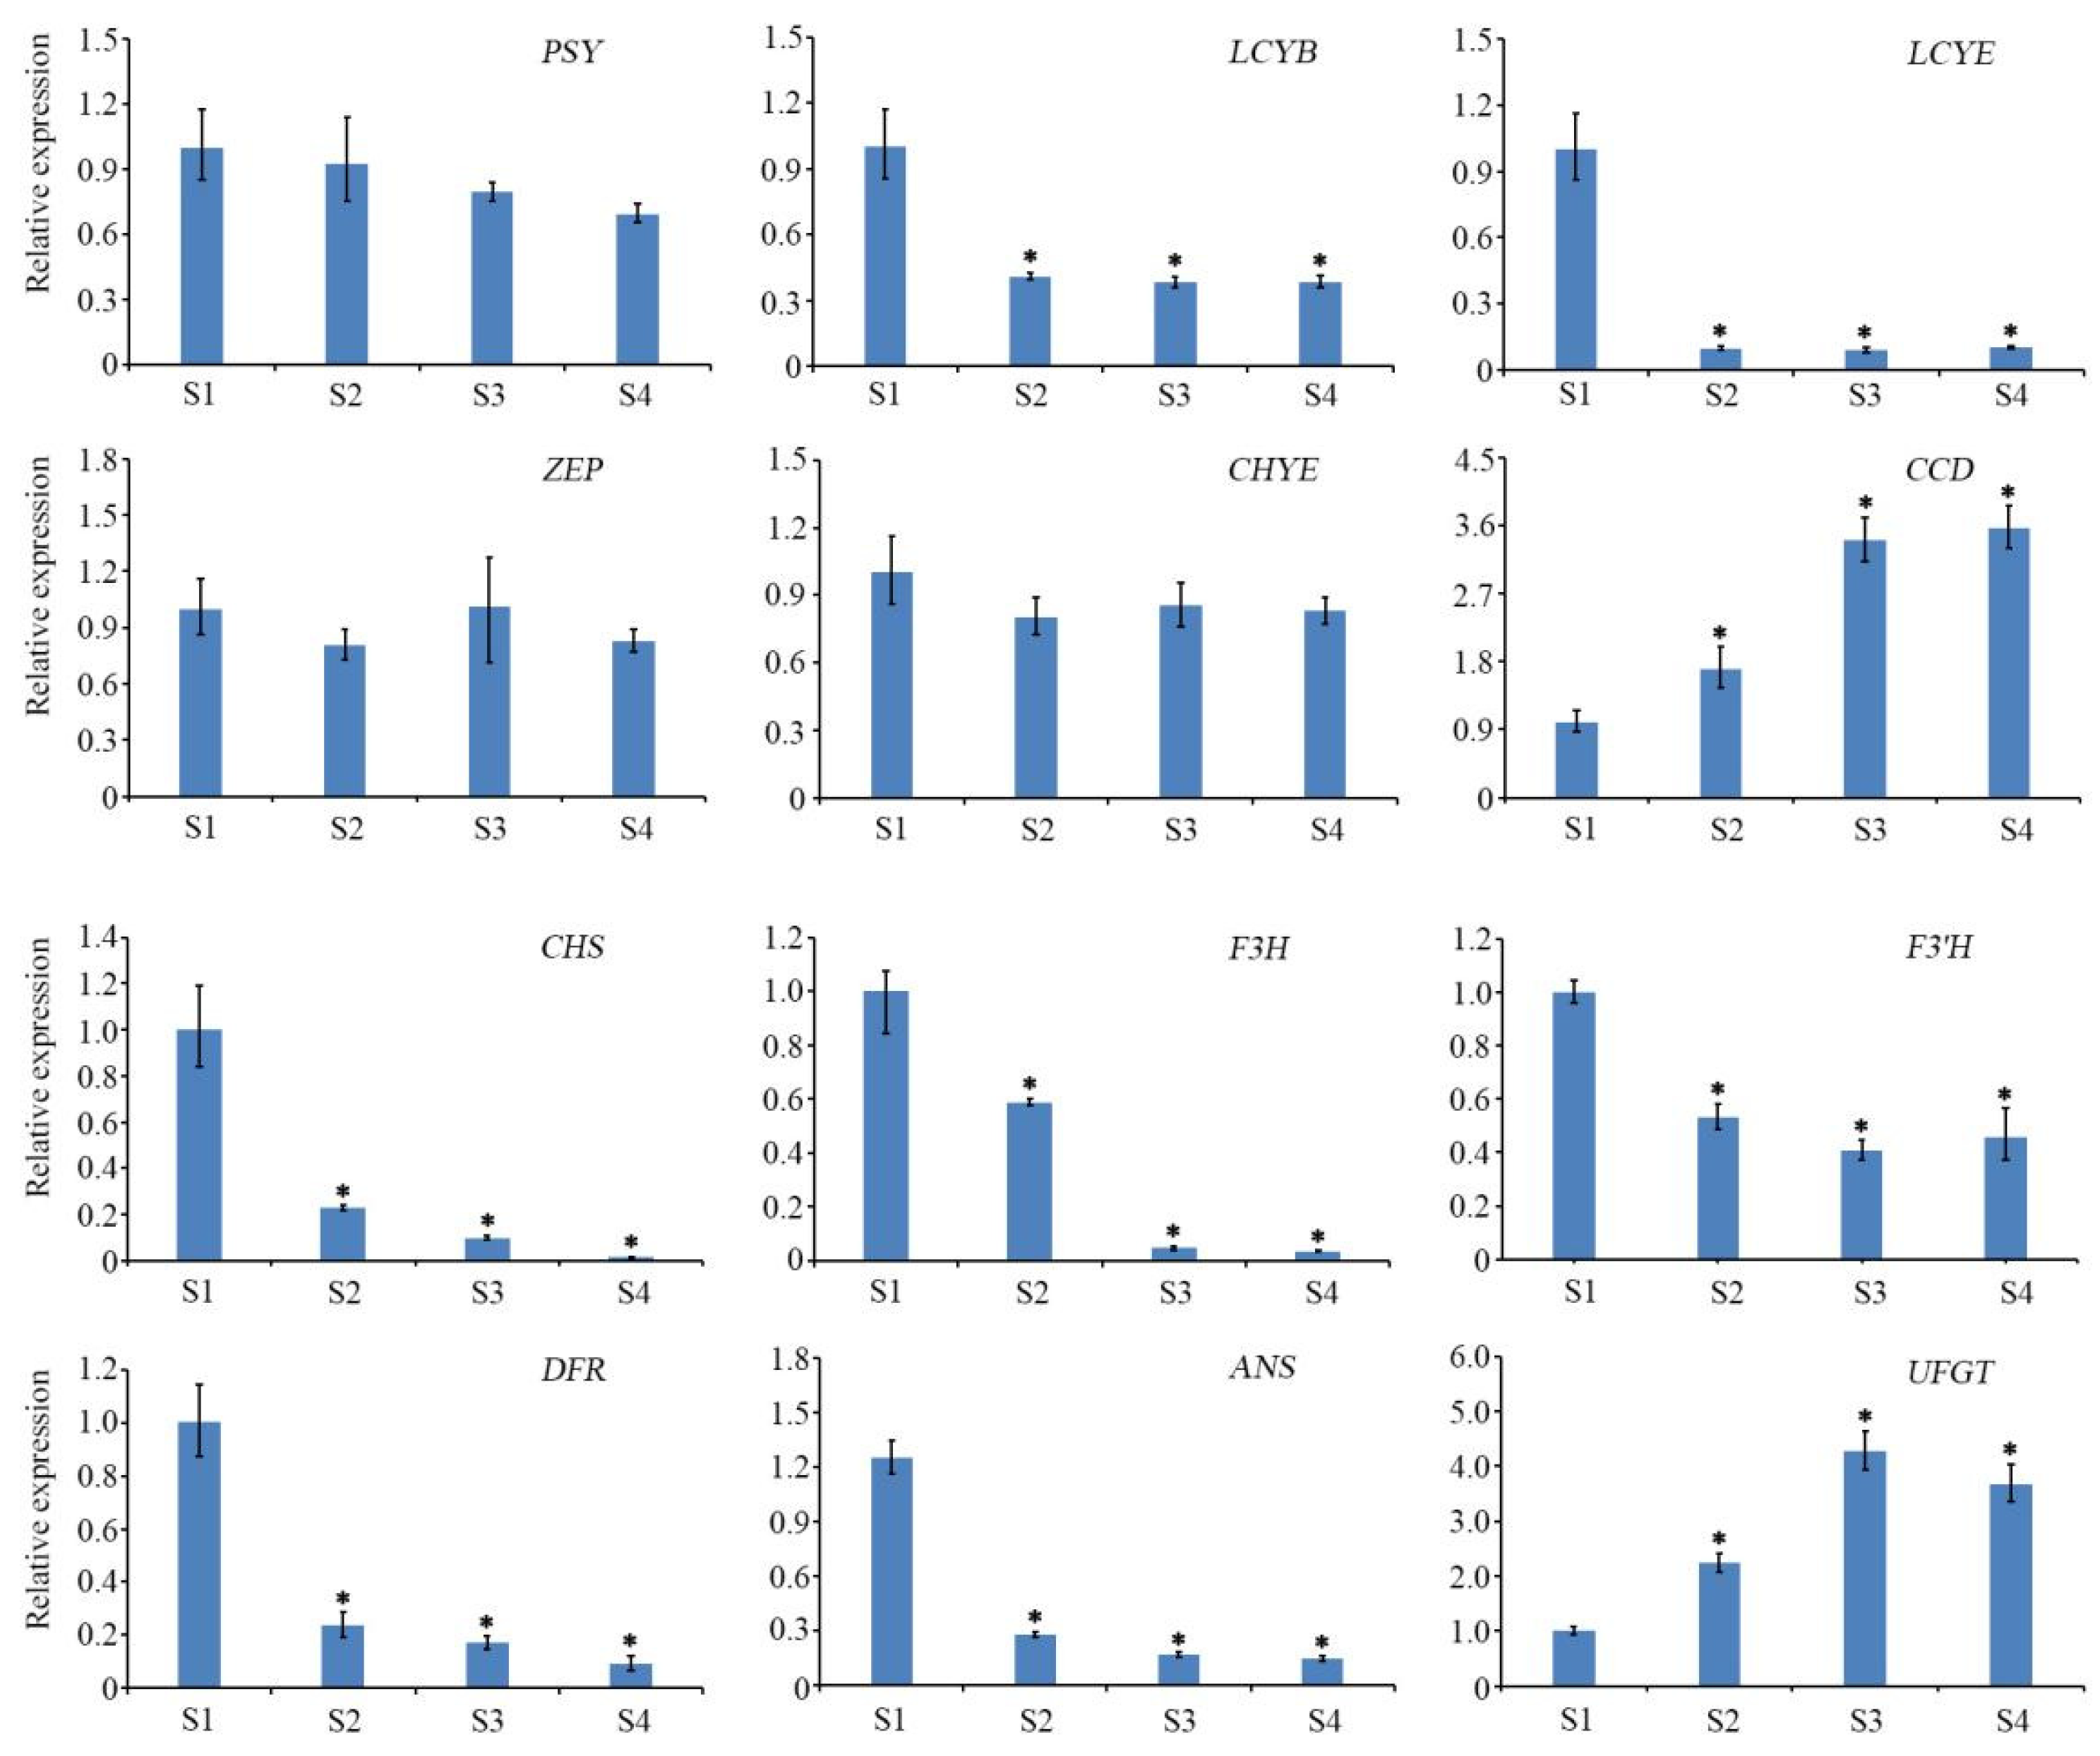
3.3. Pigment Synthesis Structural Genes Determined the Petal Coloration of Paeonia lactiflora ‘Coral Sunset’

We analyzed the expression characteristics of pigment synthesis-related unigenes in peony petals at stages S2 and S4. Carotenoids are a class of lipid-soluble terpenoids synthesized through a series of structural genes. In this synthesis pathway, the expression levels of certain crucial genes determine the final composition and content of carotenoids. Analysis of the expression characteristics of carotenoid synthesis pathway-related genes in peony petals at stages S2 and S4 revealed that PSY (F01_transcript_43718, F01_transcript_46363, and F01_transcript_33709) and PDS (F01_transcript_29157, F01_transcript_29813, and F01_transcript_9037) both comprised three transcripts, ZDS (F01_transcript_8987 and F01_transcript_8842) consisted of two transcripts, and no significant differential expression between the two groups of samples was detected. In addition, no significant difference in the expression levels of CRTISO (F01_transcript_32573) and LCYB (F01_transcript_17105) was detected between the two groups of samples, and the transcript abundance of both genes was relatively low. Among genes associated with carotenoid metabolism, NCED and CCD (F01_transcript_39000, F01_transcript_9707, F01_transcript_34876, and F01_transcript_9365) were significantly downregulated (Figure 3a).
Flavonoids are water-soluble pigments, and their synthesis is catalyzed by a series of structural genes. Based on the DEGs analysis, the anthocyanin synthesis structural genes PAL (F01_transcript_8671, F01_transcript_8715, F01_transcript_43656, and F01_transcript_8669), 4CL (F01_transcript_18822), CHS (F01_transcript_11037 and F01_transcript_12108), and F3H (F01_transcript_28924 and F01_transcript_29224) showed significant downregulation. Thus, these genes might play direct roles in the fading of P. lactiflora ‘Coral Sunset’ petals (Figure 3b).

3.4. Confirmation of Gene Expression Patterns by qRT-PCR

To confirm the expression pattern of the pigment synthesis-related genes in the transcriptome database, we selected twelve of them and analyzed the expression pattern at the S1–S4 stages using qRT-PCR. The expression level of the carotenoid synthesis-related genes PSY (F01_transcript_43718), ZEP (F01_transcript_13061), and CHYE (F01_transcript_25400) did not change significantly during the four stages, whereas LCYB (F01_transcript_17105) and LCYE (F01_transcript_9643) were strongly expressed at the S1 stage but weakly expressed at stages S2–S4 (Figure 4). The CCD (F01_transcript_13395) gene was an exception, as its expression gradually increased with petal aging during the S1–S4 period. The anthocyanin synthesis structural genes CHS, F3H, F3’H, DFR, and ANS were strongly expressed at the S1 stage, but weakly expressed at the S2–S4 stages. However, the expression level of UFGT gradually increased with petal aging.

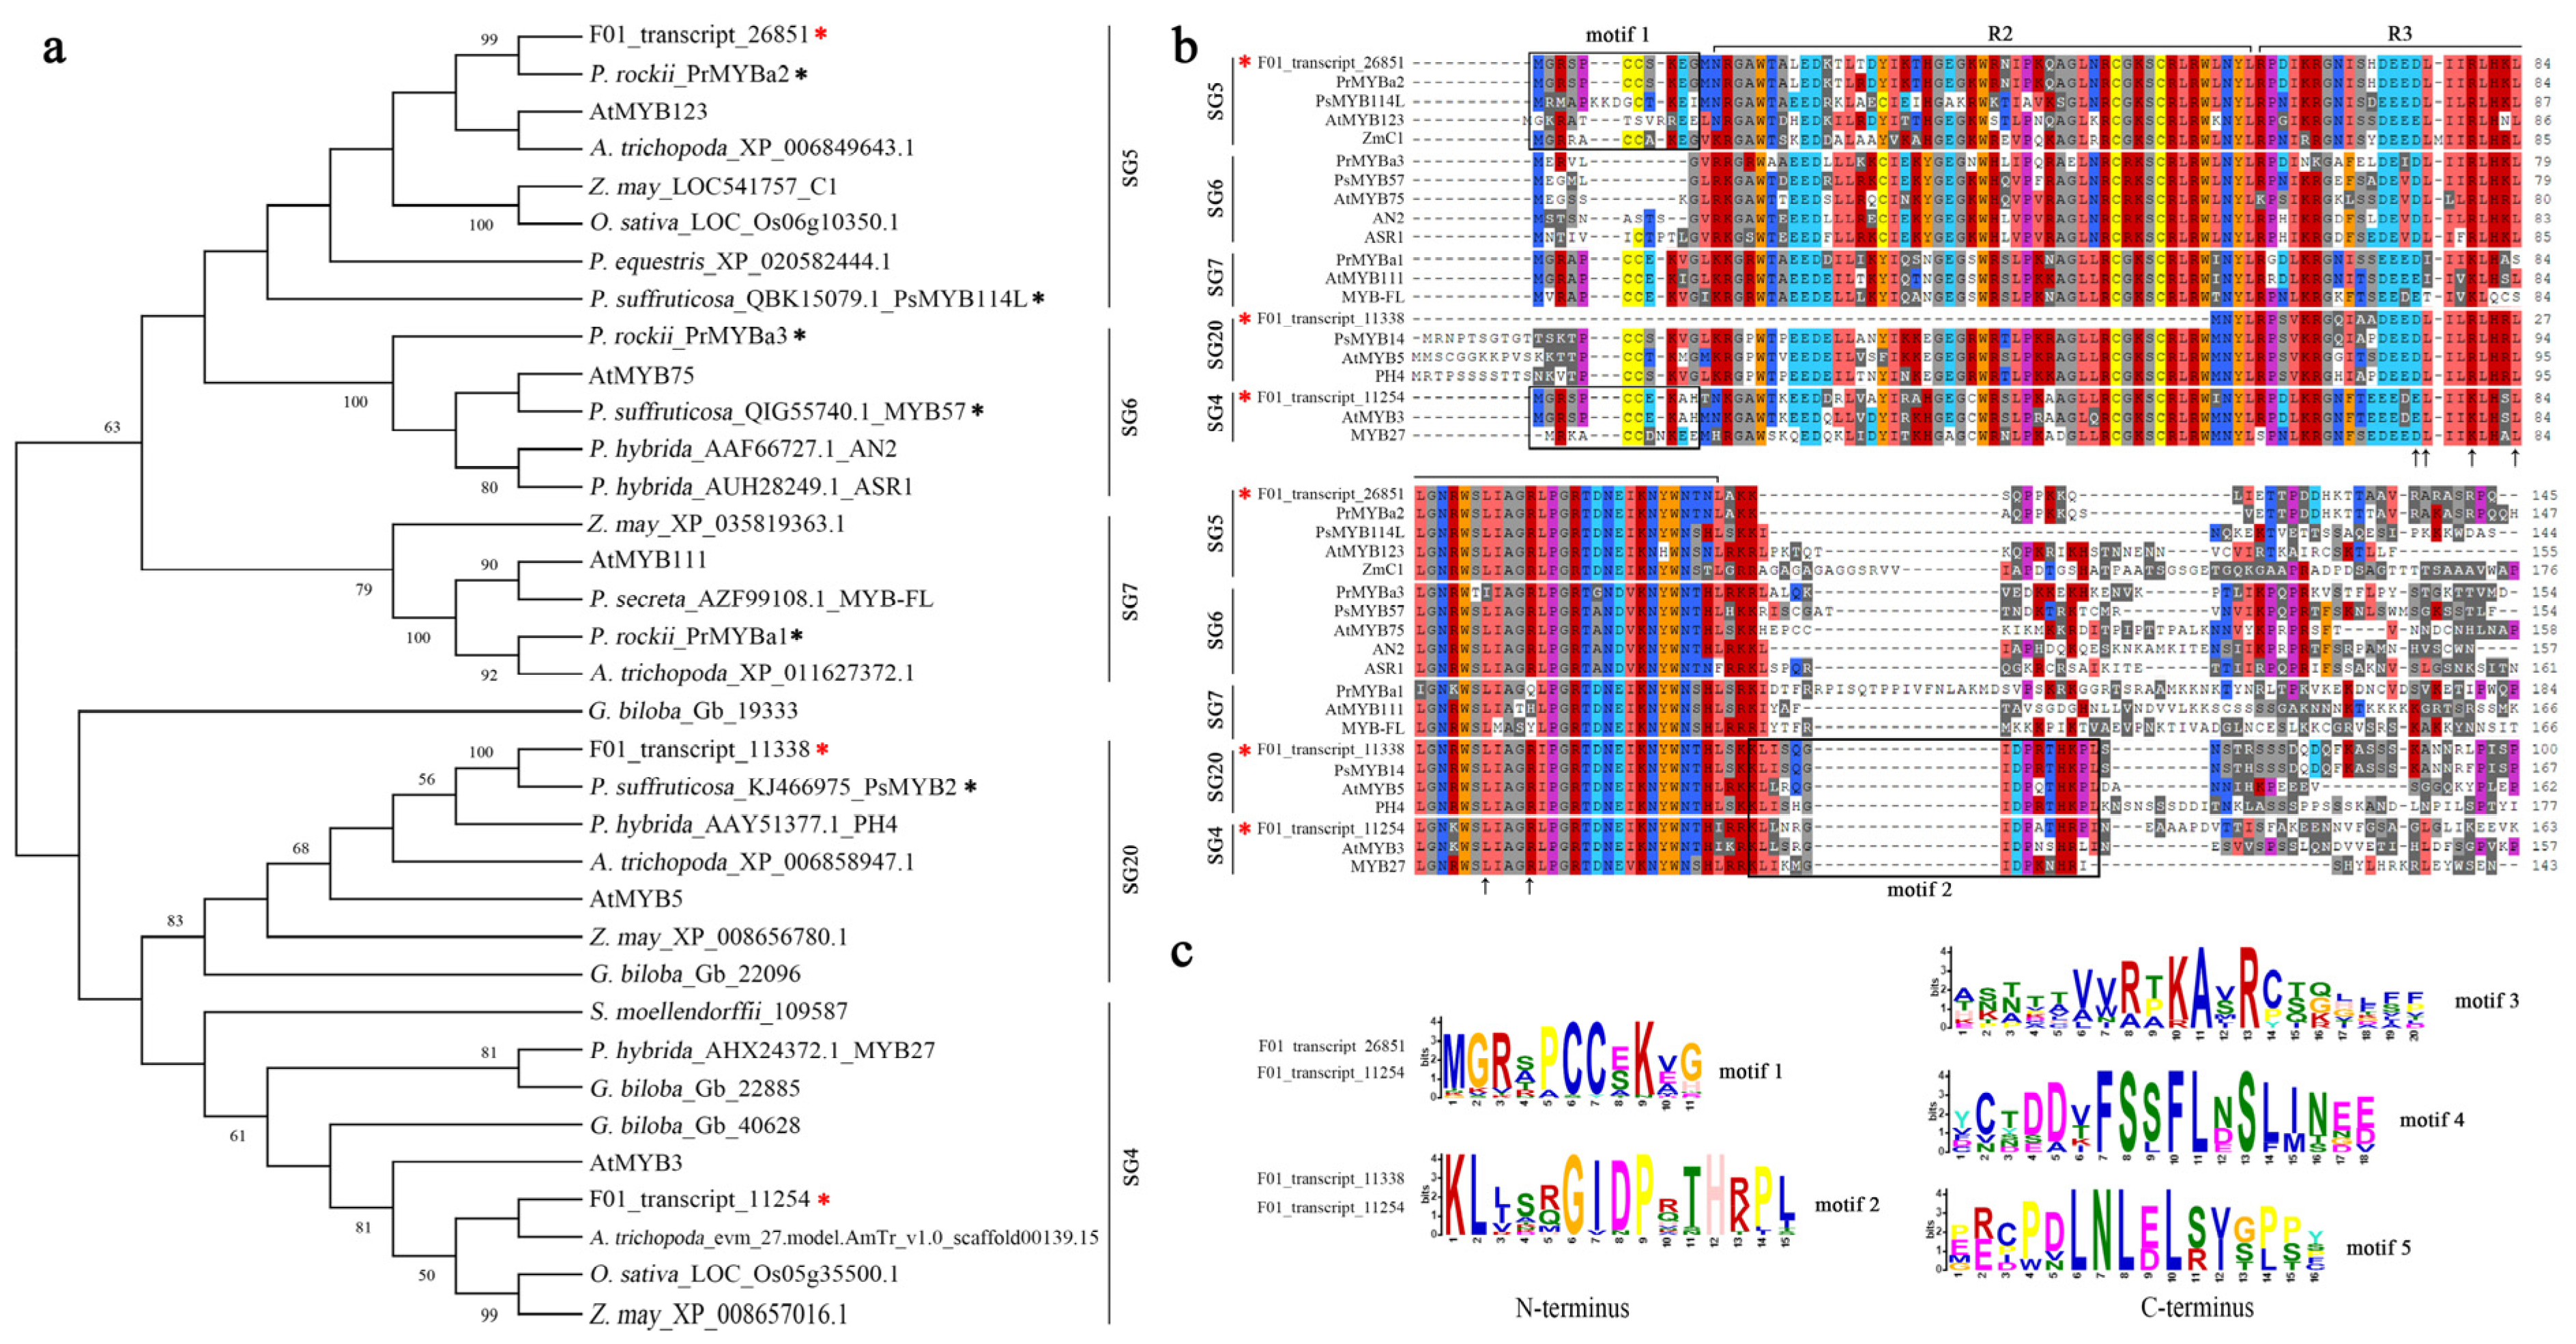
3.5. Characterization of R2R3-MYB Members in P. lactiflora ‘Coral Sunset’ Petals

The MBW transcription factor complex plays a major role in regulating the synthesis of anthocyanins. The complex comprises proteins of the R2R3-MYB, bHLH, and WD40 transcription factor families, of which the R2R3-MYB protein is the core member and is responsive to various environmental and developmental signals. In the transcriptome database of P. lactiflora ‘Coral Sunset’, a total of 155 MYB-like transcripts were identified, of which three members belonged to the flavonoid regulatory subfamily. The transcript F01_transcript_26851 belonged to SG5, F01_transcript_11338 belonged to SG20, and F01_transcript_11254 belonged to SG4 (Figure 5a). The results of amino acid sequence alignment and domain prediction indicated that these R2R3-MYBs were relatively conservative with the members of the same subfamily in other plant species. At the N-terminus, in addition to the typical R2R3 domains, F01_transcript_26861 and F01_transcript_11254 also contained motif 1, whereas F01_transcript_11338 and F01_transcript_11254 contained motif 2. At the C-terminus, these three transcripts each contained unique motifs (motifs 3–5) (Figure 5b,c). Interestingly, the expression level of F01_transcript_11254 (hereafter designated MYBs-SG4) was significantly downregulated with petal fading, which indicated that this transcription factor may play an important role in this process (Figures S5 and S6).

3.6. Peony MYBs-SG4 Plays Roles in Anthocyanin Synthesis

To determine the function of MYBs-SG4 in petal fading in peony, we analyzed the regulatory characteristics of MYBs-SG4 after transient expression in the petunia corolla. The results showed that MYBs-SG4 infiltration after two days promoted a faint yellow phenotype in the petunia corolla. Infiltration with the positive control AN2 strongly promoted pigmentation in the corolla, whereas the negative control EV showed no chromogenic phenotype (Figure 6a). Detection of the expression of anthocyanin synthesis structural genes in the transfected portions of petunia corollas indicated that CHSa, CHSj, F3′H, F3′5′H, DFR, ANS, and 5GT were distinctly induced, although the induction intensity was not as strong as that of AN2 (Figure 6b). It should be pointed out that the function of peony MYBs-SG4 in regulating flavonoid structural genes was completely opposite to that of the homologous genes Arabidopsis MYB3 and petunia MYB27, which negatively regulate the expression of anthocyanin synthesis structural genes and inhibit anthocyanin synthesis. However, similar to MYB3 and MYB27, the regulatory effect of MYBs-SG4 on structural genes may be achieved through formation of the MBW complex associated with bHLH (AN1-like) and WD40 (AN11-like) proteins, as the capability for interaction of the proteins was confirmed in yeast two-hybrid assays (Figure 6c).

4. Discussion

Peonies, with their vibrant flower colors and diverse floral forms, in addition to their profound cultural symbolism, have emerged as an important cut flower crop worldwide. The petal color of P. lactiflora ‘Coral Sunset’ changes from coral pink to pale yellow during anthesis, which contributes to the high ornamental value of the cultivar. In the present study, we determined that the pigment components in the petals of the peony ‘Coral Sunset’ mainly comprise flavonoids/anthocyanins and carotenoids, and the contents of both groups of pigments significantly decreased with petal aging. The layering of pigments in different solvents confirmed that both groups of pigments played a role in the petal coloration. The petal fading phenotype is observed in many other ornamental plants, such as Chrysanthemum, Brunfelsia calycina, and ornamental crabapples [21,43,44,45]. The main cause of petal fading in these species is a decrease in pigment accumulation, and some genes are involved in this process through expression level changes. The pigment content in plants is influenced by both biosynthesis and degradation pathways [4,5]. SMART sequencing of the ‘Coral Sunset’ petal transcriptome before and after fading revealed multiple DEGs, including genes associated with anthocyanin synthesis, carotenoid synthesis, photosynthesis, and oxidation. Gao et al., found that in the process of Paeonia ostii flower coloration, the downregulated expression of structural genes, such as PAL, DFR, and ANS, resulted in a substantial decrease in the mass fraction of total anthocyanins [46]. These findings were consistent with the present results, which showed that the expression level of the anthocyanin synthesis structural genes CHS, F3H, F3′H, DFR, and ANS was significantly higher before petal fading and subsequently decreased with fading. Similarly, the expression level of the carotenoid synthesis genes LCYB and LCYE sharply decreased after the S2 stage. However, the expression levels of many oxidase genes and light-signaling-related genes were significantly upregulated during petal fading. Many studies have reported the involvement of such genes in the degradation of anthocyanins and carotenoids [22,29,31,47]. Thus, the extremely low expression level of structural genes in association with fading may result in a significant reduction of anthocyanin and carotenoid contents, whereas the enhanced expression of certain oxidase or light-signaling-related genes may accelerate the degradation of pigments. Thus, suppressed synthesis and accelerated degradation of pigments may jointly determine the fading of peony petals (Figure 7).
Previous studies have shown that so-called MBW ternary complexes, involving R2R3-MYB and bHLH transcription factors together with WD-repeat proteins, regulate the expression of genes in the flavonoid biosynthesis pathway [6,9,10,11]. In the present transcriptome data, the expression of F01_transcript_11254, which encoded a R2R3-MYB transcription factor, was significantly downregulated (Figure S6). This transcript was phylogenetically related to Arabidopsis MYB3 and petunia MYB27, which are negative regulators of anthocyanin synthesis [14,48,49] and contain a bHLH-binding motif. However, interestingly, molecular functional testing indicated that this peony MYBs-SG4 member exhibited the ability to positively regulate anthocyanin synthesis by forming a MBW protein complex. This finding is the first report of a SG4 member of the R2R3-MYB family with a positive regulatory function in plants. It indicates that, at the C-terminus, peony MYBs-SG4s may contain a structural domain with opposite activation functions compared with those of Arabidopsis MYB3 and petunia MYB27. The specific transcriptional regulatory mechanism of MYBs-SG4, and why its regulatory function is opposite to that of MYB3 and MYB27, require further research. In tree peony species, certain R2R3-MYB family members associated with flavonoid regulation have been identified and isolated and are associated with the petal color. These proteins mainly comprise PrMYBa1 (SG7), PrMYBa2 (SG5), and PrMYBa6 (SG6) in Paeonia rockii, and PsMYB114L/PsMYB12L (SG7), PsMYB57/PsMYB58 (SG6), and PsMYB2 (SG20) in Paeonia suffruticosa [50,51,52,53,54]. The R2R3-MYB gene members of the SG5 (F01_transcript_11254) and SG20 (F01_transcript_11338) subfamilies were identified in the present peony transcriptome database, but no significant changes in expression with petal fading were detected. These results indicate that the regulation of petal color in different peony species depends on different R2R3-MYB proteins and, notably, the decrease in the SG4 expression level downregulated the expression of anthocyanin synthesis structural genes, which may be an important reason for the decrease in anthocyanin content (Figure 7).
In addition, we screened certain photoreceptors and light signal transduction pathway factors among the DEGs. Previous studies have shown that photoreceptors (UVR8, CRYs, PHOTs, and PHYs) regulate anthocyanin synthesis mainly through light-signaling-related factors, such as COP1, HY5, and PIF [55,56,57,58]. The metabolism of carotenoids is mainly associated with light signals and is regulated by transcription factors. In Arabidopsis, PIF and HY5 in the light signal transduction pathway can antagonize each other and participate in the regulation of carotenoid synthesis [5,28,29,30]. Further research is needed on whether or how these light-signaling genes regulate the synthesis or degradation of anthocyanins and carotenoids.

5. Conclusions

In conclusion, in this study, the combination of metabolome and transcriptome was used to explore the mechanism of petal coloration of peony ‘Coral Sunset’. A total of 32 types of carotenoid components, 82 types of flavonoids, and 68 types of anthocyanidins were identified. Among them, the content of main pigment components, including lutein of carotenoid, kaempferol of flavonoid, and cyanidin-3,5-O-diglucoside of anthocyanin, significantly decreased with petal aging. A full-length transcriptome positively facilitated the annotation of the peony gene and promoted further studies into the specific gene function. High-throughput sequencing of the second-generation transcriptome of petals before and after fading revealed 1918 DEGs, including genes associated with anthocyanin synthesis, carotenoid synthesis, photosynthesis, and oxidation. Quantitative real-time PCR analysis of the expression pattern analysis of the candidate unigenes in the ‘Coral Sunset’ petals further confirmed that the pigment synthesis genes were involved in the process of petal fading. Interestingly, a SG4 member of the R2R3-MYB family that positively regulates anthocyanin synthesis was identified to be involved in the coloration of peony petals. This is the first report of a SG4 member with a positive regulatory function. All these findings improve our knowledge of pigment synthesis and metabolism and provide a solid foundation for further targeted breeding of flower color.

Supplementary Materials

The following supporting information can be downloaded at: https://www.mdpi.com/article/10.3390/horticulturae9121295/s1, Figure S1: Hierarchy of GO annotations and statistics for upregulated differentially expressed transcripts in the cellular component (CC) category. Figure S2: Hierarchy of GO annotations and statistics for upregulated differentially expressed transcripts in the molecular function (MF) category. Figure S3: Hierarchy of GO annotations and statistics for downregulated differentially expressed transcripts in the cellular component (CC) category. Figure S4: Hierarchy of GO annotations and statistics for downregulated differentially expressed transcripts in the molecular function (MF) category. Figure S5: Differentially expressed R2R3-MYB gene members in ‘Coral Sunset’ petals. S2 and S4 represent two stages of petal development. Blue to red shading represents the gene expression level from weak to strong, respectively. Figure S6: Quantitative real-time PCR analysis of the expression pattern of peony MYG-SG4 at the S1 to S4 petal development stages. Black asterisks indicate a significant difference in expression level. Table S1: Primers used in this study. Table S2: Carotenoids detected in peony ‘Coral Sunset’ petals. Table S3: Flavonoids detected in peony ‘Coral Sunset’ petals. Table S4: Anthocyanidins detected in peony ‘Coral Sunset’ petals.

Author Contributions

Conceptualization and methodology, Z.F.; investigation, R.W., L.W., H.W., Y.L., X.Y. and J.G.; formal analysis, H.Z.; writing—original draft, Z.F. and H.Z. All authors have read and agreed to the published version of the manuscript.

Funding

This research was supported by the National Natural Science Foundation of China (32030095) and the Fund of the Henan Academy of Agricultural Sciences for Distinguished Young Scholars (2022JQ03).

Data Availability Statement

The data that support the findings of this research are available from the corresponding author (Z.F.) upon reasonable request.

Conflicts of Interest

The authors declare no conflict of interest.

References

  1. Römer, S.; Fraser, P.D. Recent advances in carotenoid biosynthesis, regulation and manipulation. Planta 2005, 221, 305–308. [Google Scholar] [CrossRef] [PubMed]
  2. Nishihara, M.; Nakatsuka, T. Genetic engineering of flavonoid pigments to modify flower color in floricultural plants. Biotechnol. Lett. 2011, 33, 433–441. [Google Scholar] [CrossRef] [PubMed]
  3. Kellenberger, R.T.; Glover, B.J. The evolution of flower colour. Curr. Biol. 2023, 33, 484–488. [Google Scholar] [CrossRef] [PubMed]
  4. Tanaka, Y.; Sasaki, N.; Ohmiya, A. Biosynthesis of plant pigments: Anthocyanins, betalains and carotenoids. Plant J. 2008, 54, 733–749. [Google Scholar] [CrossRef] [PubMed]
  5. Zhao, X.; Zhang, Y.; Long, T.; Wang, S.; Yang, J. Regulation mechanism of plant pigments biosynthesis: Anthocyanins, carotenoids, and betalains. Metabolites 2022, 12, 871. [Google Scholar] [CrossRef] [PubMed]
  6. Koes, R.; Verweij, W.; Quattrocchio, F. Flavonoids: A colorful model for the regulation and evolution of biochemical pathways. Trends Plant Sci. 2005, 10, 236–242. [Google Scholar] [CrossRef]
  7. Rosas-Saavedra, C.; Stange, C. Biosynthesis of carotenoids in plants: Enzymes and color. Subcell. Biochem. 2016, 79, 35–69. [Google Scholar]
  8. Gandía-Herrero, F.; García-Carmona, F. Biosynthesis of betalains: Yellow and violet plant pigments. Trends Plant Sci. 2013, 18, 334–343. [Google Scholar] [CrossRef]
  9. Liu, W.; Feng, Y.; Yu, S.; Fan, Z.; Li, X.; Li, J.; Yin, H. The flavonoid biosynthesis network in plants. Int. J. Mol. Sci. 2021, 22, 2824. [Google Scholar] [CrossRef]
  10. Xu, W.; Dubos, C.; Lepiniec, L. Transcriptional control of flavonoid biosynthesis by MYB-bHLH-WDR complexes. Trends Plant Sci. 2015, 20, 176–185. [Google Scholar] [CrossRef]
  11. Yan, H.; Pei, X.; Zhang, H.; Li, X.; Zhang, X.; Zhao, M.; Chiang, V.L.; Sederoff, R.R.; Zhao, X. MYB-mediated regulation of anthocyanin biosynthesis. Int. J. Mol. Sci. 2021, 22, 3103. [Google Scholar] [CrossRef] [PubMed]
  12. Dubos, C.; Stracke, R.; Grotewold, E.; Weisshaar, B.; Martin, C.; Lepiniec, L. MYB transcription factors in Arabidopsis. Trends Plant Sci. 2010, 15, 573–581. [Google Scholar] [CrossRef]
  13. Zhang, H.; Koes, R.; Shang, H.; Fu, Z.; Wang, L.; Dong, X.; Zhang, J.; Passeri, V.; Li, Y.; Jiang, H.; et al. Identification and functional analysis of three new anthocyanin R2R3-MYB genes in Petunia. Plant Direct 2019, 3, e00114. [Google Scholar] [CrossRef] [PubMed]
  14. Albert, N.W.; Davies, K.M.; Lewis, D.H.; Zhang, H.; Montefiori, M.; Brendolise, C.; Boase, M.R.; Ngo, H.; Jameson, P.E.; Schwinn, K.E. A conserved network of transcriptional activators and repressors regulates anthocyanin pigmentation in eudicots. Plant Cell 2014, 26, 962–980. [Google Scholar] [CrossRef] [PubMed]
  15. LaFountain, A.M.; Yuan, Y.W. Repressors of anthocyanin biosynthesis. New Phytol. 2021, 231, 933–949. [Google Scholar] [CrossRef] [PubMed]
  16. Liu, Y.; Tikunov, Y.; Schouten, R.E.; Marcelis, L.F.M.; Visser, R.G.F.; Bovy, A. Anthocyanin biosynthesis and degradation mechanisms in Solanaceous vegetables: A review. Front. Chem. 2018, 6, 52. [Google Scholar] [CrossRef]
  17. Oren-Shamir, M. Does anthocyanin degradation play a significant role in determining pigment concentration in plants? Plant Sci. 2009, 177, 310–316. [Google Scholar] [CrossRef]
  18. Passeri, V.; Koes, R.; Quattrocchio, F.M. New challenges for the design of high value plant products: Stabilization of anthocyanins in plant vacuoles. Front. Plant Sci. 2016, 7, 153. [Google Scholar] [CrossRef]
  19. Kader, F.; Haluk, J.; Nicolas, J.; Metche, M. Degradation of cyanidin 3-glucoside by blueberry polyphenol oxidase: Kinetic studies and mechanisms. J. Agric. Food Chem. 1998, 46, 3060–3065. [Google Scholar] [CrossRef]
  20. Sarni, P.; Fulcrand, H.; Souillol, V.; Souquet, J.-M.; Cheynier, V. Mechanisms of anthocyanin degradation in grape must-like model solutions. J. Sci. Food Agric. 1995, 69, 385–391. [Google Scholar] [CrossRef]
  21. Luo, H.; Deng, S.; Fu, W.; Zhang, X.; Zhang, X.; Zhang, Z.; Pang, X. Characterization of active anthocyanin degradation in the petals of Rosa chinensis and Brunfelsia calycina reveals the effect of gallated catechins on pigment maintenance. Int. J. Mol. Sci. 2017, 18, 699. [Google Scholar] [CrossRef] [PubMed]
  22. Zipor, G.; Duarte, P.; Carqueijeiro, I.; Shahar, L.; Ovadia, R.; Teper-Bamnolker, P.; Eshel, D.; Levin, Y.; Doron-Faigenboim, A.; Sottomayor, M.; et al. In planta anthocyanin degradation by a vacuolar class III peroxidase in Brunfelsia calycina flowers. New Phytol. 2015, 205, 653–665. [Google Scholar] [CrossRef] [PubMed]
  23. Quattrocchio, F.; Verweij, W.; Kroon, A.; Spelt, C.; Mol, J.; Koes, R. PH4 of Petunia is an R2R3-MYB protein that activates vacuolar acidification through interactions with basic-helix-loop-helix transcription factors of the anthocyanin pathway. Plant Cell 2006, 18, 1274–1291. [Google Scholar] [CrossRef] [PubMed]
  24. Maoka, T. Carotenoids as natural functional pigments. J. Nat. Med. 2020, 74, 1–16. [Google Scholar] [CrossRef] [PubMed]
  25. Rubio-Moraga, A.; Rambla, J.L.; Fernández-De-Carmen, A.; Trapero-Mozos, A.; Ahrazem, O.; Orzáez, D.; Granell, A.; Gómez-Gómez, L. New target carotenoids for CCD4 enzymes are revealed with the characterization of a novel stress-induced carotenoid cleavage dioxygenase gene from Crocus sativus. Plant Mol. Biol. 2014, 86, 555–569. [Google Scholar] [CrossRef] [PubMed]
  26. Dhar, M.K.; Mishra, S.; Bhat, A.; Chib, S.; Kaul, S. Plant carotenoid cleavage oxygenases: Structure-function relationships and role in development and metabolism. Brief. Funct. Genom. 2020, 19, 1–9. [Google Scholar] [CrossRef]
  27. Yoo, H.J.; Chung, M.Y.; Lee, H.A.; Lee, S.B.; Grandillo, S.; Giovannoni, J.J.; Lee, J.M. Natural overexpression of CAROTENOID CLEAVAGE DIOXYGENASE 4 in tomato alters carotenoid flux. Plant Physiol. 2023, 192, 1289–1306. [Google Scholar] [CrossRef]
  28. Toledo-Ortiz, G.; Huq, E.; Rodríguez-Concepción, M. Direct regulation of phytoene synthase gene expression and carotenoid biosynthesis by phytochrome-interacting factors. Proc. Natl. Acad. Sci. USA 2010, 107, 11626–11631. [Google Scholar] [CrossRef]
  29. Quian-Ulloa, R.; Stange, C. Carotenoid biosynthesis and plastid development in plants: The role of light. Int. J. Mol. Sci. 2021, 22, 1184. [Google Scholar] [CrossRef]
  30. Sun, T.; Rao, S.; Zhou, X.; Li, L. Plant carotenoids: Recent advances and future perspectives. Mol. Hortic. 2022, 2, 3. [Google Scholar] [CrossRef]
  31. Ma, Y.; Ma, X.; Gao, X.; Wu, W.; Zhou, B. Light induced regulation pathway of anthocyanin biosynthesis in plants. Int. J. Mol. Sci. 2021, 22, 11116. [Google Scholar] [CrossRef] [PubMed]
  32. Conesa, A.; Madrigal, P.; Tarazona, S.; Gomez-Cabrero, D.; Cervera, A.; McPherson, A.; Szcześniak, M.W.; Gaffney, D.J.; Elo, L.L.; Zhang, X.; et al. A survey of best practices for RNA-seq data analysis. Genome Biol. 2016, 17, 13. [Google Scholar] [CrossRef] [PubMed]
  33. Kong, L.; Zhang, Y.; Ye, Z.; Liu, X.; Zhao, S.; Wei, L.; Gao, G. CPC: Assess the protein-coding potential of transcripts using sequence features and support vector machine. Nucleic Acids Res. 2007, 35, 345–349. [Google Scholar] [CrossRef]
  34. Sun, L.; Luo, H.; Bu, D.; Guo, G.; Yu, K.; Zhang, C.; Liu, Y.; Chen, R.; Zhao, Y. Utilizing sequence intrinsic composition to classify protein-coding and long non-coding transcripts. Nucleic Acids Res. 2013, 41, e166. [Google Scholar] [CrossRef]
  35. Wang, L.G.; Park, H.J.; Dasari, S.; Wang, S.Q.; Kocher, J.P.; Li, W. CPAT: Coding-potential assessment tool using an alignment-free logistic regression model. Nucleic Acids Res. 2013, 41, e74. [Google Scholar] [CrossRef] [PubMed]
  36. Finn, R.D.; Coggill, P.; Eberhardt, R.Y.; Eddy, S.R.; Mistry, J.; Mitchell, A.L.; Potter, S.C.; Punta, M.; Qureshi, M.; Sangrador-Vegas, A.; et al. The Pfam protein families database: Towards a more sustainable future. Nucleic Acids Res. 2016, 44, D279–D285. [Google Scholar] [CrossRef] [PubMed]
  37. Robinson, M.D.; McCarthy, D.J.; Smyth, G.K. edgeR: A Bioconductor package for differential expression analysis of digital gene expression data. Bioinformatics 2010, 26, 139–140. [Google Scholar] [CrossRef]
  38. Love, M.I.; Huber, W.; Anders, S. Moderated estimation of fold change and dispersion for RNA-seq data with DESeq2. Genome Biol. 2014, 15, 550. [Google Scholar] [CrossRef]
  39. Anders, S.; Huber, W. Differential expression analysis for sequence count data. Genome Biol. 2010, 11, R106. [Google Scholar] [CrossRef]
  40. Young, M.D.; Wakefield, M.J.; Smyth, G.K.; Oshlack, A. Gene ontology analysis for RNA-seq: Accounting for selection bias. Genome Biol. 2010, 11, R14. [Google Scholar] [CrossRef]
  41. Mao, X.; Cai, T.; Olyarchuk, J.G.; Wei, L. Automated genome annotation and pathway identifcation using the KEGG Orthology (KO) as a controlled vocabulary. Bioinformatics 2005, 21, 3787–3793. [Google Scholar] [CrossRef] [PubMed]
  42. Karimi, M.; Inzé, D.; Depicker, A. GATEWAYTM vectors for Agrobacterium-mediated plant transformation. Trends Plant Sci. 2002, 7, 193–195. [Google Scholar] [CrossRef] [PubMed]
  43. Cui, X.; Qin, X.; Liu, Y.; Zhang, Y.; Bao, H.; Hu, Y.; Shen, X. Analysis of flavonoid metabolism during the process of petal discoloration in three Malus Crabapple Cultivars. ACS Omega 2022, 7, 37304–37314. [Google Scholar] [CrossRef] [PubMed]
  44. Shi, Z.; Han, X.; Wang, G.; Qiu, J.; Zhou, L.J.; Chen, S.; Fang, W.; Chen, F.; Jiang, J. Transcriptome analysis reveals chrysanthemum flower discoloration under high-temperature stress. Front. Plant Sci. 2022, 13, 1003635. [Google Scholar] [CrossRef] [PubMed]
  45. Rong, H.; Han, X.; Xin, Y.; Ni, Z.; Zhang, W.; Xu, L. Small RNA and degradome sequencing reveal roles of miRNAs in the petal color fading of Malus Crabapple. Int. J. Mol. Sci. 2023, 24, 11384. [Google Scholar] [CrossRef] [PubMed]
  46. Gao, L.; Yang, H.; Liu, H.; Yang, J.; Hu, Y. Extensive transcriptome changes underlying the flower color intensity variation in Paeonia ostii. Front. Plant Sci. 2016, 6, 1205. [Google Scholar] [CrossRef] [PubMed]
  47. Luo, H.; Li, W.; Zhang, X.; Deng, S.; Xu, Q.; Hou, T.; Pang, X.; Zhang, Z.; Zhang, X. In planta high levels of hydrolysable tannins inhibit peroxidase mediated anthocyanin degradation and maintain abaxially red leaves of Excoecaria cochinchinensis. BMC Plant Biol. 2019, 19, 315. [Google Scholar] [CrossRef]
  48. Wang, X.C.; Wu, J.; Guan, M.L.; Zhao, C.H.; Geng, P.; Zhao, Q. Arabidopsis MYB4 plays dual roles in flavonoid biosynthesis. Plant J. 2020, 101, 637–652. [Google Scholar] [CrossRef]
  49. Ma, D.; Constabel, C.P. MYB repressors as regulators of phenylpropanoid metabolism in plants. Trends Plant Sci. 2019, 24, 275–289. [Google Scholar] [CrossRef]
  50. Zhang, X.; Xu, Z.; Yu, X.; Zhao, L.; Zhao, M.; Han, X.; Qi, S. Identification of two novel R2R3-MYB transcription factors, PsMYB114L and PsMYB12L, related to anthocyanin biosynthesis in Paeonia suffruticosa. Int. J. Mol. Sci. 2019, 20, 1055. [Google Scholar] [CrossRef]
  51. Zhang, Y.; Xu, S.; Cheng, Y.; Wang, J.; Wang, X.; Liu, R.; Han, J. Functional identification of PsMYB57 involved in anthocyanin regulation of tree peony. BMC Genet. 2020, 21, 124. [Google Scholar] [CrossRef]
  52. Zhang, Y.; Xu, S.; Ma, H.; Duan, X.; Gao, S.; Zhou, X.; Cheng, Y. The R2R3-MYB gene PsMYB58 positively regulates anthocyanin biosynthesis in tree peony flowers. Plant Physiol. Biochem. 2021, 164, 279–288. [Google Scholar] [CrossRef] [PubMed]
  53. Zhang, L.; Yan, L.; Zhang, C.; Kong, X.; Zheng, Y.; Dong, L. Glucose supply induces PsMYB2-mediated anthocyanin accumulation in Paeonia suffruticosa ‘Tai Yang’ cut flower. Front. Plant Sci. 2022, 13, 874526. [Google Scholar] [CrossRef] [PubMed]
  54. Zhu, J.; Wang, Y.; Wang, Q.; Li, B.; Wang, X.; Zhou, X.; Zhang, H.; Xu, W.; Li, S.; Wang, L. The combination of DNA methylation and positive regulation of anthocyanin biosynthesis by MYB and bHLH transcription factors contributes to the petal blotch formation in Xibei tree peony. Hortic. Res. 2023, 10, uhad100. [Google Scholar] [CrossRef] [PubMed]
  55. Shin, D.H.; Choi, M.; Kim, K.; Bang, G.; Cho, M.; Choi, S.B.; Choi, G.; Park, Y.I. HY5 regulates anthocyanin biosynthesis by inducing the transcriptional activation of the MYB75/PAP1 transcription factor in Arabidopsis. FEBS Lett. 2013, 587, 1543–1547. [Google Scholar] [CrossRef] [PubMed]
  56. Nguyen, N.H.; Jeong, C.Y.; Kang, G.H.; Yoo, S.D.; Hong, S.W.; Lee, H. MYBD employed by HY5 increases anthocyanin accumulation via repression of MYBL2 in Arabidopsis. Plant J. 2015, 84, 1192–1205. [Google Scholar] [CrossRef]
  57. Jiang, Z.H.; Chen, C.; Wang, J.; Xie, W.Y.; Wang, M.; Li, X.; Zhang, X.Y. Purple potato (Solanum tuberosum L.) anthocyanins attenuate alcohol-induced hepatic injury by enhancing antioxidant defense. J. Nat. Med. 2016, 70, 45–53. [Google Scholar] [CrossRef]
  58. An, J.P.; Qu, F.J.; Yao, J.F.; Wang, X.N.; You, C.X.; Wang, X.F.; Hao, Y.J. The bZIP transcription factor MdHY5 regulates anthocyanin accumulation and nitrate assimilation in apple. Hortic. Res. 2017, 4, 17023. [Google Scholar] [CrossRef]
Figure 1. Petal pigmentation of Paeonia lactiflora ‘Coral Sunset’. (a) Petal coloration phenotype and pigment stratification in organic (lower levels in centrifuge tube) and aqueous (upper levels in centrifuge tube) solvents at four floral developmental stages (S1 to S4). Main components and changes in contents of (b) carotenoids, (c) flavonoids, and (d) anthocyanins in ‘Coral Sunset’ petals. The content data are the mean ± SD of two independent experiments. Statistical comparison was performed by one-way ANOVA, followed by Tukey’s test. A black asterisk indicates a significant difference compared with S1.
Horticulturae 09 01295 g001
Figure 2. Transcriptome analysis of P. lactiflora ‘Coral Sunset’ petals. (a) Venn diagram of the number of predicted long non-coding RNAs according to CNCI, CPC, Pfam, and CPAT analysis. (b) Volcano plot of enrichment of differentially expressed genes (DEGs). (c) GO terms enrichment analysis of unigenes. (d) Scatter plot of KEGG pathway enrichment. The rich factor reflects the extent of the enrichment.
Horticulturae 09 01295 g002
Figure 3. Expression patterns of the unigenes associated with (a) carotenoid and (b) flavonoid/anthocyanin metabolism pathways. The main components contributing to carotenoid (yellow shading) and flavonoid (purple shading) pigmentation in P. lactiflora ‘Coral Sunset’ petals are highlighted. The expression level was based on the FPKM value. Blue to red shading represents the gene expression level from weak to strong, respectively. S2-1, S2-2 and S4-1, S4-2 represent two sets of duplicate comparative samples, respectively. Black asterisks indicate the transcripts that differed significantly in expression level between two stages.
Horticulturae 09 01295 g003
Figure 4. Quantitative real-time PCR analysis of the expression of the candidate unigenes associated with pigment synthesis in the petals of P. lactiflora ‘Coral Sunset’. The qRT-PCR data are presented as the mean ± SD of three independent experiments. Statistical comparison was performed by one-way ANOVA, followed by Tukey’s test. Black asterisks indicate a significant difference in the expression of the unigene between the stage and S1. S1 to S4 on the x-axis represent four stages of peony petal development. The y-axis shows the log2 ratio.
Horticulturae 09 01295 g004
Figure 5. Identification of flavonoid regulatory R2R3-MYBs in P. lactiflora ‘Coral Sunset’. (a) Phylogenetic analysis of the flavonoid regulatory R2R3-MYB members. (b) Amino acid alignment analysis of the flavonoid regulatory R2R3-MYB members. Black boxes indicate the conserved motif 1 and motif 2 in specific R2R3-MYB subgroups. The R2R3 motif is indicated with horizontal lines. (c) Motif scan analysis of the flavonoid regulatory R2R3-MYB members predicted with the MEME Suite (https://meme-suite.org/meme/doc/meme.html, accessed on 15 May 2023). The larger the letter, the more conservative the amino acid sequence at that position. A red asterisk indicates the members identified from P. lactiflora ‘Coral Sunset’ transcripts. A black asterisk indicates R2R3-MYB members in other Paeonia species.
Horticulturae 09 01295 g005
Figure 6. Functional identification of MYBs-SG4. (a) Petunia ‘W59×axi’ corolla coloration phenotype after transfection with MYBs-SG4. Petunia AN2 was the positive control and the empty vector (EV) was the negative control. (b) Expression levels of anthocyanin synthesis structural genes induced by overexpression of MYBs-SG4. The qRT-PCR data are presented as the mean ± SD of three independent experiments, and at least ten individual agroinfiltrated sectors from each series of agroinfection were pooled for RNA extraction in each experiment. Statistical comparison was performed by one-way ANOVA, followed by Tukey’s test. Black asterisks indicate a significant difference in the expression level. (c) MYBs-SG4 interaction with the AN1-like and AN11-like proteins in yeast two-hybrid assays. Yeast grew on a medium containing X-α-gal and displayed blue, indicating interaction between the two proteins. The double transformants with the empty vectors pGBKT7 or pGADT7, and the corresponding detection protein, were used as a control. SD/−LTHA denotes a yeast culture synthetic dropout medium without leucine, tryptophan, histidine, and adenine.
Horticulturae 09 01295 g006
Figure 7. Proposed model for the regulation of pigment degradation in P. lactiflora ‘Coral Sunset’ petals. Carotenoids and flavonoids jointly determine the coloration of the petals. Light- or oxidation-related signals downregulate the expression of MYB-SG4, a member of the MBW complex, causing reduced flavonoid synthesis-related gene expression, thereby hindering flavonoid synthesis. Other regulators that respond to light or oxidative signals may also be involved in the flavonoid degradation process, and carotenoid degradation may also be subject to a similar regulatory mechanism.
Horticulturae 09 01295 g007
Table 1. Annotation of assembled unigenes from information in eight public databases.
DatabaseNumber of IsoformsProportion (%)
COG14,04042.03
GO23,28269.70
KEGG14,96044.79
KOG22,57467.58
Pfam26,08478.09
SwissProt24,90074.54
eggNOG32,63497.70
Nr33,26899.60
All33,403100
Disclaimer/Publisher’s Note: The statements, opinions and data contained in all publications are solely those of the individual author(s) and contributor(s) and not of MDPI and/or the editor(s). MDPI and/or the editor(s) disclaim responsibility for any injury to people or property resulting from any ideas, methods, instructions or products referred to in the content.

