Article

Three-Dimensional Imaging in Agriculture: Challenges and Advancements in the Phenotyping of Japanese Quinces in Latvia

1
Institute of Horticulture, Graudu Iela 1, Ceriņi, Krimunu p., Dobeles reg., LV-3701 Dobele, Latvia
2
Medical Education Technology Centre, Rīga Stradiņš University, Anniņmuižas Bulvāris 26A, LV-1067 Riga, Latvia
3
Institute of Electronics and Computer Science, Dzērbenes Iela 14, LV-1006 Riga, Latvia
4
Division of Electronics and Embedded Systems, KTH Royal Institute of Technology, Brinellvägen 8, SE-11428 Stockholm, Sweden
*
Authors to whom correspondence should be addressed.
Horticulturae 2023, 9(12), 1347; https://doi.org/10.3390/horticulturae9121347
Submission received: 14 November 2023 / Revised: 11 December 2023 / Accepted: 15 December 2023 / Published: 17 December 2023
(This article belongs to the Special Issue Smart Horticulture: Latest Advances and Prospects)

Abstract

:
This study presents an innovative approach to fruit measurement using 3D imaging, focusing on Japanese quince (Chaenomeles japonica) cultivated in Latvia. The research consisted of two phases: manual measurements of fruit parameters (length and width) using a calliper and 3D imaging using an algorithm based on k-nearest neighbors (k-NN), the ingeniously designed “Imaginary Square” method, and object projection analysis. Our results revealed discrepancies between manual measurements and 3D imaging data, highlighting challenges in the precision and accuracy of 3D imaging techniques. The study identified two primary constraints: variability in fruit positioning on the scanning platform and difficulties in distinguishing individual fruits in close proximity. These limitations underscore the need for improved algorithmic capabilities to handle diverse spatial orientations and proximities. Our findings emphasize the importance of refining 3D scanning techniques for better reliability and accuracy in agricultural applications. Enhancements in image processing, depth perception algorithms, and machine learning models are crucial for effective implementation in diverse agricultural scenarios. This research not only contributes to the scientific understanding of 3D imaging in horticulture but also underscores its potential and limitations in advancing sustainable and productive farming practices.

1. Introduction

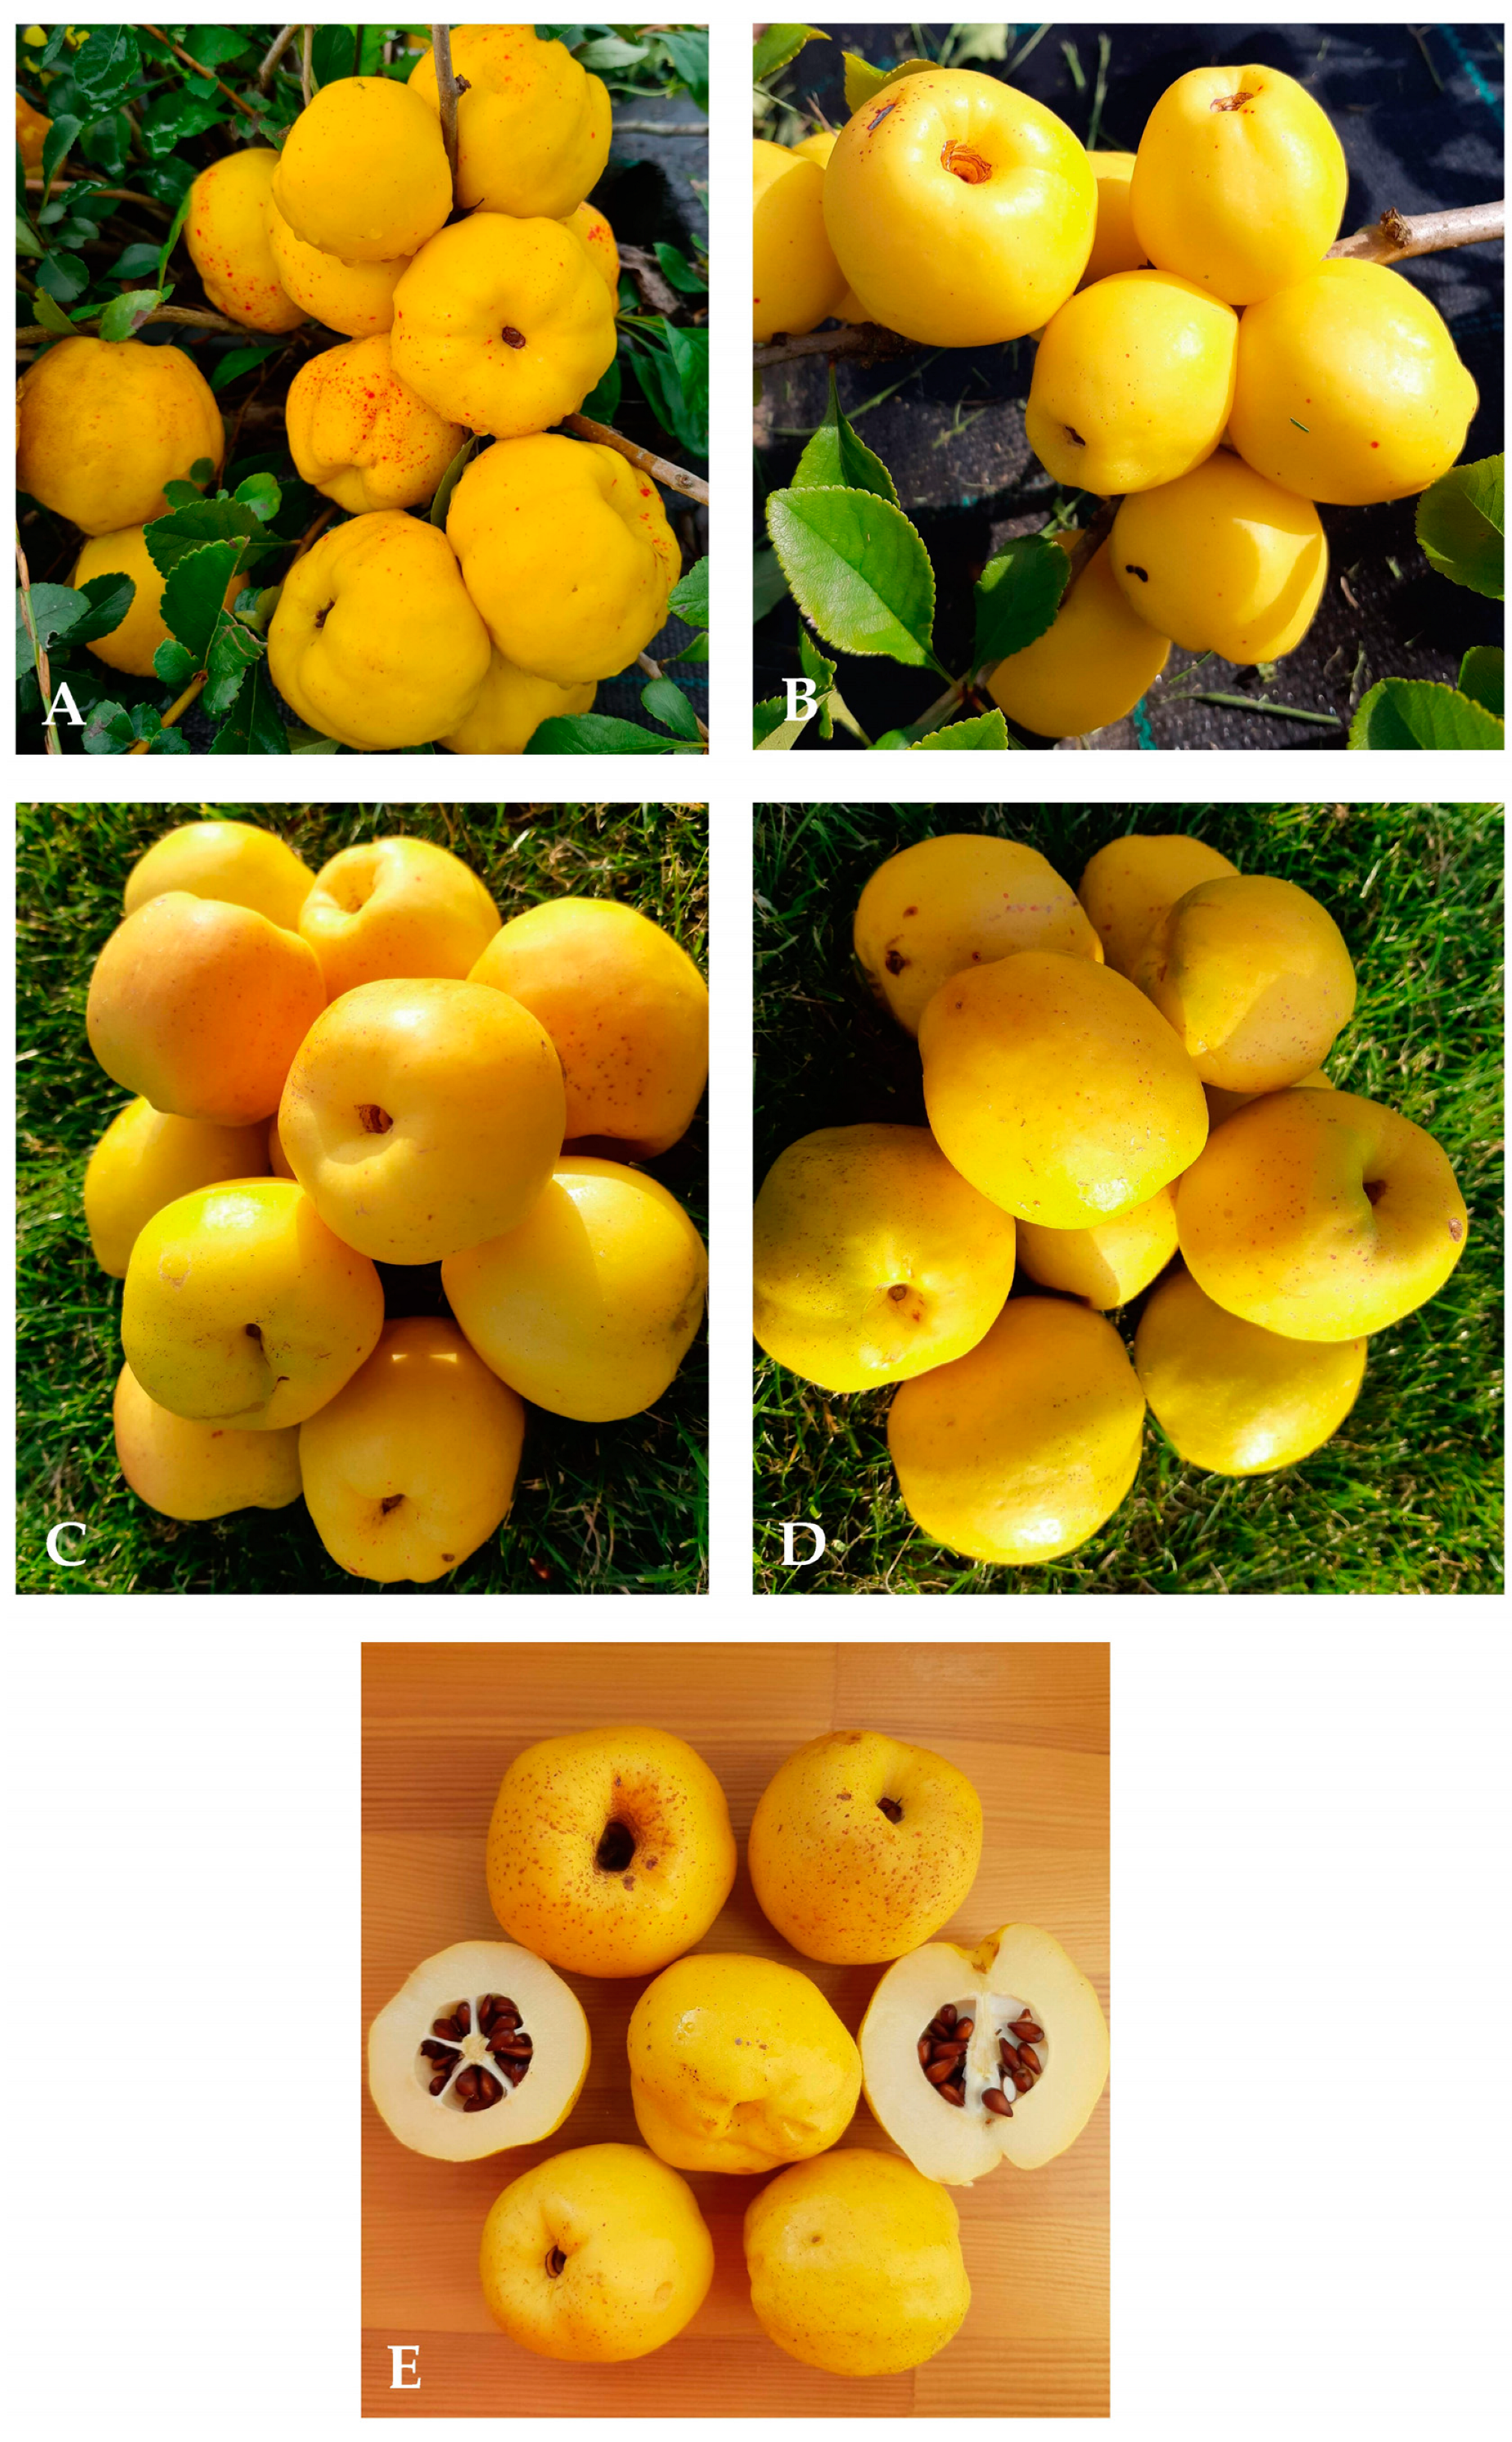
1.1. Japanese Quinces

Globally, the ornamental cultivation of the Chaenomeles species is widespread, with over 300 varieties being cultivated for aesthetic purposes in various regions, including Europe, Canada, and the United States. In contrast, the use of Chaenomeles japonica as an agricultural fruit crop is predominantly recognized in the Baltic nations and, to a lesser extent, in Scandinavia, Germany, and Poland. The fruits of this species, referred to here as CHAE, are noted for their significant biochemical composition, which encompasses a range of organic acids; sugars; phenolic compounds; vitamins, such as vitamin C; and amino acids, as well as essential minerals and trace elements. These components contribute to the fruit’s pronounced antioxidant properties [1,2,3,4].
In Latvia, systematic breeding of CHAE for fruit production began in the 1950s, with expansive plantations being established in the subsequent two decades. By the 1990s, the plantation area in Latvia had grown to about 300 hectares [5]. Initially, these commercial plantations were derived from seed-propagated plants, which exhibited considerable genetic variability. This heterogeneity resulted in less uniform and economically advantageous yields, compared to plantations established with selected vegetative cultivars. Despite large-scale fruit production, the lack of diversified processed products led to a decline in the industry [6,7]. However, in 2002, the Latvian Institute of Horticulture (LatHort) innovated and patented a method for producing candied CHAE fruit [8]. This new product has been adopted by over 20 companies, spurring the resurgence of CHAE commercial cultivation through exports. Notably, CHAE candied fruits have gained international market traction, with exports from companies like “Rāmkalni” SIA (Latvia, Krustiņi) extending to China and Australia, constituting 3–5% of their total production, which is about 10–15 tons monthly. Additionally, baby purees containing organically grown CHAE are now being exported to various countries, including Kuwait, Saudi Arabia, India, and Korea. These developments suggest a considerable, yet-to-be fully tapped global market potential for Japanese quince products. Presently, Japanese quince is a substantial commercial crop in Latvia, with cultivation areas expanding fourfold over the past six years to 706 hectares in 2022, indicative of its increasing popularity annually in Latvia and other Baltic Sea nations like Poland.
A new breeding initiative was launched in the 1990s at LatHort with the goal of developing CHAE cultivars suited to the Latvian climate, utilizing Ch. japonica due to its superior winter hardiness in the colder northern European climates [5]. Between 1998 and 2002, LatHort collaborated with Swedish and Lithuanian researchers to assess a diverse range of CHAE germplasms as part of the EU Project “Japanese quince (Chaenomeles japonica)—a New European Fruit Crop for Produce of Juice, Flavour and Fibre” (EUCHA)” [9]. CHAE plants have demonstrated considerable adaptability under various growing conditions, though the inheritance of desirable characteristics is not always guaranteed. The preferred attributes for prospective cultivars include robust winter hardiness of both the plants and their flower buds, absence of thorns, high and consistent yields, disease resistance, and superior fruit quality with rich biochemical content, coupled with early ripening and upright growth with minimal branching [10]. The fruit morphology of Japanese quince is notably varied [11], with some genotypes producing large, ribbed fruits and others displaying fruit shape polymorphisms, including both ribbed and smooth oval or round fruits on a single plant. This morphological diversity can fluctuate annually or may be due to genetic instability. Distinct differences in productivity, fruit quality, size, and biochemical composition have also been observed among different genotypes [12]. Following an assessment at LatHort, three cultivars—‘Rasa’, ‘Darius’, and ‘Rondo’—were selected and officially registered in Latvia. These varieties are distinguished by their high yield, fruit uniformity, and early to mid-September ripening times, with individual fruits typically weighing between 40–60 g [13].
In order to improve the quality of quince fruits and other parameters, the breeding work at LatHort continues. Plant phenotyping (description and evaluation) has always been a major field of research in plant breeding. To distinguish candidates for cultivars in fruit breeding, it is necessary to describe and evaluate the characteristics of several thousand seedlings. Traditional phenotyping methods (measuring the length and width of the fruit with a calliper and weighing) are used to characterize the size and shape of the fruit, which are very labor- and time-consuming [14]. Since several parameters are evaluated in points, the results can be relatively subjective, and results may differ among different evaluators.

1.2. Three-Dimensional Technologies in Plant Phenotyping

Over the past thirty years, advancements in capturing three-dimensional (3D) surface information from plants have revolutionized our understanding of plant architecture and growth [15,16,17]. The utilization of 3D measurement technologies provides invaluable insights into the structural development of plants, encompassing entire canopies, individual plants, and specific plant organs. This non-destructive method allows for ongoing monitoring over time, making it an integral part of plant phenotyping [18]. A key aspect of 3D measurement is its ability to distinguish actual growth from mere plant movement at both the plant and organ levels [19].
Plant phenotyping is an essential process that bridges the gap between genomic research and the practical agricultural traits of plants [20]. In this context, 3D measuring devices play a crucial role, offering precise measurements of plant geometry and growth. These devices employ a variety of techniques, including laser scanning, structure from motion (SfM), terrestrial laser scanning, structured light approaches, time-of-flight sensors, and light-field cameras. Each technology caters to different scales, from individual plants in laboratories to thousands of plants in experimental fields or open fields. The chosen technique depends on specific requirements, such as robustness, accuracy, resolution, and speed, essential for generating functional structural plant models, differentiating growth from movement, visualizing diurnal patterns, and assessing the impact of environmental stress on plant development [21,22,23].
All these technologies yield point clouds, where each point is defined by X, Y, and Z coordinates in a 3D space, and may include additional data like color or intensity, representing reflected light. Unlike 2.5D methods that measure from a single perspective, true 3D models incorporate point clouds from multiple viewpoints, offering less occlusion, higher spatial resolution, and greater accuracy. The resolution in these scans is defined as the minimal distance between points, while accuracy refers to the proximity between the real and measured points.
Active techniques include triangulation-based systems like laser triangulation (LT) and structured light (SL), as well as time-of-flight measurements, such as terrestrial laser scanning (TLS) and time-of-flight (ToF) cameras. Passive methods encompass light-field cameras (LF) and structure-from-motion (SfM) approaches.
The use of 3D technologies in plant phenotyping offers several advantages. These technologies enable the acquisition of multi-source phenotypic data throughout the entire crop-growing period, allowing for the extraction of various plant parameters, such as height, width, leaf length, leaf area, and inclination angle [24]. Additionally, 3D model-based methods permit the simultaneous extraction of multiple morphologic traits, including canopy height, plant volume, and leaf area index (LAI), while mitigating plant occlusion [25]. Low-cost 3D imaging devices have been shown to be highly reliable for plant phenotyping, with the potential to be implemented in automated application procedures, thus saving acquisition costs [18]. Furthermore, 3D reconstruction technology has been widely used to analyze crop phenotypes, offering a valuable tool for the development of digital agriculture [26].
However, there are also challenges and limitations associated with the use of 3D technologies in plant phenotyping. For instance, there are issues related to low accuracy, expensive equipment, and complicated operation in crop 3D reconstruction research, with recognition efficiency being determined, to a large extent, by the shading between crops [27]. The complexity of the analysis of 3D representations has been identified as a bottleneck hindering the wider deployment of 3D plant phenotyping [23]. Additionally, while 3D mesh analysis shows potential for accurately estimating specific morphological features and monitoring them over time, there is a need for further development and testing in the context of high-throughput plant phenomics [23]. Moreover, the complexity of the plant geometry being scanned significantly influences the computational power and resources needed for the scanning process, particularly when scanning intricate objects like leaves [28]. In this context, the employment of multispectral scanning, which integrates various sensors, such as thermal, LIDAR, NIR, RGB, and THz, has demonstrated superior efficiency, compared to monospectral scanning techniques [29].
In conclusion, the use of 3D technologies in plant phenotyping offers numerous advantages, including the acquisition of multi-source phenotypic data, simultaneous extraction of multiple morphologic traits, and cost-effectiveness. However, challenges such as low accuracy, complexity of analysis, and limitations in mesh analysis need to be addressed to fully leverage the potential of 3D technologies in plant phenotyping.
In this research, we employ structured light (SL) technology, which is widely used for imaging 3D data. SL employs specific patterns, such as grids or horizontal bars, in a defined temporal sequence. Each pattern change is captured by the camera. By using a predetermined camera–projector setup, the deformation of these patterns is measured to link 2D points with their corresponding 3D information [30,31]. SL setups, typically large and time-consuming in image acquisition, necessitate the movement of either the object or the measurement system for comprehensive coverage. Commonly implemented in industrial applications for reverse engineering or quality control, SL provides high resolution and accuracy within a substantial measurement volume [32].

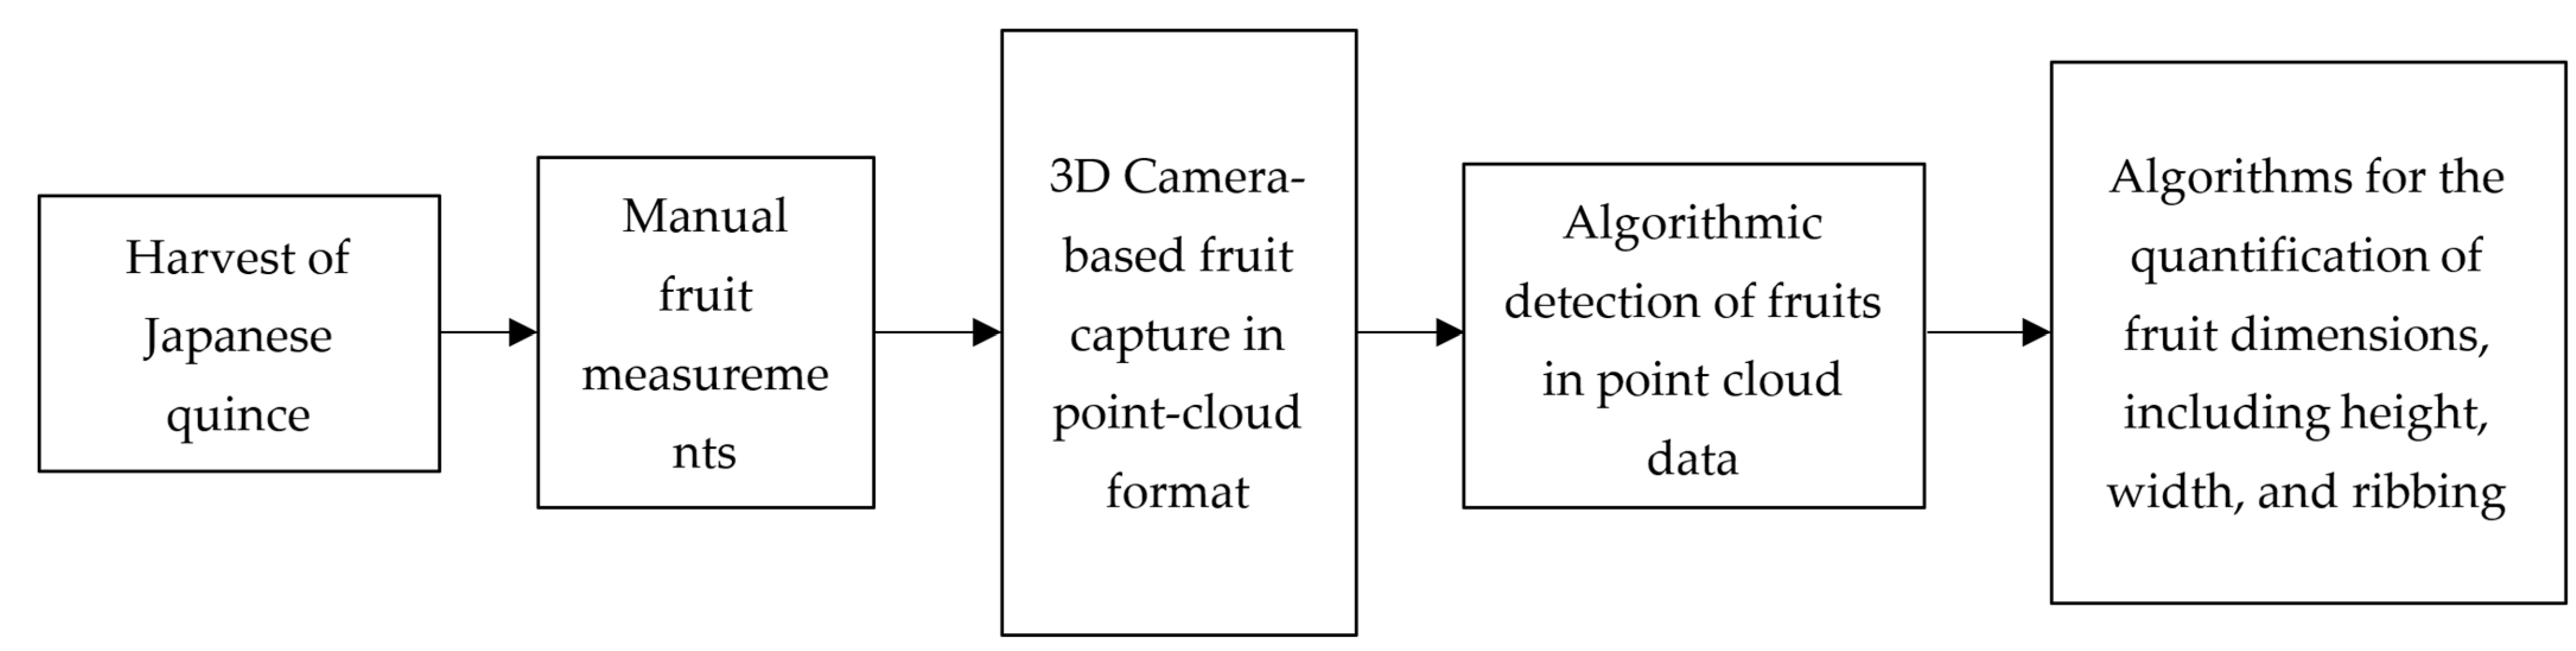
2. Materials and Methods

When conducting this study, a diverse array of software programs, programming languages, and libraries were employed to address various computational and analytical needs:
  • Jamovi (ver. 2.4) software: This was utilized for statistical computations [33].
  • R language: In addition to Jamovi, it was also employed for statistical analyses [34].
  • Python programming language: This was used for the development and implementation of algorithms.
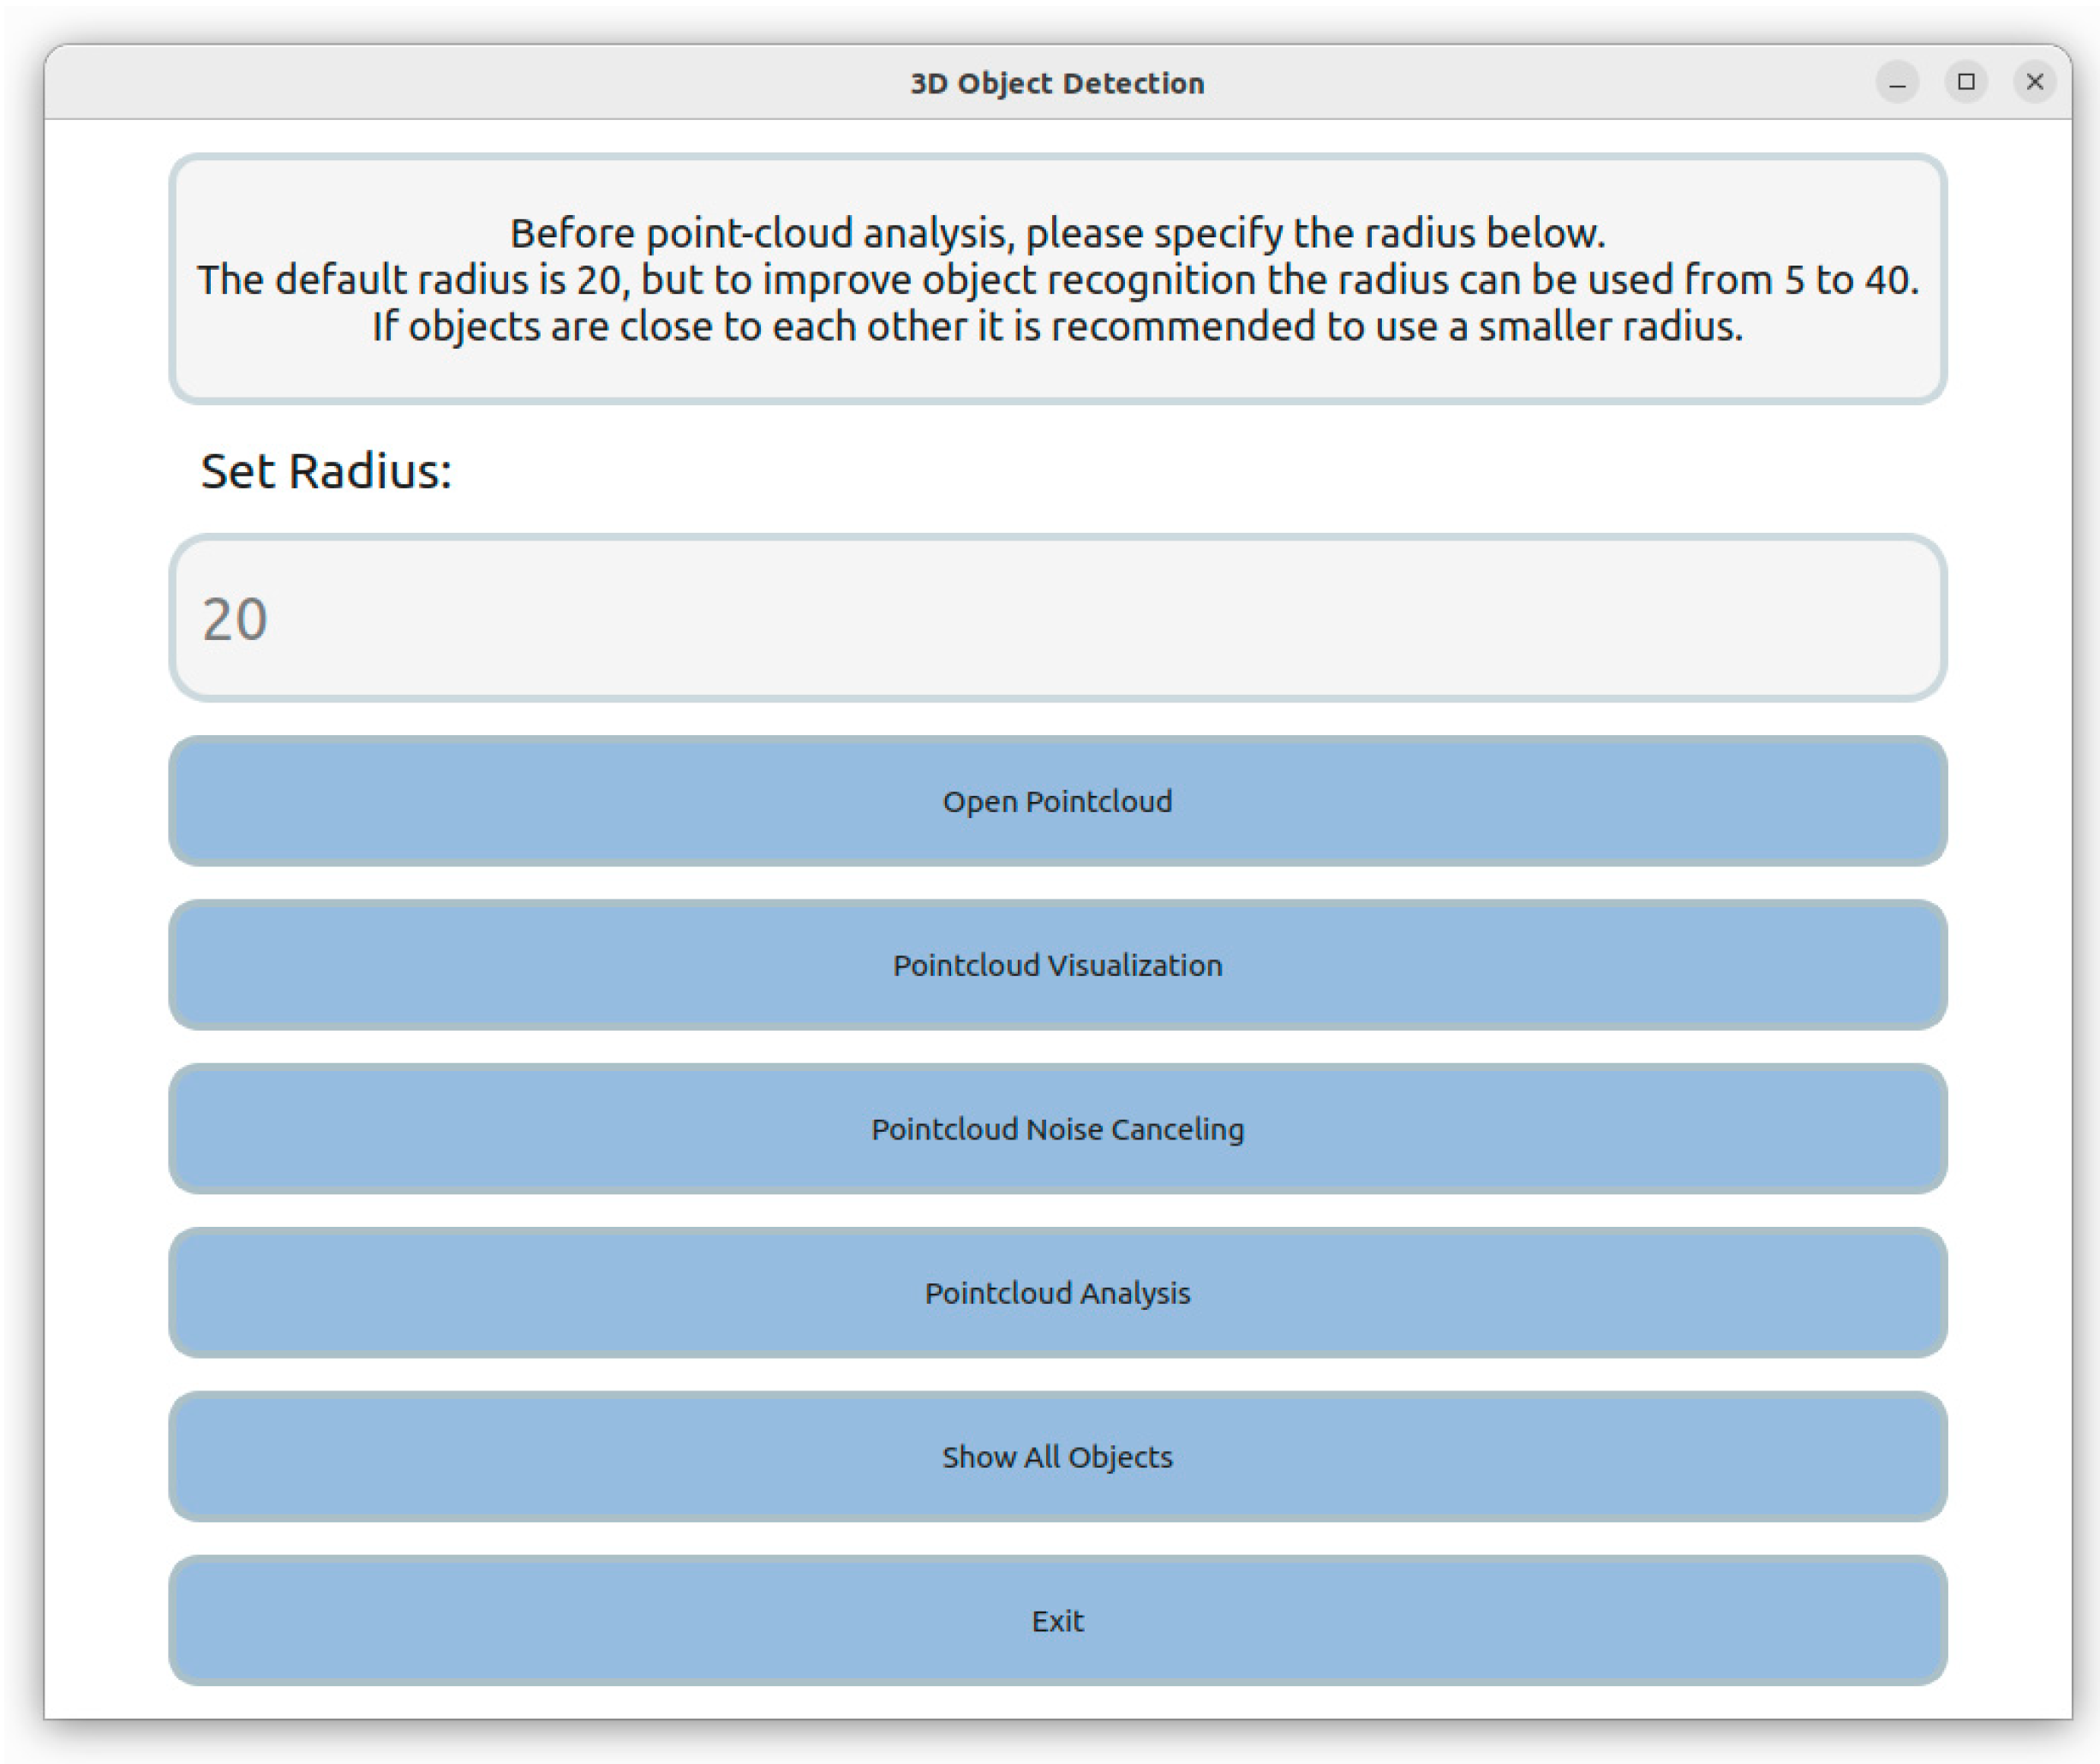
  • Libraries: Open3D (ver. 0.17) was pivotal in processing point cloud data, offering advanced functionalities for 3D modeling and object detection. NumPy (ver. 1.26) was used for data manipulation and computational tasks. PyQt5 (ver. 5.15.10) enabled the creation of intuitive graphical user interfaces.

2.1. Acquisition of Fruit Measurements Using the Manual Method

The study meticulously focused on Japanese quince fruits (Chaenomeles japonica) cultivated and harvested for analytical evaluation at LatHort, an orchard situated in Dobele within the southern region of Latvia. These fruits were strategically planted in the spring of 2019, with its precise geographical coordinates being WGS84 56°37′335″ N, 23°33′233″ E, ensuring a consistent and controlled environmental setting for growth.
In 2022, a comprehensive evaluation was conducted on eleven distinct genotypes of Chaenomeles japonica at LatHort. This assessment primarily revolved around two phenotypical parameters of the fruits: their length and width, both measured in millimeters. Notably, the width of each fruit was meticulously measured at its thickest point to ensure accuracy and consistency. This measurement process was conducted using a calliper.

2.2. Three-Dimensional Data Acquisition and Postprocess

In this study, Japanese quince samples were systematically arranged on a flat surface in a fixed position to ensure consistency in data capture. A key aspect for achieving optimal results was maintaining a fixed distance between the camera and the objects. The experiment involved placing 30 fruit samples on a plate arranged in a 4 × 8 grid, with each point cloud encompassing 30 samples of a particular species. In total, 22 point clouds were captured using the Zivid One+ Medium camera (Zivid, Oslo, Norway) positioned at a fixed location and operated via the Zivid Studio program [35]. Notably, every alternate point cloud represented a repeated capture of a specific fruit variety, leading to the analysis of 11 unique point clouds.
The Zivid One+ Medium camera is adept at capturing both RGB and depth information and is particularly suitable for small-to-medium objects within a range of 0.6 m to 2.0 m. The precision of this camera ranges from 0.06 mm to 1.0 mm, depending on the distance. This camera employs structured light 3D technology, an effective method for accurate 3D imaging. All captured point clouds were saved locally and, without any preliminary data processing, were directly loaded into the Python environment using the Open3D library for subsequent analysis.
This methodology harnesses the potential of three-dimensional point cloud data to facilitate precise measurements. The core of this system is anchored in the utilization of three sophisticated algorithms: the k-nearest neighbors algorithm (k-NN), the “Imaginary Square” algorithm, and a unique method involving object projection analysis on a reference plate.
  • The k-NN algorithm, renowned for its efficacy in pattern recognition [36], is specifically employed for color differentiation within the dataset. A fundamental prerequisite for the application of the k-NN algorithm is the initial training phase, wherein the algorithm is exposed to multiple color samples representative of the target object. This process is crucial for enabling the algorithm to discern and subsequently exclude background and irrelevant data points based on the defined color parameters of the object, in this case, Japanese quinces. For objects exhibiting a spectrum of colors, each distinctive hue is incorporated into the classification scheme to ensure comprehensive identification.
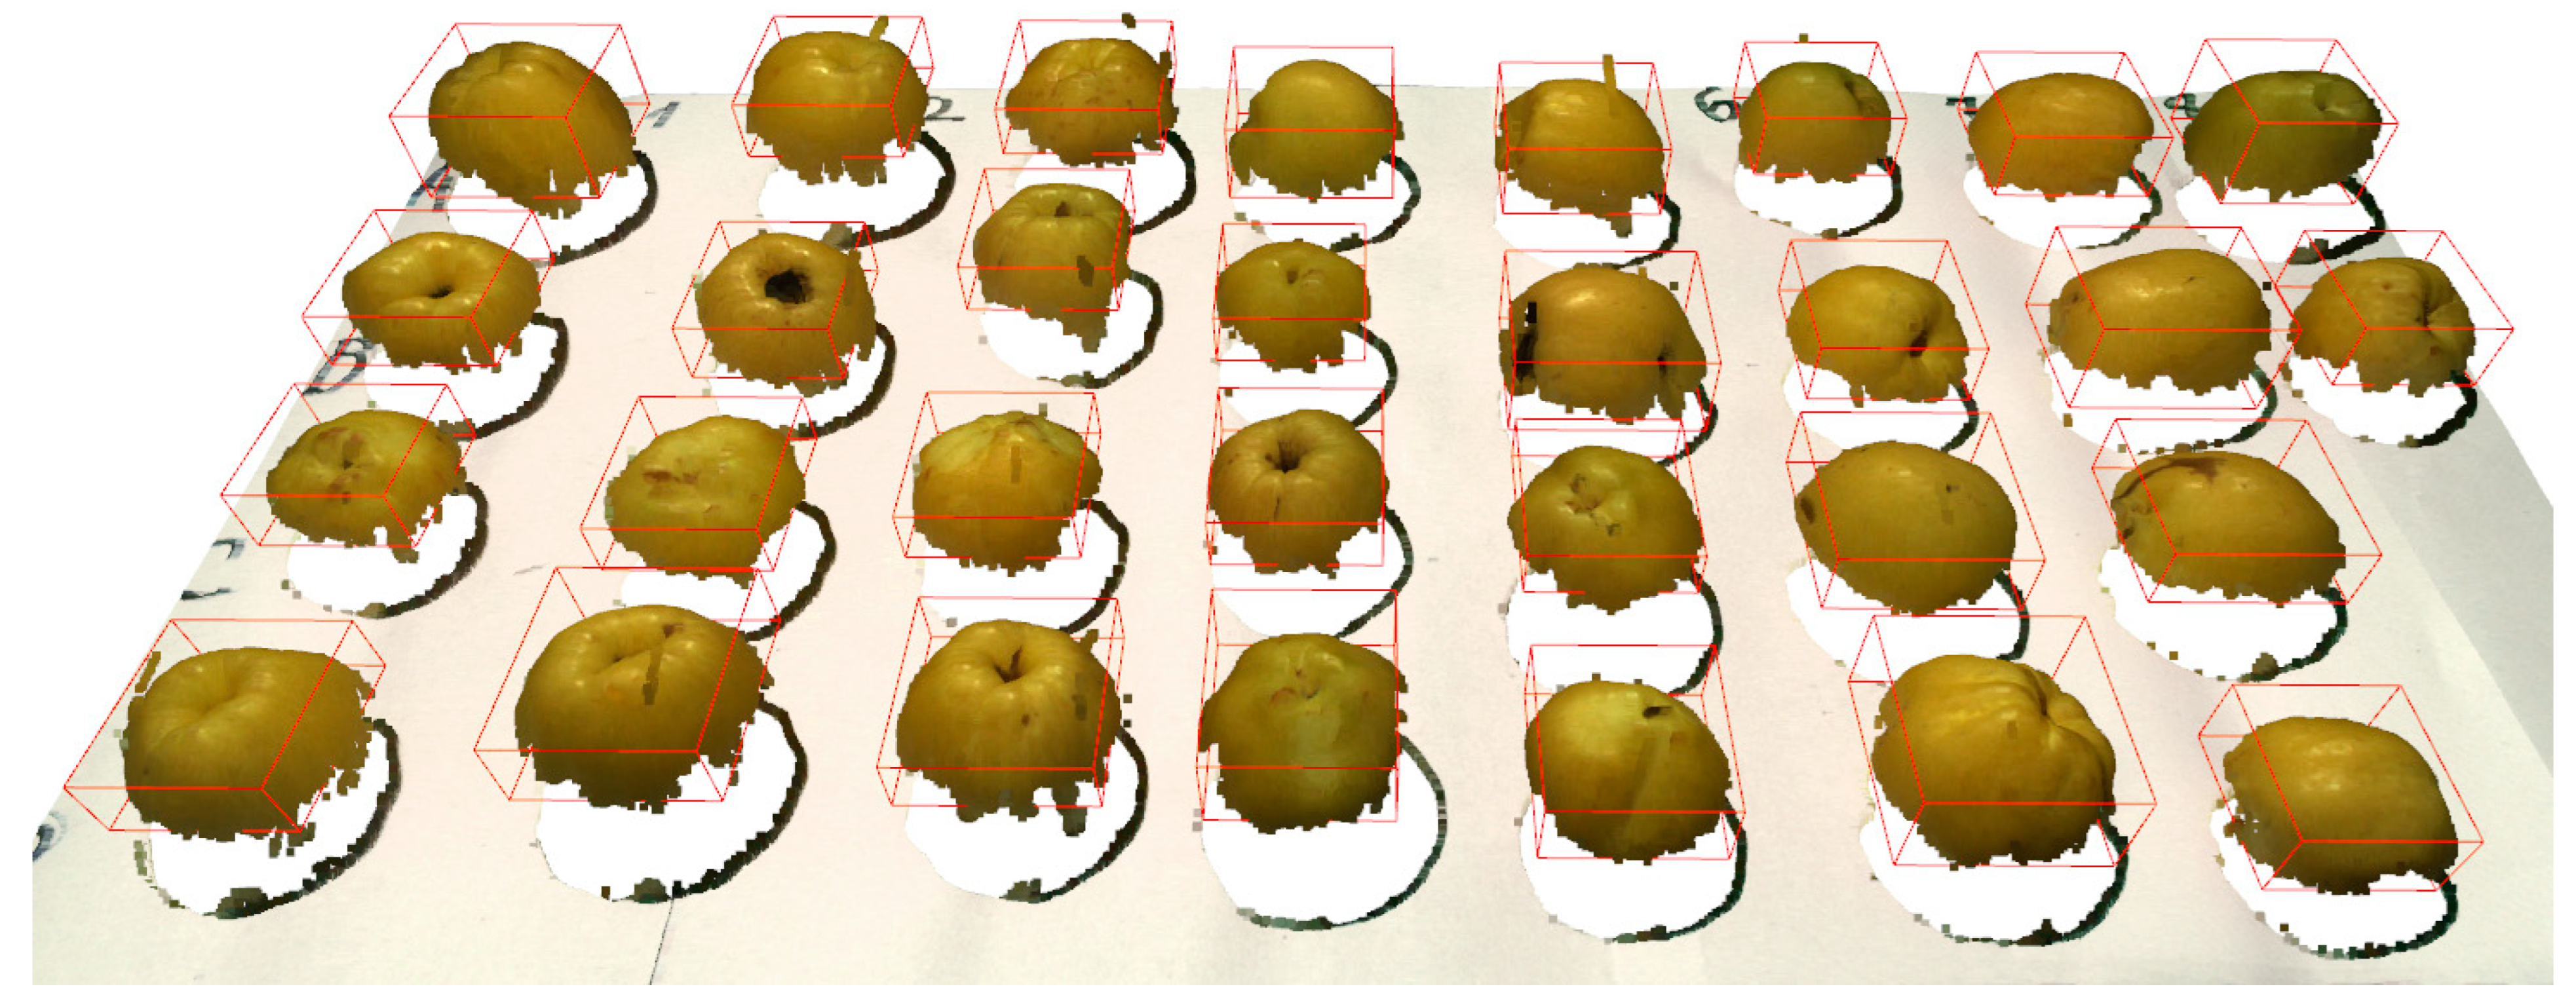
  • In scenarios involving multiple fruits within a single point cloud, the need for discrete object detection becomes paramount. The “Imaginary Square” algorithm is ingeniously designed to address this challenge. Initiated at the point of maximum ‘y’ value within the point cloud, this algorithm progressively expands a conceptual square, encompassing an increasing number of data points. The expansion of the square continues as long as a sequential increase in data points is observed. The termination of square growth occurs upon reaching a plateau in point increment, suggesting the potential identification of an object. However, if objects are in close proximity, the algorithm may erroneously perceive them as a singular entity. To circumvent this, defining an upper limit on the object size becomes essential, beyond which further expansion of the square is deemed unnecessary.
  • The third algorithm pivots on the concept of projecting the object onto a base plane. This is achieved by a reverse application of the k-NN algorithm, where the focus shifts from the object to the background. This reversal aids in the identification of outlier points delineating the base projection of the object. The inherent limitation of 3D imaging in capturing the area obscured by the fruit results in voids within the point cloud, which, in this context, represent the base projection of the fruit. The analysis commences in the region defined by the “Imaginary Square” algorithm, with each projection being scrutinized individually. This involves identifying the point with the maximum ‘y’ value on the projection perimeter and generating an ‘analysis point’ from which four vectors extend to the nearest perimeter points. This procedure, potentially iterated with slight adjustments to the analysis point, furnishes a detailed understanding of the projection’s perimeter, thereby inferring the spatial dimensions of the object situated above.
Such an integrated approach, combining color differentiation, spatial segregation, and projection analysis, presents a robust framework for accurately determining the dimensions of fruits, an advancement that holds significant promise in the field of precision agriculture. Scheme 1 illustrates the comprehensive pipeline for the phenotyping process.

2.3. Experiment Conditions and Specifications

Ambient light under perfect conditions for the 3D Zivid One+ camera (Table 1) was 0 lux. The brightness of the camera was high enough to ensure the capturing of a quality scene in any ambient light. Point clouds were not calibrated to physical units. We had to convert point cloud units to physical units (cm). Our task was to perform radiometric and geometric calibrations on the imagery to convert digital number (DN) values to reflectance values. This involved correcting for sensor-specific characteristics and atmospheric conditions. Plant size was computed based on the number of pixels after image classification.

3. Results

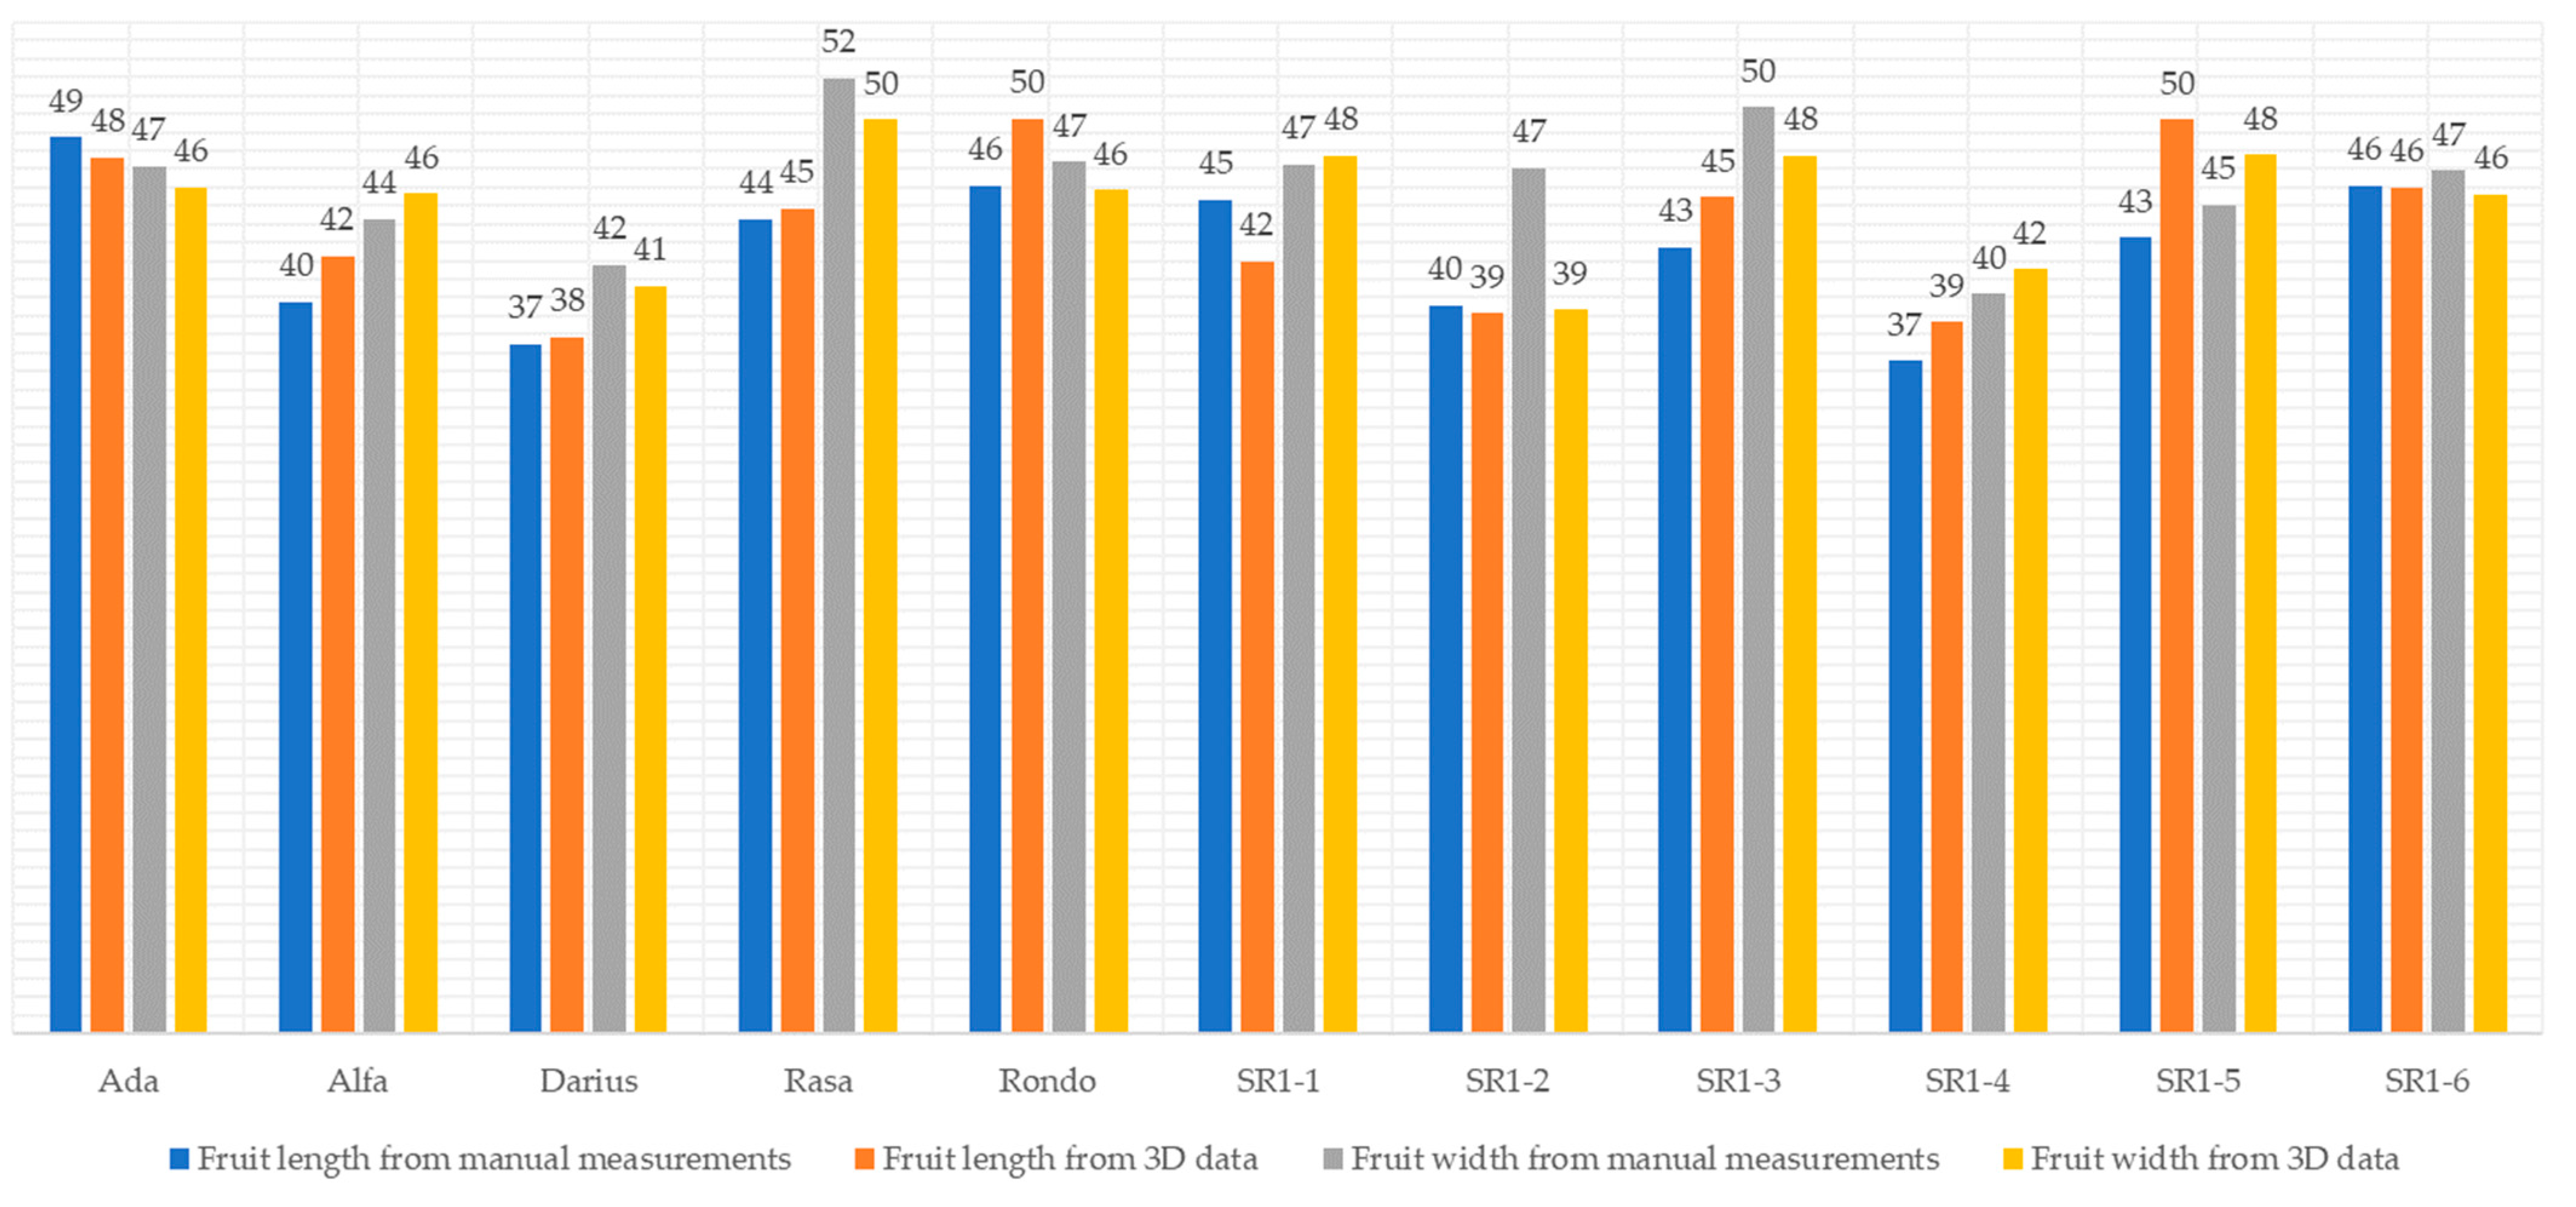
3.1. Characterization of Japanese Quince Fruit Parameters Using Manual Measurement Techniques

The evaluation of Japanese quince fruit parameters was conducted with the specific objective of acquiring comparative data to align with parameters derived from 3D imaging techniques. This exercise involved the meticulous manual measurement of key phenotypical parameters, which are closely related to the methodology employed in 3D analysis. These parameters were measured using traditional manual methods, specifically utilizing a calliper for precision. The detailed results of these manual measurements are systematically presented in Table 2. This comparative approach is instrumental in validating the accuracy and reliability of 3D imaging techniques by juxtaposing their results with those obtained through conventional manual measurement methods.
Furthermore, a diverse range of genetic phenotypes of fruits, encompassing varieties such as Ada, Alfa, Darius, Rasa, Rondo, and the SR1 series (SR1-1 through SR1-6), is vividly illustrated in Figure 1 and Figure 2 and extensively described in Table 3. Each of these phenotypes represents a unique genetic profile, offering a rich tapestry of variation within the species. To ensure consistency and optimal visual representation, all fruits were carefully photographed at the peak of their ripeness. This timing was meticulously chosen to capture the fruits in their fully matured state, thus providing a clear and accurate visual comparison of the different phenotypes.

3.2. Characterization of Japanese Quince Fruits Utilizing a 3D Imaging-Based Methodology

This section presents data acquired through 3D camera imaging, subsequently processed using the algorithms detailed in the Methodology section. The scans encompass the same species and quantity of fruits as those measured manually, ensuring a direct comparison. Statistical analyses of the 3D scanned and postprocessed data have been conducted to provide a comprehensive understanding of the fruits’ characteristics (Table 4).
In its turn, Table 5 presents a comparative analysis, showcasing the numerical differences between the ground truth—represented by manual measurements—and the data obtained through the 3D-based methodology. This table serves as a critical tool for evaluating the accuracy and precision of the 3D imaging technique in relation to traditional manual measurement approaches.
Figure 3 presents a concise visual comparison between manual measurements, which serve as the ground truth, and the data acquired from 3D imaging techniques. This juxtaposition effectively highlights the variances and correlations between these two measurement methodologies.
Figure 4 displays the distribution of points in the point cloud generated from the 3D scanner. Care was taken to place all fruits while maintaining a consistent distance between them, estimated visually. Additionally, efforts were made to preserve the same angle and orientation for each fruit wherever feasible, ensuring uniformity in the scanning process.
The program was developed to facilitate the automation of all preprocessing steps and associated calculations, as depicted in Figure 5.

4. Discussion

The analysis revealed that the data obtained from the 3D scanner, which was later utilized in calculations, unfortunately lacked the desired level of precision and accuracy when compared to the results from manual methodologies. It was evident that the effectiveness of 3D data calculations varied significantly among different species, with some experiencing a notably low rate of successful scans. This inconsistency in successful scanning adversely affected the algorithm’s ability to accurately calculate fruit length and width. Furthermore, the limited number of successful samples from the 3D scans had a substantial impact on the standard deviation, indicating variability in the data. A primary concern highlighted in this study is the low rate of successfully processed 3D data, particularly in terms of the final calculated parameters of the fruits. This issue underscores the need for further refinement of 3D scanning techniques to enhance their reliability and accuracy for such applications.
This study represents a pioneering effort in exploring the phenotyping of Japanese quince using 3D technologies, an area where modern research is notably sparse. The algorithms developed herein demonstrate promising potential; however, they require further refinement to match the efficiency and accuracy of traditional manual methods. The exploration should not be confined to the current methodologies alone. Incorporating additional novel 3D scanning techniques, along with the integration of artificial intelligence, could provide a more comprehensive insight into the most effective approaches for this specific species. This broader approach is critical for advancing our understanding and capabilities in precision agriculture, particularly for Japanese quince phenotyping [23]. However, the understanding of limitations within the study is paramount for a comprehensive understanding of the tool’s applicability and scope. Two primary constraints have been identified:
Inherent variability in fruit positioning: One of the salient limitations arises from the inability of the tool to uniformly calculate measurements for all fruits. This challenge is predominantly due to the variable positioning of fruits on the scanning platform. The irregular morphologies of different fruits often result in their placement at diverse angles on the scanning board, thereby complicating the uniformity of measurement. This angular variance can significantly affect 3D point cloud data interpretation, leading to potential discrepancies in dimensional assessment. The irregular orientation of the fruits introduces a degree of spatial heterogeneity that the current algorithmic framework struggles to normalize, thereby restricting the tool’s efficacy in uniformly measuring fruits with complex or asymmetrical shapes.
Proximity-induced measurement challenges: A second limitation pertains to the difficulty in accurately distinguishing and measuring individual fruits when they are in close proximity to one another. In instances where fruits are positioned adjacent to each other, the tool’s algorithms may erroneously interpret them as a singular entity. This conflation is primarily a consequence of the overlapping spatial data points in the 3D point cloud, which the system fails to segregate into distinct fruit entities. This limitation is particularly pronounced in densely packed fruit arrangements where the physical boundaries between adjacent fruits are minimal, leading to significant challenges in individual fruit identification and measurement.
It is crucial to enhance the algorithms to more accurately discern and measure fruits in varying spatial orientations and close proximities. This enhancement would involve refining the tool’s capabilities to differentiate individual fruits, even when they are clustered closely together or obscured by foliage and other environmental factors. Such refinements could include advanced image processing techniques, improved depth perception algorithms, and more sophisticated machine learning models that are trained on a diverse set of scenarios representing different fruit orientations and clustering patterns.
Moreover, the challenges of the use of 3D technologies in horticulture extend beyond just the algorithmic enhancements. These encompass a range of issues, such as the scalability of these technologies for large-scale agricultural settings, their integration with existing agricultural management systems, the cost-effectiveness of their deployment, and their robustness under different environmental conditions. Each of these aspects presents unique challenges that require dedicated research and development efforts [37]. Addressing these challenges is indeed critical to expanding the applicability and reliability of 3D scanning tools in a variety of fruit measurement scenarios. This will not only facilitate more accurate phenotyping and breeding decisions but also enhance yield estimation, quality control, and disease detection in agricultural practices. It will allow for more precise and efficient agricultural operations, ultimately contributing to sustainable and productive farming practices, as non-destructive measurement techniques are pivotal in fruit phenotyping, providing superior advantages over traditional destructive methods. Currently, our research necessitates harvesting the fruit for analysis, but we are actively working towards enhancing our methodologies to transition to non-destructive approaches allowing for non-invasive, repeated quality assessments of individual fruits, thereby reducing waste and enhancing efficiency [38]. In contrast to the time-consuming nature of destructive methods, non-destructive techniques facilitate rapid, accurate analysis of fruit internal quality, essential for maintaining consistent product standards [39]. The advent of advanced electronics and computing has spurred the development of diverse non-destructive tools like NIR, NMR, X-ray, computed tomography, and ultrasound, proving invaluable in commercial harvest, handling, distribution, and breeding programs for their cost-effectiveness and efficiency [40]. Additionally, the use of non-destructive spectroscopy for pigment assessment in supply chains exemplifies the broad applicability of these techniques in ensuring fruit quality across various stages. We are currently planning to adopt these innovative, non-destructive methods into our research, a move that could revolutionize fruit phenotyping by enabling more precise, efficient, and sustainable quality assessments and thereby significantly benefit postharvest processes and breeding programs.

Author Contributions

Conceptualization, S.S.; methodology, S.S., I.K., K.S. and E.K.; software, A.N.; validation, K.S.; formal analysis, K.S. and E.E.; investigation, I.N.; resources, S.S.; data curation, K.S.; writing—original draft preparation, E.K. and E.E.; writing—review and editing, K.S., S.S., I.K., E.K., E.E. and A.P.; visualization, E.E.; supervision, E.K.; project administration, S.S.; funding acquisition, S.S. All authors have read and agreed to the published version of the manuscript.

Funding

This research and APC were funded by the Latvian Council of Science, grant number lzp-2020/1-0353.

Data Availability Statement

The data presented in this study are available in https://pubgit.edi.lv/arturs.nikulins/object-detection-3D.

Conflicts of Interest

The authors declare no conflict of interest.

References

  1. Hellín, P.; Vila, R.; Jordán, M.J.; Laencina, J.; Rumpunen, K.; Ros, J.M. Charasteristics and Composition of Chaenomeles Fruit Juice. In Japanese Quince Potential Fruit Crop for Northen Europe; Department of Crop Science, Swedish University of Agricultural Sciences: Uppsala, Sweden, 2003; Volume 184, pp. 127–140. [Google Scholar]
  2. Krasnova, I.; Ruisa, S.; Segliņa, D. Investigations of the Biochemical Composition of Chaenomeles japonica Fruits. Cheminė Technol. 2007, 4, 16–20. [Google Scholar]
  3. Górnaś, P.; Siger, A.; Juhņeviča, K.; Lācis, G.; Šnē, E.; Segliņa, D. Cold-Pressed Japanese Quince (Chaenomeles japonica (Thunb.) Lindl. Ex Spach) Seed Oil as a Rich Source of α-Tocopherol, Carotenoids and Phenolics: A Comparison of the Composition and Antioxidant Activity with Nine Other Plant Oils. Eur. J. Lipid Sci. Technol. 2014, 116, 563–570. [Google Scholar] [CrossRef]
  4. Zvikas, V.; Urbanaviciute, I.; Bernotiene, R.; Kulakauskiene, D.; Morkunaite, U.; Balion, Z.; Majiene, D.; Liaudanskas, M.; Viskelis, P.; Jekabsone, A.; et al. Investigation of Phenolic Composition and Anticancer Properties of Ethanolic Extracts of Japanese Quince Leaves. Foods 2020, 10, 18. [Google Scholar] [CrossRef] [PubMed]
  5. Ruisa, S. Studies on Japanese Quince (Chaenomeles japonica) in Latvia; Department of Horticulture Plant Breeding, SLU Balsgard: Uppsala, Sweden, 1996; pp. 204–207. [Google Scholar]
  6. Rumpunen, K. Chaenomeles: Potential New Fruit Crop for Northern Europe. In Trends in New Crops and New Uses; Janick, J., Whipkey, A., Eds.; ASHS Press: Alexandria, VA, USA, 2002; pp. 385–392. [Google Scholar]
  7. Ruisa, S.; Lacis, G. Characterization of Chaenomeles japonica Genetic Resources. Hortic. Veg. Grow. 2001, 20, 50–60. [Google Scholar]
  8. Seglina, D.; Krasnova, I.; Heidemane, G.; Ruisa, S. Influence of Drying Technology on the Quality of Dried Candied Chaenomeles japonica during Storage. Latv. J. Agron. 2009, 12, 113–118. [Google Scholar]
  9. Rumpunen, K.; Kviklys, D.; Kauppinen, S.; Ruisa, S.; Tigerstedt, P.M. Breeding Strategies for the Fruit Crop Japanese Quince (Chaenomeles japonica); Department of Horticulture Plant Breeding, SLU Balsgard: Uppsala, Sweden, 2003; pp. 59–80. [Google Scholar]
  10. Rumpunen, K.; Kviklys, D. Combining Ability and Patterns of Inheritance for Plant and Fruit Traits in Japanese Quince (Chaenomeles japonica). Euphytica 2003, 132, 139–149. [Google Scholar] [CrossRef]
  11. Weber, C. Cultivars in the Genus Chaenomeles. Bull. Pop. Inf. Arnold Arbor. Harv. Univ. 1963, 3, 17–75. [Google Scholar]
  12. Ruisa, S.; Rubauskis, E. Evaluation of the Selected Genotypes of Chaenomeles japonica. In Proceedings of the International Scientific Conference “Environmentally Friendly Fruit Growing”, Tartu, Estonia, 7–9 September 2005; Volume 223, pp. 69–75. [Google Scholar]
  13. Kaufmane, E.; Ruisa, S. Breeding of New Cultivars of the Fruit Crop Japanese Quince (Chaenomeles japonica) in Latvia. Acta Horticult. 2020, 1281, 51–58. [Google Scholar] [CrossRef]
  14. Migicovsky, Z.; Gardner, K.M.; Money, D.; Sawler, J.; Bloom, J.S.; Moffett, P.; Chao, C.T.; Schwaninger, H.; Fazio, G.; Zhong, G.; et al. Genome to Phenome Mapping in Apple Using Historical Data. Plant Genome 2016, 9, plantgenome2015.11.0113. [Google Scholar] [CrossRef]
  15. Paulus, S.; Schumann, H.; Kuhlmann, H.; Léon, J. High-Precision Laser Scanning System for Capturing 3D Plant Architecture and Analysing Growth of Cereal Plants. Biosyst. Eng. 2014, 121, 1–11. [Google Scholar] [CrossRef]
  16. Paulus, S. Measuring Crops in 3D: Using Geometry for Plant Phenotyping. Plant Methods 2019, 15, 103. [Google Scholar] [CrossRef] [PubMed]
  17. Omasa, K.; Hosoi, F.; Konishi, A. 3D Lidar Imaging for Detecting and Understanding Plant Responses and Canopy Structure. J. Exp. Bot. 2006, 58, 881–898. [Google Scholar] [CrossRef] [PubMed]
  18. Paulus, S.; Dupuis, J.; Riedel, S.; Kuhlmann, H. Automated Analysis of Barley Organs Using 3D Laser Scanning: An Approach for High Throughput Phenotyping. Sensors 2014, 14, 12670–12686. [Google Scholar] [CrossRef] [PubMed]
  19. Dornbusch, T.; Lorrain, S.; Kuznetsov, D.; Fortier, A.; Liechti, R.; Xenarios, I.; Fankhauser, C. Measuring the Diurnal Pattern of Leaf Hyponasty and Growth in Arabidopsis—A Novel Phenotyping Approach Using Laser Scanning. Funct. Plant Biol. 2012, 39, 860. [Google Scholar] [CrossRef] [PubMed]
  20. Fasoula, D.A.; Ioannides, I.M.; Omirou, M. Phenotyping and Plant Breeding: Overcoming the Barriers. Front. Plant Sci. 2020, 10, 1713. [Google Scholar] [CrossRef] [PubMed]
  21. Chaudhury, A.; Boudon, F.; Godin, C. 3D Plant Phenotyping: All You Need Is Labelled Point Cloud Data. In Computer Vision—ECCV 2020 Workshops; Bartoli, A., Fusiello, A., Eds.; Lecture Notes in Computer Science; Springer International Publishing: Cham, Switzerland, 2020; Volume 12540, pp. 244–260. ISBN 978-3-030-65413-9. [Google Scholar]
  22. Boogaard, F.P.; Van Henten, E.J.; Kootstra, G. Improved Point-Cloud Segmentation for Plant Phenotyping through Class-Dependent Sampling of Training Data to Battle Class Imbalance. Front. Plant Sci. 2022, 13, 838190. [Google Scholar] [CrossRef] [PubMed]
  23. Harandi, N.; Vandenberghe, B.; Vankerschaver, J.; Depuydt, S.; Van Messem, A. How to Make Sense of 3D Representations for Plant Phenotyping: A Compendium of Processing and Analysis Techniques. Plant Methods 2023, 19, 60. [Google Scholar] [CrossRef]
  24. Guo, Q.; Wu, F.; Pang, S.; Zhao, X.; Chen, L.; Liu, J.; Xue, B.; Xu, G.; Li, L.; Jing, H.; et al. Crop 3D—A LiDAR Based Platform for 3D High-Throughput Crop Phenotyping. Sci. China Life Sci. 2018, 61, 328–339. [Google Scholar] [CrossRef]
  25. Sun, S.; Li, C.; Paterson, A.H.; Jiang, Y.; Xu, R.; Robertson, J.S.; Snider, J.L.; Chee, P.W. In-Field High Throughput Phenotyping and Cotton Plant Growth Analysis Using LiDAR. Front. Plant Sci. 2018, 9, 16. [Google Scholar] [CrossRef]
  26. Zhu, R.; Sun, K.; Yan, Z.; Yan, X.; Yu, J.; Shi, J.; Hu, Z.; Jiang, H.; Xin, D.; Zhang, Z.; et al. Analysing the Phenotype Development of Soybean Plants Using Low-Cost 3D Reconstruction. Sci. Rep. 2020, 10, 7055. [Google Scholar] [CrossRef]
  27. Ju, C.; Zhao, Y.; Wu, F.; Li, R.; Yang, T.; Zhong, X.; Yan, F.; Liu, T.; Sun, C. Three-Dimensional Reconstruction of Maize Plants and Extraction of Phenotypic Parameters Based on Laser Point Cloud Data. Rev. Square 2021. [Google Scholar] [CrossRef]
  28. Paproki, A.; Sirault, X.; Berry, S.; Furbank, R.; Fripp, J. A Novel Mesh Processing Based Technique for 3D Plant Analysis. BMC Plant Biol. 2012, 12, 63. [Google Scholar] [CrossRef]
  29. Zhang, Y.; Wu, J.; Yang, H.; Zhang, C.; Tang, Y. A Hierarchical Growth Method for Extracting 3D Phenotypic Trait of Apple Tree Branch in Edge Computing. Wirel. Netw. 2023. [Google Scholar] [CrossRef]
  30. Zhang, H.; Wang, L.; Jin, X.; Bian, L.; Ge, Y. High-Throughput Phenotyping of Plant Leaf Morphological, Physiological, and Biochemical Traits on Multiple Scales Using Optical Sensing. Crop J. 2023, 11, 1303–1318. [Google Scholar] [CrossRef]
  31. Gu, F.; Song, Z.; Zhao, Z. Single-Shot Structured Light Sensor for 3D Dense and Dynamic Reconstruction. Sensors 2020, 20, 1094. [Google Scholar] [CrossRef] [PubMed]
  32. Nguyen, T.; Slaughter, D.; Max, N.; Maloof, J.; Sinha, N. Structured Light-Based 3D Reconstruction System for Plants. Sensors 2015, 15, 18587–18612. [Google Scholar] [CrossRef] [PubMed]
  33. Haleem, A.; Javaid, M.; Singh, R.P.; Rab, S.; Suman, R.; Kumar, L.; Khan, I.H. Exploring the Potential of 3D Scanning in Industry 4.0: An Overview. Int. J. Cogn. Comput. Eng. 2022, 3, 161–171. [Google Scholar] [CrossRef]
  34. The Jamovi Project. Jamovi (Version 2.4) [Computer Software]; The Jamovi Project: San Diego, CA, USA, 2023. [Google Scholar]
  35. R Core Team. R: A Language and Environment for Statistical Computing; R Foundation for Statistical Computing: Vienna, Austria, 2021. [Google Scholar]
  36. Zivid Zivid Studio. Available online: https://www.zivid.com/zivid-studio-software (accessed on 14 November 2023).
  37. Uddin, S.; Haque, I.; Lu, H.; Moni, M.A.; Gide, E. Comparative Performance Analysis of K-Nearest Neighbour (KNN) Algorithm and Its Different Variants for Disease Prediction. Sci. Rep. 2022, 12, 6256. [Google Scholar] [CrossRef]
  38. Zhou, H.; Wang, X.; Au, W.; Kang, H.; Chen, C. Intelligent Robots for Fruit Harvesting: Recent Developments and Future Challenges. Precis. Agric. 2022, 23, 1856–1907. [Google Scholar] [CrossRef]
  39. Li, B.; Lecourt, J.; Bishop, G. Advances in Non-Destructive Early Assessment of Fruit Ripeness towards Defining Optimal Time of Harvest and Yield Prediction—A Review. Plants 2018, 7, 3. [Google Scholar] [CrossRef]
  40. Huang, Y.; Ren, Z.; Li, D.; Liu, X. Phenotypic Techniques and Applications in Fruit Trees: A Review. Plant Methods 2020, 16, 107. [Google Scholar] [CrossRef] [PubMed]
Scheme 1. Phenotyping pipeline utilizing 3D camera technology for Japanese quinces.
Horticulturae 09 01347 sch001
Figure 1. Genotypes of Japanese quince species: Ada (A), Darius (B), Rasa (C), Rondo (D), SR 1-1 (E), and SR 1-2 (F).
Horticulturae 09 01347 g001
Figure 2. Genotypes of Japanese quince species: SR1-3 (A), SR 1-4 (B), SR 1-5 (C), SR 1-6 (D), and Alfa (E).
Horticulturae 09 01347 g002
Figure 3. Comparative analysis of fruit parameters: manual versus 3D data-based measurement techniques for length and width assessments (mm).
Horticulturae 09 01347 g003
Figure 4. Volumetric data of various Japanese quince species captured using a 3D camera.
Horticulturae 09 01347 g004
Figure 5. Graphical user interface (GUI) of the developed program based on PyQt5.
Horticulturae 09 01347 g005
Table 1. Zivid One+ camera specifications.
Projector brightness0.25x to 1.8x; 1x = 400 lumens
The field of view angle0 (Directly above)
Resolution1920 × 1200 (2.3 Mpixel), Native 3D Color
Point cloud output3D (XYZ) + Color (RGB) + SNR
Exposure time (minimum per pattern projection)6.5 ms
Focus distance1000 mm
Optimal working distance700 to 1500 mm
Camera distance from objects1000 mm
Field of view702 × 432
Spatial resolution0.37 mm and 3.71 × 10⁻⁴ mm per distance (z)
Capture time200 ms
Point precision in Euclidian distance110 µm
Local Planarity Precision in Euclidian distance190 µm
Table 2. Measurements of Japanese quince fruits using the manual method.
GenotypeFruit Length (mm)Fruit Width (mm)
NAda3030
Alfa3030
Darius3030
Rasa3030
Rondo3030
SR1-13030
SR1-23030
SR1-33030
SR1-43030
SR1-53030
SR1-63030
MedianAda4947
Alfa4044
Darius3742
Rasa4452
Rondo4647
SR1-14547
SR1-24047
SR1-34350
SR1-43740
SR1-54345
SR1-64647
Standard deviationAda43
Alfa32
Darius44
Rasa44
Rondo64
SR1-163
SR1-233
SR1-344
SR1-443
SR1-543
SR1-643
Table 3. Characterization of Japanese quince fruits.
GenotypeAverage Fruit Weight (g)Maximum Fruit Weight (g)Characteristics of the Fruit
SR1-153130Round and slightly flattened with a smooth surface, exhibiting mild ribbing and a notably deep inflorescence.
SR1-24578Bright yellow and homogeneous in appearance, these are barrel-shaped with significant puncture and rust characteristics.
SR1-364122Dark yellow, round, and slightly flattened; characterized by prominent red dots and brown dotted rust; they also display a ribbed texture.
SR1-43471Predominantly bright yellow, round, and barrel-shaped, with some assuming a pear-shaped (pyriform) form. They have a very smooth surface and are mostly free from puncture.
SR1-542110Yellow, round, and barrel-shaped with a smooth texture; slight ribbing at the tip, aesthetically pleasing, and with a few red dots; near the inflorescence, there is slight brown rust.
SR1-656105Smooth, attractive, and yellow, varying from round or oval, to bottle-shaped. Some exhibit pronounced red dots and slight russeting in the form of small brown dots or stripes.
Rasa4875Yellow and rounded, exhibiting mild ribbing. In some years, they assume a pear-shaped (pyriform) appearance.
Darius3445Oblong and yellow, characterized by a smooth and homogeneous surface.
Rondo5267Yellow and oblong, featuring a deep flower bed and generally homogeneous in appearance.
Ada5578Dark yellow with a pink wreath, oblong, and maintaining a homogeneous texture.
Alfa5367Yellow with pronounced rust spots, rounded, slightly ribbed, and featuring a deep flower bed.
Table 4. Characterization of Japanese quince fruits utilizing a 3D imaging-based methodology.
GenotypeFruit Length (mm)Fruit Width (mm)
NAda1919
Alfa1919
Darius1515
Rasa2323
Rondo2020
SR1-11616
SR1-22929
SR1-32525
SR1-42929
SR1-51717
SR1-62929
MedianAda4846
Alfa4246
Darius3841
Rasa4550
Rondo5046
SR1-14248
SR1-23939
SR1-34548
SR1-43942
SR1-55048
SR1-64646
Standard deviationAda34
Alfa34
Darius24
Rasa55
Rondo106
SR1-126
SR1-237
SR1-334
SR1-444
SR1-536
SR1-653
Table 5. Comparative analysis of fruit dimensions: manual calliper-derived ground truth measurements versus 3D data estimations for length and width across various genotypes.
GenotypeFruit Length (mm)Fruit Width (mm)
MedianAda−23
Alfa−30
Darius−22
Rasa0−1
Rondo−72
SR1-13−2
SR1-226
SR1-3−32
SR1-4−2−3
SR1-5−5−5
SR1-601
Standard deviationAda43
Alfa54
Darius36
Rasa54
Rondo136
SR1-155
SR1-246
SR1-343
SR1-434
SR1-545
SR1-653
Disclaimer/Publisher’s Note: The statements, opinions and data contained in all publications are solely those of the individual author(s) and contributor(s) and not of MDPI and/or the editor(s). MDPI and/or the editor(s) disclaim responsibility for any injury to people or property resulting from any ideas, methods, instructions or products referred to in the content.

