Article

Nutritional Quality and Antioxidant Properties of Brown and Black Lentil Sprouts

by
Theodoros Chatzimitakos
,
Vassilis Athanasiadis
*,
Ioannis Makrygiannis
,
Konstantina Kotsou
,
Dimitrios Palaiogiannis
,
Eleni Bozinou
and
Stavros I. Lalas
Department of Food Science & Nutrition, University of Thessaly, Terma N. Temponera Str., GR-43100 Karditsa, Greece
*
Author to whom correspondence should be addressed.
Horticulturae 2023, 9(6), 668; https://doi.org/10.3390/horticulturae9060668
Submission received: 3 April 2023 / Revised: 3 May 2023 / Accepted: 2 June 2023 / Published: 5 June 2023
(This article belongs to the Special Issue Bioactivity of Horticultural Crops and Extracts)

Abstract

:
Lentils are known to be an integral part of a nutritionally balanced diet. Their sprouts are considered even more nutritional since they contain phytonutrients that confer health benefits. As such, incorporating them into a human diet can be advantageous. In this study, seeds from brown and black lentils were germinated aiming to study the changes in their nutritional value after they were grown for different amount of days to different lengths. Since the sprouts can be consumed at various stages of their growth, four growth stages were studied. For each stage, three batches were grown, and one sample of each batch was randomly picked and analyzed in triplicates. The sprouts were examined for their nutritional value. To this end, their content of proteins and carbohydrates was determined, as well as their content in carotenoids and vitamin C. Moreover, emphasis was placed on the phytochemical compounds contained in the sprouts. As results indicate, lentil sprouts not only exhibit high nutritional value but they are also rich in antioxidant compounds. More specifically, an increase of up to 18.8% in the protein content was recorded for 15 cm length sprouts (compared to lentil seeds), accompanied by a decrease in the carbohydrate content of up to 68.9%. Carotenoids and vitamin C content increased up to 224% and 389%, respectively. Additionally, a 34% increase in the polyphenol content was recorded. Moreover, a direct correlation between sprout length and nutritional value was observed, using principal component analysis (PCA) and multivariate correlation analysis (MCA).

1. Introduction

As the impact of diet on overall health becomes increasingly evident, there is a growing interest in finding innovative food and nutritional approaches that promote healthy lifestyles. While established guidelines on proper nutrition and physical activity exist, individuals face difficulties. Thus, the development and promotion of new food sources, technologies, and approaches can assist individuals in achieving a healthier lifestyle [1].
Germinating seeds have become increasingly popular among health-conscious consumers seeking optimal nutrition [2]. Once germinated, sprouts offer a higher nutritional value and better digestibility than their corresponding seeds [3]. Germination is a process where a vegetable seed, legume, or cereal grows into a seedling, resulting in major modifications in nutritional and biochemical characteristics [4]. Germination can also improve the quality of seeds by enhancing digestibility and reducing anti-nutritive compounds [2,5]. Germinated seeds are rich in phytochemicals, including flavonoids and phenolic acids, that have important biological activities with potential health benefits in the prevention of cancer, cardiovascular diseases, and other ailments [6]. Therefore, sprouts have been a subject of growing interest in the field of human nutrition [2,7]. Sprouts are increasingly recognized as an important component of a healthy and balanced diet due to the above and can be considered “functional food” [3,8]. When sprouts are left to grow more, they are called microgreens and can be even more nutritious, compared to sprouts [9,10]. Lentils are a particularly noteworthy example of sproutable seeds due to their high protein content, low caloric value, and abundance of essential nutrients, including folate, vitamin C, and fiber [11,12]. Lentils are also low in fat and have a low glycemic index, which makes them a great food choice for weight loss and weight management [13]. Compared to other legumes and cereals, lentils also contain a significant amount of polyphenolic compounds [4,8].
Sprouting lentils’ nutritional profile is further enhanced [7,11]. During the sprouting process, the seeds undergo significant biochemical and nutritional changes, resulting in a higher nutrient density and bioavailability [14,15]. Sprouting also increases the amount of enzymes, which aids in the digestion and absorption of nutrients [16]. The components of lentil sprouts (LS) are essential for human health. LS are rich in essential nutrients such as protein, dietary fiber, and complex carbohydrates, which play a vital role in maintaining healthy bodily functions [11]. Furthermore, LS are an excellent source of plant-based protein, which makes them an ideal addition to a vegetarian or vegan diet. Protein is crucial for building and repairing tissues in the body. Plant-based sources of protein, such as LS, are particularly beneficial as they are typically lower in saturated fat and higher in fiber than animal-based sources [17]. The high fiber content in LS can help promote digestive health, and the complex carbohydrates present in them can aid in maintaining healthy blood sugar levels. Therefore, the incorporation of LS into the diet can be an effective way to support overall health and well-being. In addition, LS are an excellent source of antioxidants [18]. Antioxidants are compounds that neutralize free radicals that can cause damage to cells and tissues in the body [2]. The high antioxidant content of LS is attributed to the presence of polyphenolic compounds and vitamin C. The antioxidant activity of LS has been shown to have several potential health benefits [18]. Antioxidants have been found to play a key role in the prevention of chronic diseases such as cancer, cardiovascular diseases, and diabetes [19]. The high antioxidant content of LS may also help to the protection against oxidative stress (oxidative stress occurs when there is an imbalance between the production of free radicals and the ability of the body to neutralize them), which is a major contributor to the aging process [20]. The polyphenolic compounds and the other phytochemicals contained in the LS have also been shown to have a range of other health benefits, including anti-inflammatory, anti-diabetic, and anti-microbial properties [10,21].
LS are a cost-effective and convenient source of plant-based nutrients that can be easily produced at home with minimal equipment [22]. As such, they have been incorporated into various recipes [22]. However, the duration of the sprouting process is not fixed, and as such, biochemical changes that can alter their nutritional value occur [22]. To the best of our knowledge, the reports regarding the changes in the nutritional value of LS and microgreens at different growth ages are scant and sparse. The aim of this study is to examine the changes in the nutritional value of LS and microgreens (referred to as LS from this point on, including the microgreens (grown at 15 cm)), grown to different lengths. The 15 cm length was selected for two main reasons. First of all, lentils are considered mature plants when the length is between 15–20 cm. As such, leaving the sprouts to grow more would result in bigger plants that would no longer be considered sprouts. Moreover, above 15–20 cm, stems would start becoming thicker, making them less appealing for consumption. Secondly, the plants grown above 15 cm were fragile and the stems could easily be broken. Moreover, the sprouts were examined at lengths of 3, 7, 11, and 15 cm as representative stages of lentil sprout growth. The length of 3 cm represents the early stage of sprout growth, while 15 cm represents the late stage of growth. The other selected lengths (7 cm and 11 cm) are in between these stages, providing a range of samples that capture the different stages of growth. For this study, emphasis was placed on the most prevalent compounds contained in the sprouts. In addition, their antioxidant properties were also examined in order to determine the most beneficial growth stage of them.

2. Materials and Methods

2.1. Chemicals and Reagents

All solvents used were of HPLC grade and purchased from Carlo Erba (Val-de-Reuil, France). Gallic acid, sodium anhydrous carbonate, 2,2-diphenyl-1-picryl-hydrazyl (DPPH), 2,4,6-tri-2-pyridinyl-1,3,5-triazine (TPTZ) and Folin–Ciocalteu reagent were received from Penta (Prague, Czech Republic). Hydrochloric acid, Bradford reagent, iron (III) chloride, ascorbic acid, β-carotene, sulfuric acid, phenol, D(+)-glucose, sodium hydroxide, protocatechuic acid, catechin, syringic acid, naringin, naringenin, kaempferol 3-O-β-rutinoside, coumaric acid, and trichloroacetic acid were purchased from Sigma-Aldrich (Steinheim, Germany). For all experiments, deionized water was used.

2.2. Lentils Germination and Sample Preparation

Lentils (Vicia lens (L.) Coss. & Germ.), brown and black colored, were purchased from a local market (Karditsa, Greece). For the preparation of the LS, the lentil seeds were first washed thoroughly with tap water. Next, the lentils were placed between sheets of paper tissue, frequently wetted with tap water, and allowed to grow at a temperature of 28/18 °C (day/night) under 3–6 h of direct sunlight (lentils were placed next to a window so that sunlight was dropping directly onto them) each day. LS were harvested at 3 ± 0.2, 7 ± 0.3, 11 ± 0.4, and 15 ± 0.5 cm (after 8, 11, 14, and 19 days, respectively). Lentil seeds served as the control sample (0 cm). Three batches of LS were grown (approximately 1000 lentil seeds per batch) for each lentil type and one sample from each batch was picked (resulting in a total of three samples per condition/length). In all cases, the plant material (or the seeds) was frozen at −40 °C and placed in a Biobase BK-FD10P freeze dryer (Jinan, China) to remove water. The dried samples were pulverized and placed in sieves to be separated according to their particle size. For all experiments, LS powder with particles <400 μm was used (the use of plant material with small particle size maximizes the extraction yield, providing more information about the content of the plant in various bioactive compounds [23,24]).

2.3. Crude Protein Content Determination

The Bradford assay was used to determine the protein content of the samples, according to our previous study [25]. The proteins were extracted by adding 10 mL of distilled water to 1 g of the sample and stirring the mixture at 500 rpm for 1 h at room temperature. Prior to extraction, the pH of the distilled water was adjusted to 12 using a 1 M NaOH solution. After the extraction, the mixture was centrifuged at 3600× g for 5 min at room temperature, and the supernatant was collected. This step was repeated three times in total, and the supernatants were combined. To measure the protein content, 100 μL of the combined supernatants were added to an Eppendorf tube, and 900 μL of Bradford reagent was added. After vortexing for 30 s, the samples were incubated for 10 min at room temperature in the absence of light. The absorbance of the samples was then measured at 595 nm using a spectrophotometer (Shimadzu UV-1700 PharmaSpec Spectrophotometer, Kyoto, Japan). A standard calibration curve (range: 0–750 mg/L, equation: y = 0.0013x + 0.0035, R2 = 0.9986) was prepared using bovine serum albumin.

2.4. Carbohydrates Content Determination

The phenol/sulfuric acid assay was employed to determine the carbohydrate content of the samples [25]. To extract the carbohydrates, 1 g of the sample was mixed with 10 mL of distilled water and stirred at 500 rpm for 1 h at 50 °C. The mixture was then centrifuged at 3600× g for 5 min at room temperature, and the resulting supernatant was collected. A volume of 0.22 mL of the supernatant was mixed with 0.65 mL of sulfuric acid and 0.13 mL of 5% w/v phenol solution in distilled water, in a plastic tube. The mixture was heated in a water bath at 90 °C for 5 min and then allowed to cool for 5 min at room temperature. The absorbance of the resulting solution was measured at 495 nm using a spectrophotometer. A calibration curve (range: 0–125 mg/L, equation: y = 0.012x − 0.0505, R2 = 0.9979) was generated using D(+)-glucose as a standard.

2.5. Fat Content Determination

The fat content of the LS was calculated after Soxhlet extraction with petroleum ether for 4 h.

2.6. Fatty Acid Composition

According to Commission Regulation (EC) No 796/2002 (Annex XB) [26], the fatty acid content of the samples was determined by making the appropriate fatty acid methyl esters (FAMEs). FAMEs were analyzed according to a previous study [27]. In brief, 0.1 g of extracted fat was diluted with 2 mL of n-hexane. Then, 0.2 mL of 2 M methanolic potassium hydroxide solution was added and the mixture was vortexed for 1 min. Finally, the mixture was left until the phases were separated. Analysis was performed on a GC coupled to a flame ionization detector (FID). A gas chromatograph model 7890A manufactured by Agilent Technologies (Santa Clara, CA, USA), with a capillary column Omegawax (30 m × 320 m × 0.25 m) (Supelco, Bellefonte, PA, USA). The carrier gas was helium (flow rate was 1.4 mL/min). The temperature program was: 5 min at 70 °C, then increase with a rate of 20 °C/min up to 160 °C, ramped with a rate of 4 °C/min up to 200 °C, and finally, with a rate of 5 °C/min up to 240 °C. Temperatures for the injector and FID were set at 240 and 250 °C, respectively. The makeup flow of helium is 50 mL/min, the flow rate for hydrogen is 50 mL/min, and the flow rate for air is 450 mL/min. Sample injection was carried out by injecting 1 μL of the sample with a split ratio of 1:100. The Supelco 37-Component FAME Mix (Supelco, Bellefonte, PA, USA) reference standards were used for the identification of the compounds.

2.7. Carotenoids Content Determination

The estimation of carotenoid content was carried out using a previously reported method [25]. The extraction step involved adding 10 mL of ethanol to 1 g of each sample and stirring for 30 min at 300 rpm at room temperature. The mixture was then placed in an ice bath for 5 min with intermittent shaking, followed by centrifugation for 5 min at 3600× g. The resulting extract was used to determine the carotenoid content by measuring its absorbance at 450 nm and by using a standard β-carotene calibration curve (range: 0–50 mg/L, equation: y = 0.0182x + 0.0119, R2 = 0.9982).

2.8. Vitamin C Content Determination

To determine the vitamin C content, a modified chromatometric assay was employed [25]. Initially, 5 g of ground LS sample was placed in a beaker, and 27 mL of distilled water:methanol mixture (60:40, v/v) and 3 mL of 10% w/v trichloroacetic acid solution were added sequentially. The mixture was then vortexed for 1 min and 20 mL of hexane was added. After stirring for 30 min at room temperature, the mixture was centrifuged at 3600× g for 5 min. The lower aqueous phase was transferred to a centrifugal tube and centrifuged again for 10 min at 10,000× g. In an Eppendorf tube, 1 mL of the aqueous layer was combined with 0.5 mL of Folin–Ciocalteu reagent (10% v/v), and the mixture was left for 10 min at room temperature. The absorbance was measured at 760 nm and quantification was carried out using a calibration curve (range: 0–100 mg/L, equation: y = 0.0139x + 0.0015, R2 = 0.9994) prepared with ascorbic acid.

2.9. Total Polyphenol Content (TPC) Determination

To determine the total polyphenol content (TPC) of the extracts, a previously reported method was followed [28]. The extracts of LS (prepared as described in Section 2.8) were mixed with an equal amount of Folin–Ciocalteu reagent and left for 2 min. Afterward, 800 μL of Na2CO3 solution (5% w/v) was added and the mixture was incubated for 20 min at 40 °C in the absence of light. The absorbance was measured at 740 nm to determine the TPC, which was expressed as mg of gallic acid equivalents (GAE) per g of dry weight (dw), using a standard calibration curve (range: 0–100 mg/L, equation: y = 0.0138x − 0.0044, R2 = 0.9996) with gallic acid, the concentration of total polyphenol (CTP) was determined. To calculate the extraction yield of total polyphenols (YTP), the following Equation (1) was used:
Y TP   ( mg   GAE / g   dw ) = C TP   ×   V w
where V represents the volume of the extraction medium (in L) and w represents the dry weight of the sample (in g).

2.10. DPPH Free Radical Scavenging Activity

Determination of the DPPH radical scavenging activity was carried out based on our previous study [28]. In brief, 25 μL of the sample was mixed with 975 μL of DPPH solution (100 μM) in an Eppendorf tube. The absorbance of the solution was measured immediately upon mixing (A515(i)) and after 30 min (A515(f)) at 515 nm. Equation (2) was used to calculate the antiradical activity (AAR):
A AR   ( μ mol   DPPH / g   dw ) = Δ A ε   ×   l   ×   C   ×   Y TP
where ΔA = A515(i)A515(f); ε (DPPH) = 11,126 × 10−6 μΜ−1 cm−1; C = CTP × 0.025; YTP is the total polyphenol yield of the extract (mg/g), and l is the path length (1 cm).

2.11. Ferric Reducing Antioxidant Power (FRAP) Activity

Determination of the FRAP activity was carried out based on our previous study [28]. First, 0.05 mL of FeCl3 solution (4 mM in 0.05 M HCl) was added to an equal volume of the sample (prepared as described in Section 2.8) and incubated for 30 min at 37 °C. Next, 0.90 mL of TPTZ solution (1 mM in 0.05 M HCl) was added, and after 5 min, the absorbance was measured at 620 nm. Ascorbic acid was used as the standard compound to create a calibration curve (CAA) (range: 0–500 μmol/L, equation: y = 0.001880x + 0.000123, R2 = 0.9996). The results of ferric reducing antioxidant power (PR) were expressed as μmol of ascorbic acid equivalents (AAE) per g dw using Equation (3):
P R   ( μ mol   AAE / g   dw ) = C AA   ×   V w
where V is the volume of the extraction medium (in L) and w is the dry weight of the sample (in g).

2.12. Hydrogen Peroxide (H2O2) Scavenging Activity

A previously reported method was applied for the H2O2 scavenging activity [29]. In an Eppendorf tube, 400 μL of the extract was added along with 600 μL of H2O2 solution (40 mΜ, prepared in phosphate buffer, pH 7.4). The absorbance at 230 nm was recorded after 10 min. The capacity to scavenge the H2O2 was expressed as:
%   Scavenging   of   H 2 O 2 = A o ( A     A c ) A o   ×   100
where Ao, Ac, and A are the absorbance of the blank solution, and the extract solution in the absence of hydrogen peroxide and sample, respectively.
Anti-hydrogen peroxide activity (AAHP) was determined as μmol ascorbic acid equivalents (AAE) per g of dw, using an ascorbic acid calibration curve (CAA, 50–500 µmol/L in 0.05 M HCl), using the following equation:
A AHP   ( μ mol   AAE / g   dw ) = C AA   ×   V w
where V is the volume of the extraction medium (in L) and w is the dry weight of the sample (in g).

2.13. HPLC Analysis

Analysis of the polyphenolic compounds contained in the LS samples was carried out according to our previous study [30]. Analysis was performed using a Shimadzu CBM-20A liquid chromatograph and a Shimadzu SPD-M20A diode array detector (both provided by Shimadzu Europa GmbH in Duisburg, Germany). The separation of the compounds was achieved using a Phenomenex Luna C18(2) column (100 Å, 5 μm, 4.6 × 250 mm) from Phenomenex Inc., Torrance, CA, USA maintained at 40 °C. The mobile phase consisted of 0.5% aqueous formic acid (A) and a mixture of 0.5% formic acid in acetonitrile/water (6:4) (B). The gradient program used was as follows: 0% B to 40% B, then to 50% B in 10 min, to 70% B in another 10 min, and then held constant for 10 min. The flow rate of the mobile phase was 1 mL/min. The retention time and absorbance spectrum were compared to those of pure chemical standards to identify the compounds and then quantified using calibration curves (0–50 μg/mL). Additional information is provided in Table 1 and representative chromatograms are given in Figure 1.

2.14. Colorimetry

The color of the LS extracts was determined using a colorimeter (Lovibond CAM-System 500, The Tintometer Ltd., Amesbury, UK). The sample extracts, in an Eppendorf tube, were transferred to the colorimeter for CIELAB color determination. Two color coordinates, a* and b*, and the psychometric index of lightness, L*, were defined. The colorimetric parameter Chroma   ( C a b * ) was also determined as follows:
C a b * = ( a * ) 2 + ( b * ) 2

2.15. Statistical Analysis

Three batches of lentil sprouts were germinated for black and brown lentil seeds. Each time the sprouts reached the desired length, a random sample was taken, resulting in a total of three samples per sprout, per length. Each sample was analyzed three times for each assay. Therefore, a total of 9 measurements were carried out and used to produce statistical data. The results were expressed as mean values of the nine measurements ± standard deviation (SD). To examine whether the results are normally distributed, the Kolmogorov–Smirnov test was carried out (data were not found to be normally distributed). Statistically significant differences (p < 0.05) between the samples were assessed using the Kruskal-Wallis test and Dunn’s test as a post hoc test. The statistical analyses were performed using SPSS (version 29) software from SPSS Inc., located in Chicago, IL, USA. The principal component analysis (PCA) and multivariate correlation analysis (MCA) were carried out using JMP® Pro 16 software (SAS, Cary, NC, USA).

3. Results and Discussion

In this study, the length of the sprouts was used as a proxy for the time of growth, as the length of the sprouts was directly related to the number of days they were grown. While it is true that some sprouts may have grown faster or slower than others, using length as a measure of time was a reliable, repeatable, and practical way to collect data.

3.1. Nutritional Composition of LS

The first parameter examined was the protein content of LS. Generally, as LS grow, their protein content may increase slightly, although this increase may be offset by water absorption and metabolic processes. As shown in Table 2, in both cases, the protein concentration of LS increases as the sprouts grow longer. The brown lentil seeds were found to contain 17.66% protein and the black lentil seeds contained 17.94% protein, which is within the typical range for lentil seeds [31,32]. However, as the lentil seeds germinate and grow into sprouts of increasing length, the protein concentration appears to increase. In the case of brown LS, sprouts that were 3 cm long had an increased protein concentration of 3.2% (not a statistically significant difference (p > 0.05), compared to the control). As the LS grew longer, the protein concentration continued to increase, with the 15 cm long LS having an increased protein concentration of 18.75% (a statistically significant difference (p < 0.05), compared to the control). Likewise, in the case of black LS (15 cm long), an increase in the protein content of 18.8% (a statistically significant difference (p < 0.05), compared to the control) was recorded. The above suggests that longer sprouting times result in greater protein concentration in LS, while the protein increase was found to be independent of the lentil species. This increase in protein concentration during sprouting may be due to several factors. As the LS grow, they undergo metabolic processes that break down complex proteins into simpler forms [31]. Additionally, sprouting can increase the availability of certain amino acids that are essential for protein synthesis [33].
Another important nutritional parameter is fat. Results about the fat content of LS at various growth lengths can be seen in Table 2, while changes in the percentages of fatty acids are given in Table 3. As can be seen, both for brown and black LS, a decrease in fat content is observed as the length of the LS increases. During the germination process, the fat content of lentil seeds can slightly decrease due to the breakdown of fats into other components required for sprout growth. As the sprouts grow, the fat content may continue to decrease due to the utilization of fats as an energy source for sprout growth [15]. As regards the fatty acids, an increase in the SFA content was recorded, along with an overall decrease in the content of unsaturated fatty acids. This decrease can be attributed to the hydrolysis that takes place during germination, aiming to produce energy for metabolic alterations [34]. This results in a decrease in the PUFA:SFA ratio. However, as regards the ω-6:3 ratio, it can be seen that most samples are close to the recommended value of 4 [35].
The next parameter examined was the carbohydrate content of the LS. Results can be seen in Table 2. As the LS grow, their carbohydrate content decreased. This decrease was found to be different for the two examined varieties. Brown LS had a higher percentage decrease in carbohydrate content than black LS for each length of sprouting time. During germination, enzymes are activated and begin breaking down complex carbohydrates, such as starch, into simpler forms such as glucose and fructose. This breakdown of complex carbohydrates into simpler forms makes them more available for energy production in the sprouting lentil. As a result, the total carbohydrate content of LS may decrease during germination. As regards the differences recorded between the two varieties, they may be attributed to the different activity of the activated enzymes.
Aside from the main nutrients described above, another important aspect is the content of vitamins. Vitamin A is an essential micronutrient that plays a vital role in several physiological processes, including vision, immune function, and cell differentiation [36]. The human body can obtain vitamin A from animal sources, such as liver, egg yolks, and dairy products, or plant sources in the form of provitamin A carotenoids. Carotenoids are natural pigments synthesized by plants, algae, and some bacteria. These compounds are responsible for the yellow, orange, and red colors of many fruits and vegetables [37]. In addition to their role as pigments, carotenoids are also important dietary antioxidants that protect against oxidative damage. Once ingested, carotenoids are converted into retinol, the active form of vitamin A. Lentil sprouts are a rich source of carotenoids. This is highlighted by the results depicted in Table 2. As can be seen, the carotenoid content of lentil sprouts was found to increase during the germination process. This increase in the carotenoid content can be attributed primarily to the stored carotenoids in the seed coat of lentils. During sprouting, the breakdown of this protective layer occurs, releasing the carotenoids into the sprout. Moreover, carotenoids play an important role in photosynthesis and act as antioxidants, protecting the plant from oxidative damage. Thus, sprouts can produce more carotenoids in response to light or other stressors, as a way to protect themselves from damage [37,38].
Vitamin C is another important nutrient for humans. Its consumption is mandatory since humans are not able to synthesize it. It acts as an antioxidant and plays a role in various physiological processes, such as collagen synthesis and immune function [39,40]. Legumes are excellent sources of vitamin C, while sprouted seeds are considered even better [22]. This is in accordance with our results (Table 2). The increase in vitamin C content during sprouting can be attributed to several factors. Firstly, sprouting involves the activation of enzymes which can lead to the breakdown of vitamin C-inactivating compounds such as phytic acid. Secondly, sprouting involves the mobilization of stored nutrients in the seed, which can include vitamin C. Finally, sprouting can stimulate the synthesis of vitamin C as part of the stress response of the plant to environmental conditions [5,12,41,42].

3.2. Total Polyphenol Content (TPC), Antioxidant Activity, and Color Measurement of LS Extracts

Aside from the nutritional value, LS were also examined in terms of TPC, as well as antioxidant activity (using the FRAP, DPPH, and H2O2 assays). Results are presented in Table 4. Moreover, changes in the individual polyphenolic compounds are given in Table 5. As can be seen, the TPC increased as the sprouting time increased for both brown and black LS, with the highest increase observed at 15 cm length. The TPC of brown LS increased by 34.2% and black lentil sprouts by 29.8% at 15 cm length, compared to the initial values. During germination, enzymes such as amylase and protease are activated, leading to the breakdown of complex carbohydrates and proteins into simpler compounds such as sugars and amino acids. This process is accompanied by an increase in the activity of enzymes involved in the biosynthesis of polyphenolic compounds, such as phenylalanine ammonia-lyase, which leads to the formation of a wide range of polyphenolic compounds [6,43,44]. This is strengthened by our findings, since compounds such as protocatechuic acid, catechin, coumaric acid, and naringin are constantly produced during sprouting, with an increase in their concentration, along with an increase in the sprout’s length. On the contrary, the concentrations of syringic acid and kaempferol 3-O-β-rutinoside exhibited minor variations during the sprouting period. Additionally, the decrease in the concentrations of gallic acid and naringenin can be attributed to the binding of the compounds to cell wall components [45]. The FRAP values also increased significantly as the sprouting time increased for both brown and black LS, with the highest increase observed at the length of 15 cm. The FRAP values of brown LS increased by 71.1% and black lentil sprouts by 89.9% at the length of 15 cm compared to the initial values. The increase in FRAP values during sprouting could be attributed to the increased content of polyphenols, as well as the increased content of vitamin C and carotenoids. Likewise, the DPPH radical scavenging activity increased as the sprouting time increased for both brown and black LS, with the highest increase observed at the length of 15 cm. The DPPH values of brown LS increased by 87.7% and black LS by 53.6% at the length of 15 cm compared to the control sample. Additionally, in this case, the increased scavenging activity can be attributed to the increased content of antioxidant compounds (vitamin C, carotenoids, and polyphenols). As regards the anti-hydrogen peroxide activity of the LS, a concomitant increase in the activity was recorded, as the length of the LS was growing. More specifically, the anti-hydrogen peroxide activity of brown LS increased by 160% and black LS by 162% at the length of 15 cm compared to the control sample, respectively. Based on the above, it is concluded that the germination process increases significantly the antioxidant potential of lentils, rendering LS more beneficial for human health.
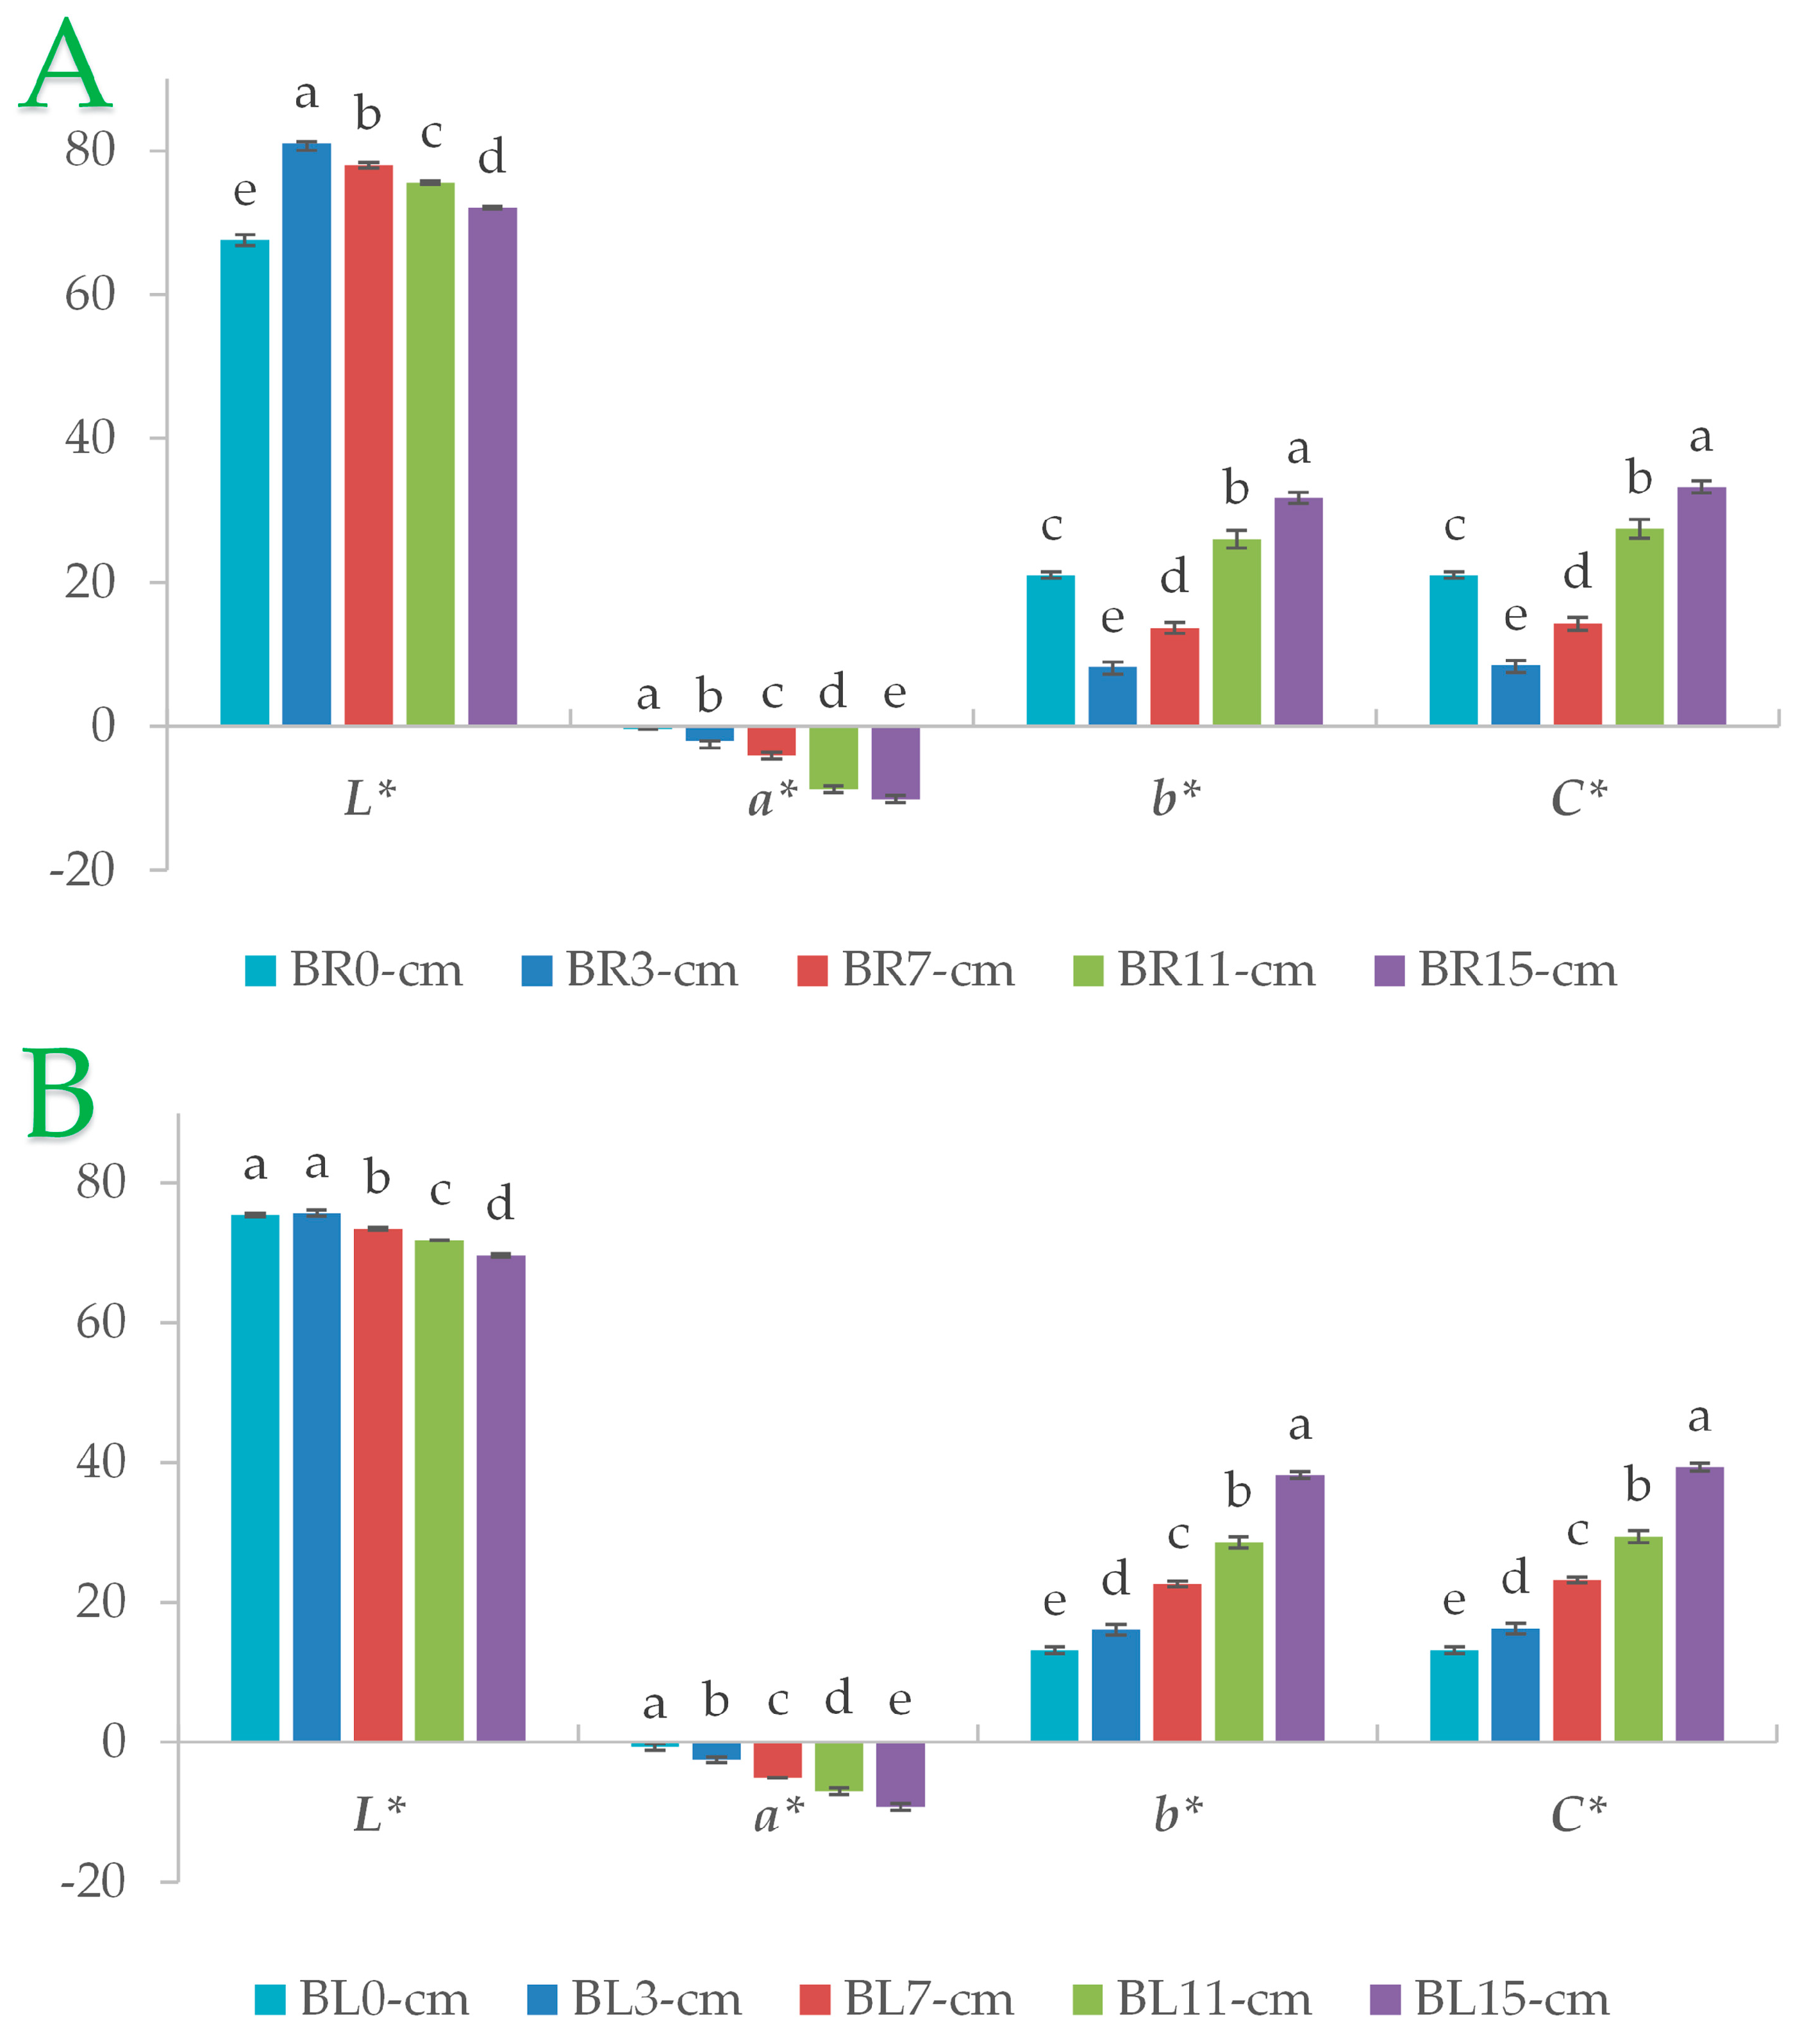
Regarding the color measurement (Figure 2), the lightness (L*) of the lentil sprout extracts produced at various lengths was getting darker as the sprout length was increasing. Further, color coordinates a* and b* demonstrated that when the LS is grown, the color turns greener (a*) and yellower (b*). Furthermore, it was discovered that the LS was more colorful when growing at various lengths by measuring the Chroma ( C a b * ) or color density.
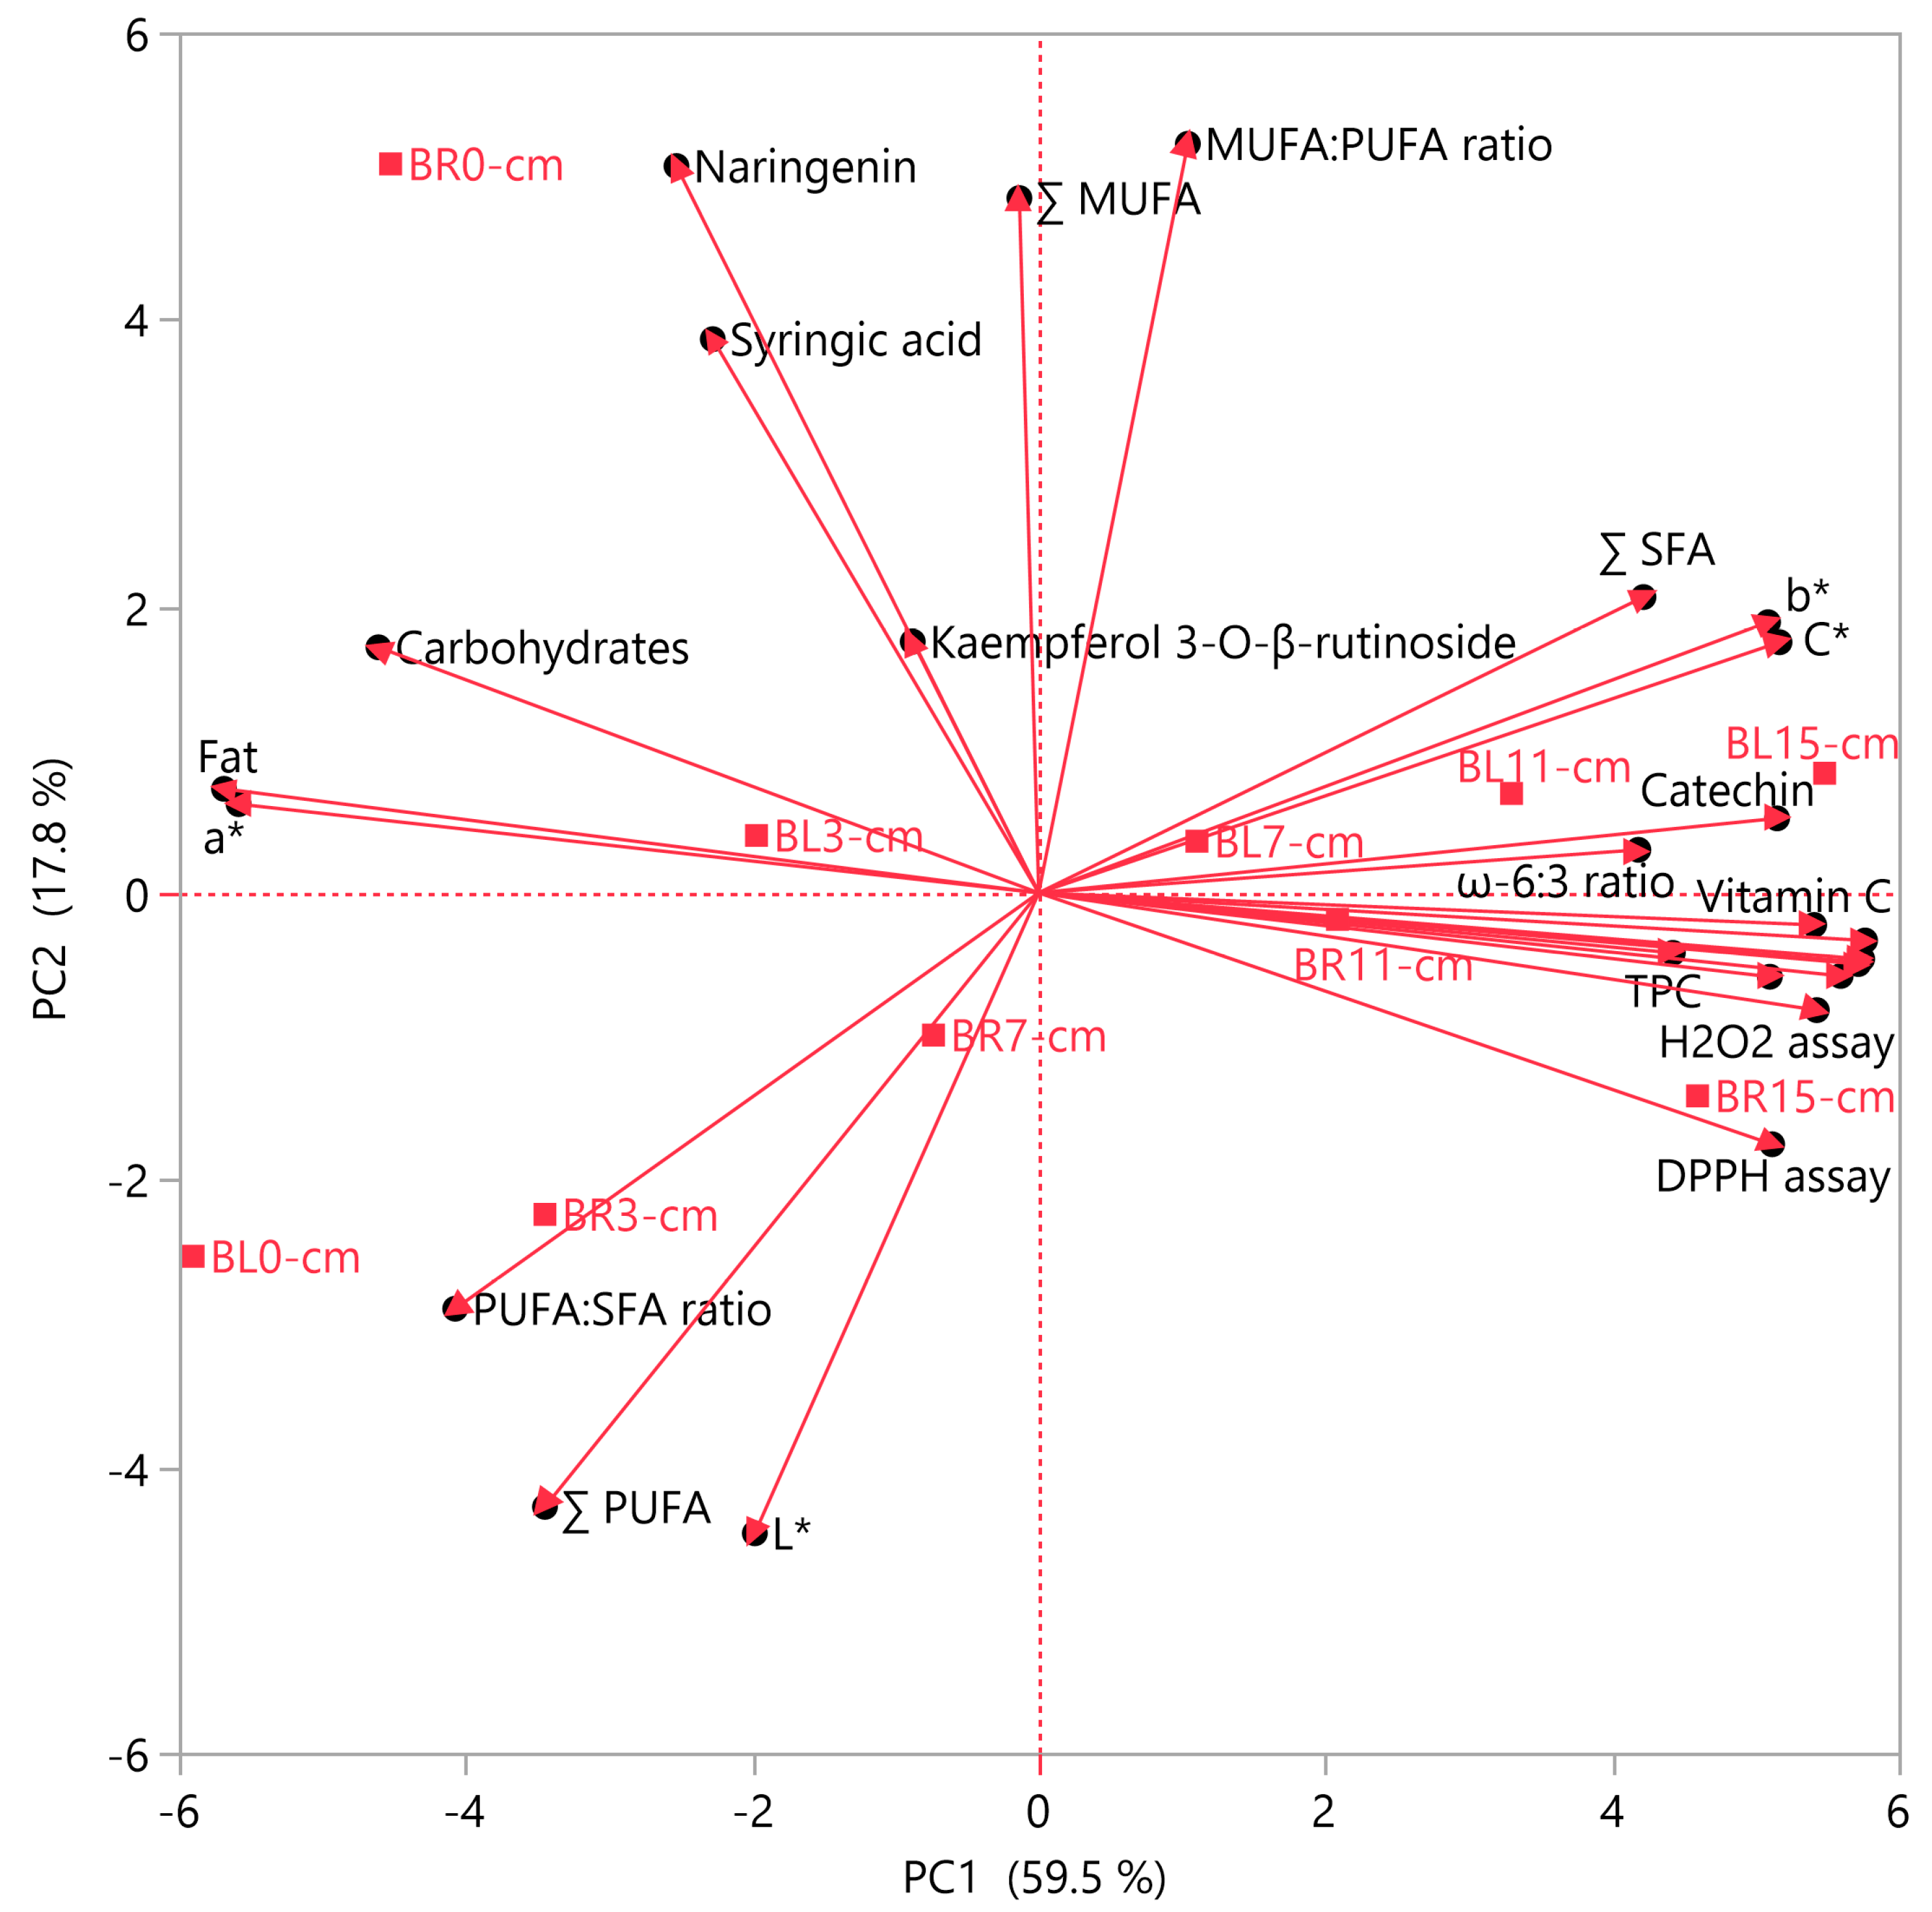
In order to reduce the complexity of the multivariate data and obtain a clearer picture of the outcomes, a principal component analysis (PCA) was also performed. As observed in Figure 3, the two principal components that could account for 77.3% of the variance were chosen (Eigenvalues > 1). PC1 demonstrated a positive association with TPC, several antioxidant assays (FRAP, DPPH, and H2O2), vitamin C, proteins, and the b* and C* color coordinates and a negative correlation with carbohydrates, fat content, fatty acids, and the L* and a* color coordinates. PC1 also explained 59.5% of the variability. With a positive association with carbohydrates, lipid content, and several phenolic compounds and a negative correlation to TPC and various antioxidant assays (FRAP, DPPH, and H2O2), vitamin C, proteins, and PC2 can explain 17.8% of the variance. As can be seen, the higher the length of the lentil samples, the higher their values in the PC1 component, which is in accordance with the abovementioned results.
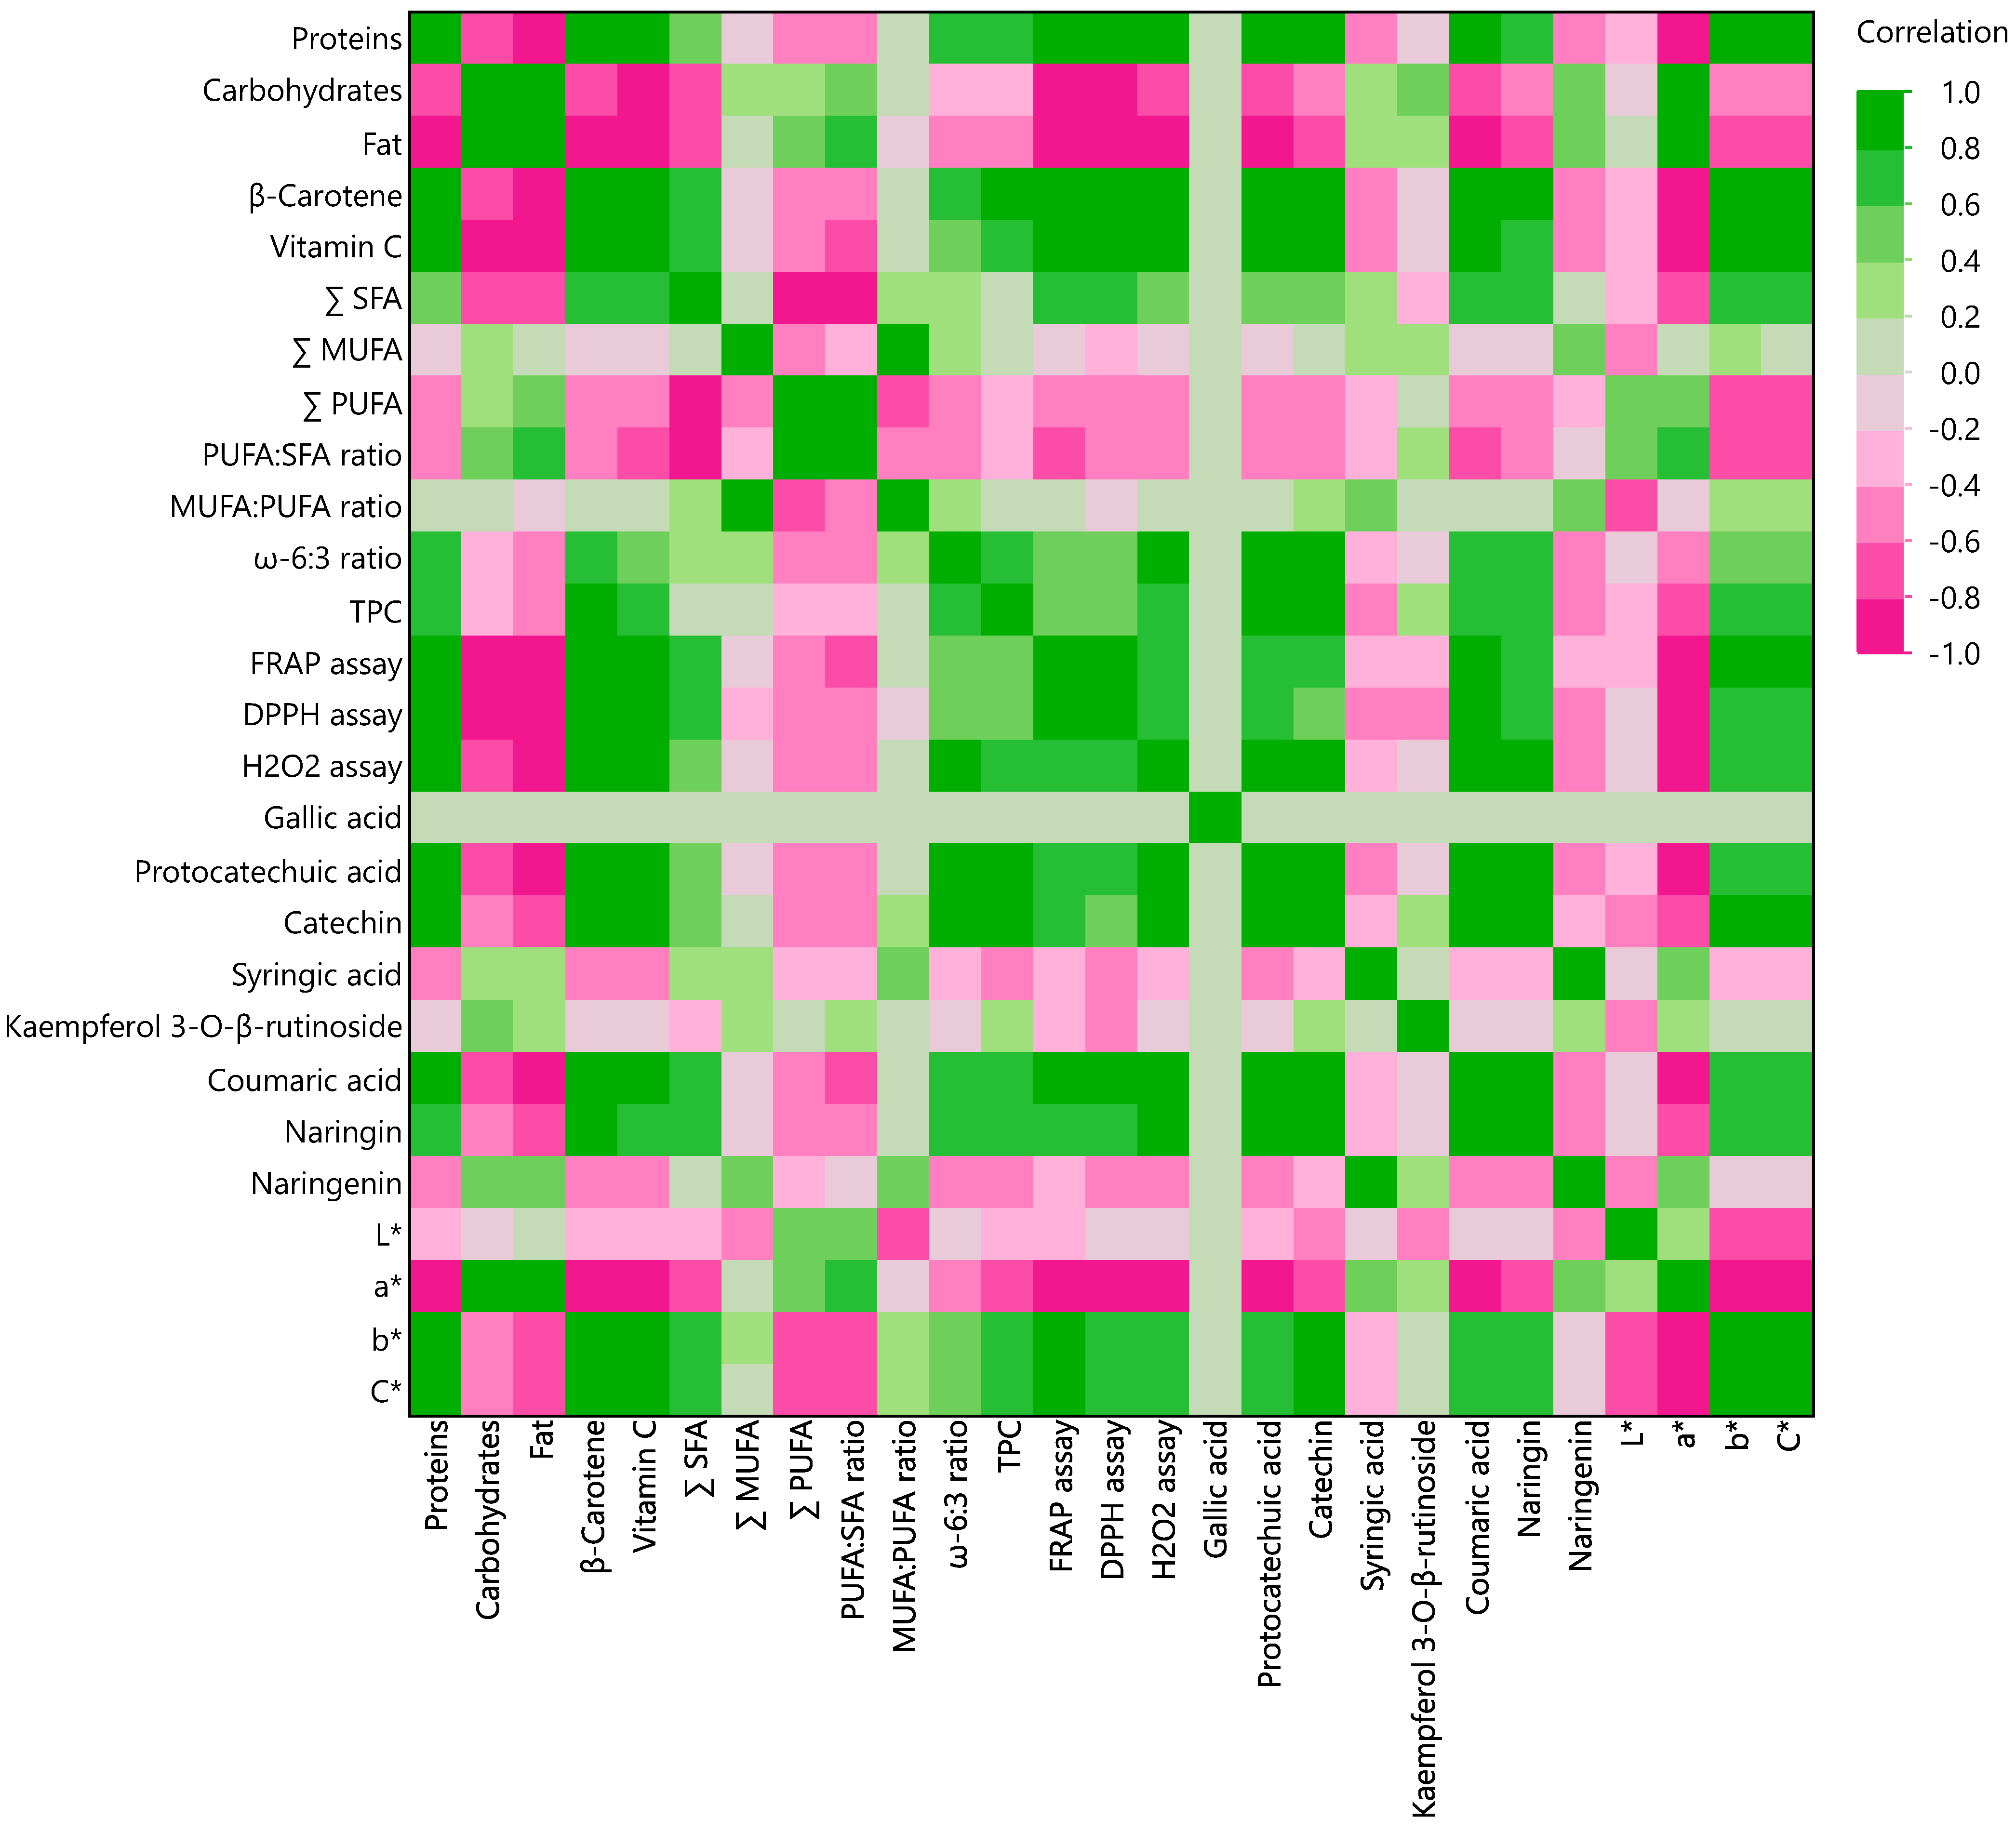
Additionally, a multivariate correlation analysis (MCA) was carried out for the valuable nutritional compounds found in the extracts of brown and black lentils. A color map of the correlations is shown in Figure 4. For instance, the proteins have strong correlations with β-carotene, vitamin C, antioxidant assays (FRAP, DPPH, and H2O2), protocatechuic acid, catechin, coumaric acid, and the color coordinates b* and C*. However, they do not match up well with the fat, carb, and color coordinate a*.

4. Conclusions

Results showed that LS are rich in valuable plant-based nutritional compounds, including proteins, carbohydrates, essential nutrients, vitamin C, and polyphenolic compounds. Moreover, it was shown that LS are rich in valuable plant-based nutritional compounds, including proteins, carbohydrates, essential nutrients, vitamin C, and polyphenolic compounds. The study pointed out that the protein content of LS significantly increased, along with the carotenoids, vitamin C, and polyphenols, while the carbohydrate content decreased, suggesting that LS of 15 cm in length could provide the greatest nutritional and health benefits. However, further research is necessary to explore the impact of diverse growing conditions on the nutritional value and antioxidant activity of LS. In conclusion, the results of this study suggest the inclusion of LS in a healthy diet for the promotion of overall health and well-being and their easy cultivation at home may facilitate healthy dietary habits.

Author Contributions

Conceptualization, T.C. and V.A.; methodology, T.C. and V.A.; software, I.M., K.K., D.P. and E.B.; validation, T.C. and V.A.; formal analysis, T.C., E.B., and V.A.; investigation, T.C., V.A., I.M., K.K., D.P. and E.B.; resources, S.I.L.; data curation, T.C. and V.A.; writing—original draft preparation, T.C.; writing—review and editing, T.C., V.A., I.M., K.K., D.P., E.B. and S.I.L.; visualization, T.C. and V.A.; supervision, T.C. and V.A.; project administration, S.I.L.; funding acquisition, S.I.L. All authors have read and agreed to the published version of the manuscript.

Funding

This research received no external funding.

Data Availability Statement

Not applicable.

Conflicts of Interest

The authors declare no conflict of interest.

References

  1. Eichelmann, F.; Schwingshackl, L.; Fedirko, V.; Aleksandrova, K. Effect of plant-based diets on obesity-related inflammatory profiles: A systematic review and meta-analysis of intervention trials. Obes. Rev. 2016, 17, 1067–1079. [Google Scholar] [CrossRef] [PubMed]
  2. Aziz, A.; Noreen, S.; Khalid, W.; Mubarik, F.; Niazi, M.K.; Koraqi, H.; Ali, A.; Lima, C.M.G.; Alansari, W.S.; Eskandrani, A.A.; et al. Extraction of Bioactive Compounds from Different Vegetable Sprouts and Their Potential Role in the Formulation of Functional Foods against Various Disorders: A Literature-Based Review. Molecules 2022, 27, 7320. [Google Scholar] [CrossRef]
  3. Francis, H.; Debs, E.; Koubaa, M.; Alrayess, Z.; Maroun, R.G.; Louka, N. Sprouts Use as Functional Foods. Optimization of Germination of Wheat (Triticum aestivum L.), Alfalfa (Medicago sativa L.), and Radish (Raphanus sativus L.) Seeds Based on Their Nutritional Content Evolution. Foods 2022, 11, 1460. [Google Scholar] [CrossRef] [PubMed]
  4. Khang, D.; Dung, T.; Elzaawely, A.; Xuan, T. Phenolic Profiles and Antioxidant Activity of Germinated Legumes. Foods 2016, 5, 27. [Google Scholar] [CrossRef] [PubMed] [Green Version]
  5. El-Safy, F.; Salem, R.; YY, E.M. The Impact of Soaking and Germination on Chemical Composition, Carbohydrate Fractions, Digestibility, Antinutritional Factors and Minerals Content of Some Legumes and Cereals Grain Seeds. Alex. Sci. Exch. J. 2013, 34, 499–513. [Google Scholar] [CrossRef]
  6. Siriparu, P.; Panyatip, P.; Pota, T.; Ratha, J.; Yongram, C.; Srisongkram, T.; Sungthong, B.; Puthongking, P. Effect of Germination and Illumination on Melatonin and Its Metabolites, Phenolic Content, and Antioxidant Activity in Mung Bean Sprouts. Plants 2022, 11, 2990. [Google Scholar] [CrossRef]
  7. Benincasa, P.; Falcinelli, B.; Lutts, S.; Stagnari, F.; Galieni, A. Sprouted grains: A comprehensive review. Nutrients 2019, 11, 421. [Google Scholar] [CrossRef] [Green Version]
  8. Faris, M.A.-I.E.; Attlee, A. Lentils (Lens culinaris, L.): A novel functional food. In Food Science and Nutrition: Breakthroughs in Research and Practice; Khosrow-Pour, M., Ed.; IGI Global: Hershey, PA, USA, 2018; pp. 361–391. ISBN 9781522552086. [Google Scholar]
  9. Du, M.; Xiao, Z.; Luo, Y. Advances and emerging trends in cultivation substrates for growing sprouts and microgreens toward safe and sustainable agriculture. Curr. Opin. Food Sci. 2022, 46, 100863. [Google Scholar] [CrossRef]
  10. Wojdyło, A.; Nowicka, P.; Tkacz, K.; Turkiewicz, I.P. Sprouts vs. Microgreens as novel functional foods: Variation of nutritional and phytochemical profiles and their in vitro bioactive properties. Molecules 2020, 25, 4648. [Google Scholar] [CrossRef]
  11. Fouad, A.A.; Rehab, F.M.A. Effect of germination time on proximate analysis, bioactive compounds and antioxidant activity of lentil (Lens culinaris medik.) sprouts. Acta Sci. Pol. Technol. Aliment. 2015, 14, 233–246. [Google Scholar] [CrossRef] [Green Version]
  12. Televičiūtė, D.; Tarasevičienė, Ž.; Danilčenko, H.; Barčauskaitė, K.; Kandaraitė, M.; Paulauskienė, A. Changes in chemical composition of germinated leguminous under abiotic stress conditions. Food Sci. Technol. 2020, 40, 415–421. [Google Scholar] [CrossRef]
  13. Aslani, Z. Effect of Lentil Sprouts on Glycemic Control in Overweight and Obese Patients with Type 2 Diabetes. Int. J. Nutr. Food Sci. 2015, 4, 10. [Google Scholar] [CrossRef]
  14. Alkaltham, M.S.; Musa Özcan, M.; Uslu, N.; Salamatullah, A.M.; Hayat, K. Changes in antioxidant activity, phenolic compounds, fatty acids, and mineral contents of raw, germinated, and boiled lentil seeds. J. Food Sci. 2022, 87, 1639–1649. [Google Scholar] [CrossRef] [PubMed]
  15. Dhull, S.B.; Kinabo, J.; Uebersax, M.A. Nutrient profile and effect of processing methods on the composition and functional properties of lentils (Lens culinaris Medik): A review. Legum. Sci. 2022, 5, e156. [Google Scholar] [CrossRef]
  16. Nkhata, S.G.; Ayua, E.; Kamau, E.H.; Shingiro, J.B. Fermentation and germination improve nutritional value of cereals and legumes through activation of endogenous enzymes. Food Sci. Nutr. 2018, 6, 2446. [Google Scholar] [CrossRef] [Green Version]
  17. Jarpa-Parra, M. Lentil protein: A review of functional properties and food application. An overview of lentil protein functionality. Int. J. Food Sci. Technol. 2018, 53, 892–903. [Google Scholar] [CrossRef] [Green Version]
  18. Gharachorloo, M.; Tarzi, B.G.; Baharinia, M.; Hemaci, A.H. Antioxidant activity and phenolic content of germinated lentil (Lens culinaris). J. Med. Plants Res. 2012, 6, 4562–4566. [Google Scholar] [CrossRef]
  19. Sharifi-Rad, M.; Anil Kumar, N.V.; Zucca, P.; Varoni, E.M.; Dini, L.; Panzarini, E.; Rajkovic, J.; Tsouh Fokou, P.V.; Azzini, E.; Peluso, I.; et al. Lifestyle, Oxidative Stress, and Antioxidants: Back and Forth in the Pathophysiology of Chronic Diseases. Front. Physiol. 2020, 11, 694. [Google Scholar] [CrossRef]
  20. Dubois-deruy, E.; Peugnet, V.; Turkieh, A.; Pinet, F. Oxidative stress in cardiovascular diseases. Antioxidants 2020, 9, 864. [Google Scholar] [CrossRef]
  21. Peñas, E.; Limón, R.I.; Martínez-Villaluenga, C.; Restani, P.; Pihlanto, A.; Frias, J. Impact of Elicitation on Antioxidant and Potential Antihypertensive Properties of Lentil Sprouts. Plant Foods Hum. Nutr. 2015, 70, 401–407. [Google Scholar] [CrossRef] [Green Version]
  22. Ebert, A.W. Sprouts and Microgreens—Novel Food Sources for Healthy Diets. Plants 2022, 11, 571. [Google Scholar] [CrossRef] [PubMed]
  23. Prasedya, E.S.; Frediansyah, A.; Martyasari, N.W.R.; Ilhami, B.K.; Abidin, A.S.; Padmi, H.; Fahrurrozi; Juanssilfero, A.B.; Widyastuti, S.; Sunarwidhi, A.L. Effect of particle size on phytochemical composition and antioxidant properties of Sargassum cristaefolium ethanol extract. Sci. Rep. 2021, 11, 17876. [Google Scholar] [CrossRef] [PubMed]
  24. Makanjuola, S.A. Influence of particle size and extraction solvent on antioxidant properties of extracts of tea, ginger, and tea–ginger blend. Food Sci. Nutr. 2017, 5, 1179. [Google Scholar] [CrossRef] [PubMed]
  25. Kotsou, K.; Chatzimitakos, T.; Athanasiadis, V.; Bozinou, E.; Adamaki-Sotiraki, C.; Rumbos, C.I.; Athanassiou, C.G.; Lalas, S.I. Waste Orange Peels as a Feed Additive for the Enhancement of the Nutritional Value of Tenebrio molitor. Foods 2023, 12, 783. [Google Scholar] [CrossRef]
  26. European Union Commission; Commission Regulation (EC); Commission Regulation (EC). No 796/2002 of 6 May 2002 Amending Regulation (EEC) No 2568/91 on the Characteristics of Olive Oil and Olive-Pomace Oil and on the Relevant Methods of Analysis and the Additional Notes in the Annex to Council Regulation (EEC) No 2658/87 on the Tariff and Statistical Nomenclature and on the Common Customs Tariff; European Union Commission: Brussels, Belgium, 2002. [Google Scholar]
  27. Athanasiadis, V.; Chatzimitakos, T.; Kalompatsios, D.; Palaiogiannis, D.; Makrygiannis, I.; Bozinou, E.; Lalas, S.I. Evaluation of the Efficacy and Synergistic Effect of α- and δ-Tocopherol as Natural Antioxidants in the Stabilization of Sunflower Oil and Olive Pomace Oil during Storage Conditions. Int. J. Mol. Sci. 2023, 24, 1113. [Google Scholar] [CrossRef]
  28. Athanasiadis, V.; Chatzimitakos, T.; Kotsou, K.; Palaiogiannis, D.; Bozinou, E.; Lalas, S.I. Optimization of the Extraction Parameters for the Isolation of Bioactive Compounds from Orange Peel Waste. Sustainability 2022, 14, 13926. [Google Scholar] [CrossRef]
  29. Al-Amiery, A.A.; Al-Majedy, Y.K.; Kadhum, A.A.H.; Mohamad, A.B. Hydrogen Peroxide Scavenging Activity of Novel Coumarins Synthesized Using Different Approaches. PLoS ONE 2015, 10, e0132175. [Google Scholar] [CrossRef] [Green Version]
  30. Chatzimitakos, T.; Athanasiadis, V.; Kotsou, K.; Palaiogiannis, D.; Bozinou, E.; Lalas, S.I. Optimized Isolation Procedure for the Extraction of Bioactive Compounds from Spent Coffee Grounds. Appl. Sci. 2023, 13, 2819. [Google Scholar] [CrossRef]
  31. Bautista-Expósito, S.; Vandenberg, A.; Peñas, E.; Frias, J.; Martínez-Villaluenga, C. Lentil and Fava Bean with Contrasting Germination Kinetics: A Focus on Digestion of Proteins and Bioactivity of Resistant Peptides. Front. Plant Sci. 2021, 12, 2278. [Google Scholar] [CrossRef]
  32. Jarpa-Parra, M.; Bamdad, F.; Wang, Y.; Tian, Z.; Temelli, F.; Han, J.; Chen, L. Optimization of lentil protein extraction and the influence of process pH on protein structure and functionality. LWT Food Sci. Technol. 2014, 57, 461–469. [Google Scholar] [CrossRef]
  33. Ohanenye, I.C.; Tsopmo, A.; Ejike, C.E.C.C.; Udenigwe, C.C. Germination as a bioprocess for enhancing the quality and nutritional prospects of legume proteins. Trends Food Sci. Technol. 2020, 101, 213–222. [Google Scholar] [CrossRef]
  34. Pal, R.S.; Bhartiya, A.; Yadav, P.; Kant, L.; Mishra, K.K.; Aditya, J.P.; Pattanayak, A. Effect of dehulling, germination and cooking on nutrients, anti-nutrients, fatty acid composition and antioxidant properties in lentil (Lens culinaris). J. Food Sci. Technol. 2017, 54, 909–920. [Google Scholar] [CrossRef] [Green Version]
  35. Simopoulos, A.P. The importance of the ratio of omega-6/omega-3 essential fatty acids. Biomed. Pharmacother. 2002, 56, 365–379. [Google Scholar] [CrossRef]
  36. Meléndez-Martínez, A.J.; Mandić, A.I.; Bantis, F.; Böhm, V.; Borge, G.I.A.; Brnčić, M.; Bysted, A.; Cano, M.P.; Dias, M.G.; Elgersma, A.; et al. A comprehensive review on carotenoids in foods and feeds: Status quo, applications, patents, and research needs. Crit. Rev. Food Sci. Nutr. 2022, 62, 1999–2049. [Google Scholar] [CrossRef] [PubMed]
  37. Gałazka-Czarnecka, I.; Korzeniewska, E.; Czarnecki, A.; Kiełbasa, P.; Drózdz, T. Modelling of carotenoids content in red clover sprouts using light of differentwavelength and pulsed electric field. Appl. Sci. 2020, 10, 4143. [Google Scholar] [CrossRef]
  38. Li, J.; Lu, Y.; Chen, H.; Wang, L.; Wang, S.; Guo, X.; Cheng, X. Effect of photoperiod on vitamin E and carotenoid biosynthesis in mung bean (Vigna radiata) sprouts. Food Chem. 2021, 358, 129915. [Google Scholar] [CrossRef]
  39. Carr, A.C.; Maggini, S. Vitamin C and immune function. Nutrients 2017, 9, 1211. [Google Scholar] [CrossRef] [Green Version]
  40. Chambial, S.; Dwivedi, S.; Shukla, K.K.; John, P.J.; Sharma, P. Vitamin C in disease prevention and cure: An overview. Indian. J. Clin. Biochem. 2013, 28, 314–328. [Google Scholar] [CrossRef] [Green Version]
  41. Xu, M.J.; Dong, J.F.; Zhu, M.Y. Effects of germination conditions on ascorbic acid level and yield of soybean sprouts. J. Sci. Food Agric. 2005, 85, 943–947. [Google Scholar] [CrossRef]
  42. Idowu, A.T.; Olatunde, O.O.; Adekoya, A.E.; Idowu, S. Germination: An alternative source to promote phytonutrients in edible seeds. Food Qual. Saf. 2020, 4, 129–133. [Google Scholar] [CrossRef] [Green Version]
  43. Ren, S.C.; Sun, J.T. Changes in phenolic content, phenylalanine ammonia-lyase (PAL) activity, and antioxidant capacity of two buckwheat sprouts in relation to germination. J. Funct. Foods 2014, 7, 298–304. [Google Scholar] [CrossRef]
  44. Świeca, M.; Sȩczyk, Ł.; Gawlik-Dziki, U. Elicitation and precursor feeding as tools for the improvement of the phenolic content and antioxidant activity of lentil sprouts. Food Chem. 2014, 161, 288–295. [Google Scholar] [CrossRef] [PubMed]
  45. Ghumman, A.; Singh, N.; Kaur, A. Influence of sprouting on phenolic composition and starch characteristics of lentil and horse gram. Int. J. Food Sci. Technol. 2020, 55, 1744–1753. [Google Scholar] [CrossRef]
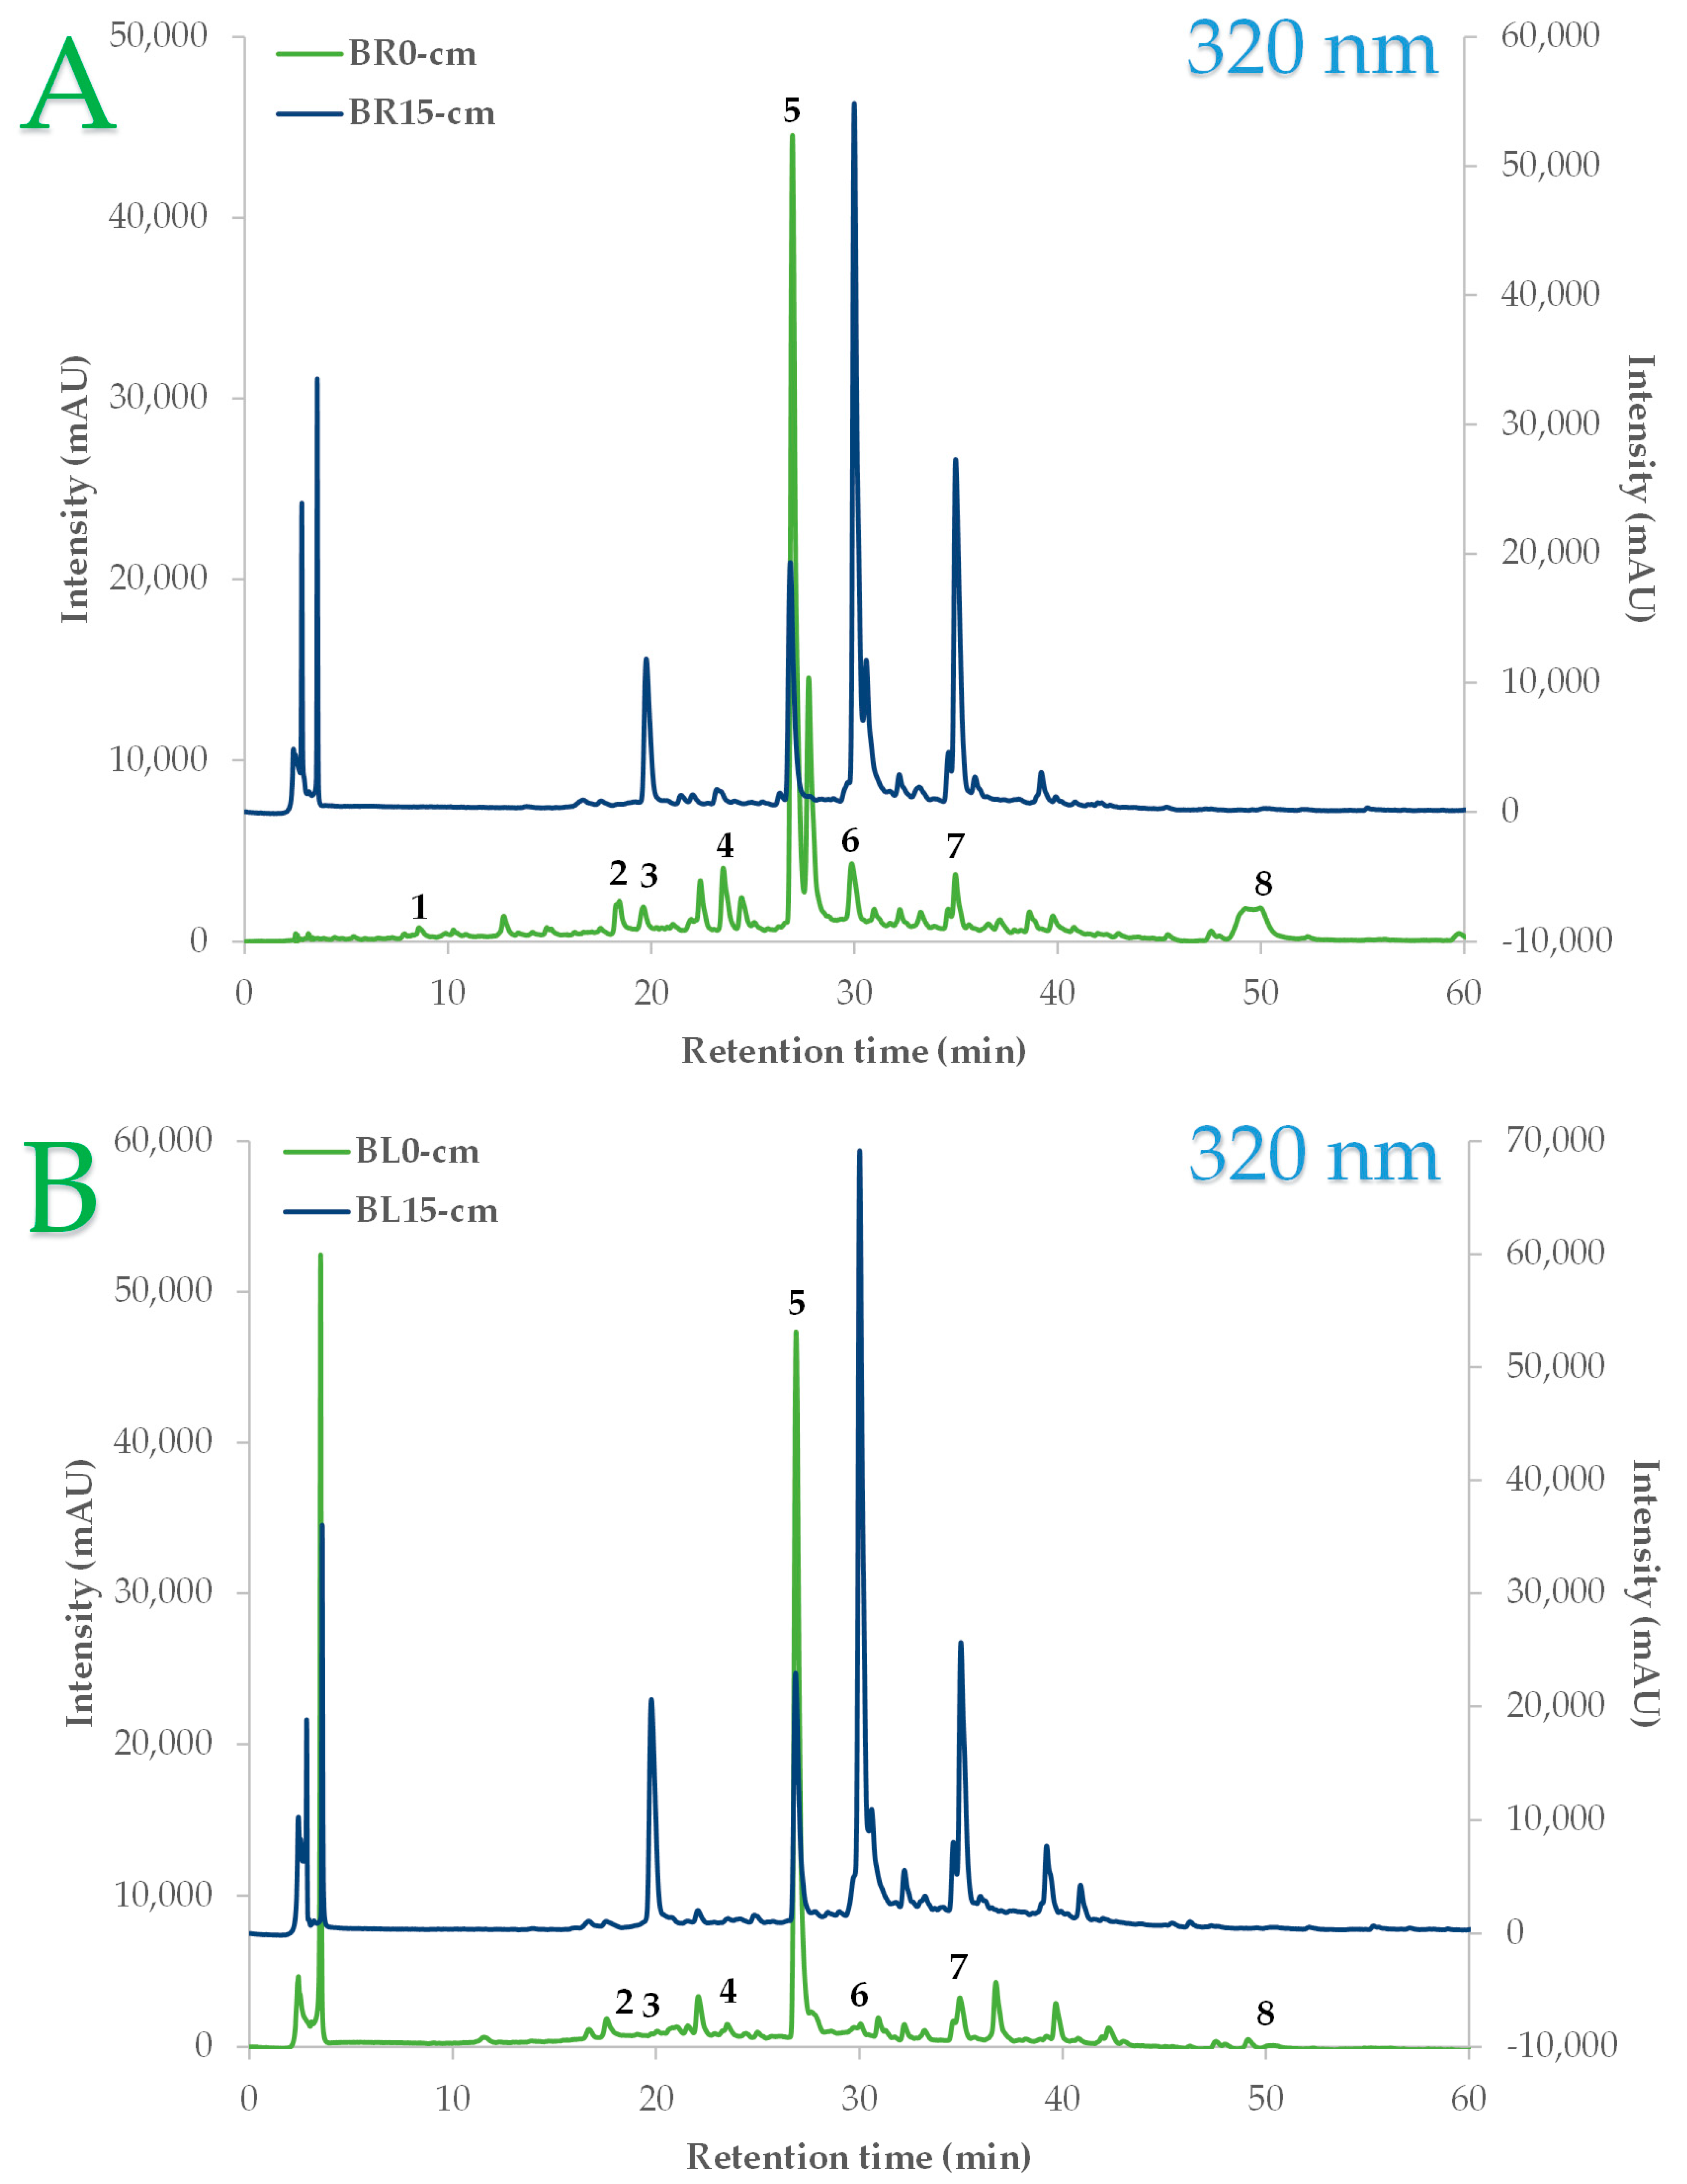
Figure 1. Representative HPLC chromatograms for the separation of the polyphenols present in brown LS 0 cm and 15 cm sample (Plot A) and a black LS 0 cm and 15 cm sample are overlaid (Plot B) at 320 nm. Peak 1: gallic acid; Peak 2: protocatechuic acid; Peak 3: catechin; Peak 4: syringic acid; Peak 5: kaempferol 3-O-β-rutinoside; Peak 6: coumaric acid; Peak 7: naringin; Peak 8: naringenin.
Horticulturae 09 00668 g001
Figure 2. Brown (Plot A) and black (Plot B) lentil extract sprout color change, grown at different lengths. Statistically significant changes (p < 0.05) are highlighted with short letters (e.g., a–e) for each color coordinate.
Horticulturae 09 00668 g002
Figure 3. Principal component analysis (PCA) for the valuable plant-based nutritional compounds of brown and black lentil extracts.
Horticulturae 09 00668 g003
Figure 4. Multivariate correlation analysis (MCA) for the valuable plant-based nutritional compounds of brown and black lentil extracts.
Horticulturae 09 00668 g004
Table 1. Retention time, quantification wavelength (λmax), equation of quantification, correlation coefficient (R2), limits of calibration curve, and limits of quantification (LOQs) for the determination of the polyphenolic compounds according to HPLC analysis.
CompoundRetention Time (min)λmax (nm)EquationR2Range (mg/L)LOQ (mg/L)
Gallic acid8.5270y = 0.00002x + 0.41060.99991–500.0939
Protocatechuic acid16.9270y = 0.00002x + 0.41070.99981–500.0937
Catechin20.1270y = 0.00009x − 0.15980.99991–500.3986
Syringic acid23.5270y = 0.00002x + 0.16870.99961–500.0915
Kaempferol 3-O-β-rutinoside26.9345y = 0.00003x − 0.41810.99941–500.1296
Coumaric acid29.8320y = 0.00002x + 0.05140.99931–500.0905
Naringin34.9280y = 0.00003x + 0.65560.99991–500.1445
Naringenin49.9280y = 0.000008x + 0.55230.99971–500.0381
Table 2. Nutritional composition of LS, grown at different lengths.
LS Length (cm)Proteins (g/100 g dw)Carbohydrates (g/100 g dw)Fat (g/100 g dw)β-Carotene Content (μg/100 g dw)Vitamin C (mg/100 g dw)
Brown LS
017.66 ± 0.24 d60.81 ± 3.89 a3.28 ± 0.11 a14.73 ± 0.8 e9.45 ± 0.43 d
318.22 ± 0.27 c,d40.49 ± 2.35 b2.61 ± 0.18 b20.73 ± 1.07 d11.45 ± 0.47 d
718.82 ± 0.21 c32.46 ± 2.17 c2.42 ± 0.06 b25.24 ± 0.72 c21.65 ± 0.73 c
1119.73 ± 0.32 b23.76 ± 1.28 d1.64 ± 0.07 c34.61 ± 0.83 b33.46 ± 1.03 b
1520.97 ± 0.18 a18.88 ± 1.15 d1.38 ± 0.03 c47.77 ± 1.14 a42.91 ± 1.04 a
Black LS
017.94 ± 0.54 c61.25 ± 1.35 a3.63 ± 0.17 a16.27 ± 0.8 e8.81 ± 0.23 e
318.08 ± 0.26 c56.61 ± 3.45 a,b3.11 ± 0.23 b27.83 ± 1.36 d12.64 ± 0.42 d
719.65 ± 0.16 b50.9 ± 1.22 b,c2.44 ± 0.08 c38.36 ± 1.64 c24.54 ± 0.74 c
1120.69 ± 0.11 a44.5 ± 3.29 c1.78 ± 0.11 d42.62 ± 1.22 b34.28 ± 1.11 b
1521.32 ± 0.26 a23.01 ± 1.73 d1.54 ± 0.08 d46.61 ± 1.15 a43.11 ± 1.25 a
Within each column, statistically significant differences (p < 0.05) are denoted with different superscript letters (e.g., a–e).
Table 3. Changes in the percentages of fatty acids in samples of LS, grown at different lengths.
LS Length (cm)∑ SFA 1∑ MUFA 2∑ PUFA 3PUFA:SFA RatioMUFA:PUFA Ratioω-6:3 Ratio
Brown LS
018.95 ± 0.45 b19.21 ± 0.81 a61.84 ± 1.24 a3.26 ± 0.01 b0.31 ± 0.01 a2.64 ± 0.11 c
316.48 ± 0.79 c16.49 ± 0.94 b,c67.02 ± 4.16 a4.06 ± 0.06 a0.25 ± 0.01 b3.1 ± 0.1 b
719.09 ± 1.13 b17.02 ± 0.8 a,b,c63.88 ± 1.79 a3.35 ± 0.1 b0.27 ± 0.01 c3.91 ± 0.17 a
1119.66 ± 0.51 a,b17.51 ± 1.3 a,b62.83 ± 4.21 a3.19 ± 0.13 b,c0.28 ± 0.01 d3.24 ± 0.11 b
1521.37 ± 0.58 a14.9 ± 0.89 c63.73 ± 3.12 a2.98 ± 0.07 c0.23 ± 0.01 e3.15 ± 0.17 b
Black LS
014.2 ± 1.04 b16.24 ± 0.34 a69.56 ± 1.39 a4.91 ± 0.26 a0.23 ± 0 c2.53 ± 0.1 c
318.07 ± 0.51 a17.14 ± 0.94 a64.79 ± 1.94 a3.59 ± 0.01 b0.26 ± 0.01 b3.53 ± 0.25 b
718.21 ± 0.62 a17.55 ± 1.18 a64.19 ± 3.34 a3.52 ± 0.06 b0.27 ± 0.01 b4.16 ± 0.22 a
1118.68 ± 0.65 a18.34 ± 0.84 a62.98 ± 2.27 a3.37 ± 0.01 b0.29 ± 0.01 a4.25 ± 0.12 a
1518.83 ± 0.38 a18.22 ± 1.22 a62.95 ± 4.41 a3.34 ± 0.17 b0.29 ± 0.01 a4.47 ± 0.29 a
Within each column, statistically significant differences (p < 0.05) are denoted with different superscript letters (e.g., a–e). 1 SFA, saturated fatty acids (%): SUM of C14:0, myristic acid; C16:0, palmitic acid; C18:0, stearic acid; C20:0, arachidic acid; C22:0, behenic acid. 2 MUFA, monounsaturated fatty acids (%): SUM of C16:1, palmitoleic acid; C18:1, oleic acid. 3 PUFA, polyunsaturated fatty acids (%): SUM of C18:2, ω-6, linoleic acid; C18:3, ω-3, linolenic acid.
Table 4. Total polyphenols and several antioxidant assays (FRAP, DPPH, and H2O2) of LS were grown at different lengths.
LS Length (cm)TPC (mg GAE/g dw)FRAP Assay (μmol AAE/g dw)DPPH Assay (μmol DPPH/g dw)H2O2 Assay (μmol AAE/g dw)
Brown LS
04.56 ± 0.10 c12.97 ± 0.35 d11.43 ± 0.27 e22.2 ± 1.65 e
34.86 ± 0.15 c13.51 ± 0.39 d14.98 ± 0.34 d40.31 ± 1.29 d
75.39 ± 0.17 b15.47 ± 0.45 c17.43 ± 0.39 c45.65 ± 2.91 c
115.94 ± 0.20 a17.90 ± 0.49 b19.95 ± 0.41 b53.63 ± 1.83 b
156.14 ± 0.27 a22.25 ± 0.61 a21.46 ± 0.44 a57.82 ± 1.54 a
Black LS
05.77 ± 0.13 c10.55 ± 0.34 e12.18 ± 0.23 d23.47 ± 1.52 c
36.17 ± 0.16 c12.27 ± 0.38 d12.76 ± 0.25 d48.33 ± 3.08 b
76.94 ± 0.21 b14.58 ± 0.36 c15.84 ± 0.28 c58.52 ± 2.76 a
117.15 ± 0.24 a,b16.92 ± 0.42 b17.11 ± 0.33 b61.37 ± 2.96 a
157.49 ± 0.25 a20.03 ± 0.58 a18.71 ± 0.40 a61.99 ± 3.33 a
Within each column, statistically significant differences (p < 0.05) are denoted with different superscript letters (e.g., a–e).
Table 5. Analytical polyphenolic composition (μg/g dw) of LS, grown at different lengths.
LS Length (cm)Gallic AcidProtocatechuic AcidCatechinSyringic AcidKaempferol 3-O-β-RutinosideCoumaric AcidNaringinNaringenin
Brown LS
0301 ± 722 ± 1 d255 ± 8 e28 ± 1 a573 ± 25 a22 ± 1 e12 ± 1 e961 ± 20 a
3nd138 ± 4 c717 ± 21 d16 ± 1 b479 ± 19 b124 ± 5 d133 ± 4 d11 ± 1 b
7nd147 ± 4 c868 ± 36 c12 ± 1 c373 ± 9 c157 ± 4 c178 ± 6 c12 ± 1 b
11nd214 ± 10 b1203 ± 34 b15 ± 1 b358 ± 15 c215 ± 9 b227 ± 5 b14 ± 1 b
15nd291 ± 9 a2108 ± 78 a12 ± 1 c494 ± 20 b278 ± 7 a390 ± 13 a14 ± 1 b
Black LS
0nd39 ± 1 d136 ± 3 e6 ± 1 b591 ± 24 a12 ± 1 e8 ± 1 b2 ± 1 d
3nd165 ± 4 c1603 ± 48 d20 ± 1 a532 ± 12 b170 ± 7 d318 ± 9 a309 ± 6 a
7nd275 ± 10 b2279 ± 103 c18 ± 1 a569 ± 23 a,b231 ± 6 c334 ± 7 a49 ± 2 b
11nd326 ± 11 a2929 ± 111 b7 ± 1 b553 ± 22 a,b267 ± 8 b333 ± 13 a42 ± 1 b
15nd344 ± 11 a4005 ± 180 a8 ± 1 b572 ± 26 a,b332 ± 12 a338 ± 8 a29 ± 1 c
Within each column, statistically significant differences (p < 0.05) are denoted with different superscript letters (e.g., a–e). nd: not detected.
Disclaimer/Publisher’s Note: The statements, opinions and data contained in all publications are solely those of the individual author(s) and contributor(s) and not of MDPI and/or the editor(s). MDPI and/or the editor(s) disclaim responsibility for any injury to people or property resulting from any ideas, methods, instructions or products referred to in the content.