Abstract
Ornamental plants provide many benefits to humans, including those that affect emotional/mental health, physiological health, social interactions, and economic/financial conditions. However, research related to consumers’ perceived value of ornamental plants has focused primarily on production methods that were used to produce plants, while consumers’ perceived intrinsic value of postpurchase benefits has not been addressed. There is potential for benefit information to generate value for consumers. Knowing consumers’ value for different plant benefits serves to inform green industry stakeholders as they consider their marketing strategies and whether to include benefit information as a part of their plant promotions. An online survey was conducted to elicit U.S. consumers’ willingness to pay (WTP) for lavender plants while displaying different plant benefit information. Participants randomly viewed one of eight plant benefit messages and indicated the maximum they were willing to pay for a lavender plant displaying that benefit. The benefits messages were categorized as cognitive, social, physical, emotional, environmental, aesthetic, educational, and economic based on prior literature. Tobit models were used to analyze the data. Compared to economic benefit information, the social benefit generated the largest premium (USD 6.75). Plant spending in 2020 and household income increased participants’ WTP for the lavender plants. Age had a negative impact on WTP.
1. Introduction
The U.S. green industry has experienced substantial growth. In 2018, the U.S. green industry had direct industry outputs of USD 159.57 billion and total output contributions of USD 348.08 billion [1]. Landscape and gardening services were the largest sectors at USD 221.89 billion of GDP contributions, while greenhouse, nursery, and floriculture production were the second largest sectors at USD 43.80 billion. Between 2019 and 2020, ornamental plant sales increased, with flower gardening increasing by eight percent and food gardening by 33% [2]. Then, the sheltering-in-place by homeowners during the COVID-19 pandemic attracted 18.3 million new gardeners to the marketplace [2,3]. As new consumers are entering the marketplace, it is important to understand the factors and information that relates to purchasing behavior. Motivations behind gardening vary, but research supports the premise that the diverse benefits consumers receive from gardening and interacting with plants are instrumental in stimulating their interest in gardening [3]. Key motivators identified in the literature include nature connection, stress relief, outdoor physical activity, and food production [4] while coping with economic uncertainty and saving/earning money were the least important motivators. Other pre-pandemic gardening motivators included the pleasure and enjoyment of gardening rather than the health benefits obtained from gardening [5]. However, health and wellness motivations may be more important factors amid a health-related crisis such as COVID. Currently, it is not known how different plant benefit information influences purchasing behavior (i.e., valuation). There are nominal studies available regarding the different benefit categories and how consumers respond to these messages, both presented separately and aggregated together. This information is important because it can aid green industry stakeholders as they develop future marketing content to inform customers about their potential purchases. In turn, this can help customers as they select products that best align with their needs and what benefits are most important to them.
The COVID-19 pandemic had a profound impact on consumers and impacted their plant purchasing behavior. This may have potentially impacted the benefits they valued from plants. Campbell, Rihn, and Campbell identified a shift in purchasing behavior for plants toward online purchasing and curbside pickup options among Southeast U.S. consumers [6]. Manso et al. (2021) found that outdoor space (i.e., green roofs) increased in value during COVID-19 lockdowns [7]. Similarly, Bulgari et al. (2021) identified that the pandemic increased stress and that the benefits associated with interacting with plants and green spaces became more relevant [8]. Pérez-Urrestarazu et al. found a positive correlation between indoor plants and emotional well-being [9]. The pandemic-related plant literature highlights the potential benefits obtained from being near plants and nature, especially in times of isolation and stress. In turn, consumer interest in plant benefits related to mental and physical health may have been heightened. Here we quantify how consumers respond to plant benefits by eliciting their willingness to pay (WTP) for plants with benefit information.
Substantial literature supports the multitude of health and wellness benefits plants provide to people. Hall and Knuth [10,11,12,13] assimilated and categorized the many plant benefits into emotional and mental health [10], physiological health [11], and social benefits [12,13]. Emotional and mental health benefits include enhanced memory and reduced depression, reduction in anxiety, and greater life satisfaction [10]. Psychological health benefits include better sleep, reduced diabetes, enhanced immunity, and decreased mortality [11]. Social benefits include reduced crime, improved socialization among children, and enhanced school performance [12]. Assimilating the existing literature on plant benefits provided a springboard for measuring their impacts on plant purchasing.
Behe et al. [3] adapted a leisure satisfaction scale developed by Beard and Ragheb [14] to quantify those plant benefits as organized by Hall and Knuth [3,10,11,12,14]. The adapted scales had good reliability and validity. The scales also demonstrated that Millennials (born between 1981 and 1996) derived the most benefits from plants, relative to Baby Boomers (born before 1965) and Gen Z (born after 1996) participants during the COVID-19 pandemic. Given the increase in depression and anxiety during COVID-19 [15], Behe et al. thought that emotional and mental health benefits might receive the highest mean scores [3]. However, it was the social benefit of plants that earned the highest mean score relative to the other plant benefits [3]. The current research builds on Behe et al. [3] by quantifying the economic value of plant benefits of lavender plants.
Other investigations of gardening motivations indicate demographic differences influence plant benefit derivation. For example, Behe and Dennis [16] reported Baby Boomers made more plant purchases relative to other age cohorts, yet more Millennials have become active in many dimensions of gardening and plant interactions in the recent past [2]. Behe, Huddleston, and Hall found that Millennials obtained several benefits from plants (social, educational, physiological, psychological) relative to other generations [3]. Furthermore, home gardening has been identified as a way for consumers with constrained incomes to meet their recommended vegetable servings [17]. McFarland found that motivators of food, health, nutrition, and nostalgia were more influential for men, while personal productivity was more influential for women [18]. However, men and women had similar perceptions of the therapeutic value of gardening. Here, the impact of demographic background on consumers’ value for lavender plants displaying different benefit information is measured.
To date, research quantifies plant benefits [10,11,12,13] and how those benefits equate to motivating participation in gardening [4,5]. However, research addressing whether the presence of plant benefit information at the point-of-sale (POS) impacts purchasing behavior is limited. Existing literature on plant credence attributes related to production practices (e.g., organic, local, etc.) demonstrated that consumers were interested in and willing to pay premiums for production-related attributes that provide perceived environmental or human health benefits [19,20]. An exception is Rihn et al., who suggest that organic production may be more preferred by consumers due to perceptions of personal and environmental health benefits [19]. For instance, organically produced indoor foliage plants generated a premium of USD 13.96 for certified organic and USD 9.78 for noncertified organic while fruit-producing plants generated lower premiums of USD 12.36 and USD 7.43 for certified and noncertified organic [19]. The heightened WTP estimates for the foliage plants versus plants that produce edible fruit suggest that perceived environmental and personal health benefits come into play when determining value and may vary depending on the plant and its potential uses. Although the authors infer a relationship between perceived benefits and value, this point was outside the scope of the study and not directly addressed.
Plant benefit information at the POS is one technique to inform consumers about the human, environmental, and other benefits of plants, but whether that information influences purchasing behavior is unknown. One would expect increased value given the potential personal or environmental benefits received (similar to Rihn et al. [19]); however, the plant benefits are ingrained in the nature of the plant rather than a production-driven value-added attribute. Consequently, plant blindness may mitigate potential value where plants are overlooked due to consistent presence [21], or the benefits provided may be taken for granted and not generate value given that plants provide the benefits whether people buy them or not (e.g., being in nature provides a sense of relaxation).
Given the lack of information on the value of plant benefits, the research team conducted an initial inquiry investigating consumers’ WTP for lavender plants displaying selected plant benefits. Each participant randomly viewed one of eight potential plant benefits (i.e., cognitive, emotional, physical, social, aesthetic, environmental, educational, economic) and provided their maximum WTP amount. The authors hypothesized that consumers would be diverse in their valuation of plant benefits, with demographic characteristics playing a role in some of those differences. Results of this study can provide insights that can be used in future consumer plant purchasing research, green industry marketing strategies, and to identify potential directions for additional plant benefit research.
2. Materials and Methods
An online survey (IRB #2019-1754M) was used to collect data in December 2021 for U.S. consumers’ WTP for lavender plants displaying different benefit information. The survey was developed using widely accepted marketing research methods to ensure accuracy while reducing participant error and expense (e.g., online survey platforms and online panel recruitment strategies) [22,23]. To mitigate potential bias from online survey responses, researchers contracted with Toluna, Inc. (Dallas, TX, USA) to recruit individuals who were 18 years old or older in the United States. Participants had to have purchased a plant in the past 12 months (December 2020–November 2021) to qualify for the survey. Current plant purchasers were of interest, given that not all consumers purchase plants. The survey instrument had several sections, with the first containing the consent form, followed by questions addressing current purchasing behavior, WTP by benefits information, plant knowledge, health consciousness, and demographics (Table 1). For the WTP by benefits information section, a single benefit statement was crafted for each type of benefit and participants only viewed one (discussed shortly). For this analysis, the plant purchasing behavior, WTP, and demographic questions were used. Data were analyzed using pairwise t-tests, Spearman correlations, and Tobit models, where appropriate.

Table 1.
Questionnaire content used in a study investigating the effect of benefits-related messaging from a study of consumer plant purchasing patterns.
For the plant purchase questions, participants were asked about the types of plants purchased, the location of purchases, and the amount spent. The amount spent was quantified using two questions that asked about annual spending in 2021 and 2020 on gardening supplies and plants (excluding mechanical equipment). Both years were included to account for the potential effects of the COVID-19 pandemic. Estimates show that 18.3 million people started gardening during the pandemic [2]. Participants were given 12 spending ranges from USD 0 to USD 500 or more and indicated the amount spent for each year. For analysis, the means of the ranges were used for each purchase year.
Next, participants randomly viewed one of the information treatments that aligned with one of eight plant benefits and indicated the maximum they were willing to pay for a lavender plant displaying that benefit. The plant benefits included aesthetic, cognitive, economic, educational, emotional, environmental, physical, and social benefits using the same scales and measures as in Behe et al. [3] and are provided shortly.
To elicit WTP amounts, participants were provided a predetermined list of prices in USD 5 increments ranging from USD 0 (would not buy) to USD 101+ (more than USD 100). The provided price ranges accurately reflect potential plant prices across the U.S. in 2020 and 2021. Participants viewed a picture of a lavender plant (Lavandula angustifolia Mill.) in a 4-inch pot while determining their WTP amounts. No other information was provided to participants because one of the goals of this study was to establish a base price for plant benefit information. Previous studies have found that the plant aesthetic, production methods [19], and involvement and experience in plant-related activities all strongly impact behavior [24,25]. An example of a survey question and the question format is provided in Figure 1.
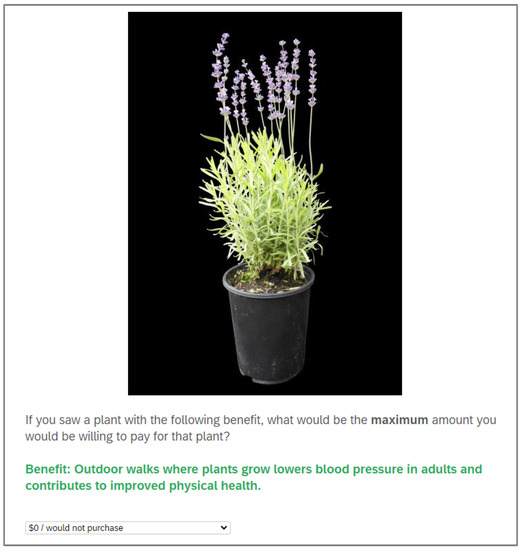
Figure 1.
Example of the plant benefit questions used to elicit willingness-to-pay estimates from consumers with prices ranging from USD 0 to USD 101+ in USD 5 increments.
A direct approach was used to elicit WTP values for lavender plants with different benefits for several reasons. First, many plant benefits apply to all plants rather than being an attribute that could be present or absent without influencing the appearance of the product (e.g., organic, local). As a result, the presence of benefits information may encourage purchasing behavior and value, but we do not know and cannot treat benefit information similar to an attribute that is mutually exclusive (meaning one plant has it while the next plant does not). Second, research suggests that (counter to conventional beliefs) direct methods may reduce hypothetical bias. Schmidt and Bijmolt found that direct methods were more accurate at predicting WTP and had lower hypothetical bias when compared to indirect elicitation methods in hypothetical and real WTP experiments [26]. Similar approaches have been used to address sign complexity in retail settings [27] and for pecans [28]. Lastly, we view the current work as the first in a series of studies addressing the potential use of benefits information of ornamental plants to encourage conscientious purchasing behavior (e.g., purchasing products that improve consumer well-being). This study serves as an initial inquiry that can be used as the base value for benefits information in subsequent studies.
Given the WTP estimates were lower (USD 0) and upper censored (USD 60), a two-limit Tobit model was used in the analysis [29,30]. Although participants could submit WTP values up to USD 101+, very few people exceeded the USD 60 price point (3% of the sample submitted higher values). Thus, the upper censor value was set based on the distribution of the WTP values. The dependent variable was the participants’ self-reported WTP, while the independent variables were the benefits (1 = present; 0 = absent for each benefit level), plant spending in 2020 and 2021, and socio-demographics. A total of 435 responses were included in the analysis. Tobit models have been successfully used to address research questions [31,32] and can be expressed as:
where is the latent variable (participant i’s selected WTP for a lavender plant displaying the benefit information), are vectors of the independent variables (including plant benefits, 2021 and 2020 plant spending, demographics), is the vector of parameters to be estimated, and the is the iid error term which is assumed to be distributed with a mean zero and variance of . The observed dependent variable (i.e., participants’ WTP) is denoted by which is defined as:
The plant benefit variables were coded as dummy variables, including physical (1 if the physical benefit to plants was shown, 0 otherwise), emotional (1 if the emotional benefit to plants was shown, 0 otherwise), cognitive (1 if the cognitive benefit to plants was shown, 0 otherwise), aesthetic (1 if the aesthetic benefit to plants was shown, 0 otherwise), economic (1 if the economic benefit to plants was shown, 0 otherwise), social (1 if the social benefit to plants was shown, 0 otherwise), environmental (1 if the environmental benefit to plants was shown, 0 otherwise), and educational (1 if the educational benefit to plants was shown, 0 otherwise). To avoid perfect multicollinearity [31], the economic benefit information was omitted from the Tobit model and used as a base for comparison. Consequently, the coefficient estimates are relative to the economic benefit.
3. Results
The sample socio-demographic variables are presented in Table 2. Participants averaged 57.6 years old with a median age of 61 years. Fifty percent of the sample was male. Approximately 51% of the sample had attained an associate degree or higher at the time of this study, and the mean 2021 household income was USD 70,261, with a median of USD 55,000. Nearly a third of the sample lived in urban areas, 44 percent in suburban areas, and almost 22% in rural areas. In 2020, participants spent USD 112 annually on plants, which increased to USD 123 in 2021. For comparison purposes, the U.S. population demographics from the U.S. Census Bureau are also provided [33]. In general, the sample aligned with the U.S. population in terms of gender and rural residency. However, the sample exhibited a slight shift towards more urban dwellers than suburban dwellers. It also consisted of older participants and a greater portion of participants living in urban areas than the U.S. population. Education and income were also a little lower. Some of the sample characteristics were similar to that of Whitinger and Cohen, in particular income and age [2].
Table 2.
Summary statistics of the sample’s socio-demographic variables included in a study investigating the effect of benefits-related messaging from a study of consumer plant purchasing patterns.
Participants’ mean WTP for a lavender plant displaying the different benefit messages is presented in Table 3. Participants indicated they were willing to pay USD 19.15 for a lavender plant displaying the cognitive benefit information, followed by USD 17.69 for a lavender plant with social benefit information, USD 17.03 for a lavender plant with physical benefit information, USD 16.85 for a lavender plant with emotional benefit information, USD 15.06 for a lavender plant with environmental benefit information, USD 14.90 for a lavender plant with aesthetic benefit information, USD 12.11 for a lavender plant with educational benefit information, and USD 10.60 for a lavender plant with economic benefit information. See reviews by Hall and Knuth [11,12,13] for specific messaging examples.
Table 3.
Benefit information provided to participants and associated mean willingness-to-pay values derived from a study investigating the effects of benefits-related messaging from a study of consumer plant purchasing patterns.
Significant differences between the reported WTP estimates for the different benefits were observed (Table 4). Participants reported WTP for lavender plants with cognitive benefit information was significantly higher than for lavender plants with educational or economic benefit information. However, it was not significantly different from lavender plants with social, physical, emotional, environmental, or aesthetic benefit information. Participants reported WTP for lavender plants with the economic benefit information was significantly higher than social, physical, and emotional benefit treatments. The other reported WTP values were not significantly different at 5%. These results demonstrate that some benefit information exhibits similar values and may appeal similarly to end consumers, with economic benefits generally obtaining lower WTP values. Table 5 shows the correlations between the different benefit messages. The significant, slightly negative values range from −0.117 to −0.165, indicating a slight negative correlation between the benefit information treatments.
Table 4.
Pairwise t-test t-values of mean willingness-to-pay estimates (n = 435) derived from a study investigating the effect of benefits-related messaging from a study of consumer plant purchasing patterns.
Table 5.
Spearman correlations between plant benefit information variables from a study investigating the effect of benefits-related messaging from a study of consumer plant purchasing patterns.
The Tobit model estimates are presented in Table 6 and can be interpreted as the premiums participants are willing to pay relative to the base variable. The Tobit model estimates also indicated that consumers’ WTP varied by the plant benefit information presented to them. The economic benefit information was used as the base for comparison (since it was the least valued treatment above), and cognitive, emotional, physical, and social benefits were significant at the 5 percent level. Participants indicated they were willing to pay the greatest premium of USD 6.75 for lavender plants with the social benefit information relative to lavender plants with the economic benefit information. They were willing to pay the next highest premium (USD 6.47) for lavender plants displaying the cognitive benefit information, followed by the emotional benefit information (USD 6.13) and physical benefit information (USD 6.75). Participants’ WTP for lavender plants with the aesthetic, environmental, or educational benefit information was statistically similar to the economic benefit. Plant spending in 2020 was positively correlated with participants’ WTP for the lavender plants at approximately USD 0.03. Older participants indicated they needed a discount of USD 0.28 to purchase the plants. Interestingly, males were willing to pay USD 2.20 more per lavender plant than females. Participants’ household income slightly increased their WTP for the plants.
Table 6.
Tobit model estimates reflecting participants’ willingness to pay for plants displaying different benefit information.
4. Discussion
Plant premiums have been identified for different production practices, such as locally grown plants and produce [34], as well as environmentally friendly production practices [35]. Identifying premiums consumers are willing to pay for plants that provide a myriad of benefits is a logical next step. Since they have exhibited a willingness to purchase and, in some cases, pay a premium for other products and services that enhance their quality of life in terms of social well-being, physical well-being, psychological well-being, cognitive well-being, spiritual well-being, and environmental well-being [36], identifying how benefits influence purchasing behavior may benefit green industry firms as they determine future marketing strategies.
Studies address consumers’ gardening motivations [5,7,8,9], but very few address plant benefit information and how that relates to consumer behavior [3]. The current study adds to the literature by estimating participants’ WTP for lavender plants displaying different benefit information. Aligning with Behe et al. [3], in the current study, the social plant benefit ranked highly among participants. Beyond Behe et al.’s [3] results, WTP values were elicited for different benefits with the cognitive, social, and physical benefit information generating premiums for lavender plants. This may be partially driven by the timing of the study coinciding with the COVID-19 pandemic. Prior to the pandemic, gardening motivators included pleasure and enjoyment benefits [5]. However, during the pandemic, there was an increased rate of anxiety and depression, which highlighted the need for improved mental health, and consumers actively sought means of improving their mental health [15]. Supporting evidence comes from Manso et al. [7], Bulgari et al. [8], and Pérez-Urrestarazu et al. [9], who found positive relationships between engaging with plants and personal well-being during the pandemic. It was not surprising, then, that the cognitive benefits derived from plants produced the highest mean WTP in this study, followed closely by social benefits, physical benefits, and emotional benefits. As before with Behe et al., social benefits are perceived to be important [3]. Yet, this is the first study to show the WTP for the benefit. In terms of applications, firms in the green industry could utilize these findings in their marketing efforts, highlighting the positive contributions that plants provide in alleviating the mental health crisis in the country today [37]. Such efforts should positively influence the inelasticity of demand, generating a long-needed opportunity to raise prices.
Interestingly, the economic benefit information elicited one of the lowest WTP estimates on the part of consumers. Previously, supporting evidence from Egerer et al. identified economic uncertainty and saving/earning money as the least important motivators for gardening during the pandemic [4]. However, existing studies demonstrate that plants do provide many economic benefits to the homeowner [38] and commercial businesses [34]. Yet, in the current climate, these benefits were not as important for consumers as the cognitive, social, physical, or emotional benefit statements. This finding may seem curious, given that consumers usually increase their spending on gardening and landscaping projects amid economic downturns [39]; however, this particular economic decline caused by the pandemic was countered with fiscal policies (e.g., CARES Act) that provided a financial buffer for household incomes during the pandemic. Thus, economic benefits may not have resonated quite as much during this timeframe. Applications from these results highlight the need for industry stakeholders to proactively adjust their marketing messages and focus on benefits based on the current situation.
The fact that the functional benefits of plants are not part of the everyday language of consumers presented a challenge to the research team to provide enough detail for consumers to understand the nature of each of the eight benefit categories without making the survey too long and encountering respondent fatigue. While benefit-related statements were carefully crafted, relying on phraseology used in the existing literature, one limitation of this study is that it is difficult to determine whether or not the wording of those statements may have influenced WTP outcomes. Future research should focus on different benefits-related statements and use more specific types of plants. For example, indoor houseplants or potted plants may have greater WTP with respect to certain plant benefit statements compared to flowering shrubs or trees. A second limitation of the study is the hypothetical nature of the experiment. Using an online survey and panel provided the benefits of a larger, geographically diverse sample while reducing labor requirements and potential data entry errors. However, the study is still hypothetical and subject to hypothetical bias. Future studies could use real-world or retail intercept studies to test the robustness of the results. Lastly, another limitation is the method of WTP elicitation. The current research used a direct method that may be less realistic than other experimental methods (e.g., conjoint analysis, choice experiments, experimental auctions). As such, results should be interpreted cautiously. Additional studies using alternative WTP elicitation methods could aid in better understanding the value that plant benefits bring when used in the retail setting.
5. Conclusions
Currently, plant benefit information is not frequently used in retail garden centers, but there is potential to use such information to generate additional value among customers and inform them about additional benefits associated with plant interactions. The results of this study highlight the positive impacts that plant benefit information generates for lavender plants among U.S. consumers. Social, cognitive, emotional, and physical benefits all generated premiums relative to economic benefits obtained from plants. The implications are that growers and retailers should emphasize these benefits in their marketing efforts to convey additional value to their products among U.S. consumers. The results provide a base level for future studies to build on related to marketing and communicating plant benefits to end customer groups. Future work can expand upon these results by incorporating other plant species or types, aligning benefit messages with specific plants, and assessing the impact of different marketing strategies (e.g., point-of-sale format, information framing, customer segmentation) on behavior.
Author Contributions
Conceptualization, A.L.R., M.J.K., B.K.B. and C.R.H.; methodology, A.L.R., M.J.K., B.K.B. and C.R.H.; formal analysis, A.L.R.; resources, B.K.B. and C.R.H.; data curation, A.L.R. and M.J.K.; writing—original draft preparation, A.L.R.; writing—review and editing, A.L.R., M.J.K., B.K.B. and C.R.H.; visualization, A.L.R., M.J.K., B.K.B. and C.R.H.; project administration, B.K.B. and C.R.H.; funding acquisition, B.K.B. and C.R.H. All authors have read and agreed to the published version of the manuscript.
Funding
This research was funded by a grant from the Floriculture and Nursery Crops Research Initiative and the National Institute of Food and Agriculture.
Data Availability Statement
Data are not publicly available due to privacy concerns.
Conflicts of Interest
The authors declare no conflict of interest.
References
- Hall, C.R.; Hodges, A.W.; Khachatryan, H.; Palma, M.A. Economic contributions of the green industry in the United States in 2018. J. Environ. Hort. 2020, 38, 73–79. [Google Scholar]
- Whitinger, D.; Cohen, P. National Gardening Survey; National Gardening Association: Burlington, VT, USA, 2021. [Google Scholar]
- Behe, B.K.; Huddleston, P.T.; Hall, C.R. Gardening motivations of U.S. plant purchasers during the COVID-19 pandemic. J. Environ. Hort. 2022, 40, 10–17. [Google Scholar] [CrossRef]
- Egerer, M.; Lin, B.; Kingsley, J.; Marsh, P.; Kiekmann, L.; Ossola, A. Gardening can relieve human stress and boost nature connection during the COVID-19 pandemic. Urban For. Urban Green. 2022, 68, 127483. [Google Scholar] [CrossRef]
- Chalmin-Pui, L.S.; Griffiths, A.; Roe, J.; Heaton, T.; Cameron, R. Why garden?—Attitudes and the perceived health benefits of home gardening. Cities 2021, 112, 103–118. [Google Scholar] [CrossRef]
- Campbell, B.L.; Rihn, A.L.; Campbell, J.H. Impact of the coronavirus pandemic on plant purchasing in Southeastern United States. Agribus. Int. J. 2021, 37, 160–170. [Google Scholar] [CrossRef]
- Manso, M.; Sousa, V.; Silva, C.M.; Cruz, C.O. The role of green roofs in post COVID-19 confinement: An analysis of willingness to pay. J. Build. Engin. 2021, 44, 103388. [Google Scholar] [CrossRef]
- Bulgari, R.; Petrini, A.; Cocetta, G.; Nicoletto, C.; Ertani, A.; Sambo, P.; Ferrante, A.; Nicola, S. The impact of COVID-19 on horticulture: Critical issues and opportunities derived from an unexpected occurrence. Horticulturae 2021, 7, 124. [Google Scholar] [CrossRef]
- Pérez-Urrestarazu, L.; Kaltsidi, M.P.; Nektarios, P.A.; Markakis, G.; Loges, V.; Perini, K.; Fernández-Cañero, R. Particularities of having plants at home during the confinement due to the COVID-19 pandemic. Urban For. Urban Green. 2021, 59, 126919. [Google Scholar] [CrossRef]
- Hall, C.R.; Knuth, M.J. An update of the literature supporting the well-being benefits of plants: A review of the emotional and mental health benefits of plants. J. Environ. Hort. 2019, 37, 30–38. [Google Scholar] [CrossRef]
- Hall, C.R.; Knuth, M.J. An update of the literature supporting the well-being benefits of plants: Part 2 physiological health benefits. J. Environ. Hort. 2019, 37, 67–73. [Google Scholar] [CrossRef]
- Hall, C.R.; Knuth, M.J. An update of the literature supporting the well-being benefits of plants: Part 3 social benefits. J. Environ. Hort. 2019, 37, 136–142. [Google Scholar] [CrossRef]
- Hall, C.R.; Knuth, M.J. An update of the literature supporting the well-being benefits of plants: Part 4 available resources and usage of plant benefits information. J. Environ. Hort. 2020, 38, 68–72. [Google Scholar] [CrossRef]
- Beard, J.G.; Ragheb, M.G. Measuring leisure satisfaction. J. Leis. Res. 1980, 12, 20–33. [Google Scholar] [CrossRef]
- Schafer, K.M.; Liberman, A.; Sever, A.C.; Joiner, T. Prevalence rates of anxiety, depressive, and eating pathology symptoms between the pre- and peri-COVID-19 eras: A meta analysis. J. Affect. Disord. 2022, 298, 364–372. [Google Scholar] [CrossRef]
- Behe, B.K.; Dennis, J.H. Age influences gardening purchases, participation, and customer satisfaction and regret. In Proceedings of the XVI International Symposium of Horticulture and Economic Management Conference, Chiang Mai, Thailand, 28 June–3 July 2009; Volume 831, pp. 179–184. [Google Scholar] [CrossRef]
- Diekmann, L.O.; Gray, L.C.; Baker, G.A. Growing ‘good food’: Urban gardens, culturally acceptable produce and food security. Renew. Agric. Food Syst. 2018, 35, 169–181. [Google Scholar] [CrossRef]
- McFarland, A.; Waliczek, T.M.; Etheredge, C.; Lillard, A.J.S. Understanding motivations for gardening using a qualitative general inductive approach. HortTechnology 2018, 28, 289–295. [Google Scholar] [CrossRef]
- Rihn, A.L.; Khachatryan, H.; Campbell, B.; Hall, C.; Behe, B. Consumer preferences for organic production methods and origin promotions on ornamental plants: Evidence from eye-tracking experiments. Agric. Econ. 2016, 47, 599–608. [Google Scholar] [CrossRef]
- Yue, C.; Dennis, J.H.; Behe, B.K.; Hall, C.R.; Campbell, B.; Lopez, R.G. Investigating consumer preference for organic, local, or sustainable plants. HortScience 2011, 46, 610–615. [Google Scholar] [CrossRef]
- Jose, S.B.; Wu, C.-H.; Kamoun, S. Overcoming plant blindness in science, education, and society. Plants People Planet 2019, 1, 169–172. [Google Scholar] [CrossRef]
- McCullough, D. Web-based market research: The dawning of a new age. Direct Mark.-Gard. City 1998, 61, 36–38. [Google Scholar]
- Dillman, D.; Smyth, J.; Christian, L. Internet, Mail, and Mixed-Mode Surveys: The Tailored Design Method; John Wiley & Sons, Inc.: Hoboken, NJ, USA, 2009. [Google Scholar]
- Behe, B.K.; Knuth, M.; Hall, C.R.; Huddleston, P.T.; Fernandez, R.T. Consumer involvement with and expertise in water conservation and plants affect landscape plant purchases, importance, and enjoyment. HortScience 2018, 53, 1164–1171. [Google Scholar] [CrossRef]
- Knuth, M.; Behe, B.K.; Hall, C.R.; Huddleston, P.T.; Fernandez, R.T. Sit back or dig in: The role of activity level in landscape market segmentation. HortScience 2019, 54, 1818–1823. [Google Scholar] [CrossRef]
- Schmidt, J.; Bijmolt, T.H.A. Accurately measuring willingness to pay for consumer goods: A meta-analysis of the hypothetical bias. J. Acad. Mktg. Sci. 2020, 48, 499–518. [Google Scholar] [CrossRef]
- Knuth, M.; Behe, B.K.; Huddleston, P.T. Simple or complex? Consumer response to display signs. Interdiscip. J. Signage Wayfinding 2020, 4, 7–22. [Google Scholar] [CrossRef]
- Palma, M.A.; Collart, A.J.; Chammoun, C.J. Information asymmetry in consumer perceptions of quality-differentiated food products. J. Consum. Aff. 2015, 49, 596–612. [Google Scholar] [CrossRef]
- Greene, W.H. Econometric Analysis, 5th ed.; Prentice Hall: Upper Saddle River, NJ, USA, 2005. [Google Scholar]
- Tobin, J. Estimation of Relationships for Limited Dependent Variables. Econ. J. Econ. Soc. 1958, 26, 24–36. [Google Scholar] [CrossRef]
- Campbell, B.; Khachatryan, H.; Rihn, A. Pollinator-friendly plants: Reasons for and barriers to purchase. HortTechnology 2017, 27, 831–839. [Google Scholar] [CrossRef]
- Rihn, A.; Wei, X.; Khachatryan, H. Text vs. logo: Does eco-label format influence consumers’ visual attention and willingness-to-pay for fruit plants? An experimental auction approach. J. Behav. Exper. Econ. 2019, 82, 101452. [Google Scholar] [CrossRef]
- U.S. Census Bureau. QuickFacts United States. 2022. Available online: https://www.census.gov/quickfacts/fact/table/US/PST045221 (accessed on 28 April 2022).
- Khachatryan, H.; Rihn, A.; Campbell, B.; Behe, B.; Hall, C. How do consumer perceptions of “local” production benefits influence their visual attention to state marketing programs? Agribus. Int. J. 2017, 34, 390–406. [Google Scholar] [CrossRef]
- Getter, K.; Behe, B.; Wollaeger, H. Comparative consumer perceptions on eco-friendly and insect management practices on floriculture crops. HortTechnology 2016, 26, 46–53. [Google Scholar] [CrossRef]
- Hall, C.R.; Dickson, M.W. Economic, environmental, and health/well-being benefits associated with green industry products and services: A review. J. Environ. Hort. 2011, 29, 96–103. [Google Scholar] [CrossRef]
- McQuillan, S. 11 Ways Plants Enhance Your Mental and Emotional Health. Psychology Today, 2019. Available online: https://www.psychologytoday.com/us/blog/cravings/201909/11-ways-plants-enhance-your-mental-and-emotional-health (accessed on 24 May 2022).
- Hardy, J.; Behe, B.; Barton, S.; Page, T.; Schtuzki, R.E.; Muzi, K.; Fernandez, R.T.; Haque, M.T.; Brooker, B.; Hall, C.R.; et al. Consumer perceptions of landscape plant size, design style, and material. J. Environ. Hort. 2000, 18, 224–230. [Google Scholar]
- BusinessWire. U.S. Landscaping Market: Growth, Trends & Forecast 2020–2025—ResearchAndMarkets.com. 2020. Available online: https://www.businesswire.com/news/home/20200904005341/en/U.S.-Landscaping-Market-Growth-Trends-Forecast-2020-2025---ResearchAndMarkets.com (accessed on 8 August 2022).

Disclaimer/Publisher’s Note: The statements, opinions and data contained in all publications are solely those of the individual author(s) and contributor(s) and not of MDPI and/or the editor(s). MDPI and/or the editor(s) disclaim responsibility for any injury to people or property resulting from any ideas, methods, instructions or products referred to in the content. |
© 2023 by the authors. Licensee MDPI, Basel, Switzerland. This article is an open access article distributed under the terms and conditions of the Creative Commons Attribution (CC BY) license (https://creativecommons.org/licenses/by/4.0/).