Article

Distribution of Indolic Glucosinolates in Different Developmental Stages and Tissues of 13 Varieties of Cabbage (Brassica oleracea L. var. capitata)

1
State Key Laboratory of Crop Stress Biology for Arid Areas, College of Horticulture, Northwest A&F University, Xianyang 712100, China
2
Department of Horticulture, The University of Haripur, Haripur 22620, Pakistan
3
Weifang Academy of Agricultural Sciences, Weifang 261071, China
*
Authors to whom correspondence should be addressed.
Horticulturae 2023, 9(8), 867; https://doi.org/10.3390/horticulturae9080867
Submission received: 25 June 2023 / Revised: 24 July 2023 / Accepted: 27 July 2023 / Published: 29 July 2023

Abstract

:
Cabbage (Brassica oleracea L. var. capitata) is an excellent source of glucosinolates (GLS) that could reduce the risk of chronic diseases. The purpose of this study was to investigate the biological traits, pigment contents, color, and GLS content of 13 cabbage varieties. This study found that there were significant differences in the GLS content for various developmental stages of cabbage varieties, and the accumulation of GLS in young leaves was higher than that in mature stages. In most of the samples, the GLS content accumulated in different parts and changed as inner leaf > middle leaf > condensed stem > root. Double haploids of the M18-15 variety may be good candidates for future breeding programs and consumers, due to their high GLS content (ranging from 201.10 to 396.25 nmol mg−1 FW). GLS also act as a defense substance, and the data related to GLS accumulation patterns in different leaf locations and root parts may be useful for understanding leaf defense mechanisms and potential source–sink relationships. In addition, the observed interspecific variability is beneficial for breeders to develop Brassica varieties with high GLS content, as well as for the development of new functional food additives.

1. Introduction

Glucosinolates (GLS) are a class of plant secondary metabolites with nutritional function and biological activity [1]. GLS are composed of three moieties: a β-thioglucose moiety, a sulfonated oxime moiety, and a variable side chain aglycone derived from an α-amino acid [2]. About 120 GLS have been identified, and all of them share a common stable core structure and variable R side chains derived from amino acids [3]. According to the origin of their R side chain, the GLS can be divided into three categories: aliphatic GLS, aromatic GLS, and indolic GLS [4]. A study has shown that GLS are crucial for a plant’s ability to deal with biotic and abiotic stressors [5]. The content of GLS increases significantly under drought stress, which may be due to the fact that carbon (C) and nitrogen (N) are preferentially transferred to secondary metabolism in the primary metabolism of plants under the condition of insufficient water, thus promoting the generation of C- and N-rich secondary metabolites such as GLS [6]. In addition, GLS, as a secondary metabolite rich in N and sulfur, are affected by the content of N and S in the nature environment of plants. After the application of a sulfur fertilizer, the content of GLS, especially aliphatic GLS, increased in plants accordingly [5].
Glucosinoline–myrosinase also plays an important role in stress resistance [7]. This system is considered to be an important defense system in cruciferous plants and plays an important role in protecting the plants and coping with biotic and abiotic stresses [8]. In addition, some GLS have also been reported to have anticancer activities [9]. Previous studies demonstrated that the long-term consumption of cruciferous plants can significantly reduce the risk of gastric and breast cancers [10]. The role of indolic GLS as cancer chemoprotectants and their bioavailability in vivo have been well demonstrated. Among indolic GLS, the indolic-3-carbinol (I3C), together with its condensation product 3,3′-diindolylmethane (DIM), plays a variety of biological activities, including controlling cell division and apoptosis in cancer cells [11]. Indolic-3-carbinol (I3C) is a common phytochemical in cruciferous vegetables, including cabbage, broccoli, cauliflower, and brussels sprouts [12]. Simultaneously, human health studies have shown that I3C supplementation may be beneficial in the treatment of diseases associated with human papillomavirus infection, such as cervical intraepithelial neoplasia and recurrent respiratory papillomatosis [13]. This has led to the breeding efforts of cruciferous vegetables with high GLS content to enhance the nutritional value of these vegetables.
Cabbage is an annual or biennial herb of the Brassica genus. It is cultivated all over the world, and it is used as a vegetable and as fodder [14]. Studies have shown that the distribution and main types of GLS in the tissues and organs of Brassica oleracea are affected by many environmental factors [15]. Low temperature increased the contents of aliphatic GLS and indolic GLS in cabbage, as well as the soluble sugar content, phenolic substances, and carotenoid content [16].
The global food crisis has led to a surge in demand for food and vegetables with high nutritional value [17]. At the same time, most of the research on GLS content and metabolism of B. oleracea mainly focused on the seedling stage [18]. However, few research on the GLS content in product organs were explored. In addition, the quantification of GLS in commercial varieties of cabbage can better provide consumers with a choice to buy a variety of beneficial GLS in cabbage products. At the same time, research on this highly efficient, nutritious vegetable can deal with environmental pollution, food shortage, and other problems [19]. Notably, genotypic differences in cabbage vegetables also affect the spatial distribution and concentration of GLS [20], and the genotype has a greater impact than environmental factors [21].
Previous studies have shown that GLS metabolism accounts for about 15% of the energy of photosynthesis in Arabidopsis thaliana [22]. This expensive metabolic cost is closely related to growth and development [23,24]. Simultaneously, we noted that there are few studies on the relationship between biological traits and GLS. Therefore, our main objectives are to study 1. the biological characteristics and GLS of the 13 different varieties of cabbage at different developmental stages and 2. the GLS changes at different leaf positions under field conditions. In particular, we focus on indolic GLS, which is the dominant form of GLS and can be identified in all tissues and growth stages in our study. We further study the relationship between GLS metabolism and the growth of cabbage. Finally, we will discuss the comparison of edible organs and root and central column GLS to assess their sink/source relationships and accumulation patterns.

2. Materials and Methods

2.1. Plant Material and Growth Conditions

The cabbage seeds were provided by Prof. Enhui Zhang, College of Horticulture, Northwest A&F University, and the specific germplasm resources information is shown in Table S1. Three varieties were inbred (02-12) or double haploid (S18-13, M18-15), and the rest of the varieties (QG70, QG80, JF1H, ZG590, ZG104, LQ66, LG60, SL60, SG25, and XG097) were hybrid varieties. On 20 July 2021, we planted the selected 13 varieties in the Cao Xinzhuang experimental farm (34°028′ N, 108°07′ E, altitude: 530 m) in Yangling, Shaanxi, China. Each variety was cultivated with 20 plants. The region experiences a temperate, semihumid climate with a mean annual temperature of 16 °C, a mean annual precipitation of 632 mm, approximately 60% of the precipitation occurring between July and September, four distinct seasons, and ample sunshine. The field was dug deep before winter, with 730 kg/ha of ammonium bicarbonate and 700 kg/ha of fertilizer (containing 18% N, 5% P2O5, and 22% K2O) applied as a base fertilizer before sowing. The plot area is 9 m2, the plot width is 1.0 m, and the row spacing is 45 cm per plot. About 50 plants were planted in each plot. Throughout the growing period, topdressing was performed in the rosette stage using a completely random block arrangement. On 20 September 2021, the seedling stage samples were collected. Similarly, on 20 October 2021, the initial pellet sampling was taken. On 28 November 2021, the inner, middle, and outer leaves, as well as the central column and root of the 13 cabbage bulbs, were sampled, respectively. On 20 December, the material samples were taken at the end of the late stage of cabbage setting. During the sampling, an electronic balance was used to weigh the sample, and the sample was quickly placed into a centrifugal tube with 1 ml of methanol and stored in ice. The detailed sampling locations are shown in Figure 1. The extraction of GLS was carried out immediately after the sampling, and the remaining samples were stored at −80 °C after completion.

2.2. Investigation of Biological Traits

A series of tools was prepared, including an electronic scale, a measuring tape, a kitchen knife, an absorbent cloth, and filtered water. The following characteristics were mainly measured following Wei et al. [25]. Phenotypic clustering was performed based on Ward’s method using squared Euclidean distance (ED) [26].

2.3. Chemicals and Reagents

Ethanol (Fuyu Fine Chemical Co., Ltd., Tianjin, China), hydrochloric acid (HaoHua chemical reagent Co., Ltd., Luoyang, China), methanol (Simark, Guangdong, China), sephadex DEAE (Sigma-Aldrich, Shanghai, China), and sulfatase (Sigma-Aldrich, Shanghai, China) were used.

2.4. Color Difference Measurement

The color difference between leaves of different cabbage varieties was measured using a CR-410 chroma meter (Konica Minolta, Inc., Osaka, Japan). Six cabbage leaves in different parts were taken and cut into circles with a mold with a diameter of 3 cm for reserve. L*, a*, and b* were used for measurements, where L* represents lightness with a value ranging from 0 to 100, indicating that the color is from black to white; a* and b * values indicate the color chroma, where +a* indicates the red, −a* indicates green, +b* indicates the yellow, −b* indicates the blue color, and the magnitude of the value indicates the intensity of the hue [27].

2.5. Determination of Chlorophyll, Carotenoid, Total Phenolic, and Flavonoids Contents

2.5.1. Determination of Chlorophyll and Carotenoid Contents

The contents of chlorophyll and carotenoid were measured according to He et al. [28]. In brief, a 0.2 g sample was put into a 2 mL strip ball centrifuge tube, was ground, had 1.5 mL of 96% ethanol added, and was soaked in the dark overnight. After 12 h, the sample was centrifuged at 8000 rpm for 15 min. And then, the 665, 649, and 470 nm were measured using a spectrophotometer (UV-1800, Shimadzu, Kyoto, Japan) [29]. The contents of chlorophyll and carotenoids were calculated as the following: Chlorophyll a (Chl a) (mg/L) = 13.95 A665−6.88 A649; Chlorophyll b (Chlb) (mg/L) = 24.96 A649−7.32 A665; and Carotenoids (Car) (mg/L) = (1000 A470−2.05 Chla−114.8 Chlb)/245.

2.5.2. Determination of Total Phenolic and Flavonoid Contents

Total phenolic and flavonoid contents were measured by Huang et al. [30]. In brief, 0.5 g samples were ground together with hydrochloric acid 1% (v/v) with methanol and were then transferred to a 20 mL graduated test tube, fully mixed, extracted for 35 min in the dark. The absorbance of the total phenolic and flavonoid was measured at 280 nm and 325 nm, respectively. The contents of the total phenolics and flavonoids were shown as OD280 g−1 and OD325 g−1, respectively.

2.6. Analysis of GLS

Before sampling, a 2 mL centrifuge tube was prepared, and 95% methanol was added. After sample collection, a grinder was used to grind for 60 s at a frequency of 50 Hz, then incubated at a constant temperature for 1 h. At the same time, the experimental material was configured: Sephadex DEAE (Sigma-Aldrich, Shanghai, China), 1g + 15mL of ddH2O was hydrated for 1 h at room temperature and stored at 4 °C. A total of 200 μL of ddH2O and 10 μL of Sulfatase were added to each sample. The purified samples were detected and analyzed using high performance liquid chromatography (HPLC, Shimazu LC-2030 Plus, Japan) according to the method described in a previous study [31]. The detection conditions were as follows: the injection volume was 50 μL, the mobile phase was acetonitrile and dihydrogen water, and the flow rate was 1 mL min−1. The determination was performed on HypersilC18 (5 μm, 4.6 mm × 250 mm, Elite) at 30 °C. Representative GLS chromatograms of cabbage are provided in Figure S1.

2.7. Statistical Analysis

The data were analyzed with analysis of variance (ANOVA) followed by Duncan’s multiple range test (p < 0.05) using the SPSS version 23.0 statistical software (SPSS Inc., Chicago, IL, USA). The values were expressed as mean ± standard deviation (SD) of three biological replicates. Principal components analysis (PCA) was plotted using https://www.bioinformatics.com.cn, accessed on 18 July 2022. Corrplot analysis was performed using Hiplot (https://hiplot.org, accessed on 23 July 2022).

3. Results

3.1. Investigation on Biological Traits of 13 Cabbage Varieties

Different cabbage varieties exhibited significant morphological variations (Figure 2). Among them, it was evident that the variety of the 02-12 plants were the smallest. The mean values of 16 agronomic traits of 13 cabbage varieties are shown in Table S2. The QG80 variety of cabbage exhibited the largest midrib width of 3.35 cm, while the 02-12 exhibited the smallest of 1.87 cm. The largest condensed stem width was in QG80, reaching 4.42 cm, and the smallest was in LQ66, reaching 2.3 cm. The largest NOL was noted in M18-15, reaching 21.5, while the smallest was in SG25 (10.5). With the plant’s height, QG80 had the largest outer leaf width and the largest length, compared with the other cabbage varieties. The cluster tree diagram based on the observed values of the attributes using the SPSS software (SPSS version. 23.0) divided the 13 varieties into three groups when the ED value was set to 10 (Figure 3). Group 1 consisted of S18-13 and 02-12 varieties, and Group 2 consisted of LG60, XG097, JF1H, ZG101, QG70, ZG590, SL60, SG25, and M18-15 varieties, while the QG80 and LQ varieties lay in Group 3. In general, the biological traits of the 13 cabbage varieties were quite different, providing the genetic diversity for this study.

3.2. Comparison of Total Phenolic and Pigment (Flavonoid, Chlorophyll, Carotenoid) Content of 13 Cabbage Varieties

Data regarding the total phenolic and pigment content of different cabbage varieties showed significant differences in the accumulation of outer leaf pigments (Figure 4). Among the 13 varieties, the highest and lowest total phenolic (the function of maintaining the stability of pigment structure and assisting pigmentation) contents were recorded in LQ66 and XG097, respectively (Figure 4A). In the case of total flavonoids, the highest value was observed in the LQ66 variety, and the lowest value was noted in the S18-13 variety (Figure 4B). Similarly, the highest chlorophyll content was detected in LG60 and LQ66, while the lowest was noted in ZG590 and ZG101 cabbage varieties (Figure 4C). However, the highest carotenoid content was recorded in M18-15, while the lowest was observed in the QG80 variety (Figure 4D). As shown in Figure 5A, the leaves of the JF1H and ZG101 varieties have the largest L* value, suggesting a lighter color, while the leaves of ZG590 have the lowest L* value. Similarly, the QG70, LG60, and S18-13 have the highest a* value (Figure 5B). Figure 5C shows that the 02-12 cabbage has the highest b* value, suggesting that its outer leaves are yellower. These results indicated that the outer leaves of 13 cabbage samples showed differences in the accumulation of photosynthetic pigments, suggesting that there are huge differences in the metabolic fluxes that may be greatly affected by the varieties.

3.3. Variation of GLS Content and Components in Different Developmental Stages

In this study, we focused on the accumulation of indolic GLS, which could be identified in all tested tissues and growth stages. Varieties of cabbage with different developmental stages are shown in Figure 6. The GLS were mainly concentrated in 4OH-I3M (4-hydroxy-indol-3-ylmethyl). The varieties higher at S1 were M18-15 and S18-13, at 320.81 and 505.47 nmol mg−1 FW, respectively; the lower GLS content varieties were LG60 and LQ66, reaching to 123.18 and 182.11 nmol mg−1 FW, respectively (Figure 6A). In addition, high levels of QG80 and S18-13 were observed in the S2 period, reaching to 327.42 and 392.08 nmol mg−1 FW, respectively, while lower GLS levels were observed in SG25 and XG097, reaching 9.69 and 48.16 nmol mg−1 FW, respectively (Figure 6B). The high GLS content of M18-15 accumulated during the S3 period, reaching 189.94 nmol mg−1 FW, however, most of the varieties, such as LQ66, LG60, SL60, and ZG101, had low GLS content (Figure 6C). In addition, we evaluated the proportions of the same GLS in different varieties at different developmental stages (Figure 7), in which—in the S1 stage—the proportions of 4OH-I3M, I3M (indol-3-ylmethyl), 4MOI3M (4-methoxy-indol-3-ylmethyl), and NMOI3M (N-methoxy-indol-3-ylmethyl) in M18-15 reached 9.66%, 9.66%, 7.08%, and 26.44%, respectively. However, the 4OH-I3M, I3M, 4MOI3M, and NMOI3M accounted for 4.72%, 5.49%, 5.38%, and 3.33% in LQ66, respectively. In general, M18-15, QG80, and other high-GLS varieties fluctuated in different developmental stages, and the accumulation level of GLS was higher than that of the low-GLS varieties LQ66 and LG60 in the same period.

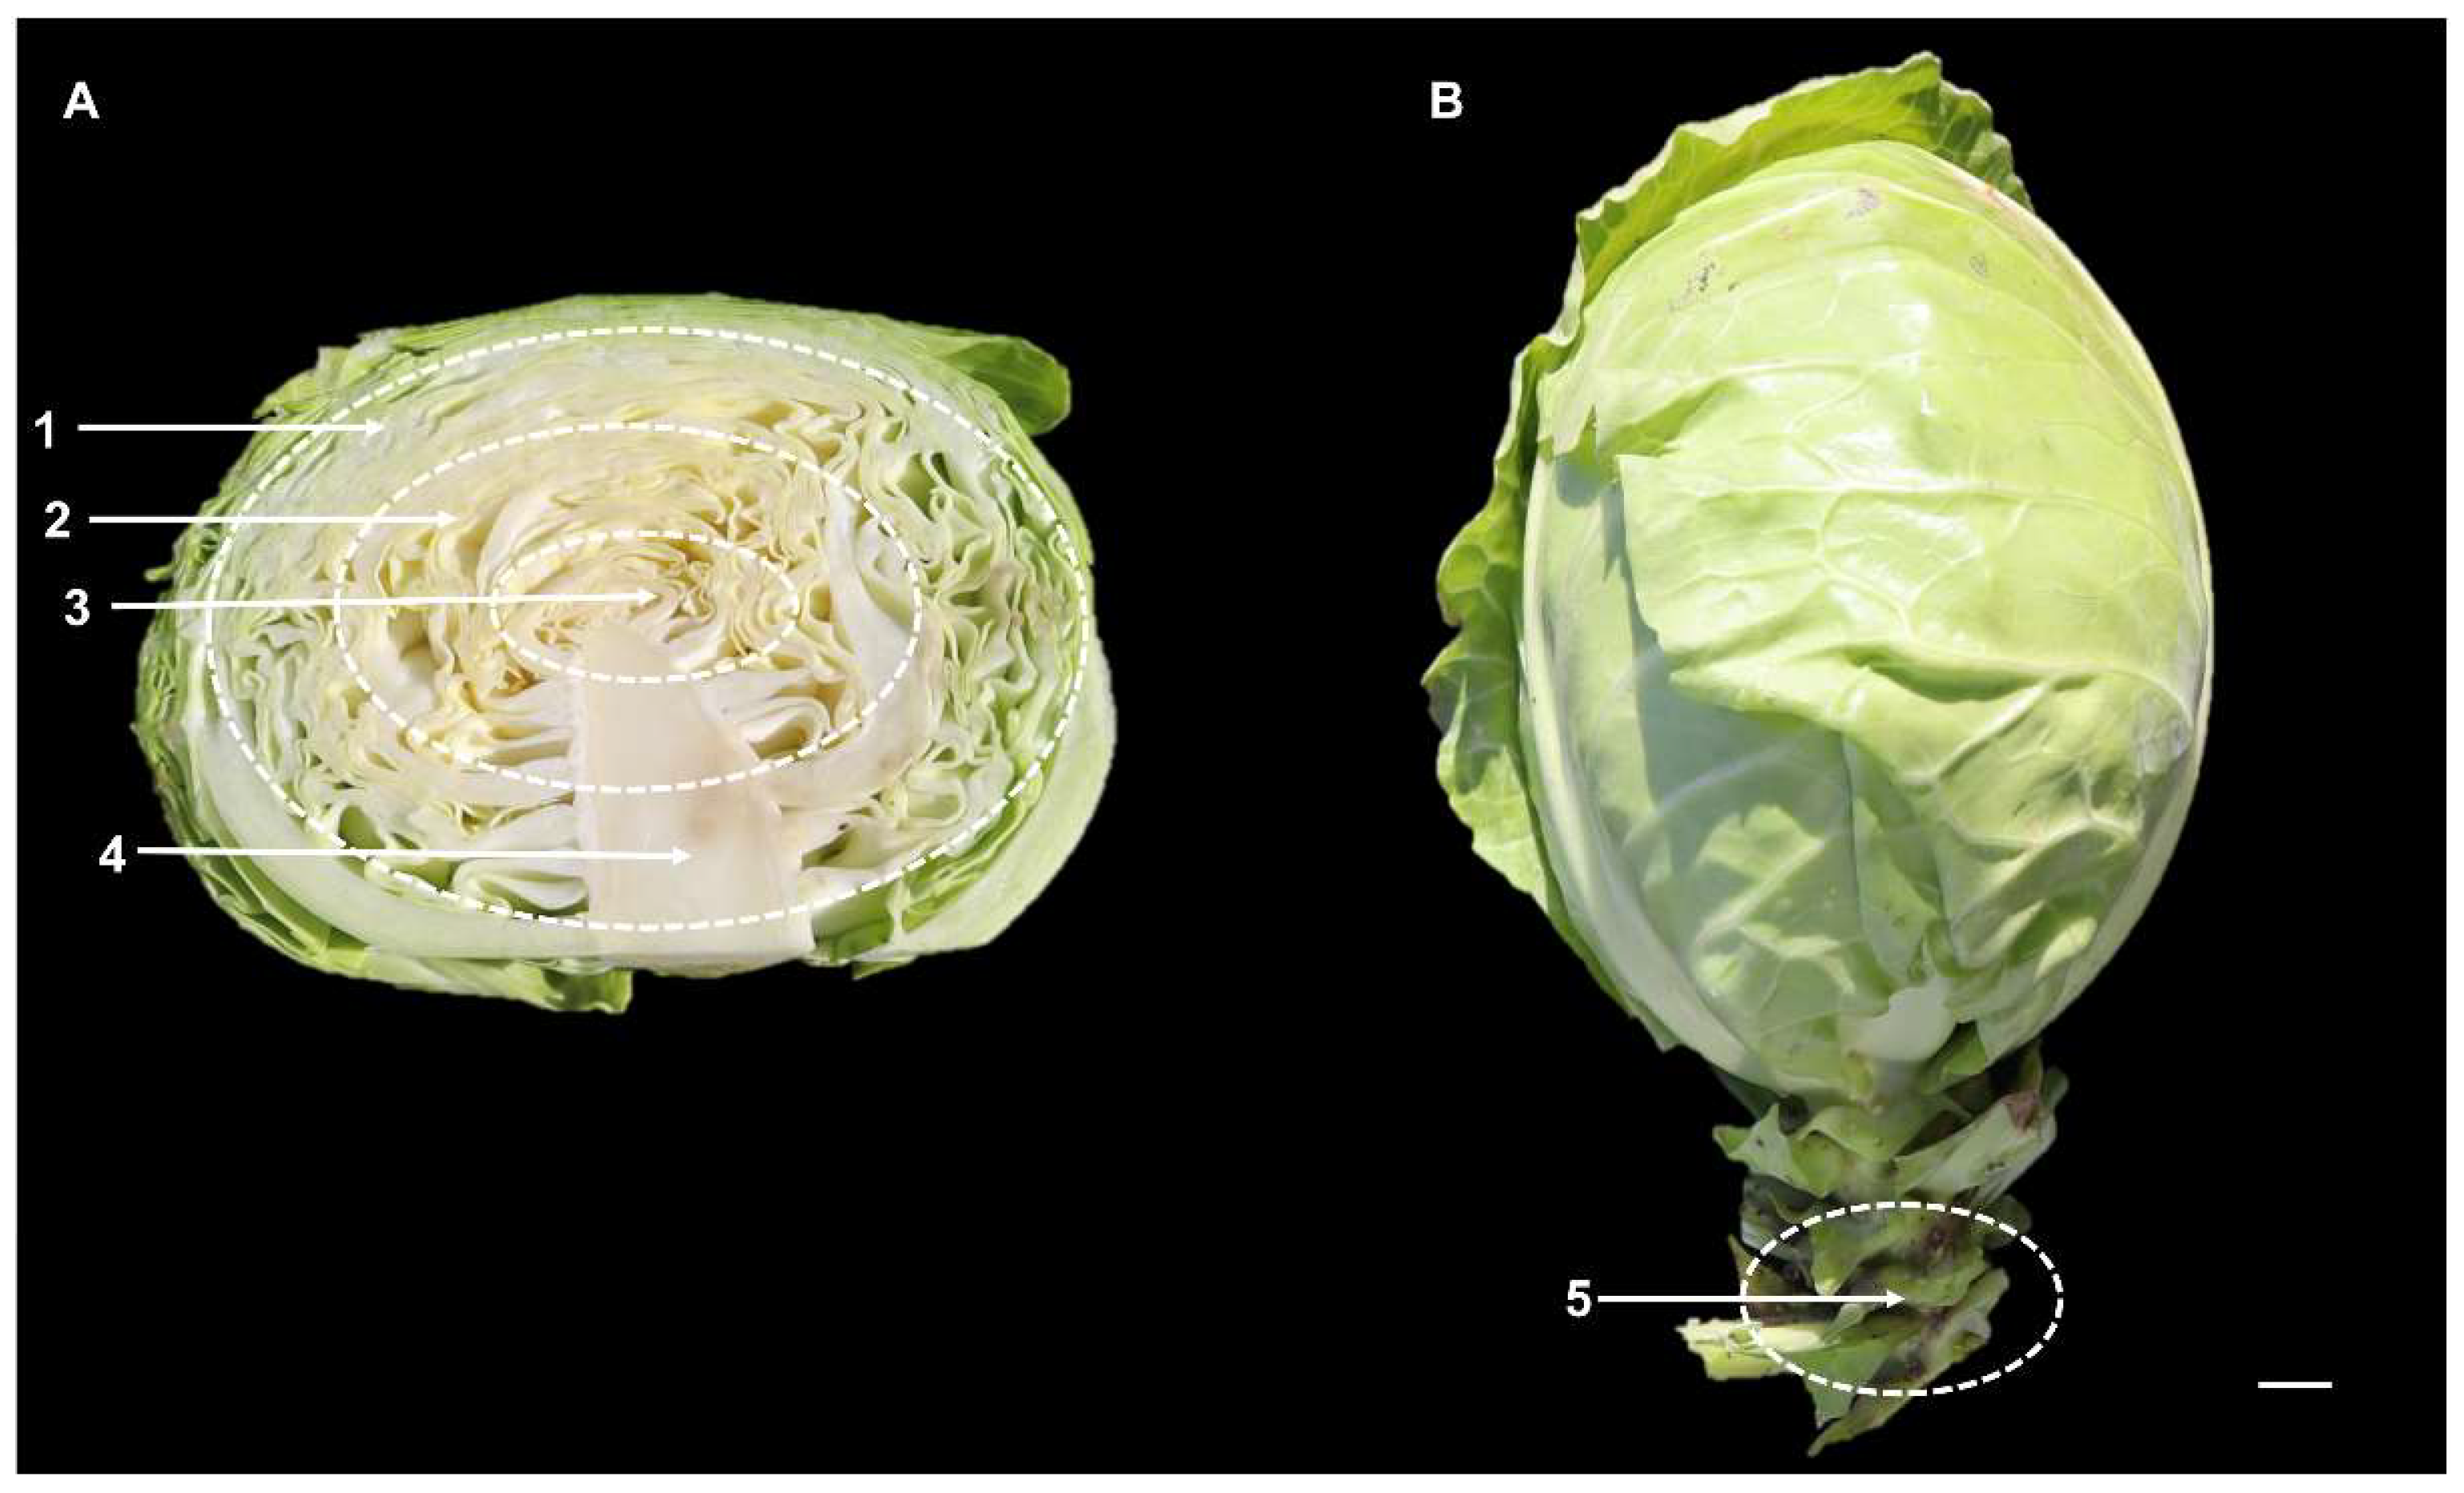
3.4. Changes of GLS Content and Components in Different Leaf Parts at S3 Stage

The S3 period is an important commercial maturity period. In order to better visualize the relationship between different leaf positions and the accumulation of GLS, the individual GLS in each material were shown in Figure 8. It is noteworthy that overall, the highest GLS content was found in the inner leaves of each material, followed by the middle leaves, condensed stem, and roots. Specifically, I3M content was highest in the middle leaf and inner leaf for M18-15, reaching 969.09 and 2689.05 nmol mg−1 FW, respectively, and lower for LQ66, reaching 39.66 and 105.76 nmol mg−1 FW, respectively. In particular, 4MOI3M and NMOI3M were also the highest in the M18-15 middle leaf, reaching 36.29 and 9.98 nmol mg−1 FW, respectively. Generally, more 4OH-I3M accumulated in the roots of most varieties compared to other parts (Figure 8D). The total indolic GLS levels and the distribution of GLS accumulation in these varieties are shown in Figure 9. The results showed that, in general, the indolic GLS in the inner leaf was higher than that of the middle leaf > condensed stem > root, and M18-15 accumulated more indolic GLS compared with LQ66 lines.

3.5. Comparison of the GLS Content in Leaves and Roots during S3 Development

The accumulation pattern of GLS in shoots of cabbage that are shown in Figure 10 specifically emphasize the difference in the accumulation of GLS in the inner leaves and roots during the S3 period. Among them, the 4OH-I3M, I3M, 4MOI3M, and NMOI3M in the inner leaves of the M18-15 at the S3 period accounted for 14.53%, 40.22%, 20.14%, and 20.72%, respectively, while in LQ66, the 4OH-I3M, I3M, 4MOI3M, and NMOI3M accounted for 5.31%, 1.91%, 3.15%, and 2.50%, respectively. In the roots of the M18-15, the 4OH-I3M, I3M, 4MOI3M, and NMOI3M accounted for 1.69%, 23.16%, 7.41%, and 2.59%, respectively. These results showed that the ratio of GLS in M18-15 in the inner leaves was significantly higher than that in LG66, while the ratio in the roots of 4OH-I3M was the opposite pattern, highlighting the different GLS accumulation patterns of above-ground and underground tissues.

3.6. The Biological Traits, Pigment, GLS Substance Correlation, and PCA Analysis for M18-15 and LQ66

The PCA analysis showed that M18-15 and LQ66 were significantly increased at the PC1 level, and their separation reached 64.8% (Figure 11), suggesting a significant difference between the two varieties from genotype to metabolites (total phenols, flavonoids, chlorophyll, and GLS). Furthermore, the correlation analysis showed that the 4OH-I3M was positively correlated with LHGW, MOLL, LHNW, RW, CSL, LHH, LHW, NOL, and TP, while negatively correlated with TF, HR, and CC in LQ66. The I3M exhibited a positive correlation with NOL, LHW, LHH, CSL, RW, LHNW, and MOLL, while showing a negative correlation with MT, MW, and MOLA. The 4MO-I3M showed a positive correlation with MOLG, LHGW, MOLL, LHNW, RW, CSL, LHH, LHW, NOL, and TP, while showing a negative correlation with MT, MW, and MOLA (Figure 12A). In M18-15, the 4OH-I3M was positively correlated with NOL, MOLG, and MOLL, while negatively correlated with LHGW, RW, CSL, TP, and TF. Likewise, the I3M was positively correlated with NOL and MOLG, while negatively correlated with LHGW, RW, CSL, and TP (Figure 12B). These results suggest that high- and low-GLS varieties have certain antagonistic effects between GLS and pigments. In addition, the leaf morphological phenotypes were closely correlated to the GLS accumulation.

4. Discussion

In this study, the biological traits of 13 cabbage varieties were investigated (Table S2), and their pigments and indolic GLS were measured and studied. Our results (discussed in detail in the next section) showed that there were large phenotypic differences among the selected varieties in different tissues. Principal component analysis (PCA) was used to identify the differences between M18-15 (a high-GLS variety) and LQ66 (a low-GLS variety).

4.1. Differences in Biological Traits and Pigment Accumulation of Cabbage

The cabbage varieties in our study could be divided into three groups based on biological traits (Figure 3). The LQ66, a representative of Group 3, and M18-15, a representative of Group 2, lie in the middle of the two groups. Further analysis revealed that LQ66 had much more levels of chlorophyll, flavonoids, and total phenolics than M18-15, indicating a significant difference in the photosynthetic pigments, flavonoids, and total phenolic compounds that greatly influence color and luster (Figure 4). The cabbage with a high pigment content attracted more consumers [32,33], while high flavonoids and total phenolic contents were also reported to be beneficial to human health [34]. In LQ66, the accumulation of high photosynthetic pigments is beneficial to absorbing light energy, producing more organic matter, resulting in higher PH, LHGW, and LHNW than the M18-15 lines, which is consistent with the previous report of Li et al. [35]. Indeed, high chlorophyll may be beneficial for capturing light energy and enhancing carbon assimilation [36]. Correspondingly, the leaf area of LQ66 was 2.07 times compared with M18-15 lines, which further enhanced the efficiency of light energy assimilation and achieved more accumulation of the biological compounds.

4.2. Comparative Analysis of GLS in Cabbage Development Period—Ecological Function

In addition to assessing the accumulation of different cabbage pigments, this study also identified important defensive GLS involved in the defense responses against biotic and abiotic stresses, which have been reported to be widespread in cabbage and other cruciferous plants [37,38,39]. Among those GLS in different developmental stages, the content of GLS in the outer leaves showed dynamic fluctuations (Figure 6), which may be due to the influence of environmental factors on the accumulation of GLS in different developmental stages. Altogether, the 13 cabbage varieties were greatly affected by genotype differences. For example, the M18-15, S18-13, and QG80 varieties have higher performance in different developmental stages as compared with LQ66, LG60, and SG25 varieties, which accumulated lower levels of GLS. The effects of different varieties on the accumulation of GLS have been reported [40,41], and there may be some antagonism between pigment and GLS metabolism. In addition, Yeo et al. [42] reported a negative correlation in the presence of cabbage pigments (chlorophyll and carotenoids) and phenylpropanoids (phenolic acids and flavanols), so the accumulation of defensive metabolites is also optimized during plant evolution to achieve a dynamic balance of defense and growth with minimal production costs [43]. Studies on the spatial distribution of GLS within cabbage leaves have proved difficult to conduct, and gradients in leaf GLS concentrations are unavoidable [44]. Shroff et al. [45] studied the spatial distribution of GLS in Arabidopsis leaves, a defense substance affecting the feeding and egg-laying preferences of insects, which seem to be consistent with our findings that in most cases, the concentration of GLS in the inner leaf is higher than that of the middle leaf > central column > root (Figure 8). This is also consistent with the optimal defense hypothesis (ODH) of plant defense allocation [46,47], in which new leaves are more vulnerable and require higher concentrations of protective substances to avoid injury [48], and the outer leaf GLS may also be diluted with leaf expansion [49]. Collectively, GLS concentration is finely regulated by internal developmental signals in plant leaves.

4.3. Accumulation Patterns of GLS in Various Organs of Cabbage

The abundance of GLS in the organs of cabbage products directly affects the nutrition of leaf bulbs and the purchasing power of consumers. This study compared the differences among the four GLS between the high-GLS material (M18-15) and the low-GLS material (LQ66) (Figure 8). In the tested cabbage varieties, the I3M of the middle and inner leaves was higher than the other three GLS, supporting that the leaves of cabbage at maturity are rich in I3M like in previous reports [40,50]. In contrast, this study also found that in most cabbage varieties, the content of 4OH-I3M was significantly higher than that of the other three GLS (Figure 8D), representing the difference of GLS enrichment in different organs of GLS. Pfalz et al. [51] have reported that I3M and 4OH-I3M are involved in the defense against aphids in Arabidopsis. On the other hand, Tsunoda et al. [52] have found that herbivores prefer roots with low GLS concentrations. So, the underground area requires specific insecticides (indolic GLS) to better protect plants. De Vos et al. [53] found indole-3-acetonitrile (IAN) could reduce laying oviposition on Arabidopsis. The GLS and their hydrolysis products might form thiohydroxamate-O-sulfonates (insect deterrent compounds), as well as toxic nitriles and epithionitriles, facilitating the protection of plants from damage. Notably, the I3M contents of the M18 middle leaves and inner leaves were 23.43- and 24.42-folds higher than that of LQ66, respectively, considering that important anticancer active substances are produced from indolic GLS [54,55]. The indolic, hydrolysis products of GLS, which inhibit phase I enzymatic activity and induce phase II enzymatic activity, are important cancer prophylactic agents [56]. In addition, the decomposition of I3M can form indolic Indole-3-acetonitrile (I3N) and I3C, which have been reported to be involved in cancer management [57], due to their association with I3C as a mutagenic protector [58]. The GLS content in the inner leaves of M18 is the highest, reaching 2775.46 nmol mg−1. Therefore, consumers are advised to consume high-GLS M18-15 inner leaves to maintain health.

4.4. Comparative Analysis of above- and under-Ground GLS Substances—Transport Process

For the defensive GLS compound, the source tissue appears to be plastic [24]; for example, the GLS of the senescent rosette leaf in Arabidopsis can be transported via phloem from mature leaves to flowers and fruits [59], however, Andersen et al. [60] suggested that GLS in grafted Arabidopsis is capable of bidirectional transport between rosette leaves and roots. The accumulation of GLS in various organs can serve as a good indicator to study the net effects of GLS in biosynthesis, transport, and metabolism [61]. Overall, the GLS of the M18-15 were significantly higher than LQ66, except in the roots of I3M which was higher than LQ66, and there was no significant difference between the other three GLS in LQ66 (Figure 10). From a defensive point of view, the 4OH-I3M, 4MOI3M, and NMOI3M are more capable of defending against aphids [51,53], and their root systems maintain maximum ecological adaptation. The future study could focus on the transport process of high-GLS and low-GLS varieties, which will stimulate research on the transport of defensive compounds as well as other metabolites (flavonoids and carotenoids).

4.5. Breeders and Consumers Preferences

The M18-15 should be highlighted on shelves in market and grocery stores, and the agricultural producers could grow it for consumers. Compared with M18-15, the total phenols, flavonoids, and chlorophyll of LQ66 are higher. However, this relies on the consumers’ preferences for nutrients. The interest of the scientists in fruit and vegetable by-products is growing at the moment [62,63], and further research should focus on the simultaneous development of precursors without sacrificing the sensory qualities of the cabbage and the health potential of these germplasm resources.

5. Conclusions

In conclusion, we investigated the indolic GLS content of 13 varieties of cabbage and observed the significant differences in total indolic GLS as well as individual GLS in different samples. The low-GLS LQ66 and high-GLS M18-15 varieties were clearly separated using PCA analysis. In all the tested varieties, the content of GLS in the inner leaf part was higher than that in the middle leaf, the central column, and the root. Furthermore, the level of GLS in the seedling stage was higher than that in the early stage of heading, and the level in the middle and end of the heading was stable. The high-GLS variety M18-15 observed in this study provides important resource information for breeders to improve GLS levels in cabbage and could also be used as an ingredient for developing new functional foods.

Supplementary Materials

The following supporting information can be downloaded at: https://www.mdpi.com/article/10.3390/horticulturae9080867/s1, Table S1: Accession numbers, scientific names, sources, and a variety of characteristics of 13 cabbage germplasm resources; Table S2: Main biological traits of 13 cabbage varieties; Figure S1: Representative HPLC chromatogram of GLS compounds from 02-12 cabbage lines. The determined GLS were 4OH-I3M, I3M, 4MOI3M, and NMOI3M, with their retention time being 11.3, 13.3, 14, and 15.4 min, respectively; Figure S2: Observation of seedling stage phenotype of 13 cabbage varieties. The serial numbers are QG70, QG80, JF1H, ZG590, ZG104, LQ66, LG60, SL60, SG25, M18-15, S18-13, 02-12, and XG097; Figure S3: Representative cabbage leaf ball and vertical section.

Author Contributions

Conceptualization, Q.P.; Data curation, Q.P.; Formal analysis, Q.P., J.Z., S.F., B.L. and R.Z.; Funding acquisition, Z.X. and B.L.; Investigation, J.Z., T.L., Z.X. and M.H.; Methodology, J.Z., C.Y., A.K., T.L., R.Z. and M.H.; Project administration, B.L.; Resources, M.H.; Software, C.Y. and S.F.; Validation, J.Z., A.K. and R.Z.; Visualization, C.Y., A.K. and M.H.; Writing—original draft, Q.P., J.Z., C.Y., A.K., T.L., Z.X., R.Z. and M.H.; Writing—review and editing, Q.P., S.F., B.L., R.Z. and M.H. All authors have read and agreed to the published version of the manuscript.

Funding

This research was funded by the National Key Research and Development Program of China (2016YFD0101702) and the Startup Funding (Z111021922) from Northwest A&F University.

Data Availability Statement

The data are contained within the article or the Supplementary Materials.

Acknowledgments

We thank Jing Zhang and Jing Zhao (Horticulture Science Research Center, Northwest A&F University, Yangling, China) for their assistance with the HPLC analysis of the GLS samples. We also thank Huimian Yang and Fangning Cui for their help in cultivating the cabbage varieties in the field.

Conflicts of Interest

The authors declare no conflict of interest.

References

  1. Lee, J.G.; Bonnema, G.; Zhang, N.; Kwak, J.H.; de Vos, R.C.; Beekwilder, J. Evaluation of glucosinolate variation in a collection of turnip (Brassica rapa) germplasm by the analysis of intact and desulfo glucosinolates. J. Agric. Food Chem. 2013, 61, 3984–3993. [Google Scholar] [CrossRef]
  2. Klopsch, R.; Witzel, K.; Artemyeva, A.; Ruppel, S.; Hanschen, F.S. Genotypic variation of glucosinolates and their breakdown products in leaves of Brassica rapa. J. Agric. Food Chem. 2018, 66, 5481–5490. [Google Scholar] [CrossRef]
  3. Andini, S.; Dekker, P.; Gruppen, H.; Araya-Cloutier, C.; Vincken, J.-P. Modulation of glucosinolate composition in Brassicaceae seeds by germination and fungal elicitation. J. Agric. Food Chem. 2019, 67, 12770–12779. [Google Scholar] [CrossRef] [Green Version]
  4. Ishida, M.; Hara, M.; Fukino, N.; Kakizaki, T.; Morimitsu, Y. Glucosinolate metabolism, functionality and breeding for the improvement of Brassicaceae vegetables. Breed. Sci. 2014, 64, 48–59. [Google Scholar] [CrossRef] [Green Version]
  5. Falk, K.L.; Tokuhisa, J.G.; Gershenzon, J. The effect of sulfur nutrition on plant glucosinolate content: Physiology and molecular mechanisms. Plant Biol. 2007, 9, 573–581. [Google Scholar] [CrossRef]
  6. Haugen, R.; Steffes, L.; Wolf, J.; Brown, P.; Matzner, S.; Siemens, D.H. Evolution of drought tolerance and defense: Dependence of tradeoffs on mechanism, environment and defense switching. Oikos 2008, 117, 231–244. [Google Scholar] [CrossRef]
  7. Ratzka, A.; Vogel, H.; Kliebenstein, D.J.; Mitchell-Olds, T.; Kroymann, J. Disarming the mustard oil bomb. Proc. Natl. Acad. Sci. USA 2002, 99, 11223–11228. [Google Scholar] [CrossRef]
  8. Lv, Q.; Li, X.; Fan, B.; Zhu, C.; Chen, Z. The Cellular and Subcellular Organization of the Glucosinolate–Myrosinase System against Herbivores and Pathogens. Int. J. Mol. Sci. 2022, 23, 1577. [Google Scholar] [CrossRef]
  9. Kim, H.; Kim, J.-Y.; Kim, H.-J.; Kim, D.-K.; Jo, H.-J.; Han, B.-S.; Kim, H.-W.; Kim, J.-B. Anticancer activity and quantitative analysis of glucosinolates from green and red leaf mustard. Korean J. Food Nutr. 2011, 24, 362–366. [Google Scholar] [CrossRef]
  10. Grubb, C.D.; Abel, S. Glucosinolate metabolism and its control. Trends Plant Sci. 2006, 11, 89–100. [Google Scholar] [CrossRef]
  11. Licznerska, B.; Baer-Dubowska, W. Indole-3-Carbinol and Its Role in Chronic Diseases. Adv. Exp. Med. Bio. 2016, 928, 131–154. [Google Scholar]
  12. Takada, Y.; Andreeff, M.; Aggarwal, B.B. Indole-3-carbinol suppresses NF-κB and IκBα kinase activation, causing inhibition of expression of NF-κB-regulated antiapoptotic and metastatic gene products and enhancement of apoptosis in myeloid and leukemia cells. Blood 2005, 106, 641–649. [Google Scholar] [CrossRef] [Green Version]
  13. Higdon, J.V.; Delage, B.; Williams, D.E.; Dashwood, R.H. Cruciferous vegetables and human cancer risk: Epidemiologic evidence and mechanistic basis. Pharmacol. Res. 2007, 55, 224–236. [Google Scholar] [CrossRef] [Green Version]
  14. Kim, J.K.; Chu, S.M.; Kim, S.J.; Lee, D.J.; Lee, S.Y.; Lim, S.H.; Ha, S.-H.; Kweon, S.J.; Cho, H.S. Variation of glucosinolates in vegetable crops of Brassica rapa L. ssp. pekinensis. Food Chem. 2010, 119, 423–428. [Google Scholar] [CrossRef]
  15. Bhandari, S.R.; Jo, J.S.; Lee, J.G. Comparison of glucosinolate profiles in different tissues of nine Brassica crops. Molecules 2015, 20, 15827–15841. [Google Scholar] [CrossRef] [Green Version]
  16. Ljubej, V.; Karalija, E.; Salopek-Sondi, B.; Šamec, D. Effects of short-term exposure to low temperatures on proline, pigments, and phytochemicals level in kale (Brassica oleracea var. acephala). Horticulturae 2021, 7, 341. [Google Scholar] [CrossRef]
  17. Machado, M.R. Ying Chen: Trade, food security, and human rights: The rules for international trade in agricultural products and the evolving world food crisis. Agric. Hum. Values 2015, 32, 795–796. [Google Scholar] [CrossRef]
  18. Guo, R.; Deng, Y.; Huang, Z.; Chen, X.; XuHan, X.; Lai, Z. Identification of miRNAs affecting the establishment of Brassica Alboglabra seedling. Front. Plant Sci. 2016, 7, 1760. [Google Scholar] [CrossRef] [Green Version]
  19. Chun, J.-H.; Kim, N.-H.; Seo, M.-S.; Jin, M.; Park, S.U.; Arasu, M.V.; Kim, S.-J.; Al-Dhabi, N.A. Molecular characterization of glucosinolates and carotenoid biosynthetic genes in Chinese cabbage (Brassica rapa L. ssp. pekinensis). Saudi J. Biol. Sci. 2018, 25, 71–82. [Google Scholar] [CrossRef] [Green Version]
  20. Gu, H.; Wang, J.; Zhao, Z.; Sheng, X.; Yu, H.; Huang, W. Characterization of the appearance, health-promoting compounds, and antioxidant capacity of the florets of the loose-curd cauliflower. Int. J. Food Prop. 2015, 18, 392–402. [Google Scholar] [CrossRef]
  21. Farnham, M.; Wilson, P.; Stephenson, K.; Fahey, J. Genetic and environmental effects on glucosinolate content and chemoprotective potency of broccoli. Plant Breed. 2004, 123, 60–65. [Google Scholar] [CrossRef] [Green Version]
  22. Bekaert, M.; Edger, P.P.; Hudson, C.M.; Pires, J.C.; Conant, G.C. Metabolic and evolutionary costs of herbivory defense: Systems biology of glucosinolate synthesis. New Phytol. 2012, 196, 596–605. [Google Scholar] [CrossRef]
  23. Neilson, E.H.; Goodger, J.Q.D.; Woodrow, I.E.; Møller, B.L. Plant chemical defense: At what cost? Trends Plant Sci. 2013, 18, 250–258. [Google Scholar] [CrossRef]
  24. Jørgensen, M.E.; Nour-Eldin, H.H.; Halkier, B.A. Transport of defense compounds from source to sink: Lessons learned from glucosinolates. Trends Plant Sci. 2015, 20, 508–514. [Google Scholar] [CrossRef]
  25. Wei, Y.; Zhu, M.; Qiao, H.; Li, F.; Zhang, S.; Zhang, S.; Zhang, H.; Sun, R. Characterization of interspecific hybrids between flowering Chinese cabbage and broccoli. Sci. Hortic. 2018, 240, 552–557. [Google Scholar] [CrossRef]
  26. Teklewold, A.; Becker, H.C. Comparison of phenotypic and molecular distances to predict heterosis and F1 performance in Ethiopian mustard (Brassica carinata A Braun). Theor. Appl. Genet. 2006, 112, 752–759. [Google Scholar] [CrossRef]
  27. Zhou, W.; Niu, Y.; Ding, X.; Zhao, S.; Li, Y.; Fan, G.; Zhang, S.; Liao, K. Analysis of carotenoid content and diversity in apricots (Prunus armeniaca L.) grown in China. Food Chem. 2020, 330, 127223. [Google Scholar] [CrossRef]
  28. He, Q.; Yang, H.; Wu, L.; Hu, C. Effect of light intensity on physiological changes, carbon allocation and neutral lipid accumulation in oleaginous microalgae. Bioresour. Technol. 2015, 191, 219–228. [Google Scholar] [CrossRef]
  29. Sartory, D.; Grobbelaar, J. Extraction of chlorophyll a from freshwater phytoplankton for spectrophotometric analysis. Hydrobiologia 1984, 114, 177–187. [Google Scholar] [CrossRef]
  30. Huang, J.; Xu, Y.-L.; Duan, F.-M.; Du, X.; Yang, Q.-C.; Zheng, Y.-J. Improvement of the growth and nutritional quality of two-leaf-color Pak Choi by supplemental alternating red and blue light. HortScience 2021, 56, 118–125. [Google Scholar] [CrossRef]
  31. Kliebenstein, D.J.; Gershenzon, J.; Mitchell-Olds, T. Comparative quantitative trait loci mapping of aliphatic, indolic and benzylic glucosinolate production in Arabidopsis thaliana leaves and seeds. Genetics 2001, 159, 359–370. [Google Scholar] [CrossRef]
  32. Ashenafi, E.L.; Nyman, M.C.; Holley, J.M.; Mattson, N.S.; Rangarajan, A. Phenotypic plasticity and nutritional quality of three kale cultivars (Brassica oleracea L. var. acephala) under field, greenhouse, and growth chamber environments. Environ. Exp. Bot. 2022, 199, 104895. [Google Scholar]
  33. Carvalho, S.D.; Folta, K.M. Sequential light programs shape kale (Brassica napus) sprout appearance and alter metabolic and nutrient content. Hortic. Res. 2014, 1, 8. [Google Scholar] [CrossRef] [PubMed] [Green Version]
  34. Zhou, X.-W.; Fan, Z.-Q.; Chen, Y.; Zhu, Y.-L.; Li, J.-Y.; Yin, H.-F. Functional analyses of a flavonol synthase–like gene from Camellia nitidissima reveal its roles in flavonoid metabolism during floral pigmentation. J. Biosci. 2013, 38, 593–604. [Google Scholar] [CrossRef]
  35. Li, P.; Su, T.; Zhang, D.; Wang, W.; Xin, X.; Yu, Y.; Zhao, X.; Yu, S.; Zhang, F. Genome-wide analysis of changes in miRNA and target gene expression reveals key roles in heterosis for Chinese cabbage biomass. Hortic. Res. 2021, 8, 39. [Google Scholar] [CrossRef] [PubMed]
  36. Hu, J.; Jia, W.; Wu, X.; Zhang, H.; Wang, Y.; Liu, J.; Yang, Y.; Tao, S.; Wang, X. Carbon dots can strongly promote photosynthesis in lettuce (Lactuca sativa L.). Environ. Sci. Nano 2022, 9, 1530–1540. [Google Scholar] [CrossRef]
  37. Kapusta-Duch, J.; Kusznierewicz, B. Young shoots of white and red headed cabbages like novel sources of glucosinolates as well as antioxidative substances. Antioxidants 2021, 10, 1277. [Google Scholar] [CrossRef]
  38. Zhao, Y.; Yue, Z.; Zhong, X.; Lei, J.; Tao, P.; Li, B. Distribution of primary and secondary metabolites among the leaf layers of headed cabbage (Brassica oleracea var. capitata). Food Chem. 2020, 312, 126028. [Google Scholar] [CrossRef]
  39. Sikorska-Zimny, K.; Beneduce, L. The glucosinolates and their bioactive derivatives in Brassica: A review on classification, biosynthesis and content in plant tissues, fate during and after processing, effect on the human organism and interaction with the gut microbiota. Crit. Rev. Food Sci. Nutr. 2021, 61, 2544–2571. [Google Scholar] [CrossRef]
  40. Hanschen, F.S.; Schreiner, M. Isothiocyanates, nitriles, and epithionitriles from glucosinolates are affected by genotype and developmental stage in Brassica oleracea varieties. Front. Plant Sci. 2017, 8, 1095. [Google Scholar] [CrossRef] [Green Version]
  41. Chang, J.; Wang, M.; Jian, Y.; Zhang, F.; Zhu, J.; Wang, Q.; Sun, B. Health-promoting phytochemicals and antioxidant capacity in different organs from six varieties of Chinese kale. Sci. Rep. 2019, 9, 20344. [Google Scholar] [CrossRef] [Green Version]
  42. Yeo, H.J.; Baek, S.-A.; Sathasivam, R.; Kim, J.K.; Park, S.U. Metabolomic analysis reveals the interaction of primary and secondary metabolism in white, pale green, and green pak choi (Brassica rapa subsp. chinensis). Appl. Biol. Chem. 2021, 64, 3. [Google Scholar] [CrossRef]
  43. Strauss, S.Y.; Rudgers, J.A.; Lau, J.A.; Irwin, R.E. Direct and ecological costs of resistance to herbivory. Trends Ecol. Evol. 2002, 17, 278–285. [Google Scholar] [CrossRef]
  44. Shelton, A.L. Within-plant variation in glucosinolate concentrations of Raphanus sativus across multiple scales. J. Chem. Ecol. 2005, 31, 1711–1732. [Google Scholar] [CrossRef]
  45. Shroff, R.; Vergara, F.; Muck, A.; Svatoš, A.; Gershenzon, J. Nonuniform distribution of glucosinolates in Arabidopsis thaliana leaves has important consequences for plant defense. Proc. Natl. Acad. Sci. USA 2008, 105, 6196–6201. [Google Scholar] [CrossRef] [PubMed]
  46. Keith, R.A.; Mitchell-Olds, T. Testing the optimal defense hypothesis in nature: Variation for glucosinolate profiles within plants. PLoS ONE 2017, 12, e0180971. [Google Scholar]
  47. Meldau, S.; Erb, M.; Baldwin, I.T. Defence on demand: Mechanisms behind optimal defence patterns. Ann. Bot. 2012, 110, 1503–1514. [Google Scholar] [CrossRef] [Green Version]
  48. McCall, A.C.; Fordyce, J.A. Can optimal defence theory be used to predict the distribution of plant chemical defences? J. Ecol. 2010, 98, 985–992. [Google Scholar] [CrossRef]
  49. Chen, S.; Andreasson, E. Update on glucosinolate metabolism and transport. Plant Physiol. Biochem. 2001, 39, 743–758. [Google Scholar] [CrossRef]
  50. Hirono, H.; Morimitsu, Y.; Kato, A.; Higashio, H. Glucosinolate profiles in cabbage (Brassica oleracea var. capitata) cultivars and their effect on the induction of a phase II detoxification enzyme. J. Jpn. Soc. Hortic. Sci. 2011, 80, 499–505. [Google Scholar]
  51. Pfalz, M.; Vogel, H.; Kroymann, J. The gene controlling the indole glucosinolate modifier1 quantitative trait locus alters indole glucosinolate structures and aphid resistance in Arabidopsis. Plant Cell 2009, 21, 985–999. [Google Scholar] [CrossRef] [Green Version]
  52. Tsunoda, T.; Krosse, S.; van Dam, N.M. Root and shoot glucosinolate allocation patterns follow optimal defence allocation theory. J. Ecol. 2017, 105, 1256–1266. [Google Scholar] [CrossRef] [Green Version]
  53. De Vos, M.; Kriksunov, K.L.; Jander, G. Indole-3-acetonitrile production from indole glucosinolates deters oviposition by Pieris rapae. Plant Physiol. 2008, 146, 916–926. [Google Scholar] [CrossRef] [Green Version]
  54. Ahmad, A.; ASakr, W.; Wahidur Rahman, K. Anticancer properties of indole compounds: Mechanism of apoptosis induction and role in chemotherapy. Curr. Drug Targets 2010, 11, 652–666. [Google Scholar] [CrossRef]
  55. Salem, A.Z.; Medhat, D.; Fathy, S.A.; Mohamed, M.R.; El-Khayat, Z.; El-Daly, S.M. Indole glucosinolates exhibit anti-inflammatory effects on Ehrlich ascites carcinoma cells through modulation of inflammatory markers and miRNAs. Mol. Biol. Rep. 2021, 48, 6845–6855. [Google Scholar] [CrossRef] [PubMed]
  56. Dinkova-Kostova, A.T.; Kostov, R.V. Glucosinolates and isothiocyanates in health and disease. Trends Mol. Med. 2012, 18, 337–347. [Google Scholar] [CrossRef]
  57. Fujioka, N.; Fritz, V.; Upadhyaya, P.; Kassie, F.; Hecht, S.S. Research on cruciferous vegetables, indole-3-carbinol, and cancer prevention: A tribute to Lee W. Wattenberg. Mol. Nutr. Food Res. 2016, 60, 1228–1238. [Google Scholar] [CrossRef]
  58. Bradlow, H.L. Indole-3-carbinol as a chemoprotective agent in breast and prostate cancer. In Vivo 2008, 22, 441–445. [Google Scholar]
  59. Chen, S.; Petersen, B.L.; Olsen, C.E.; Schulz, A.; Halkier, B.A. Long-distance phloem transport of glucosinolates in Arabidopsis. Plant Physiol. 2001, 127, 194–201. [Google Scholar] [CrossRef] [Green Version]
  60. Andersen, T.G.; Liang, D.; Halkier, B.A.; White, R. Grafting arabidopsis. Bio-Protocol 2014, 4, e1164. [Google Scholar] [CrossRef]
  61. Brown, P.D.; Tokuhisa, J.G.; Reichelt, M.; Gershenzon, J. Variation of glucosinolate accumulation among different organs and developmental stages of Arabidopsis thaliana. Phytochemistry 2003, 62, 471–481. [Google Scholar] [CrossRef] [PubMed]
  62. Savic, A.; Aradski, A.A.; Zivkovic, J.; Savikin, K.; Jaric, S.; Marin, P.D.; Duletic-Lausevic, S. Phenolic composition, and antioxidant and antineurodegenerative potential of methanolic extracts of fruit peel and flesh of pear varieties from Serbia. Pol. J. Food Nutr. Sci. 2021, 71, 225–236. [Google Scholar] [CrossRef]
  63. Giannino, D.; Testone, G.; Nicoladi, C.; Giorgetti, L.; Bellani, L.; Gonnella, M.; Cirdi, M.; Cappuccio, P.; Moscatello, S.; Battistelli, A. Nutritive parameters and antioxidant quality of minimally processed “cime di rapa” (Brassica rapa subsp. sylvestris) vary as influenced by genotype and storage time. Pol. J. Food Nutr. Sci. 2020, 70, 337–346. [Google Scholar]
Figure 1. Representative photographs of cabbage sampling locations. (A). Cross-section of a cabbage leaf bulb. (B). Whole cabbage plant. Leaf parts: 1, 2, 3, 4, and 5 represent the outer leaf, middle leaf, inner leaf, central column, and upper root sampling positions, respectively. Bar = 1cm.
Horticulturae 09 00867 g001
Figure 2. Observation of mid-heading phenotype of 13 cabbage varieties during S4 stages. The serial numbers are QG70, QG80, JF1H, ZG590, ZG101, LQ66, LG60, SL60, SG25, M18-15, S18-13, 02-12, and XG097.
Horticulturae 09 00867 g002
Figure 3. Cluster map of phenotypic traits in 13 mid-ripening cabbage samples.
Horticulturae 09 00867 g003
Figure 4. Determination of total phenolic content (TP) and pigment (flavonoid, chlorophyll, carotenoid) content in different cabbage varieties. (A). TP content. (B). Total flavonoid content (TF). (C). Chlorophyll content (CC). (D). Carotenoid contents. Different lowercases show significant differences at p < 0.05 using Duncan’s multiple range test.
Horticulturae 09 00867 g004
Figure 5. Measurement of color difference values of different cabbage varieties. (A) L* value, (B) a* value, and (C) b* value. Different lowercases show significant differences at p < 0.05 using Duncan’s multiple range test.
Horticulturae 09 00867 g005
Figure 6. The content of flavonoids in cabbage varieties at different developmental stages. (AD): S1, S2, S3, and S4 GLS substance content. S1 stands for five leaves and one heart stage (Figure S2), S2 stands for early nodulation, S3 stands for middle nodulation (Figure S3), and S4 stands for end nodularity. 4OH-I3M stands for 4-hydroxy-indol-3-ylmethyl, I3M stands for indol-3-ylmethyl, 4MOI3M stands for 4-methoxy-indol-3-ylmethyl, and NMOI3M stands for N-methoxy-indol-3-ylmethyl. All data are shown as mean ± SD (standard deviation) of three biological triplicates. Lowercase letters represent significance at the p < 0.05 level.
Horticulturae 09 00867 g006
Figure 7. Pie chart of the ratio of GLS in different cabbage varieties and different developmental stages (S1, S2, S3, and S4).
Horticulturae 09 00867 g007
Figure 8. Accumulation patterns of GLS in different parts of different cabbage varieties. (A). Middle leaf GLS content (B). Inner leaf GLS content (C). Condensed stem GLS content (D). Root GLS content. All data are shown as mean ± SD (standard deviation) of three biological triplicates. Lowercase letters represent significance at the p <0.05 level.
Horticulturae 09 00867 g008
Figure 9. Contents of total GLS in different varieties, different developmental stages (S1, S2, S3, and S4), and different tissue parts (inner leaves and roots).
Horticulturae 09 00867 g009
Figure 10. The ratio of GLS in the inner leaves and roots of different cabbage varieties at S3 period.
Horticulturae 09 00867 g010
Figure 11. PCA analysis of the main biological traits and GLS substances of M18-15 and LQ66. The coordinate axes PC1 and PC2 in the PCA graph are the first and second principal components (i.e., the interpretation rate of latent variables for the difference); the dots represent samples, and the different colors represent different groups; the ellipses represent the core area added by the 68% confidence interval for the grouping, which is convenient to observe whether the groups are separated; the arrow represents the original variable, and its direction represents the correlation between the original variable and the principal component; and the length represents the contribution of the original data to the principal component.
Horticulturae 09 00867 g011
Figure 12. Correlation analysis of growth indexes, color values, pigments, and GLS in LQ66 and M18-15 cabbage varieties. (A). LQ66; (B). M18-15. Pearson significant correlations at p < 0.05 levels.
Horticulturae 09 00867 g012
Disclaimer/Publisher’s Note: The statements, opinions and data contained in all publications are solely those of the individual author(s) and contributor(s) and not of MDPI and/or the editor(s). MDPI and/or the editor(s) disclaim responsibility for any injury to people or property resulting from any ideas, methods, instructions or products referred to in the content.

