

Early Internal Short Circuit Diagnosis for Lithium-Ion Battery Packs Based on Dynamic Time Warping of Incremental Capacity


Abstract
1. Introduction
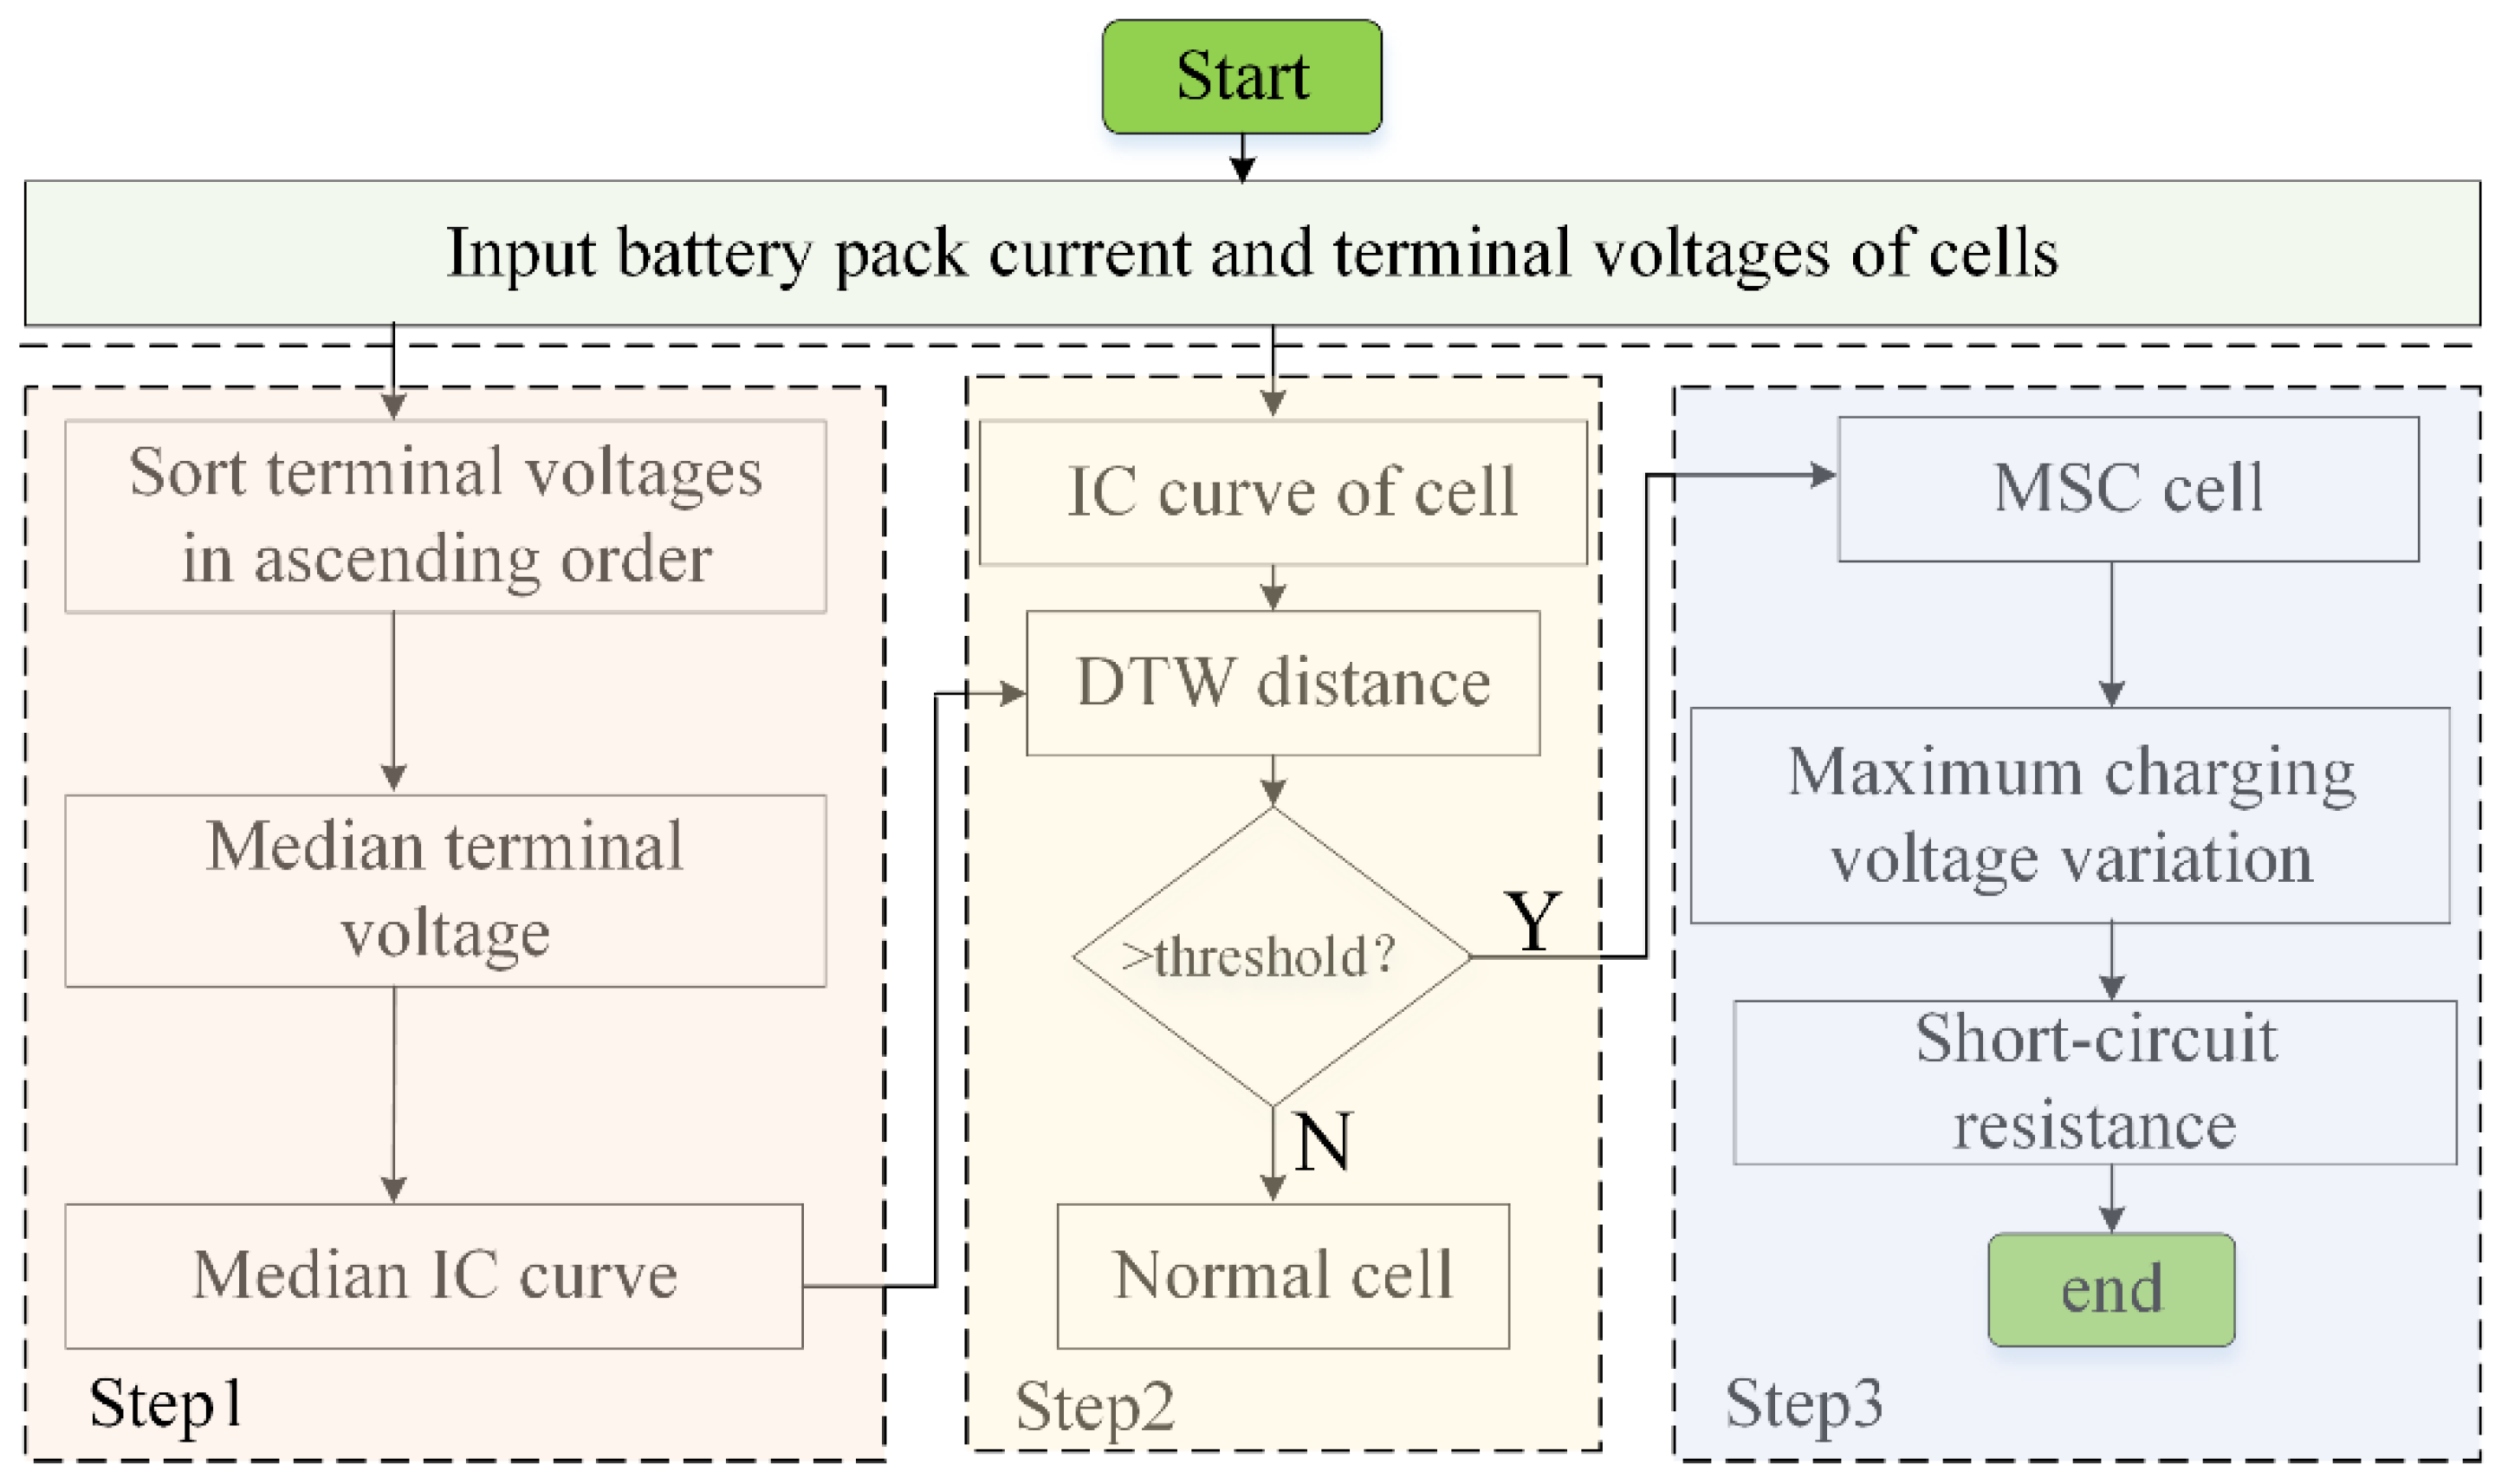
2. Diagnostic Method
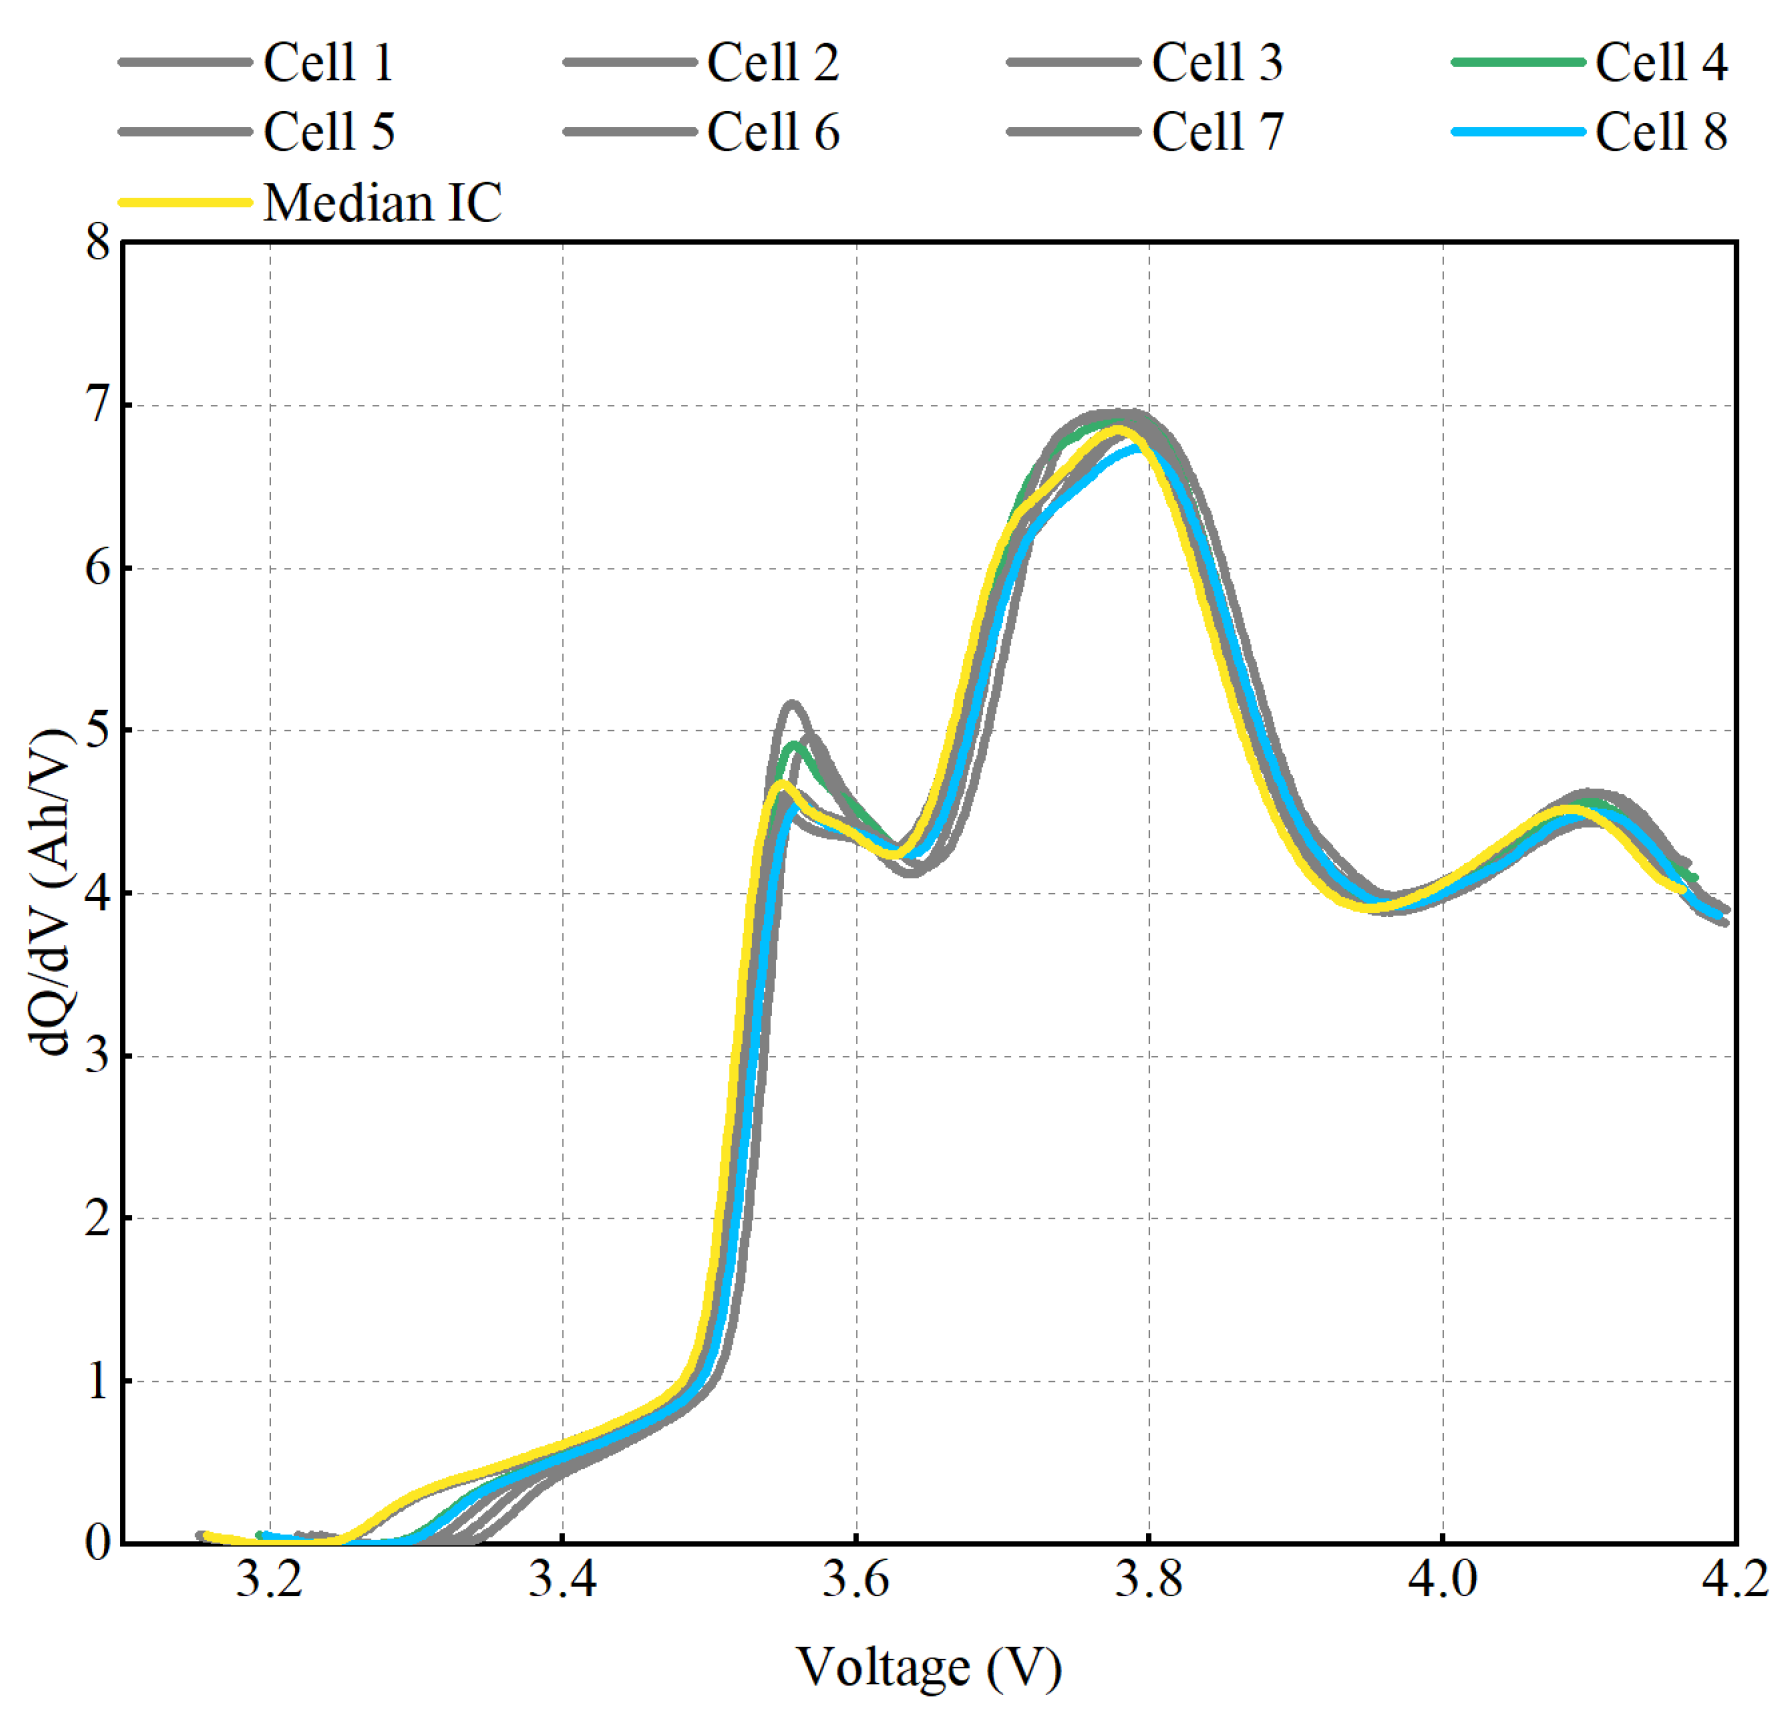
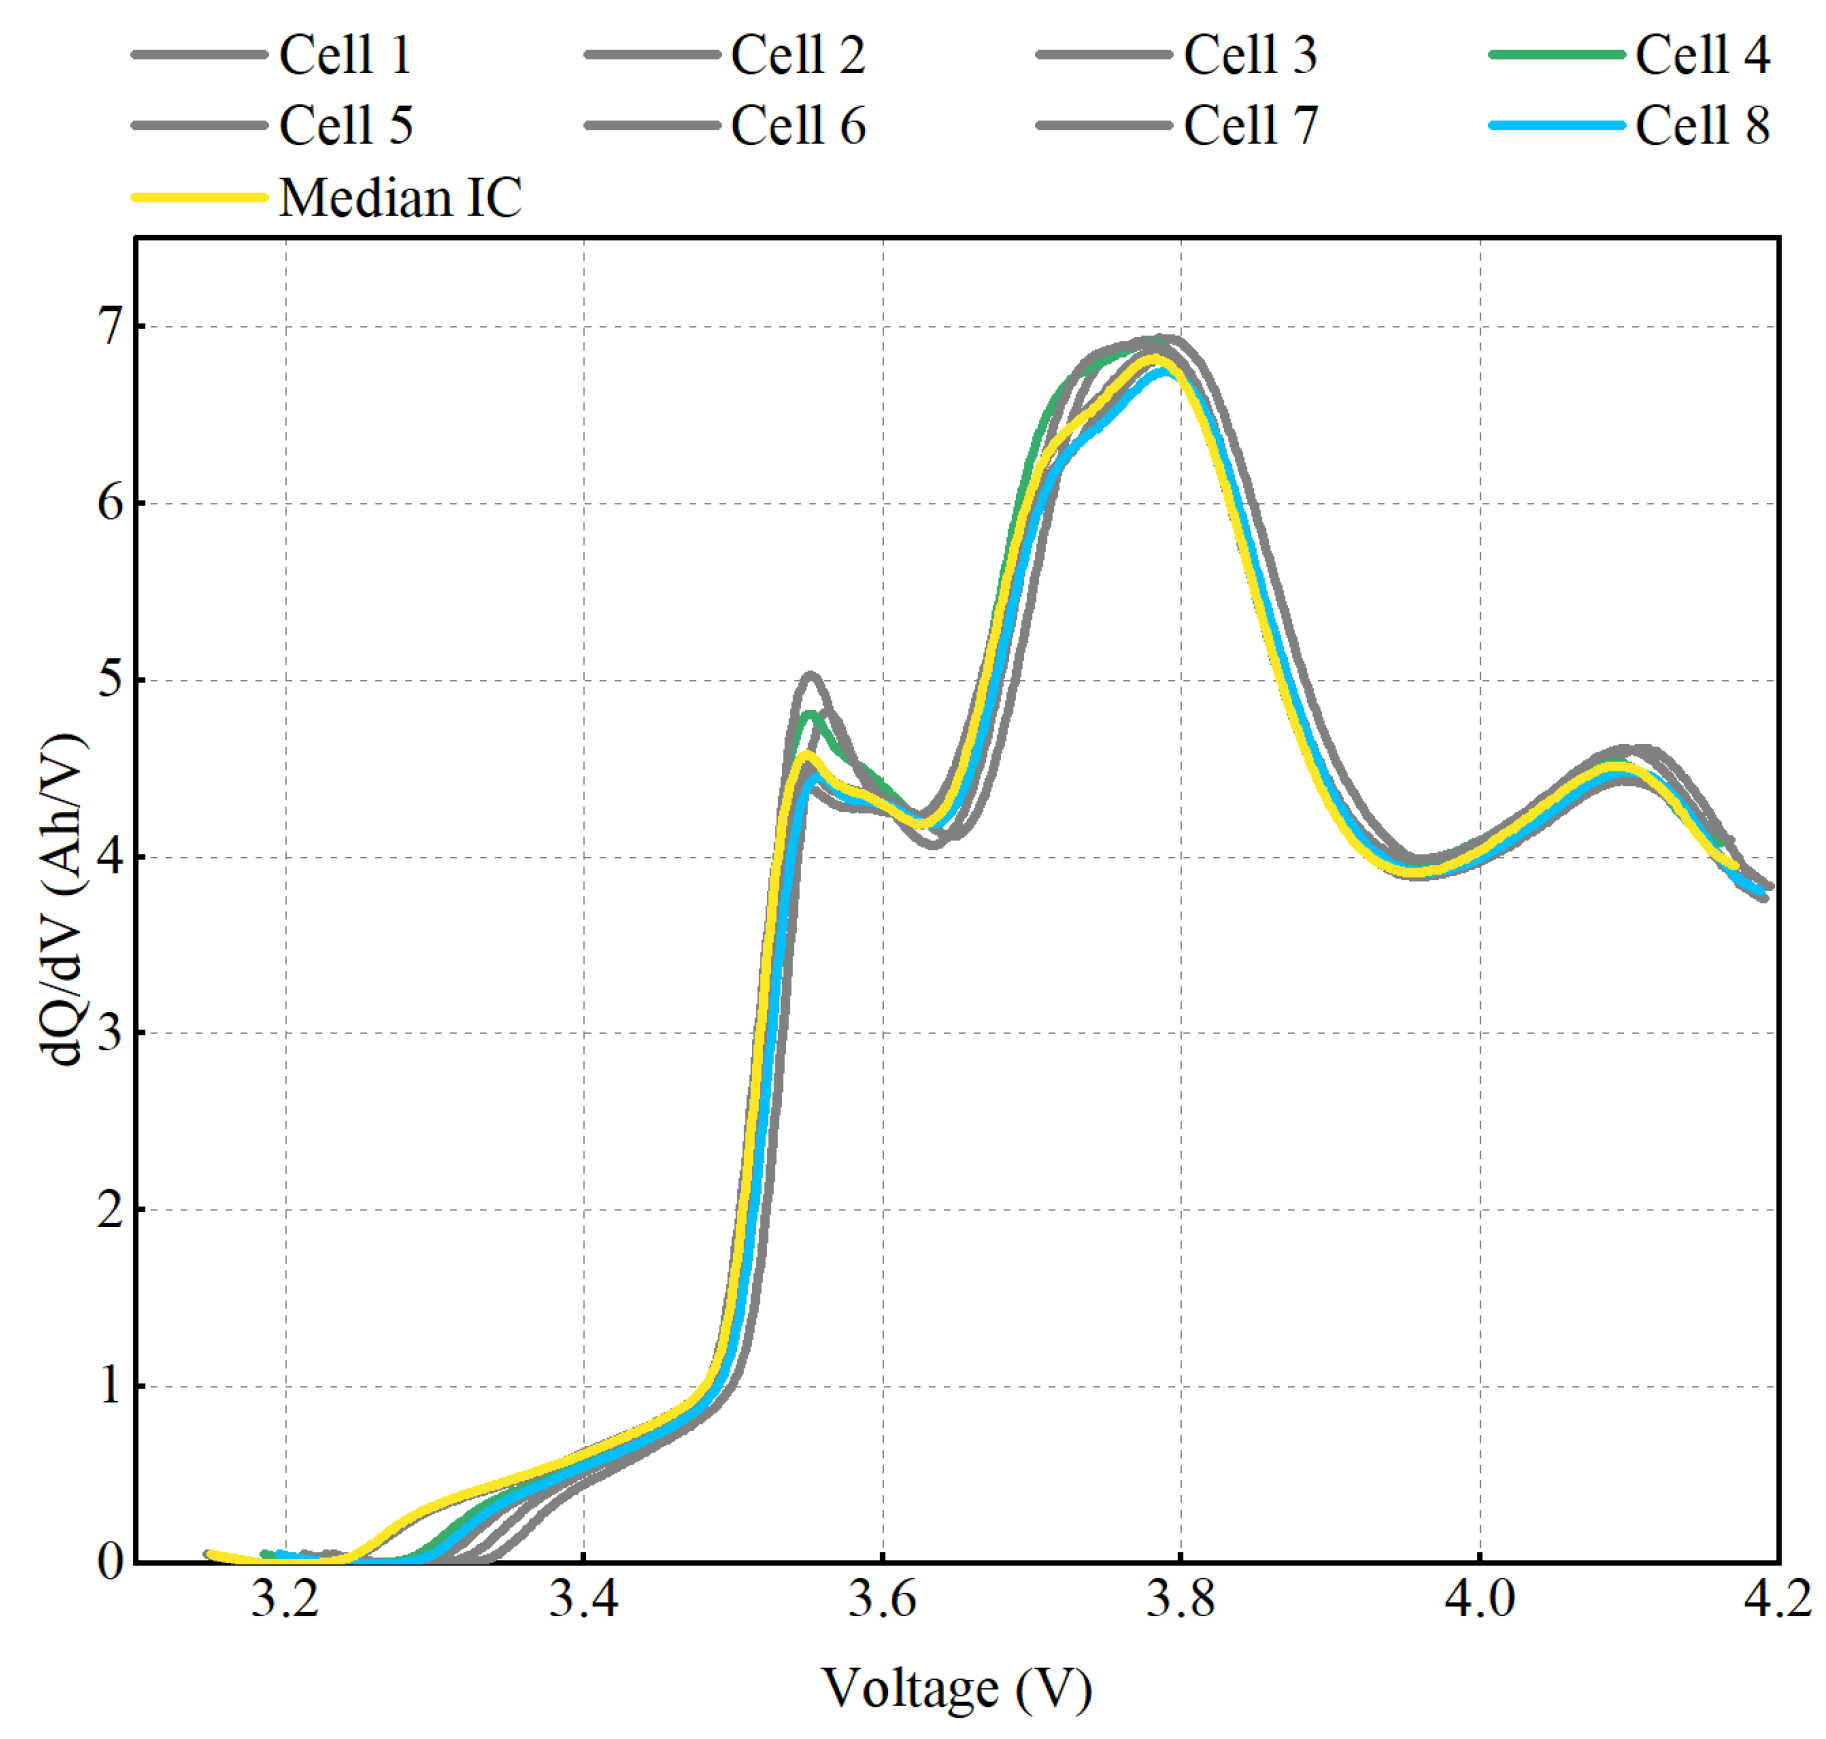
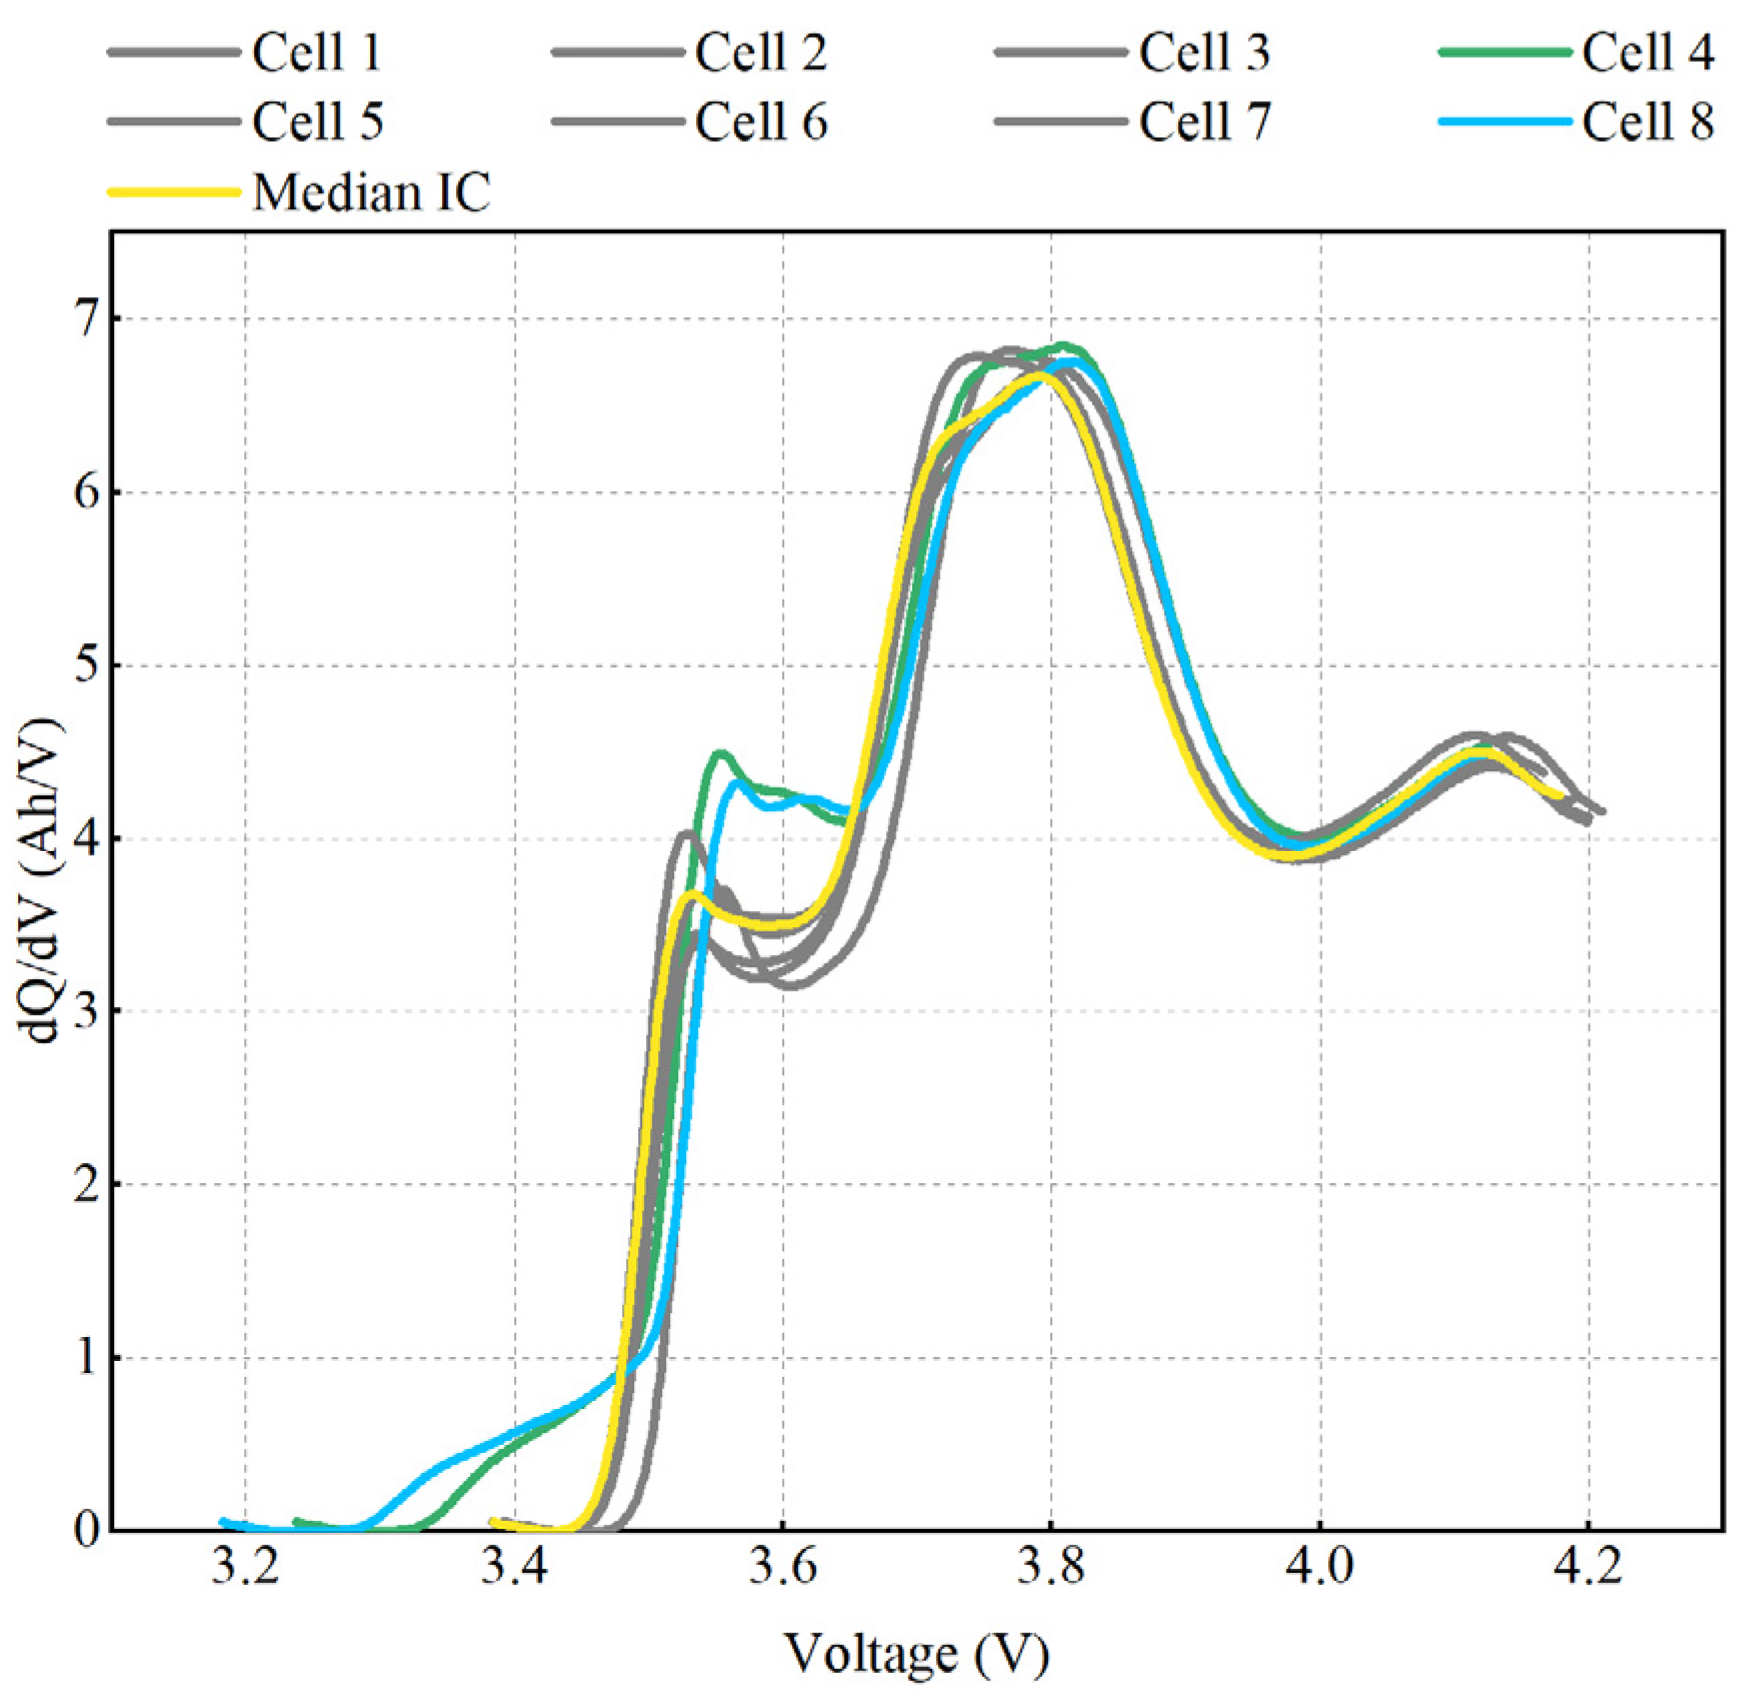
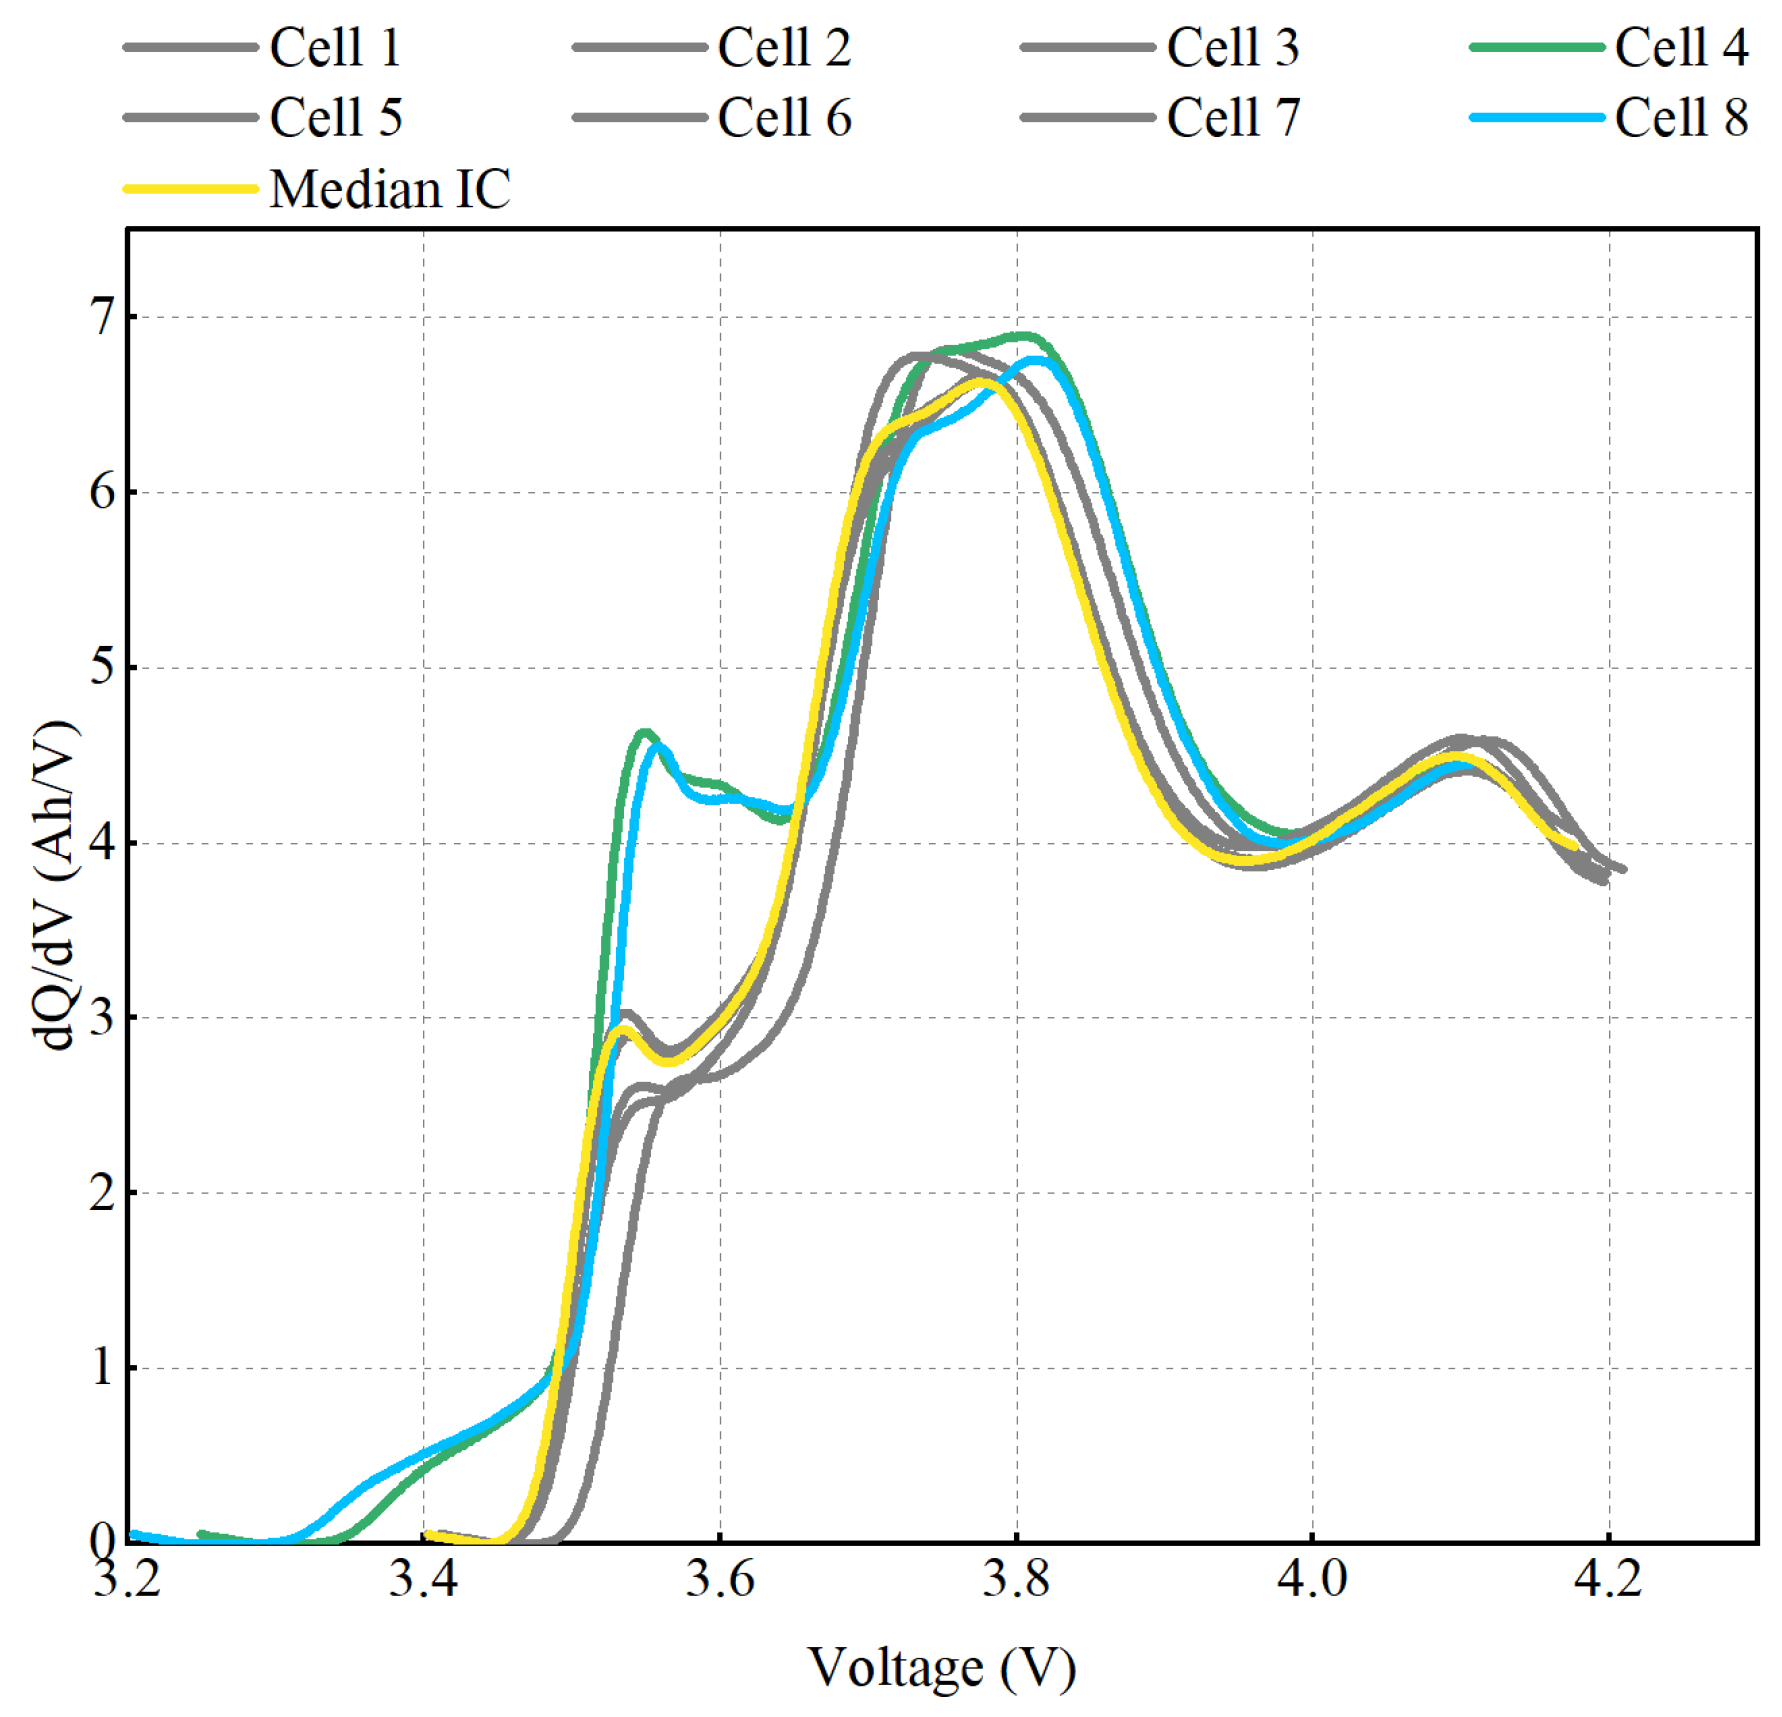
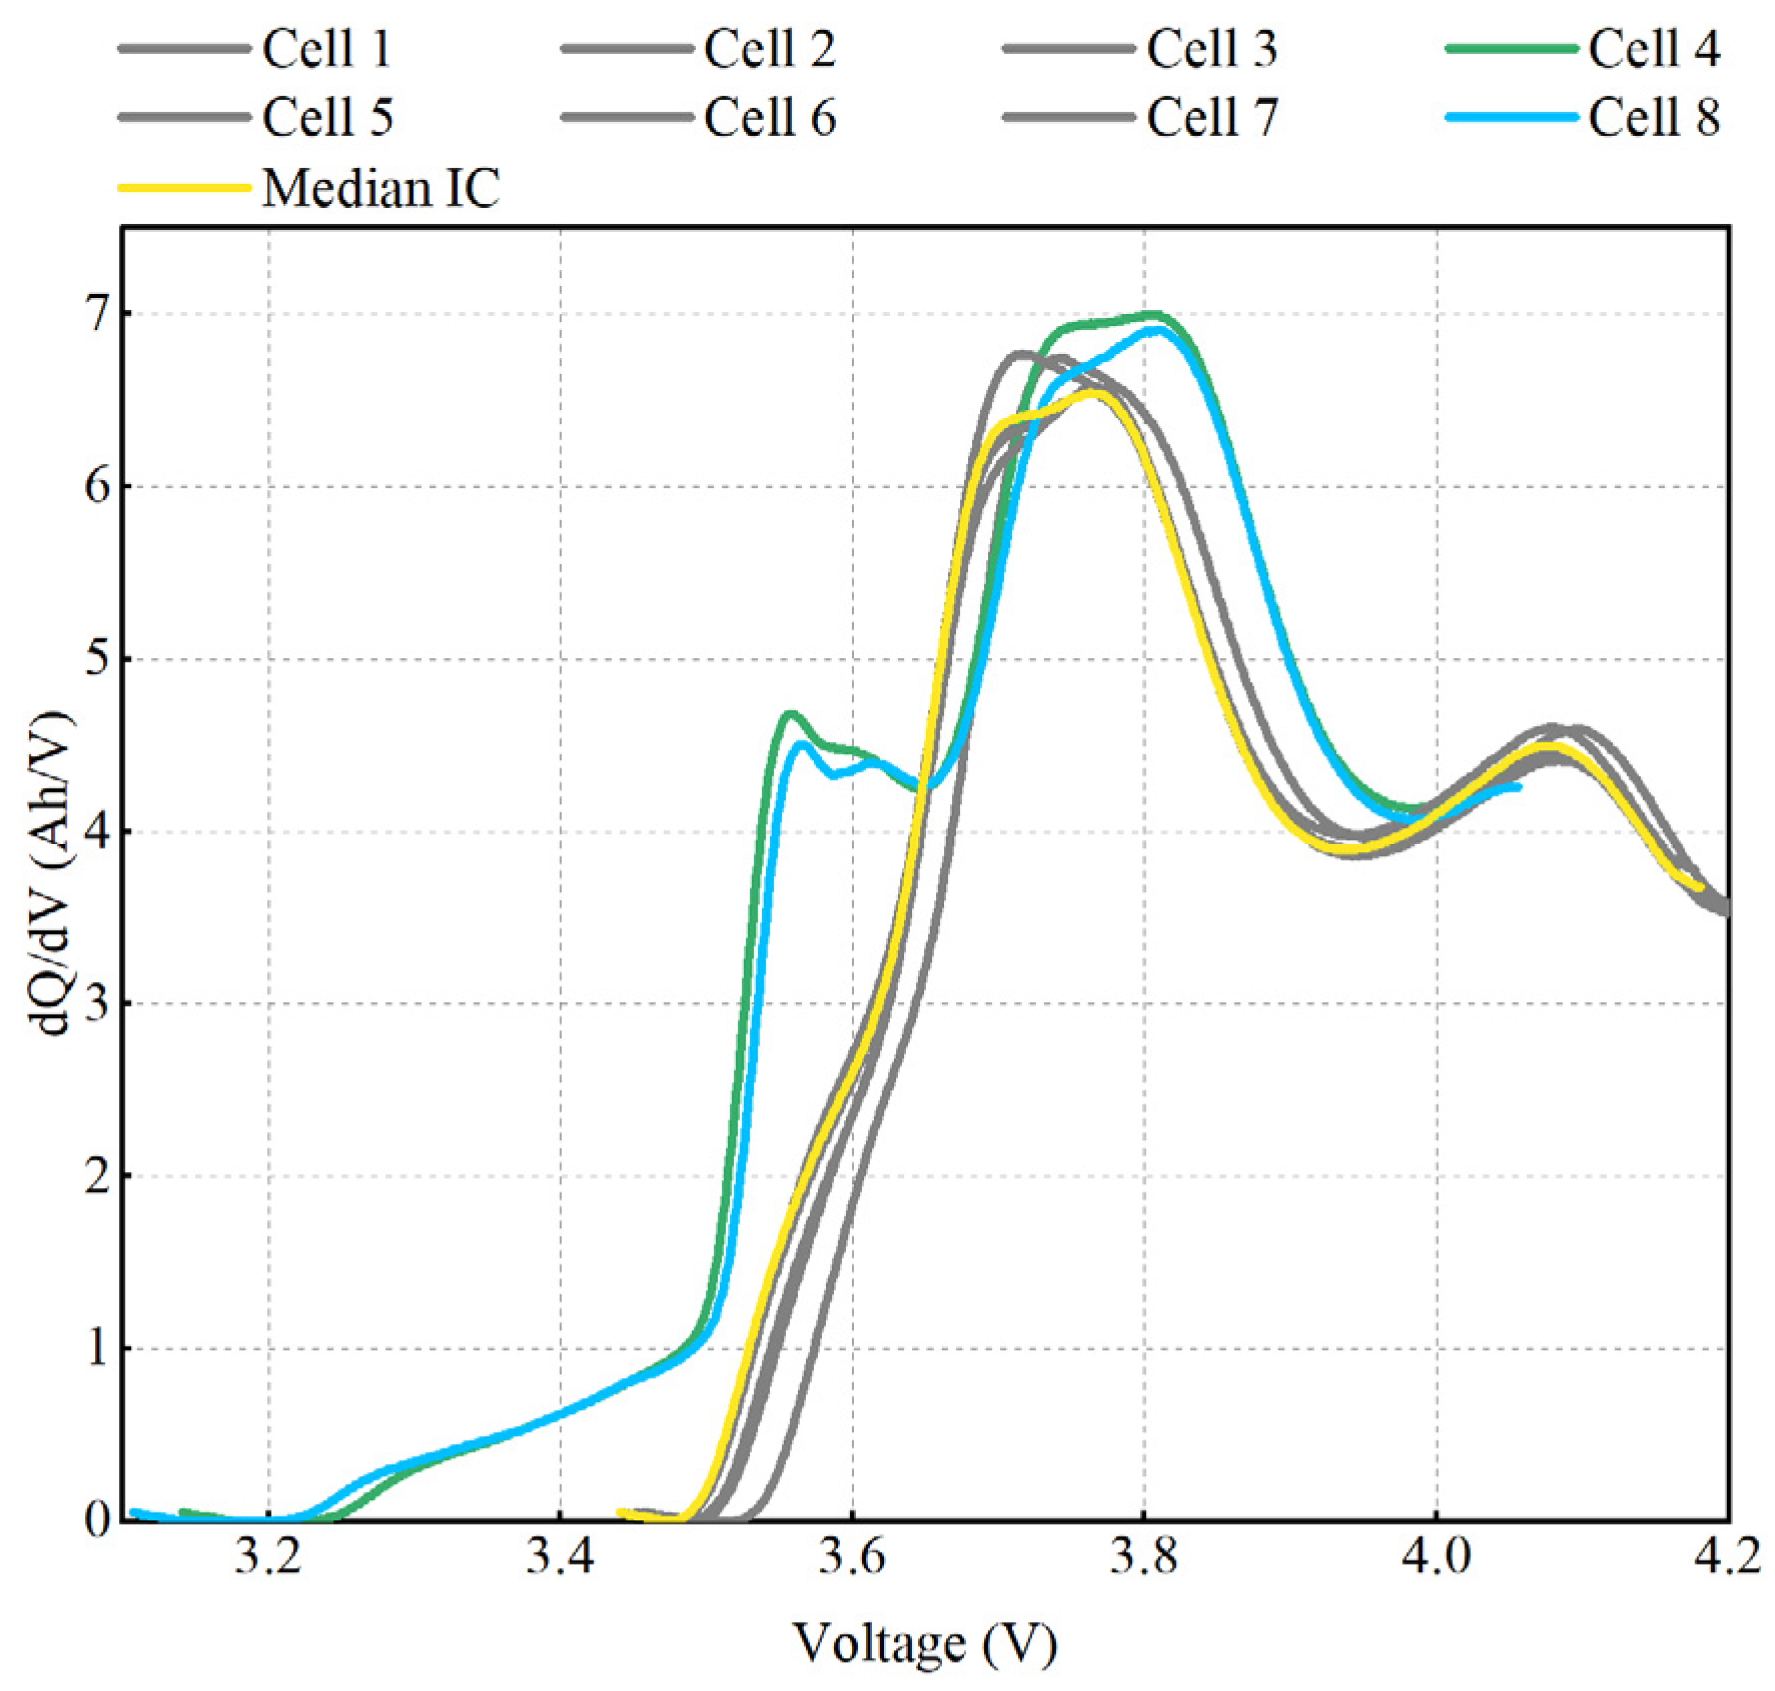
2.1. Extraction of Incremental Capacity Curves
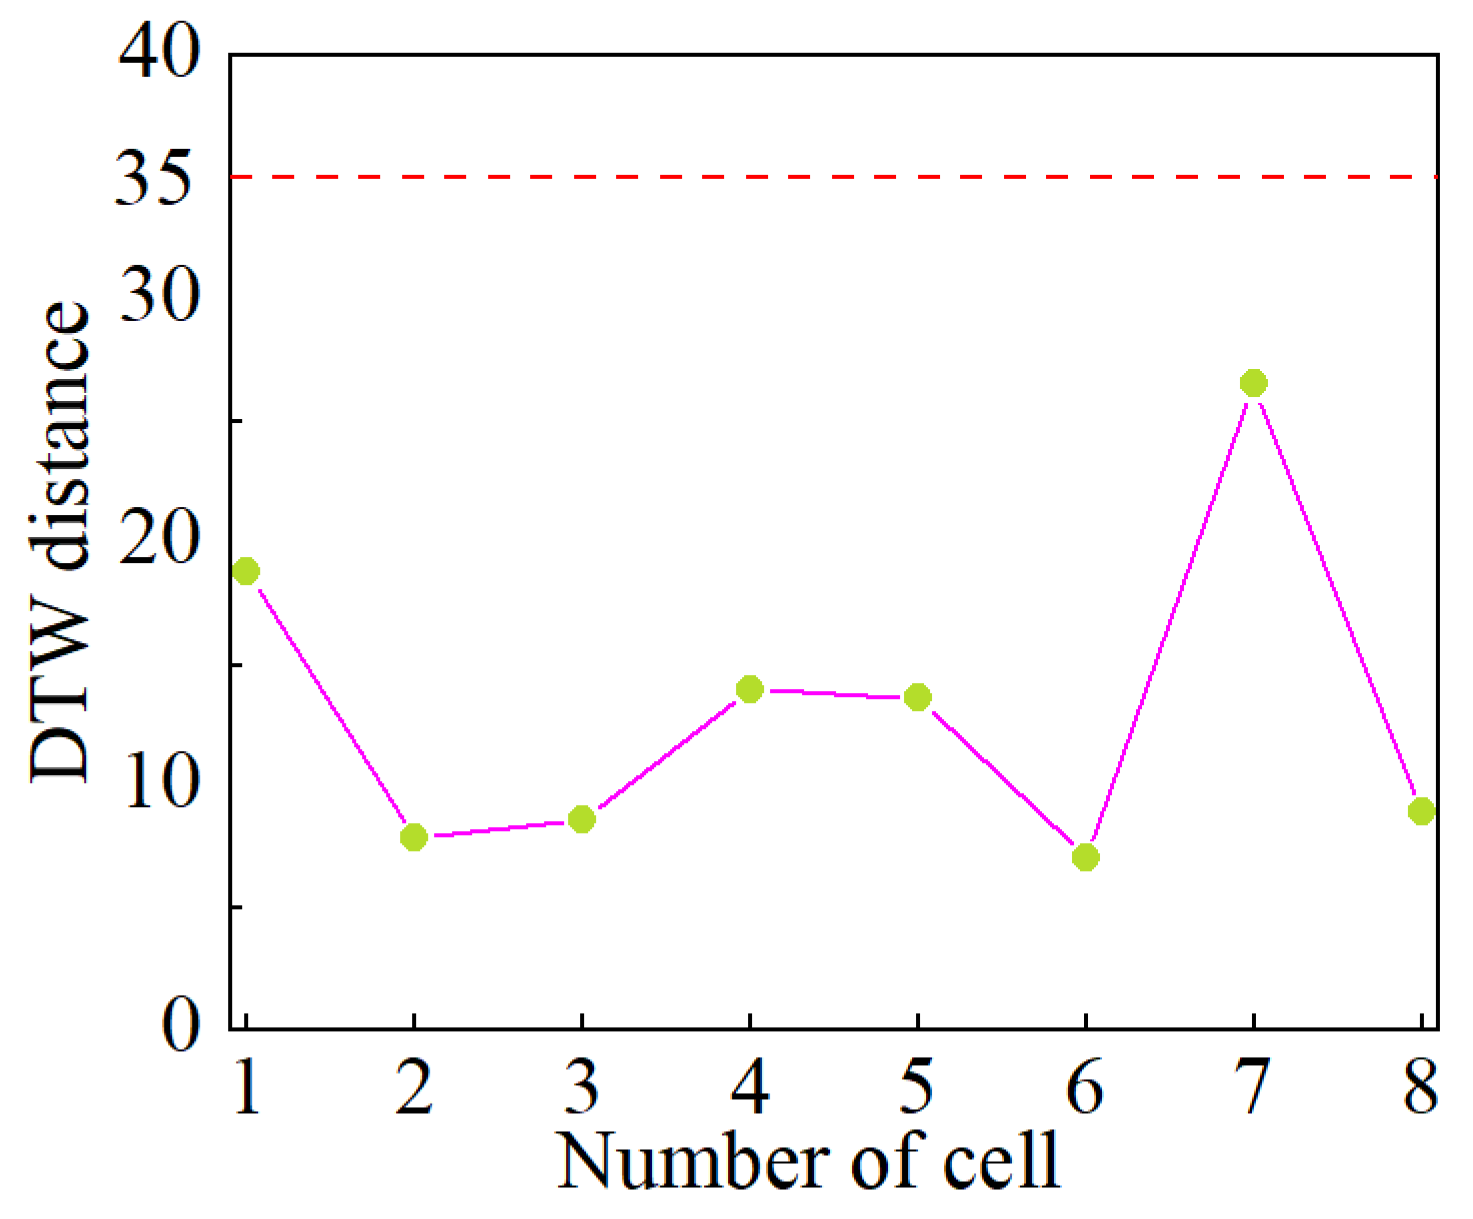
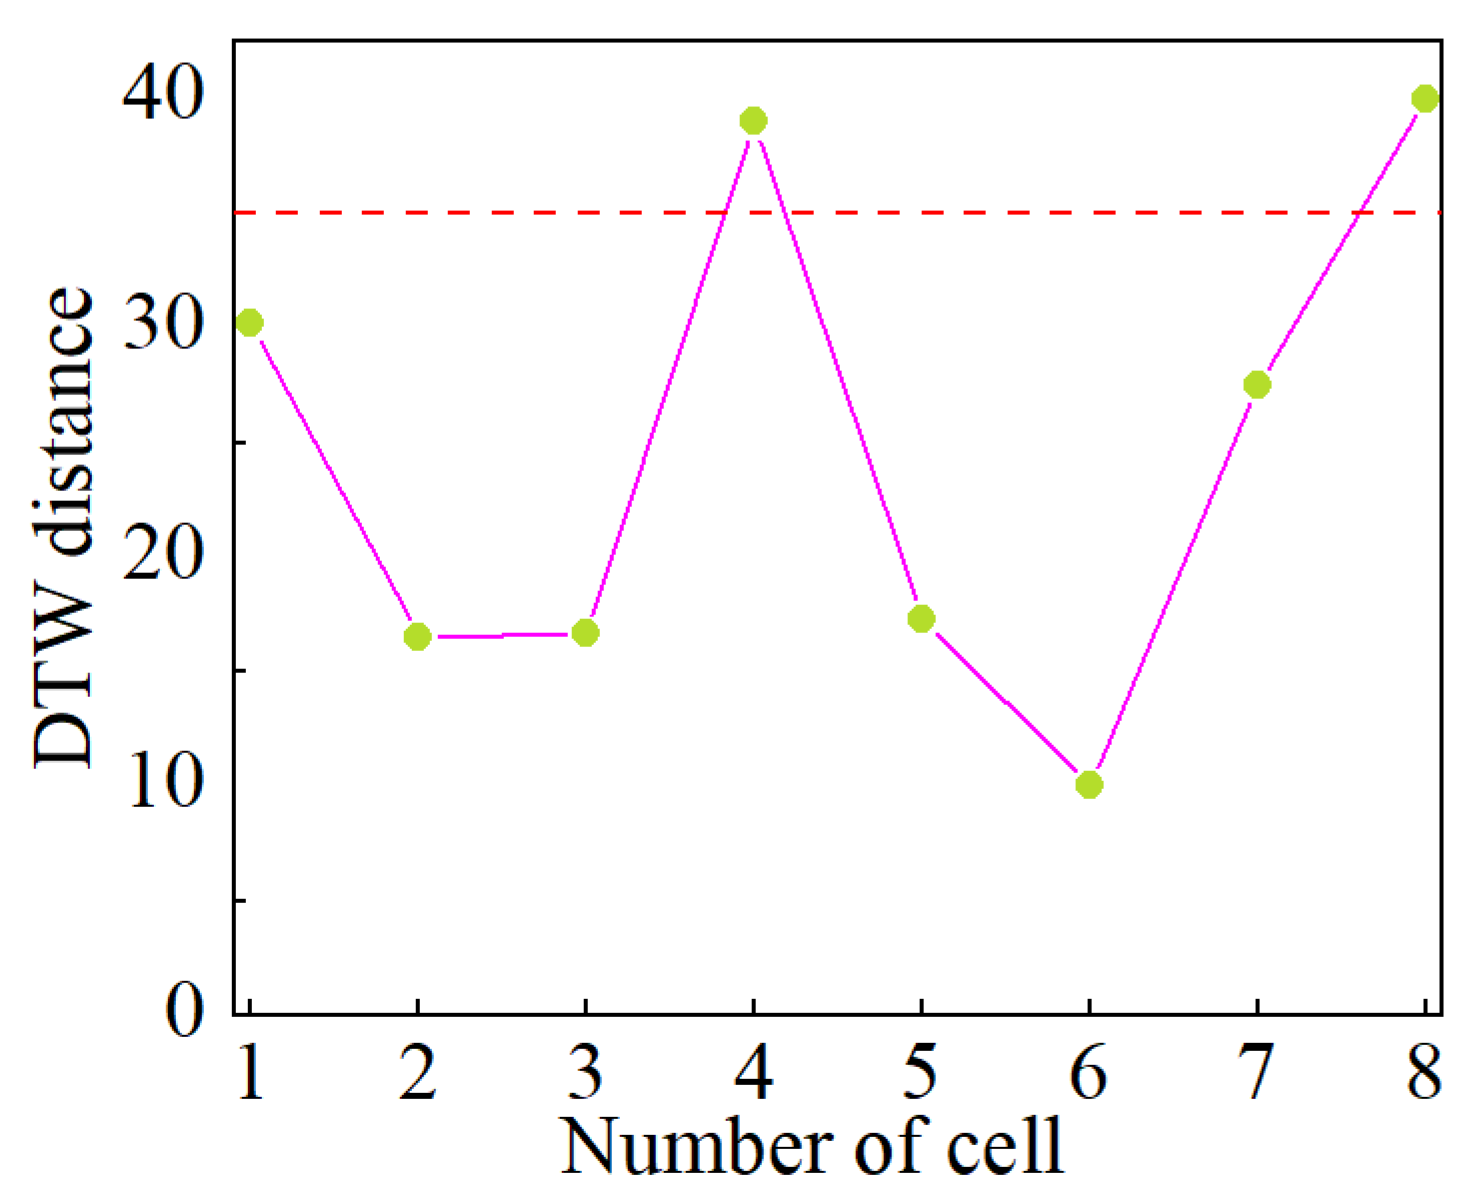
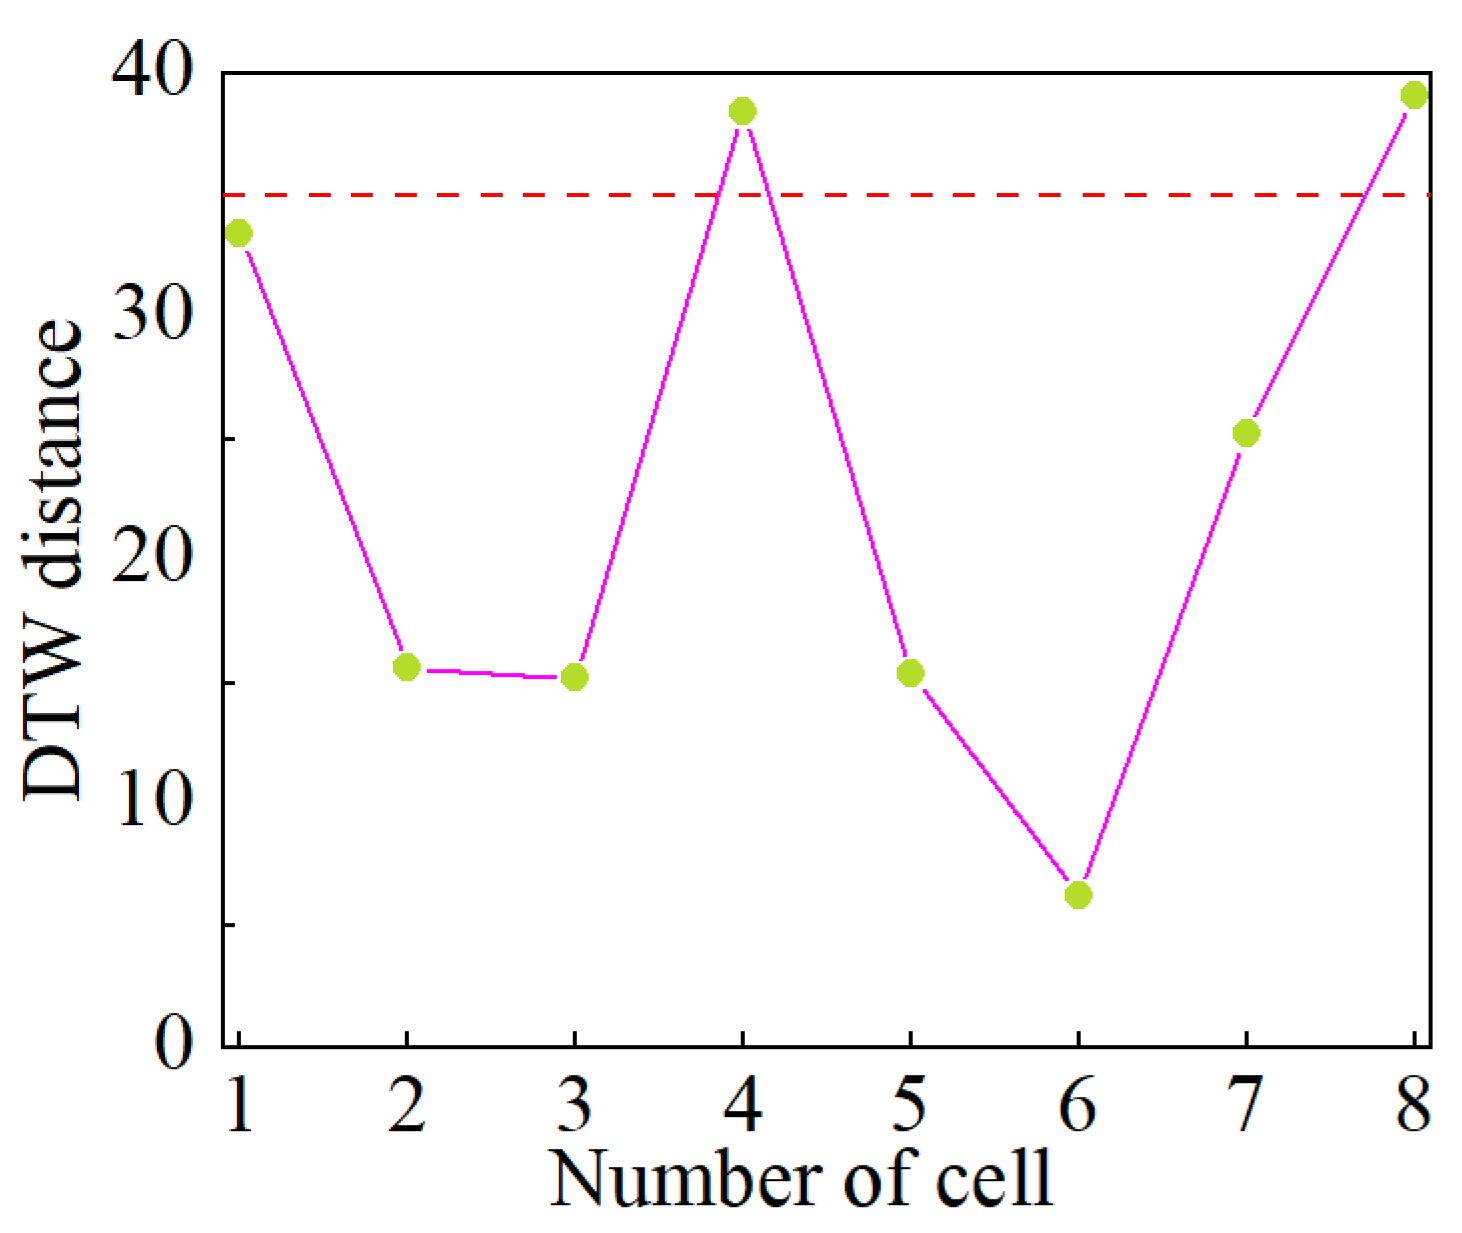
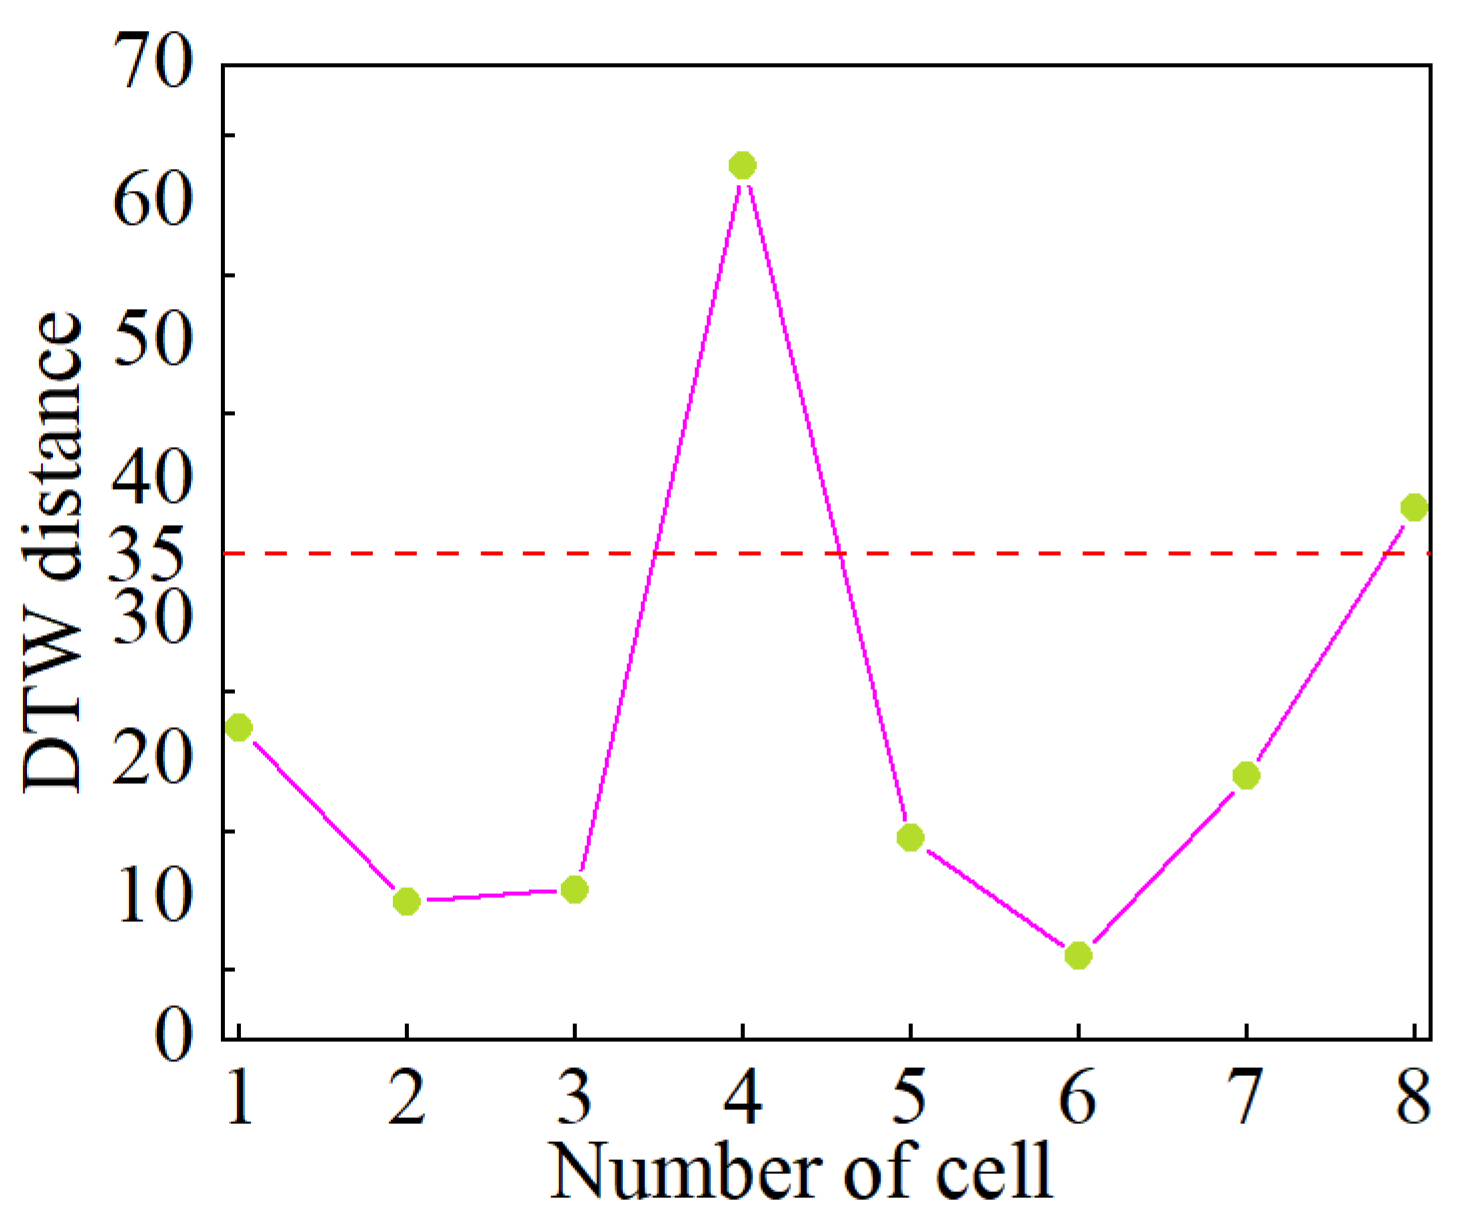
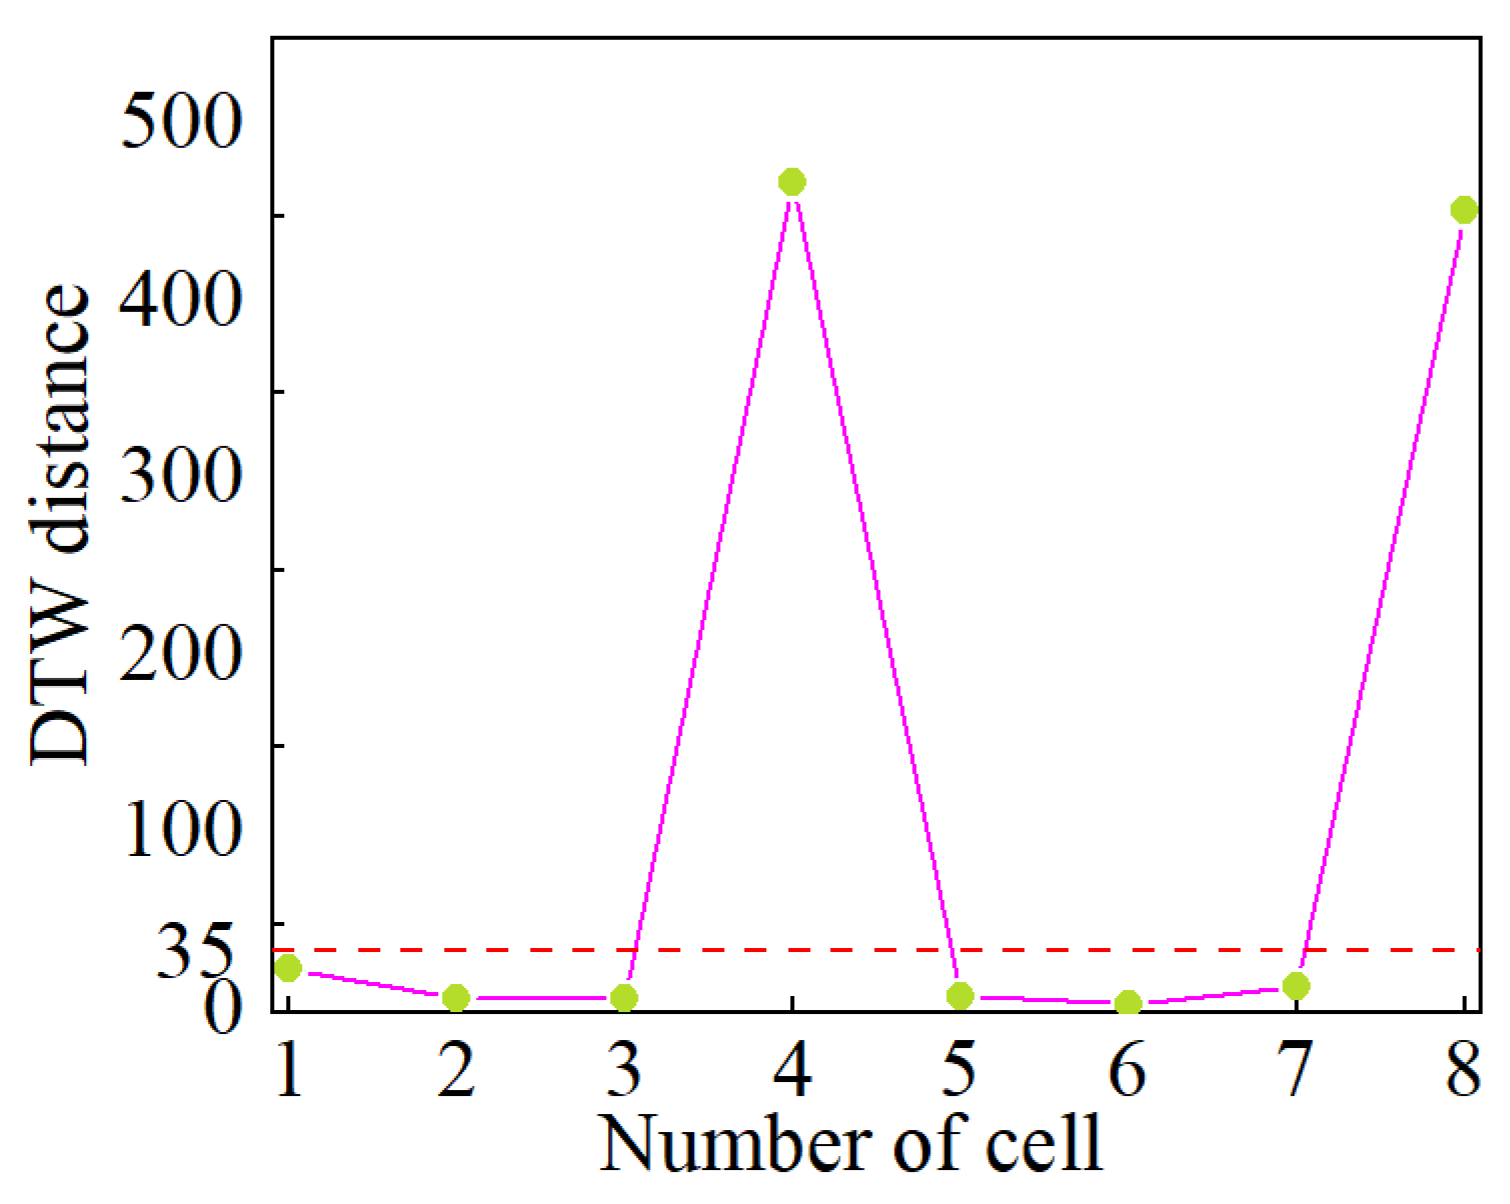
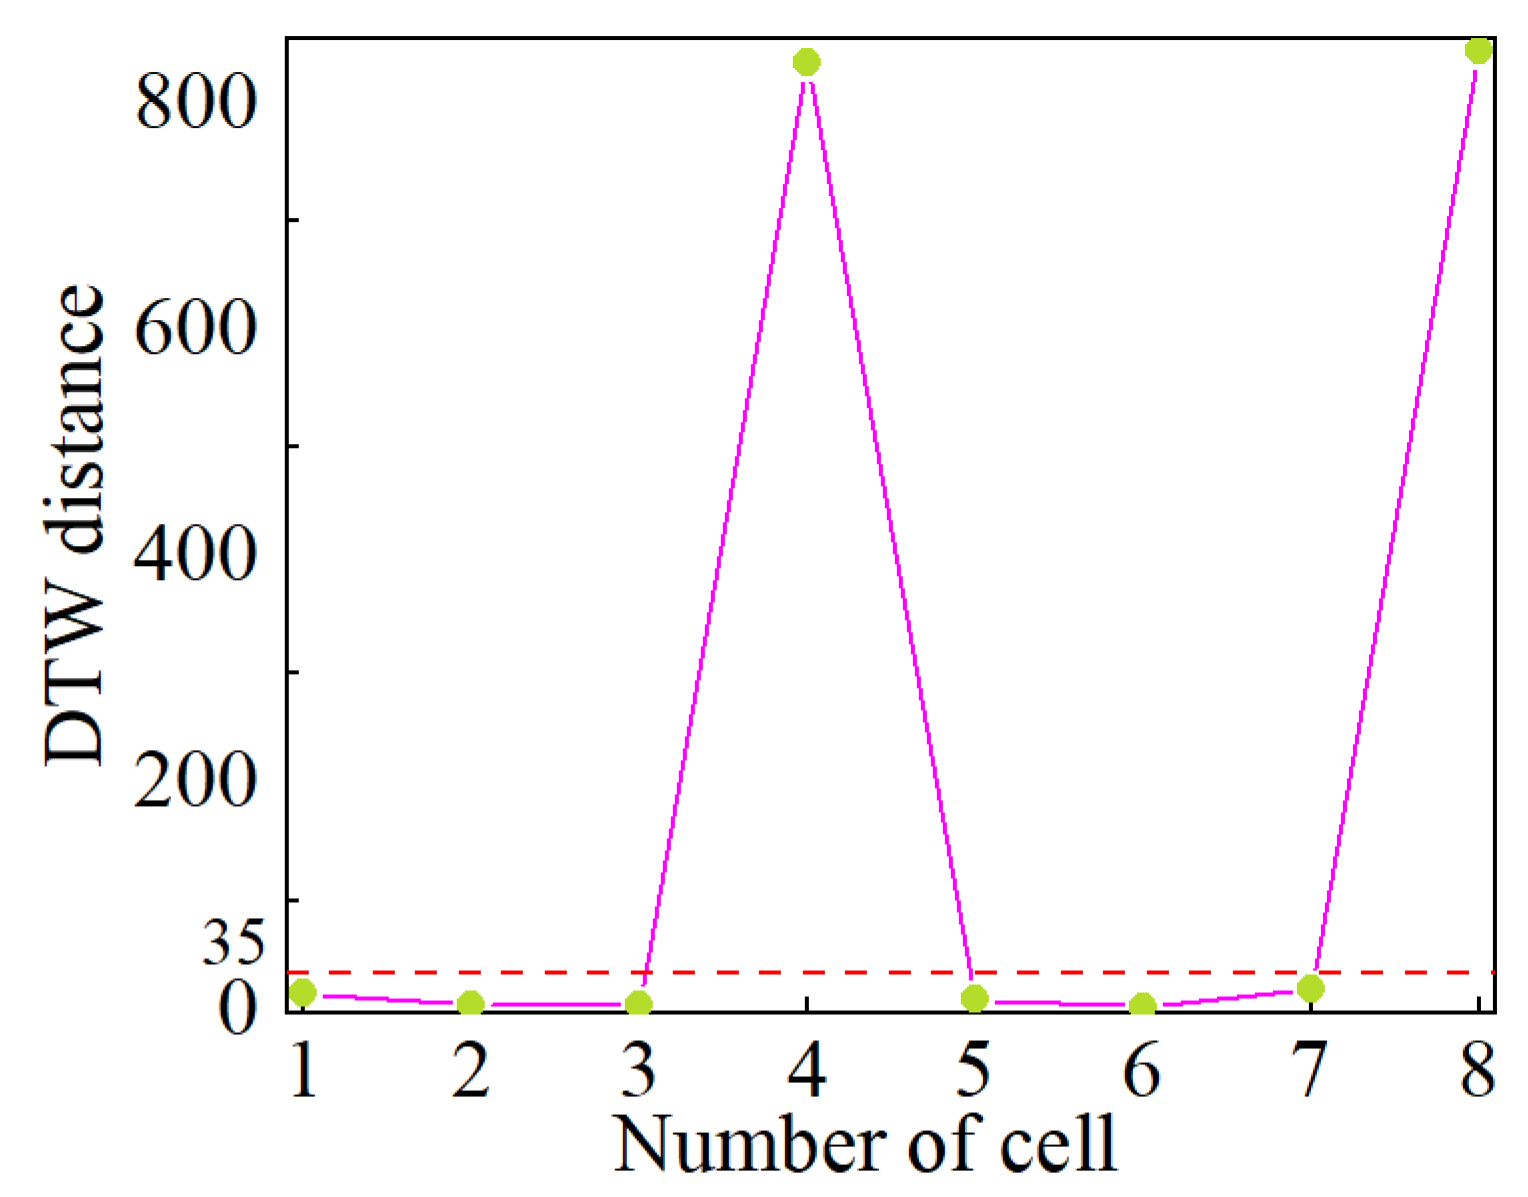
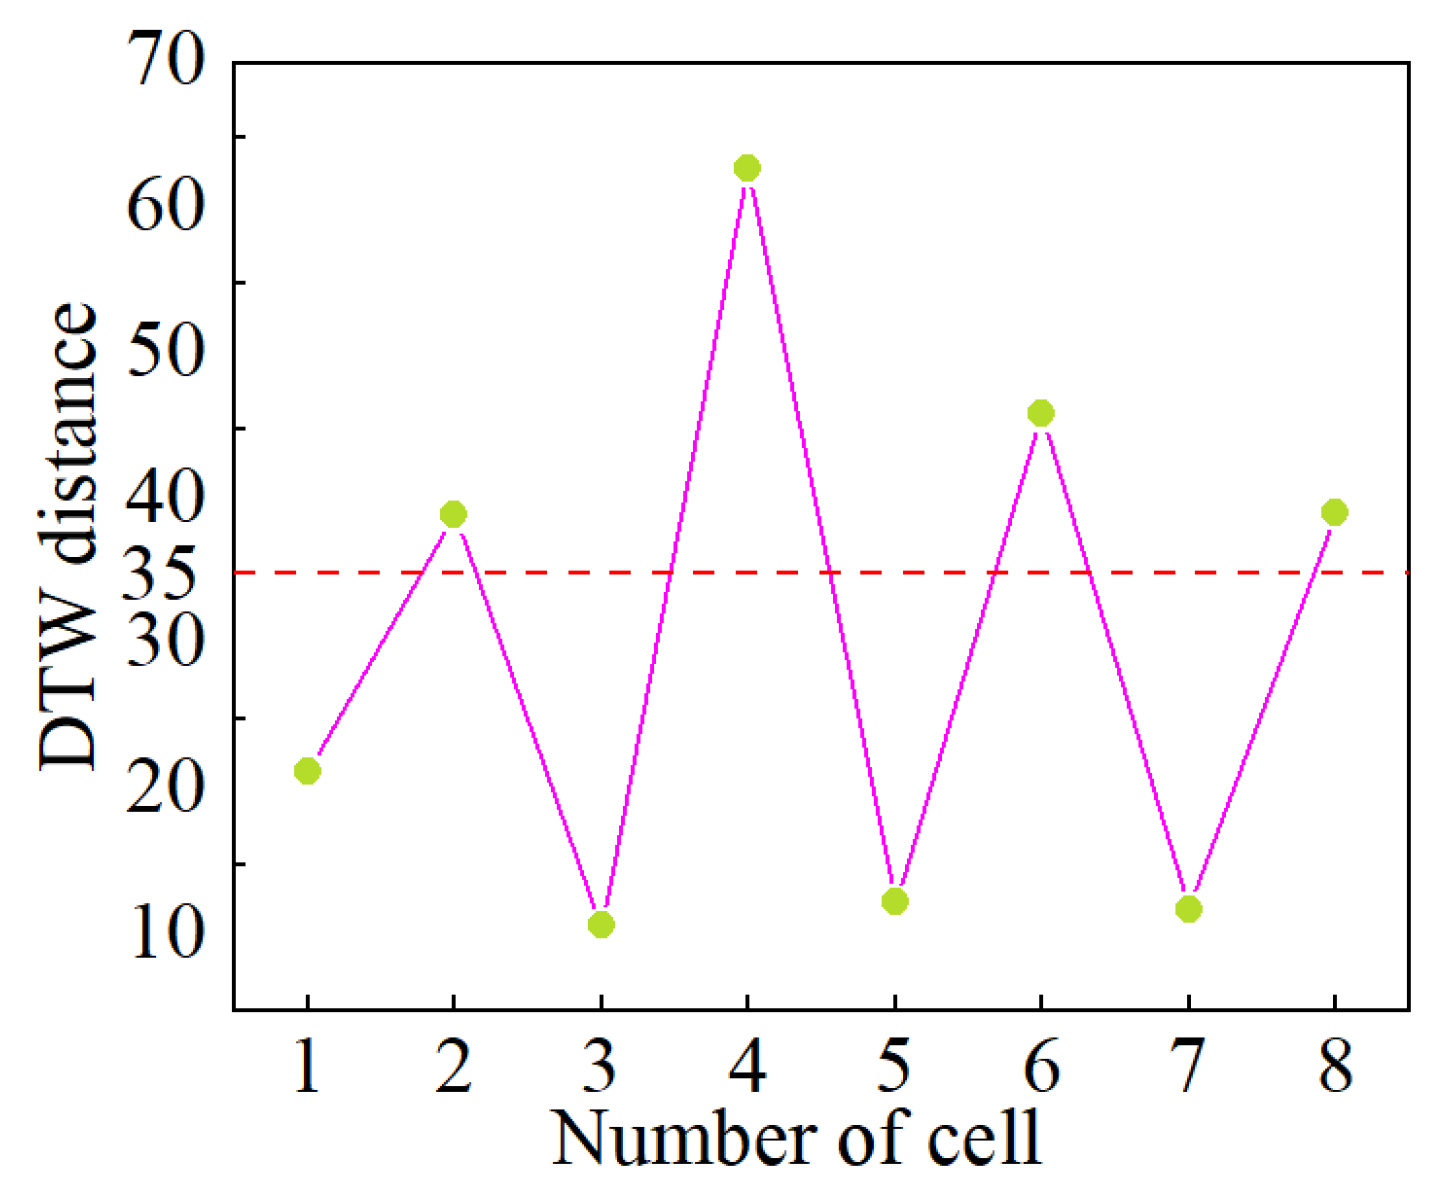
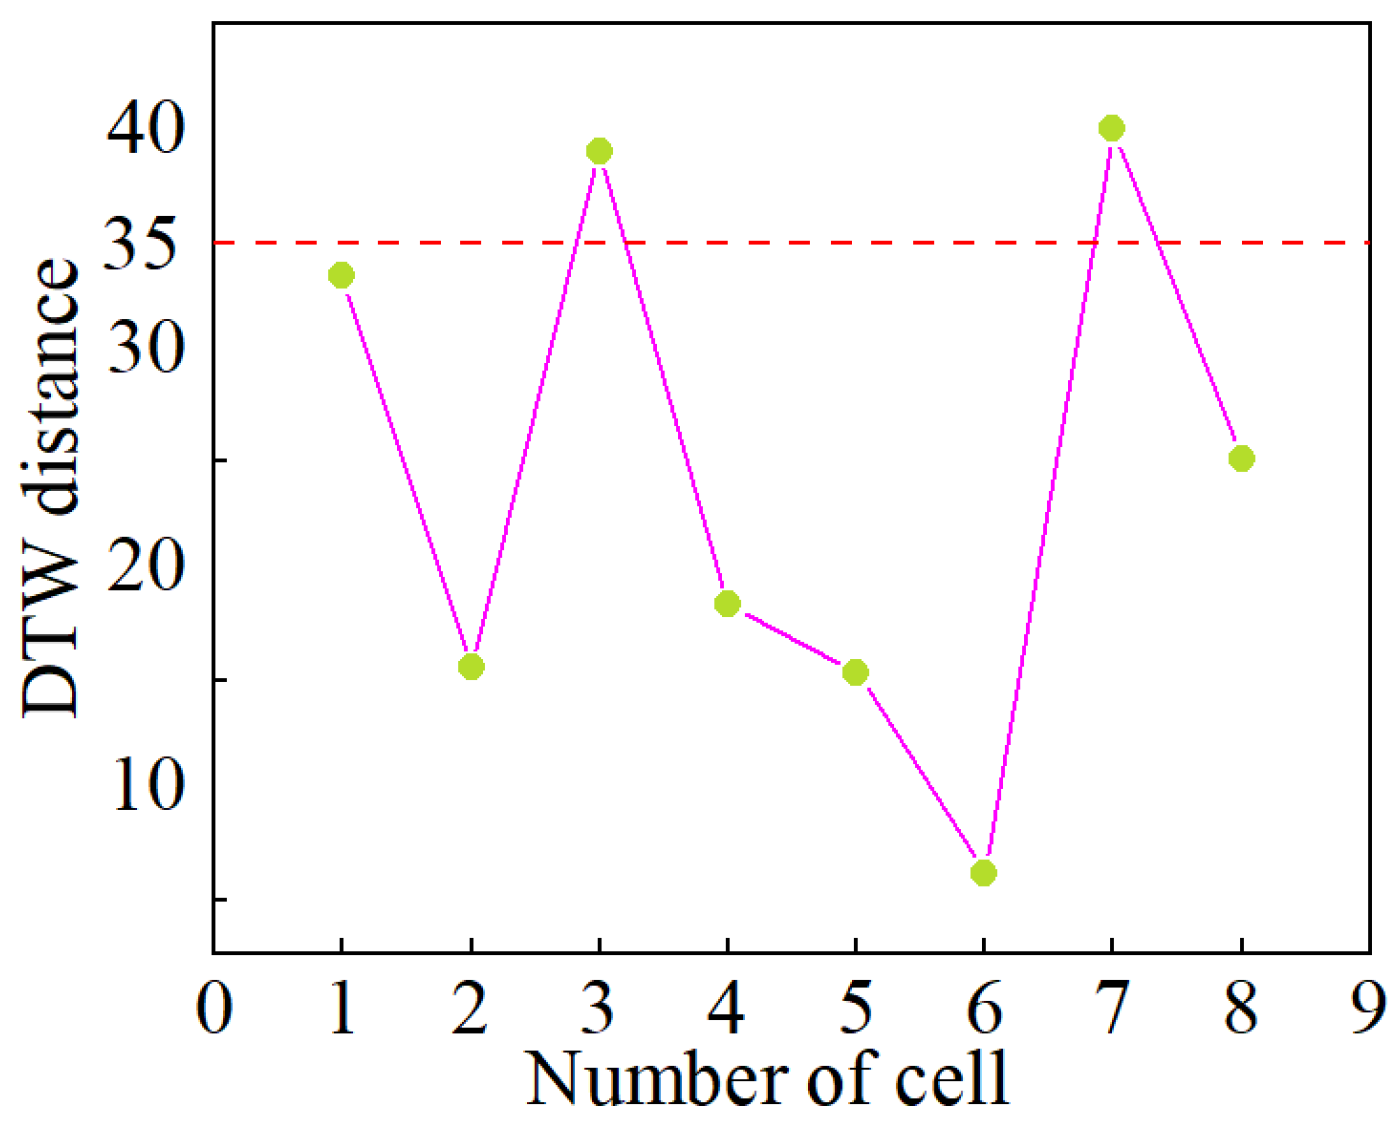
2.2. Detection of MSC Cells Based on DTW Distance
- (1)
- Boundary Condition: The boundary points of the optimal warping path Wbest are fixed, specifically W1 = (1, 1) and Wk = (M, N).
- (2)
- Monotonicity: This condition ensures the search direction for Wbest. Specifically, for a given Wk = (i, j) and Wk+1 = (i∗, j∗), it must hold that i∗ ≥ i and j∗ ≥ j.
- (3)
- Continuity: The search for Wbest can only proceed to adjacent points. Specifically, for a given Wk = (i, j) and Wk+1 = (i∗, j∗), it must hold that i∗ ≤ i + 1 and j∗ ≤ j + 1.
2.3. Estimation of SR Based on Maximum Charging Voltage Variation
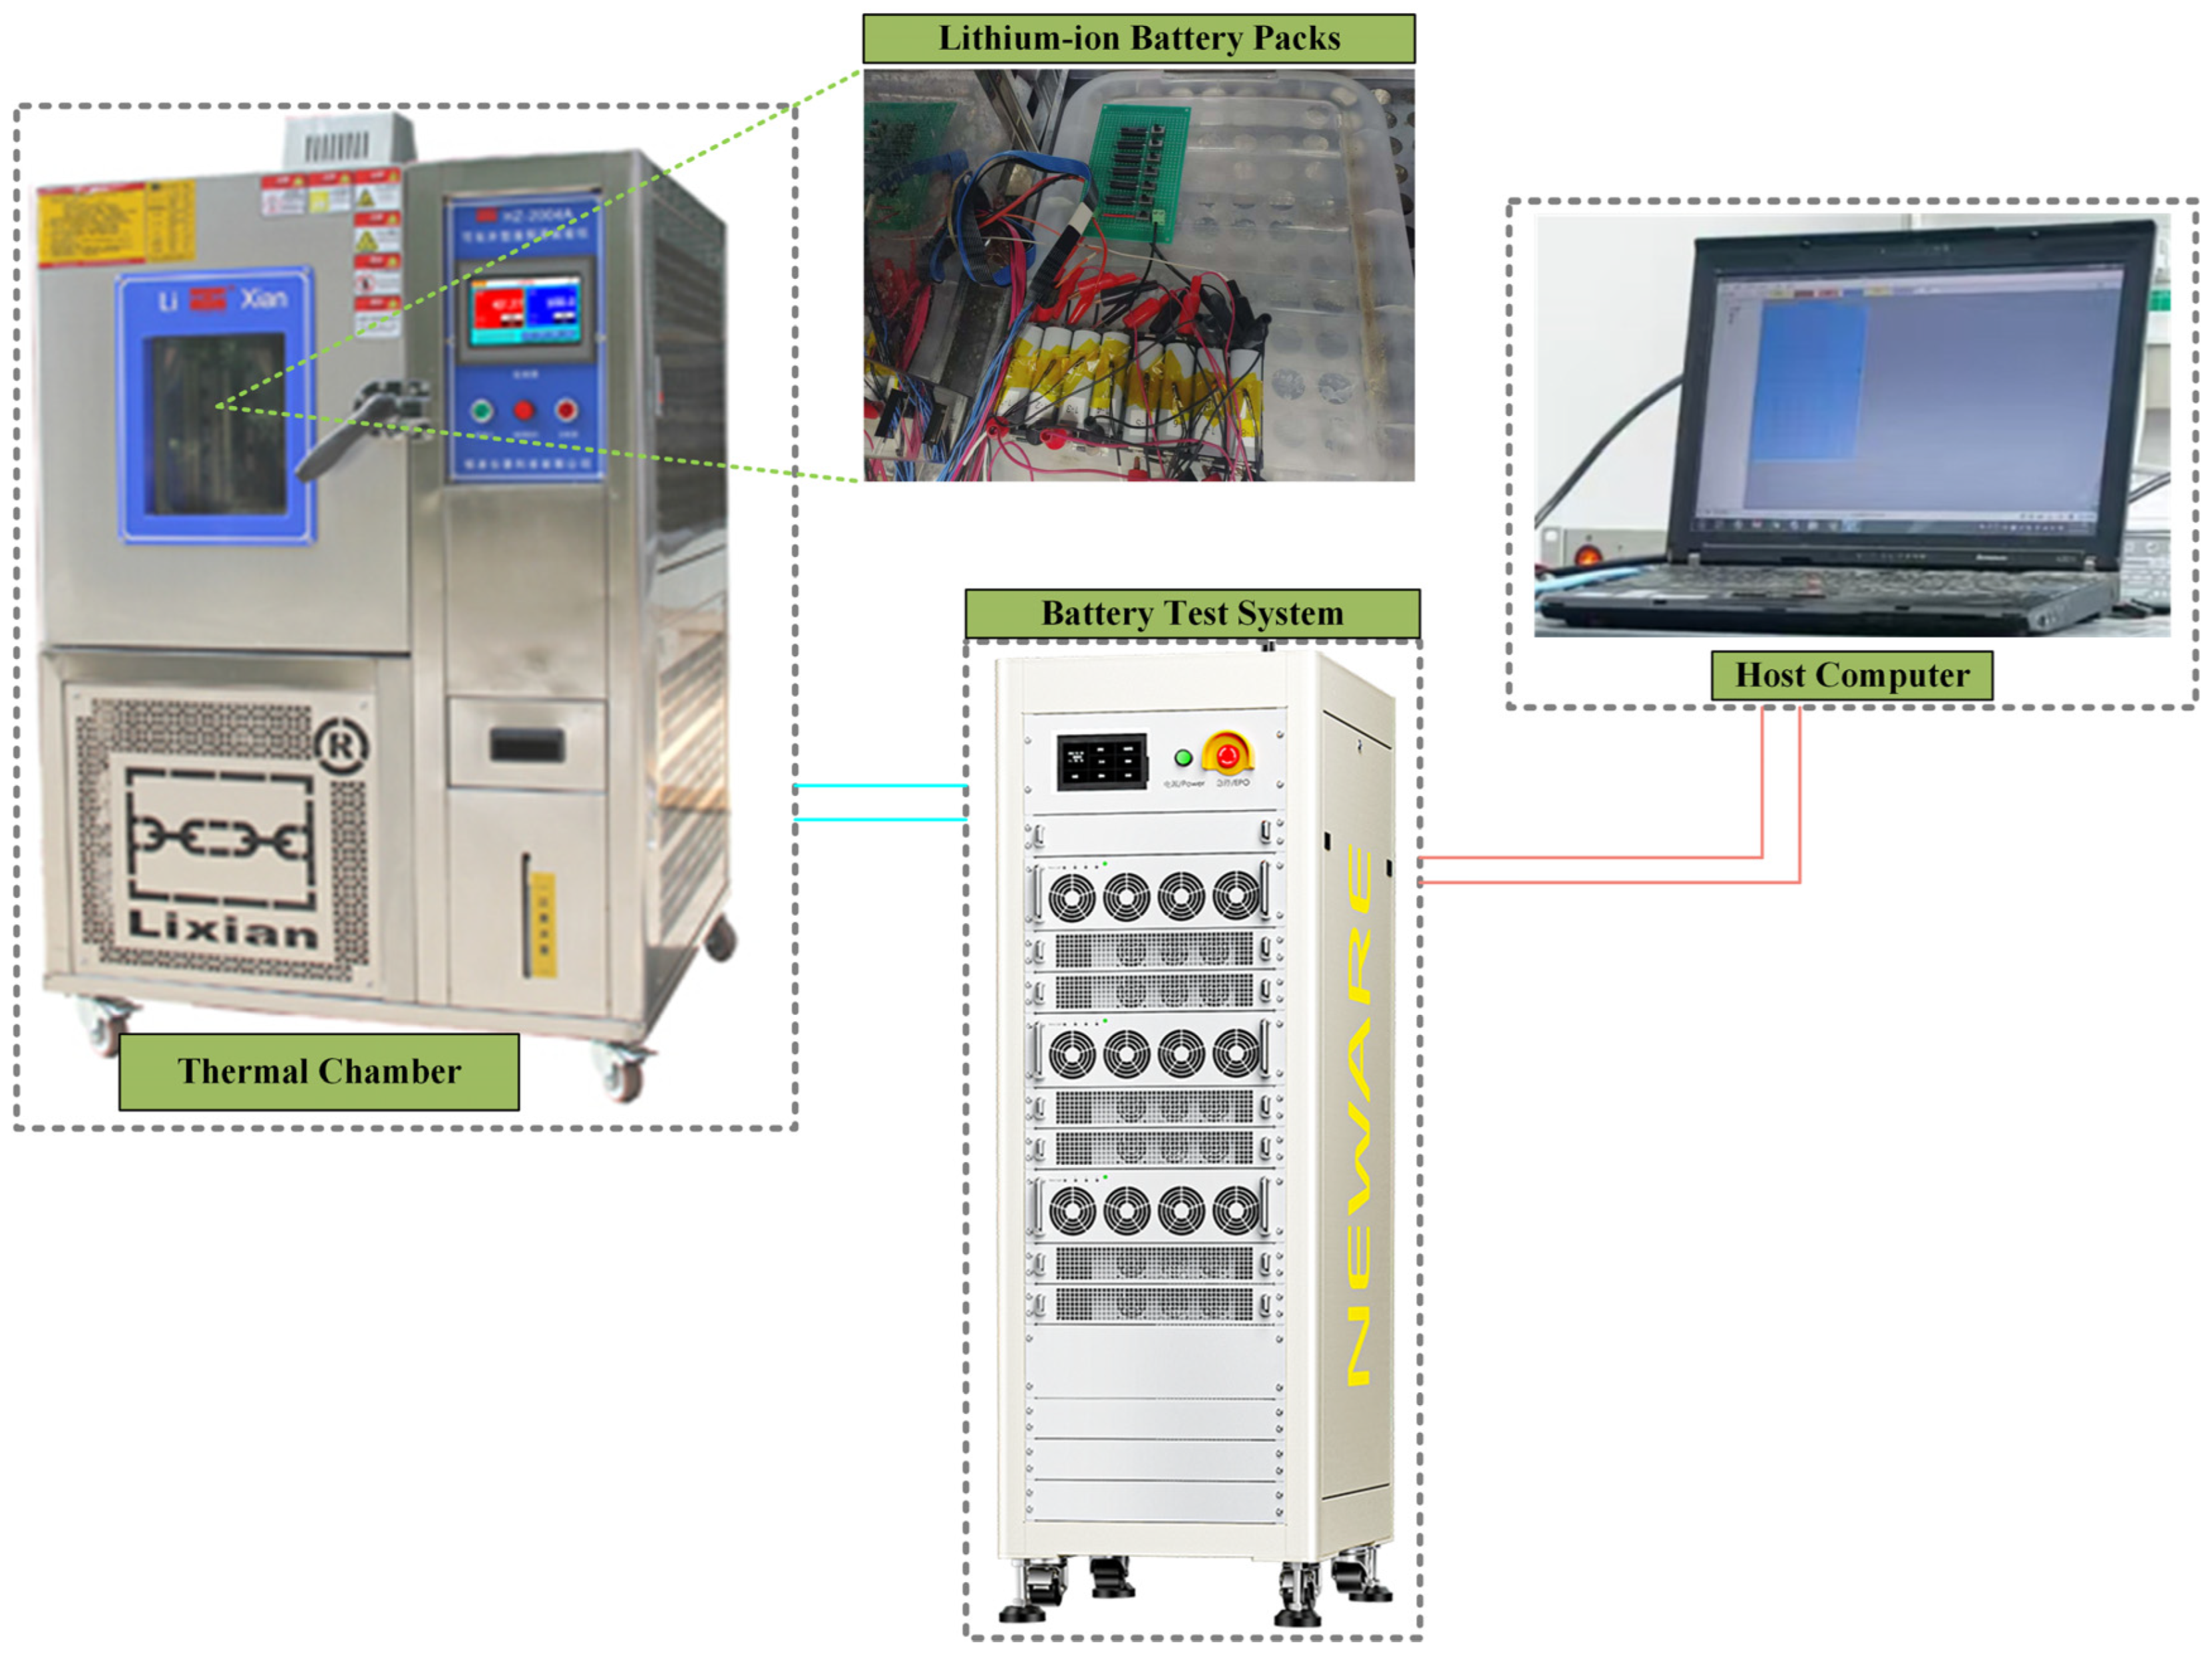
3. Experimental Section
4. Results and Discussion
4.1. The Qualitative Detection Results
4.2. The Estimated Results of SR
4.3. Comparison with Existing Methods
- (1)
- It enables the diagnosis of MSC in LIB packs without requiring the development of a precise battery model, thus circumventing the complications related to model accuracy.
- (2)
- The technique allows for simultaneous detection of MSCs and assessment of SR. This method of sequential detection followed by quantitative analysis is highly focused.
4.4. Further Discussion
4.4.1. Effects of Aging
4.4.2. Effects of Temperature and Initial SOC on SR
4.4.3. Impact of Cell Order Rearrangement
5. Conclusions
Author Contributions
Funding
Data Availability Statement
Conflicts of Interest
References
- Degen, F.; Winter, M.; Bendig, D.; Tübke, J. Energy consumption of current and future production of lithium-ion and post lithium-ion battery cells. Nat. Energy 2023, 8, 1284–1295. [Google Scholar] [CrossRef]
- Kim, N.; Kim, Y.; Sung, J.; Cho, J. Issues impeding the commercialization of laboratory innovations for energy-dense Si-containing lithium-ion batteries. Nat. Energy 2023, 8, 921–933. [Google Scholar] [CrossRef]
- Tian, J.; Fan, Y.; Pan, T.; Zhang, X.; Yin, J.; Zhang, Q. A critical review on inconsistency mechanism, evaluation methods and improvement measures for lithium-ion battery energy storage systems. Renew. Sustain. Energy Rev. 2024, 189, 113978. [Google Scholar] [CrossRef]
- Sun, C.; Lu, T.; Li, Q.; Liu, Y.; Yang, W.; Xie, J. Predicting the Future Capacity and Remaining Useful Life of Lithium-Ion Batteries Based on Deep Transfer Learning. Batteries 2024, 10, 303. [Google Scholar] [CrossRef]
- Peng, S.; Zhu, J.; Wu, T.; Tang, A.; Kan, J.; Pecht, M. SOH early prediction of Lithium-ion batteries based on voltage interval selection and features fusion. Energy 2024, 308, 132993. [Google Scholar] [CrossRef]
- Shen, D.; Lyu, C.; Yang, D.; Hinds, G.; Ma, K.; Xu, S.; Bai, M. Concurrent multi-fault diagnosis of lithium-ion battery packs using random convolution kernel transformation and Gaussian process classifier. Energy 2024, 306, 132467. [Google Scholar] [CrossRef]
- Mehta, C.; Sant, A.V.; Sharma, P. Optimized ANN for LiFePO4 Battery Charge Estimation using Principal Components based Feature Generation. Green Energy Intell. Transp. 2024, 3, 100175. [Google Scholar] [CrossRef]
- Shen, D.; Yang, D.; Lyu, C.; Ma, J.; Hinds, G.; Sun, Q.; Du, L.; Wang, L. Multi-sensor multi-mode fault diagnosis for lithium-ion battery packs with time series and discriminative features. Energy 2024, 290, 130151. [Google Scholar] [CrossRef]
- Cai, H.; Tang, X.; Lai, X.; Wang, Y.; Han, X.; Ouyang, M.; Zheng, Y. How battery capacities are correctly estimated considering latent short-circuit faults. Appl. Energy 2024, 375, 124190. [Google Scholar] [CrossRef]
- Li, S.; Zhang, C.; Du, J.; Cong, X.; Zhang, L.; Jiang, Y.; Wang, L. Fault diagnosis for lithium-ion batteries in electric vehicles based on signal decomposition and two-dimensional feature clustering. Green Energy Intell. Transp. 2022, 1, 100009. [Google Scholar] [CrossRef]
- Shen, D.; Lyu, C.; Yang, D.; Hinds, G.; Wang, L. Connection fault diagnosis for lithium-ion battery packs in electric vehicles based on mechanical vibration signals and broad belief network. Energy 2023, 274, 127291. [Google Scholar] [CrossRef]
- Shen, D.; Wu, L.; Kang, G.; Guan, Y.; Peng, Z. A novel online method for predicting the remaining useful life of lithium-ion batteries considering random variable discharge current. Energy 2021, 218, 119490. [Google Scholar] [CrossRef]
- Wang, P.; Chen, J.; Lan, F.; Li, Y.; Feng, Y. Multiscale feature fusion approach to early fault diagnosis in EV power battery using operational data. J. Energy Storage 2024, 98, 112812. [Google Scholar] [CrossRef]
- Zou, B.; Zhang, L.; Xue, X.; Tan, R.; Jiang, P.; Ma, B.; Song, Z.; Hua, W. A review on the fault and defect diagnosis of lithium-ion battery for electric vehicles. Energies 2023, 16, 5507. [Google Scholar] [CrossRef]
- Zhang, J.; Wang, Y.; Jiang, B.; He, H.; Huang, S.; Wang, C.; Zhang, Y.; Han, X.; Guo, D.; He, G.; et al. Realistic fault detection of li-ion battery via dynamical deep learning. Nat. Commun. 2023, 14, 5940. [Google Scholar] [CrossRef]
- Yuan, H.; Cui, N.; Li, C.; Cui, Z.; Chang, L. Early stage internal short circuit fault diagnosis for lithium-ion batteries based on local-outlier detection. J. Energy Storage 2023, 57, 106196. [Google Scholar] [CrossRef]
- Zhang, Y.; Jiang, M.; Zhou, Y.; Zhao, S.; Yuan, Y. Towards high-safety lithium-ion battery diagnosis methods. Batteries 2023, 9, 63. [Google Scholar] [CrossRef]
- Khaneghah, M.Z.; Alzayed, M.; Chaoui, H. Fault detection and diagnosis of the electric motor drive and battery system of electric vehicles. Machines 2023, 11, 713. [Google Scholar] [CrossRef]
- Wu, M.; Sun, M.; Zhang, F.; Wang, L.; Zhao, N.; Wang, J.; Huang, W. A fault detection method of electric vehicle battery through Hausdorff distance and modified Z-score for real-world data. J. Energy Storage 2023, 60, 106561. [Google Scholar] [CrossRef]
- Waseem, M.; Ahmad, M.; Parveen, A.; Suhaib, M. Battery technologies and functionality of battery management system for EVs: Current status, key challenges, and future prospectives. J. Power Sources 2023, 580, 233349. [Google Scholar] [CrossRef]
- Lai, X.; Yi, W.; Kong, X.; Han, X.; Zhou, L.; Sun, T.; Zheng, Y. Online detection of early stage internal short circuits in series-connected lithium-ion battery packs based on state-of-charge correlation. J. Energy Storage 2020, 30, 101514. [Google Scholar] [CrossRef]
- Chang, C.; Zhou, X.; Jiang, J.; Gao, Y.; Jiang, Y.; Wu, T. Electric vehicle battery pack micro-short circuit fault diagnosis based on charging voltage ranking evolution. J. Power Sources 2022, 542, 231733. [Google Scholar] [CrossRef]
- Zheng, Y.; Lu, Y.; Gao, W.; Han, X.; Feng, X.; Ouyang, M. Micro-short-circuit cell fault identification method for lithium-ion battery packs based on mutual information. IEEE Trans. Ind. Electron. 2020, 68, 4373–4381. [Google Scholar] [CrossRef]
- Ma, M.; Duan, Q.; Li, X.; Liu, J.; Zhao, C.; Sun, J.; Wang, Q. Fault diagnosis of external soft-short circuit for series connected lithium-ion battery pack based on modified dual extended Kalman filter. J. Energy Storage 2021, 41, 102902. [Google Scholar] [CrossRef]
- Kong, X.; Zheng, Y.; Ouyang, M.; Lu, L.; Li, J.; Zhang, Z. Fault diagnosis and quantitative analysis of micro-short circuits for lithium-ion batteries in battery packs. J. Power Sources 2018, 395, 358–368. [Google Scholar] [CrossRef]
- Xu, Y.; Ge, X.; Shen, W.; Yang, R. A soft short-circuit diagnosis method for lithium-ion battery packs in electric vehicles. IEEE Trans. Power Electron. 2022, 37, 8572–8581. [Google Scholar] [CrossRef]
- Shen, D.; Yang, D.; Lyu, C.; Hinds, G.; Wang, L.; Bai, M. Detection and quantitative diagnosis of micro-short-circuit faults in lithium-ion battery packs considering cell inconsistency. Green Energy Intell. Transp. 2023, 2, 100109. [Google Scholar] [CrossRef]
- Lei, D.; Zhang, M.; Guo, Q.; Gao, Y.; Bai, Z.; Yang, Q.; Fu, K.; Lyu, C. Model-free detection and quantitative assessment of micro short circuits in lithium-ion battery packs based on incremental capacity and unsupervised clustering. Int. J. Electrochem. Sci. 2024, 19, 100794. [Google Scholar] [CrossRef]
- Yadav, M.; Alam, M.A. Dynamic time warping (dtw) algorithm in speech: A review. Int. J. Res. Electron. Comput. Eng. 2018, 6, 524–528. [Google Scholar]
- Qiao, D.; Wang, X.; Lai, X.; Zheng, Y.; Wei, X.; Dai, H. Online quantitative diagnosis of internal short circuit for lithium-ion batteries using incremental capacity method. Energy 2022, 243, 123082. [Google Scholar] [CrossRef]
- Sun, J.; Chen, S.; Xing, S.; Guo, Y.; Wang, S.; Wang, R.; Wu, Y.; Wu, X. A battery internal short circuit fault diagnosis method based on incremental capacity curves. J. Power Sources 2024, 602, 234381. [Google Scholar] [CrossRef]
- Lai, X.; Jin, C.; Yi, W.; Han, X.; Feng, X.; Zheng, Y.; Ouyang, M. Mechanism, modeling, detection, and prevention of the internal short circuit in lithium-ion batteries: Recent advances and perspectives. Energy Storage Mater. 2021, 35, 470–499. [Google Scholar] [CrossRef]
- Huang, L.; Liu, L.; Lu, L.; Feng, X.; Han, X.; Li, W.; Zhang, M.; Li, D.; Liu, X.; Sauer, D.U. A review of the internal short circuit mechanism in lithium-ion batteries: Inducement, detection and prevention. Int. J. Energy Res. 2021, 45, 15797–15831. [Google Scholar] [CrossRef]


| Parameter | Value |
|---|---|
| Cathode | LiNi0.5Co0.2Mn0.3O2 |
| Anode | Graphite |
| Rated capacity | 4.20 Ah |
| Operating temperature | −20~+60 °C |
| Rated voltage | 3.65 V |
| Charging cut-off voltage | 4.20 V |
| Discharging cut-off voltage | 2.75 V |
| Cycles | The SR for Cell 4 | The SR for Cell 8 |
|---|---|---|
| 1–2 | ∞ | ∞ |
| 3, 4 | 300 Ω | 300 Ω |
| 5, 6 | 200 Ω | 200 Ω |
| 7, 8 | 100 Ω | 100 Ω |
| 9, 10 | 50 Ω | 50 Ω |
| 11, 12 | 10 Ω | 10 Ω |
| 13, 14 | 5 Ω | 5 Ω |
| Cells | Cycles | ||||||
|---|---|---|---|---|---|---|---|
| 3–4 | 5–6 | 7–8 | 9–10 | 11–12 | 13–14 | ||
| 4 | True SRs (Ω) | 300 | 200 | 100 | 50 | 10 | 5 |
| Estimated SRs (Ω) | 311.54 | 206.46 | 103.11 | 51.37 | 10.17 | 5.06 | |
| Relative Error (%) | 3.85 | 3.23 | 3.11 | 2.74 | 1.70 | 1.20 | |
| 8 | True SRs (Ω) | 300 | 200 | 100 | 50 | 10 | 5 |
| Estimated SRs (Ω) | 312.77 | 207.34 | 103.57 | 51.31 | 10.24 | 5.09 | |
| Relative Error (%) | 4.26 | 3.67 | 3.57 | 2.62 | 2.40 | 1.80 | |
| Methods | Qualitative Detection | Quantitative Estimation | Model-Free |
|---|---|---|---|
| IC difference [30] | × | √ | √ |
| IC + ECM [31] | √ | √ | × |
| The proposed method | √ | √ | √ |
| Cell | True SRs (Ω) | ICD Method [30] | IC-ECM Method [31] | ||
|---|---|---|---|---|---|
| Estimated SRs (Ω) | Relative Error (%) | Estimated SRs (Ω) | Relative Error (%) | ||
| 4 | 300 | 323.11 | 7.70 | 328.85 | 9.62 |
| 200 | 185.42 | 7.29 | 216.34 | 8.17 | |
| 100 | 90.74 | 9.26 | 104.12 | 4.12 | |
| 50 | 56.78 | 13.56 | 48.05 | 3.90 | |
| 10 | 8.75 | 12.50 | 9.78 | 2.20 | |
| 5 | 5.26 | 5.20 | 4.88 | 2.40 | |
| 8 | 300 | 325.31 | 8.44 | 328.99 | 9.66 |
| 200 | 184.34 | 7.83 | 215.65 | 7.83 | |
| 100 | 88.37 | 11.63 | 104.37 | 4.37 | |
| 50 | 58.11 | 16.22 | 52.01 | 4.02 | |
| 10 | 8.97 | 10.30 | 10.36 | 3.60 | |
| 5 | 5.28 | 5.60 | 4.86 | 2.80 | |
| Cell Number | 1 | 2 | 3 | 4 | 5 | 6 | 7 | 8 |
| Initial SOH (%) | 100 | 95 | 100 | 100 | 100 | 90 | 100 | 100 |
Disclaimer/Publisher’s Note: The statements, opinions and data contained in all publications are solely those of the individual author(s) and contributor(s) and not of MDPI and/or the editor(s). MDPI and/or the editor(s) disclaim responsibility for any injury to people or property resulting from any ideas, methods, instructions or products referred to in the content. |
© 2024 by the authors. Licensee MDPI, Basel, Switzerland. This article is an open access article distributed under the terms and conditions of the Creative Commons Attribution (CC BY) license (https://creativecommons.org/licenses/by/4.0/).
Share and Cite
Zhang, M.; Guo, Q.; Fu, K.; Du, X.; Zhang, H.; Zuo, Q.; Yang, Q.; Lyu, C. Early Internal Short Circuit Diagnosis for Lithium-Ion Battery Packs Based on Dynamic Time Warping of Incremental Capacity. Batteries 2024, 10, 378. https://doi.org/10.3390/batteries10110378
Zhang M, Guo Q, Fu K, Du X, Zhang H, Zuo Q, Yang Q, Lyu C. Early Internal Short Circuit Diagnosis for Lithium-Ion Battery Packs Based on Dynamic Time Warping of Incremental Capacity. Batteries. 2024; 10(11):378. https://doi.org/10.3390/batteries10110378
Chicago/Turabian StyleZhang, Meng, Qiang Guo, Ke Fu, Xiaogang Du, Hao Zhang, Qi Zuo, Qi Yang, and Chao Lyu. 2024. "Early Internal Short Circuit Diagnosis for Lithium-Ion Battery Packs Based on Dynamic Time Warping of Incremental Capacity" Batteries 10, no. 11: 378. https://doi.org/10.3390/batteries10110378
APA StyleZhang, M., Guo, Q., Fu, K., Du, X., Zhang, H., Zuo, Q., Yang, Q., & Lyu, C. (2024). Early Internal Short Circuit Diagnosis for Lithium-Ion Battery Packs Based on Dynamic Time Warping of Incremental Capacity. Batteries, 10(11), 378. https://doi.org/10.3390/batteries10110378