Tutorial

Teaching Aid Regarding the Application of Advanced Organic Petrography in Recycling End-of-Life Lithium-Ion Batteries

by
Bruno Valentim
Earth Science Institute–Porto Pole, Department of Geosciences, Environment and Spatial Plannings, Faculty of Sciences, University of Porto, Rua do Campo Alegre s/n, 4169-007 Porto, Portugal
Batteries 2024, 10(11), 391; https://doi.org/10.3390/batteries10110391
Submission received: 17 July 2024 / Revised: 18 October 2024 / Accepted: 1 November 2024 / Published: 5 November 2024
(This article belongs to the Section Battery Processing, Manufacturing and Recycling)

Abstract

:
This teaching aid aims to illustrate a range of the most common materials in end-of-life (EoL) lithium-ion batteries (LIBs) to demonstrate the usefulness of advanced organic petrography in the characterization of EoL LIB materials and to assess the efficiency of LIB recycling processes from the pre-processing stage up to the impurities of the metallurgical processes. Additionally, it may be useful for students, petrographers, and professionals in battery development and recycling.

1. Preamble

The use of incident light microscopy with oil immersion objectives to study coal and dispersed organic matter still has an important role where coal is mined, and coke is made, in the exploration of oil and gas, in geological basin studies for CO2 storage, graphite mining, and production, coal and biomass ashes, etc.
However, reducing investment in fossil fuels due to global warming policies and the increasing development of advanced characterization techniques are creating challenging times for organic petrography.
Under technology development and energy transition, new materials are created, used, discarded, and recycled. These materials are diverse and complex in many senses, and one could assume that organic petrography has no role here.
This teaching aid aims to show that opportunities are appearing for organic petrography in its advanced form, i.e., in combination with SEM-EDS and MRS.

2. Introduction

Li-ion cells have major advantages (e.g., high specific energy, a long life cycle, etc.) compared to other types of cells, making them attractive for various applications. The LIB worldwide sales were <10,000 MWh in 2000 and are estimated to increase to 500,000 MWh in 2025 [1].
Rechargeable LIBs are composed of one or more Li-ion cells. Oxidation and reduction reactions occur during charging and discharging. During charging, the lithium ions are deintercalated from the positive material (e.g., LiCoO2), transferred by the electrolyte, and intercalated into the negative material (e.g., graphite), while the reverse occurs during discharging [1].

2.1. LIB Composition

Portable LIB are energy sources for portable electronics (e.g., computers, cameras, smartphones, and tablets), power tools, and new products (e.g., hoverboards, drones, and electric bicycles). In contrast, electric vehicles (EVs) and other industrial batteries are used as backup power for base stations and data centers, energy storage systems, forklift trucks, other industrial vehicles, and EVs such as cars and buses.
The EVs are now the dominant segments of the LIB market but have a relatively short life span (one to four years in electronic products and five to ten years in electric vehicles) [2,3,4] and will emerge as a future waste management challenge, with projected annual waste flows reaching as high as 340,000 metric tons by 2040 [5,6,7].
LIBs are composed of strategic and critical materials (Li, Co, graphite, P, Cu, Ni, and Mn) and other economically important elements (e.g., Al) [8].
With variations from one producer to another, an EV LIB comprises graphite (8.2%), lithium metal oxides (1% lithium, 3.1% cobalt, 3.1% nickel, 2.8 manganese; on average 3.5 kg, 10.9 kg, 10.9 kg, and 9.8 kg, respectively), 5–10% other metals (copper (Cu), aluminum (Al), iron (Fe), etc.), organic chemical products, and plastics (15% and 7%, respectively) [9,10,11,12,13]. Although Co represents the highest value in the LIB, recycling other battery materials enhances the sustainability of the recycling ecosystem [14,15].
A Li-ion battery is a complex device composed of one or more cells combined in modules and packed into a housing with electric connections. For example, the generic composition of electric vehicle batteries comprises an Al casing, electronics, plastics, steel canisters, welding, wire bonding and mechanical joints, and cables, which are divided between the battery system periphery, the module periphery, and the cell housing.
The battery cells typically contain four components [10,13,14,15,16,17]:
  • The cathode is the positive electrode and consists of active materials, binders, and conductive additives. It is made of lithium metal oxides bound to an Al foil. There are many variations in these oxides, but some common types include LiCoO2 (LCO), LiNixMnyCozO2 (NMC), LiNixCoyAlzO2 (NCA), LiMn2O4 (LMO), LiFePO4 (LFP), and LiNiCoAlO2 (NCA);
  • The anode is the negative electrode, usually made of an anode of graphite bound to a Cu foil. However, other materials can be found in the anode, such as carbon-based materials, porous carbon, carbon nanotubes, graphene, silica, lithium titanate (Li4Ti5O12), Si, Ge, Sn, Al, Bi or SnO2, transition metal oxides (MnxOy, NiO, FexOy, CuO, Cu2O, MoO2, etc.), mesoporous heterostructures, nanocomposites, metal sulfides, metal phosphides, and metal nitride, among others [18];
  • The electrolyte is typically composed of lithium salts (LiPF6, LiBF4, or LiClO4) dissolved in organic solvents such as ethylene carbonate and dimethyl carbonate/ethyl methyl carbonate;
  • The separator is a porous membrane soaked with an ionically conductive liquid electrolyte (typically in LiPF6) and placed between the electrodes. A variety of separators have been used in batteries over the years.
The separator, a microporous polyolefin membrane widely used in LIBs, is composed of organic polymers (polyethylene or polypropylene, or laminates of these) or nonwoven materials such as ceramic particles (alumina zirconia or silica) slurry-coated on polymer membranes [18,19,20,21,22].
Glass fibers may be used in different types of separators for different functions, and in some cases, separators are made of highly porous nonwoven glass fibers. They may also be used as thermal insulators. The glass mat comprises microfibers joined by a binder [22].
The electrodes may be processed using organic solvent-based (nonaqueous) or water-based (aqueous) binders. In conventional lithium-ion batteries, the former are typically used. Among these, polyvinylidene fluoride (PVDF) is widely used as a binder for both positive and negative electrodes of LIBs, forming a binder/conductive additives matrix.
Depending on the battery type and the producer options, other binders may be used in the electrodes, such as polytetrafluoroethylene (PTFE), Teflon, polytetrafluoroethylene (PTFE)–carboxymethyl cellulose (CMC) composites, polyvinylpyrrolidone (PVP) and composite PTFE–polyvinyl alcohol (PVA), among others. PVDF and another binder type may also be a coating of the separator membrane [16,22,23,24,25].

2.2. LIB Recycling

According to Melin [6], the first mention of LIB recycling was published in 2000 in an Argonne National Laboratory technical report [10]. At that time, no EV LIB recycling activity was known; only small batteries from electronic consumers were recycled in Japan, which dominated the production of small Li-ion batteries and controlled much of the intermediate material supply [10].
Additionally, the shift to a much more diverse market, the increased multiplicity of the material chemistries used, the size and assemblage (e.g., modularity), and specific applications pose major challenges for recycling [14,26].
Although remanufacturing or repurposing should be the first option for used LIBs, they will ultimately be recycled [14]. Recycling lithium-ion cells mitigates materials’ scarcity, enhances environmental sustainability, and supports a more secure and resilient domestic materials supply chain [27].
One ton of battery-grade lithium and cobalt can come from 28 tons or 5 to 15 tons of EoL lithium-ion batteries. Meanwhile, by 2010, only 5% of the LIBs sold in the EU were recycled [28]. Melin [26] considers that today’s percentage is far more than 5%, corresponding to 300,000–400,000 tons, mainly recycled in China and South Korea.
Before recycling, the EoL LIBs are pre-processed, i.e., they are collected and stored, and then they must be disassembled to a size and shape that is appropriate for further processing [10].
The initial steps of recycling EoL LIBs include discharging, dismantling, and mechanical separation, including shredding, crushing, grinding, sieving, air separation, magnetic separation, froth flotation, or a combination of these. Al and Cu foils are separated in this process, and copper is sent to copper recyclers. Other materials like binders, electrolytes, plastics, and steel are also removed, and a “black mass” is obtained [10,13,29,30,31].
The “black mass” is a granular material that is black in color with a silvery metallic brightness, agglomerate sizes from 20 μm to fragment sizes up to 6.3 mm are obtained, and it is made up of the shredded cathodes and anodes of the batteries [13].
Cobalt and, to a lesser extent, nickel recovery are the main goals of LIB recycling. In pyrometallurgy, entire cells or the shredding Cu- and Al-rich coarse fractions are smelted at a high temperature. During this process, the carbonaceous materials (graphite, organic polymers, and electrolyte solvents) are burned, a Co-Ni-Cu-alloy is formed, and the resulting slag contains Li and Al oxides. The gas flow carries away elements such as F. A sequence of solvent extraction and precipitation processes is needed to separate the metal ions [10,14].
The hydrometallurgical treatment of the black mass is a liquid-based process via leaching the metallic elements in acids (or bases), and the metallic elements are then recovered via a sequence of solvent extraction and precipitation processes. However, anode graphite and other insoluble materials become impurities, e.g., [10,16,32,33,34].
LIBs may also be bioleached using the acid produced during the metabolizing activity of bacteria or fungi, e.g., [35].
In this context, advanced organic petrography may have a role in assessing each basic type of recycling technology: pyrometallurgical processing or smelting processes, hydrometallurgy or leaching processes, and direct recycling.

3. Application of Advanced Organic Petrography to LIB Recycling (Examples from Project NEXT-LIB, the ERA-MIN2 Program)

The NEXT-LIB project samples were collected from a facility recycling spent LIBs with different NMC compositions. EoL LIBs are mechanically dried, crushed, sieved, and magnetically separated in this unit. The black mass samples belong to the non-magnetic and undersize (<4.0 mm) fraction.
To assess the purity and consistency of the material over the recycling steps, which is important for increasing the value of the cathode material, the advanced organic petrography results may help to perform a fast assessment of the efficiency of the milling process and the quality of the product for the hydrometallurgy process.
The multi-technique approach, resulting from the combination of stereo microscopy, incident light microscopy (ILM), scanning electron microscopy with X-ray microanalysis (SEM-EDS), and micro-Raman spectroscopy (MRS), can be used to identify and quantify different lithium metal oxide species, anode graphite, Cu and Al foils, anode and cathode chunks, organic polymers (binder and plastics), and other organics (e.g., char and petroleum coke), glass fibers, ceramics, steel, and others.
During the different steps of the EoL LIB pre-treatment, which include physical separation processes, the characterization of the particles after shredding and sieving is important to assess:
  • The separation of the electrolyte from the shreds and solvents;
  • The separation of coarse fragments of copper and aluminum foil current collectors, which are sent for copper recyclers;
  • The separation of the active materials from the current collectors;
  • The structure of the cathode for further reuse;
  • The fine particles that may lead to impurities and the presence of current collectors and other materials in the black mass;
  • The binder and the solid electrolyte interphase (SEI) from the electrodes;
  • The anode graphite transformations caused by the mechanical activation due to shredding and milling.
The recycling steps of EoL LIBs can be successfully monitored through ILM, which will help optimize the processes and contribute to the materials’ higher value and consistency. This analytical technique can analyze the optical structure and texture of the anode graphite and lithium metal oxides.
This information complements the information obtained from other techniques such as:
  • X-ray diffraction (XRD) to determine phase composition and lithium metal oxides and graphite amounts;
  • SEM-EDS for detailed imaging, phase identification, and semiquantitative chemical analysis including chemical mappings;
  • Transmitted electron microscopy (TEM) for crystalline structure assessment and chemical mappings;
  • Scanning probe microscopies, including QEMSCAN, for phase identification and characterization;
  • Total carbon and carbons forms for organic polymers, inorganic C and graphitic C determination;
  • Inductively coupled plasma-optical emission spectrometry (ICP-OES) to determine elements for cathodes (Co, Cu, Li, Mn, Ni, and P) and impurity elements (Al, S, Ti, W, and Zr) [36,37].
For the characterization of the materials from EoL LIBs obtained during the pre-processing stage up to the impurities of the metallurgical processes, the analysis through the stereo microscope and the procedures typically used in organic petrography are useful, especially if combined with SEM-EDS and MRS.
The results obtained by these techniques can be correlated with other recycling information, for example, to identify and quantify graphite, current collector fragments, and lithium metal oxides, or the fate of the binder, or to clarify the properties and behavior of graphite and lithium metal oxides after pyrolysis. This approach is similar to what has been performed in the optical microscopy approach to the characterization of coal, coal-derived materials, and graphite, including petrographic applications such as the characterization of baked anodes and graphite electrodes used in the steel industry [38].

3.1. Methods and Analytical Techniques

3.1.1. Stereo Microscopy

Prior to petrographic analyses, a classical visual observation of the samples was made using a stereo microscope Leica M205C. The stereo microscope is designed for low-magnification observation. The samples did not require previous preparation, and the light reflected from the surface of the objects provided vivid 3D images. The stereo microscope is used for close work such as watch-making, circuit board manufacturing, and inspection. These characteristics make the stereo microscope a useful tool for the preliminary characterization of the fragments of the LIB components.
This technique is inexpensive, does not require skilled personnel, and can provide fast and interesting results, especially from the coarse fractions. To facilitate the analysis or inspect the results of size separation, combining the stereo microscope with sieving facilitates the identification of particles up to 150 µm. Different materials are identifiable, which enables us to make a rough estimation of how these are distributed.

3.1.2. Scanning Electron Microscopy with Energy Dispersive Spectroscopy (SEM/EDS)

The SEM-EDS analysis of shredded EoL LIB samples, as-received and as polished blocks, was carried out at the Materials Centre of the University of Porto, Portugal (CEMUP). An FEI Quanta 400 FEGESEM/EDAX Genesis X4M was operated at 15 kV in high vacuum mode with a manual aperture and an instrument-specific 4.5 beam spot-size setting.
The secondary electron (SE) mode was mainly used for detailed imaging of the surface of anode graphite in as-received samples. The backscattered electron (BSE) mode was mainly used for detailed imaging of the inorganic phase morphology/texture and its identification since it is highly sensitive to changes in atomic number. X-ray microanalysis (EDS) was made for semiquantitative chemical analysis.
The polished block preparation may be made according to standard ISO 7404-2 regarding preparing coal samples for petrographic analysis [39]. However, after the epoxy cure, the blocks should be cut into two halves perpendicularly to the surface, and the new surfaces should then be polished (Figure 1). This way, particle sink/float phenomena will not influence the analysis results.
If ILM analysis is to be made after, the blocks must be repolished using the final polishing cloth to remove any sputtering material (carbon, gold, or palladium). If observations were made using oil objectives before SEM-EDS analysis, the oil must be removed since it will devolatilize inside the vacuum chamber. This can be carried out using an organic solvent (e.g., ethylic alcohol). If repolishing is considered necessary to remove the oil trapped inside pores, removing material from the surface will not allow particles previously identified to be found.
Materials’ identification using SEM-EDS is mainly based on phase differences, which result from the density average of the elements present, i.e., light elements appear to be darker than dense elements [40]. With magnifications up to 50,000×, SEM-EDS provides detailed imaging complemented by semiquantitative chemical analysis.
In analyzing LIB components and materials through SEM-EDS, the secondary electron detector is used for surface topography, which will be useful mainly in identifying and characterizing anode graphite. In contrast, the backscattered electron detection mode allows the identification of different phases.
The X-ray microanalysis (EDS) is very useful for determining lithium metal oxide composition and the chemical signatures of components such as PVDF, among others.

3.1.3. Incident Light Optical Microscopy with Oil Immersion Objectives

Classic petrography with a reflected light microscope is used to examine “opaque” minerals, which include many ore minerals (e.g., graphite) and ore-gangue relationships. However, this technique also examines coal macerals and dispersed fossil organic matter. In this case, an ultraviolet light source identifies fluorescent organic matter and oil droplets [41].
A microscopist with little experience can identify many minerals and macerals using qualitative identification methods without recourse to other methods [41]. Similarly, LIB components and raw materials may be identified, and their relations and level of alteration may be assessed, for example, to determine the amount of graphite and lithium crystals in BM before and after leaching or the fate of the binder after BM roasting.
Most of the EoL LIB materials, e.g., graphite, lithium metal oxide crystals, metals, etc., may be characterized through ILM methods used in the petrographic characterization of ores and sedimentary organic matter, i.e., the analysis is made under white or UV light, using oil immersion objectives, light polarizers, and a retarded light plate to enhance the differences between the components. However, before the optical microscopy analysis, it is advisable to make a preliminary SEM-EDS analysis to identify the inorganic materials.
For identifying components and raw materials in shredded LIBs in ILM with oil immersion objectives, qualitative methods can be used to assess qualitative optical properties used in ore microscopy and petrography [41].
For bireflectance, and reflection pleochroism, the microscopic observations must be made using linearly or “plane”-polarized light (i.e., only the polarizer is inserted). In contrast, “crossed polars” (i.e., the polarizer and analyzer are inserted) are used to observe anisotropism, anisotropic colors, and internal reflections.
These properties will enable the assessment of the structural and morphological properties of the materials, i.e., their internal structure (whether they are dense/porous, their complexity, i.e., mono- or multi-composition), crystallinity (amorphous versus crystalline), and the crystal structure of the graphite and lithium metal oxides (i.e., their crystal form and habit, cleavage and parting, and twinning).
Similarly to immature sedimentary organic matter and oil [42,43], synthetic organic polymers (e.g., plastics) and organic binders also fluorescent under UV light. This property makes incident light optical microscopy the best, if not the unique, analytical technique for identifying and quantifying, within the same analysis, the carbonaceous materials in the LIB, which is also useful for tracking them over the separation and transformation processes.
For the quantitative analysis of the components and raw materials in shredded LIBs, a point-counting method may be used to quantify the materials in the polished blocks (results expressed as a vol%).
The only modification to standard ISO 7404-3 [44] is the name and number of materials to be quantified; for example, in the study by Badenhorst et al. [45], they quantified the (1) anode graphite; (2) binder (binder and small impurities embedded in the binder); (3) current collector foils (Al and Cu); (4) organic carbon (plastics and other carbonaceous materials that are fluorescent under UV light); (5) lithium metal oxides; (6) other (includes Fe and Si).
Whatever the decision, it is advisable always to include “Others” due to the complexity of the batteries and the quality of the recovering and sorting processes of the recyclers.
Measuring the anode graphite reflectance may be useful in detecting the influence of a thermal process (e.g., pyrolysis) or acid leaching. For this purpose, random or maximum reflectance can be determined using the same processes described for vitrinite reflectance determination in standards of ISO 7404-5 and ASTM D2798-11 [46,47].
The petrographic images included here were obtained from shredded LIB polished blocks with randomly oriented particles (these were made as described above), using an incident white and UV light microscope Leica DM4500P (Leica Microsystems GmbH, Wetzlar, Germany) equipped with a ×50 oil objective (combined magnification of ×500), controlled by the software Fossil 5.0.7268#10744 (Hilgers Technisches Büro, Königswinter, Germany).
Observations with polarized light and using a one-wave length retarded plate were also made to enhance the contrast between the components and to obtain interference colors.

3.1.4. Micro-Raman Spectroscopy

MRS can be applied to analyzing and characterizing anode and cathode active materials before, during, and after EoL LIB recycling, aiming to provide information regarding chemical characterization (molecular composition), structural modifications, identification and transformations of crystalline forms, etc. [48].
To help identify and characterize the different carbon materials and find their signatures, the Raman parameters, position, full width at half maximum (FWHM), and the intensity or area of bands D and G are used. Their ratios are typical of each material and may be affected by heat treatments and acid leaching [49,50,51,52,53].
The ID/IG ratio enables the study of the surface structural disorder/defect of probing anode graphite [54], for example, it enables the study of anode graphite crystallinity and evaluates the disaggregation and degradation caused by the recycling processes.
To help identify and characterize the different lithium metal oxides and evaluate their crystallinity after mechanical separation and thermal treatments, the Eg and A1g bands are active vibrational modes sensitive to crystalline structure modification, and their band shift and FWHM provide information regarding crystallinity degradation. For example, the higher the ratio A1g/Eg, the more crystalline the structure. This information is vital for the reuse of cathode materials [55,56,57].
The Raman spectra included here were obtained using a Horiba MicroRaman spectrometer XploRATM with a 100× objective lens, equipped with an excitation wavelength of 532 nm from an Nd:YAG laser at a power of 25 mW and with a range of diffraction gratings with 600, 1200, 1800, and 2400 lines mm−1 available.
The incident beam perpendicular to the plane of the sample is focused through the microscope lens, which also collects the Raman scattered radiation in back-scattering geometry. A highly sensitive CCD camera was used to collect the Raman spectra.

4. Identification of LIB Components and Raw Materials Through Advanced Organic Petrography

4.1. Stereo Microscopic Analysis

Despite its simplicity, it is noteworthy that stereo microscopy allows the identification of components that are not easily identifiable through SEM-EDS or optical microscopes.
Figure 2 shows different materials identified in different size fractions of shredded EoL LIBs. These include copper and aluminum foils, chunks of anode and cathode, fragments of different metallic components, fibers, wires, and miscellaneous materials like translucent grains (Figure 2D).

4.2. SEM-EDS Analysis

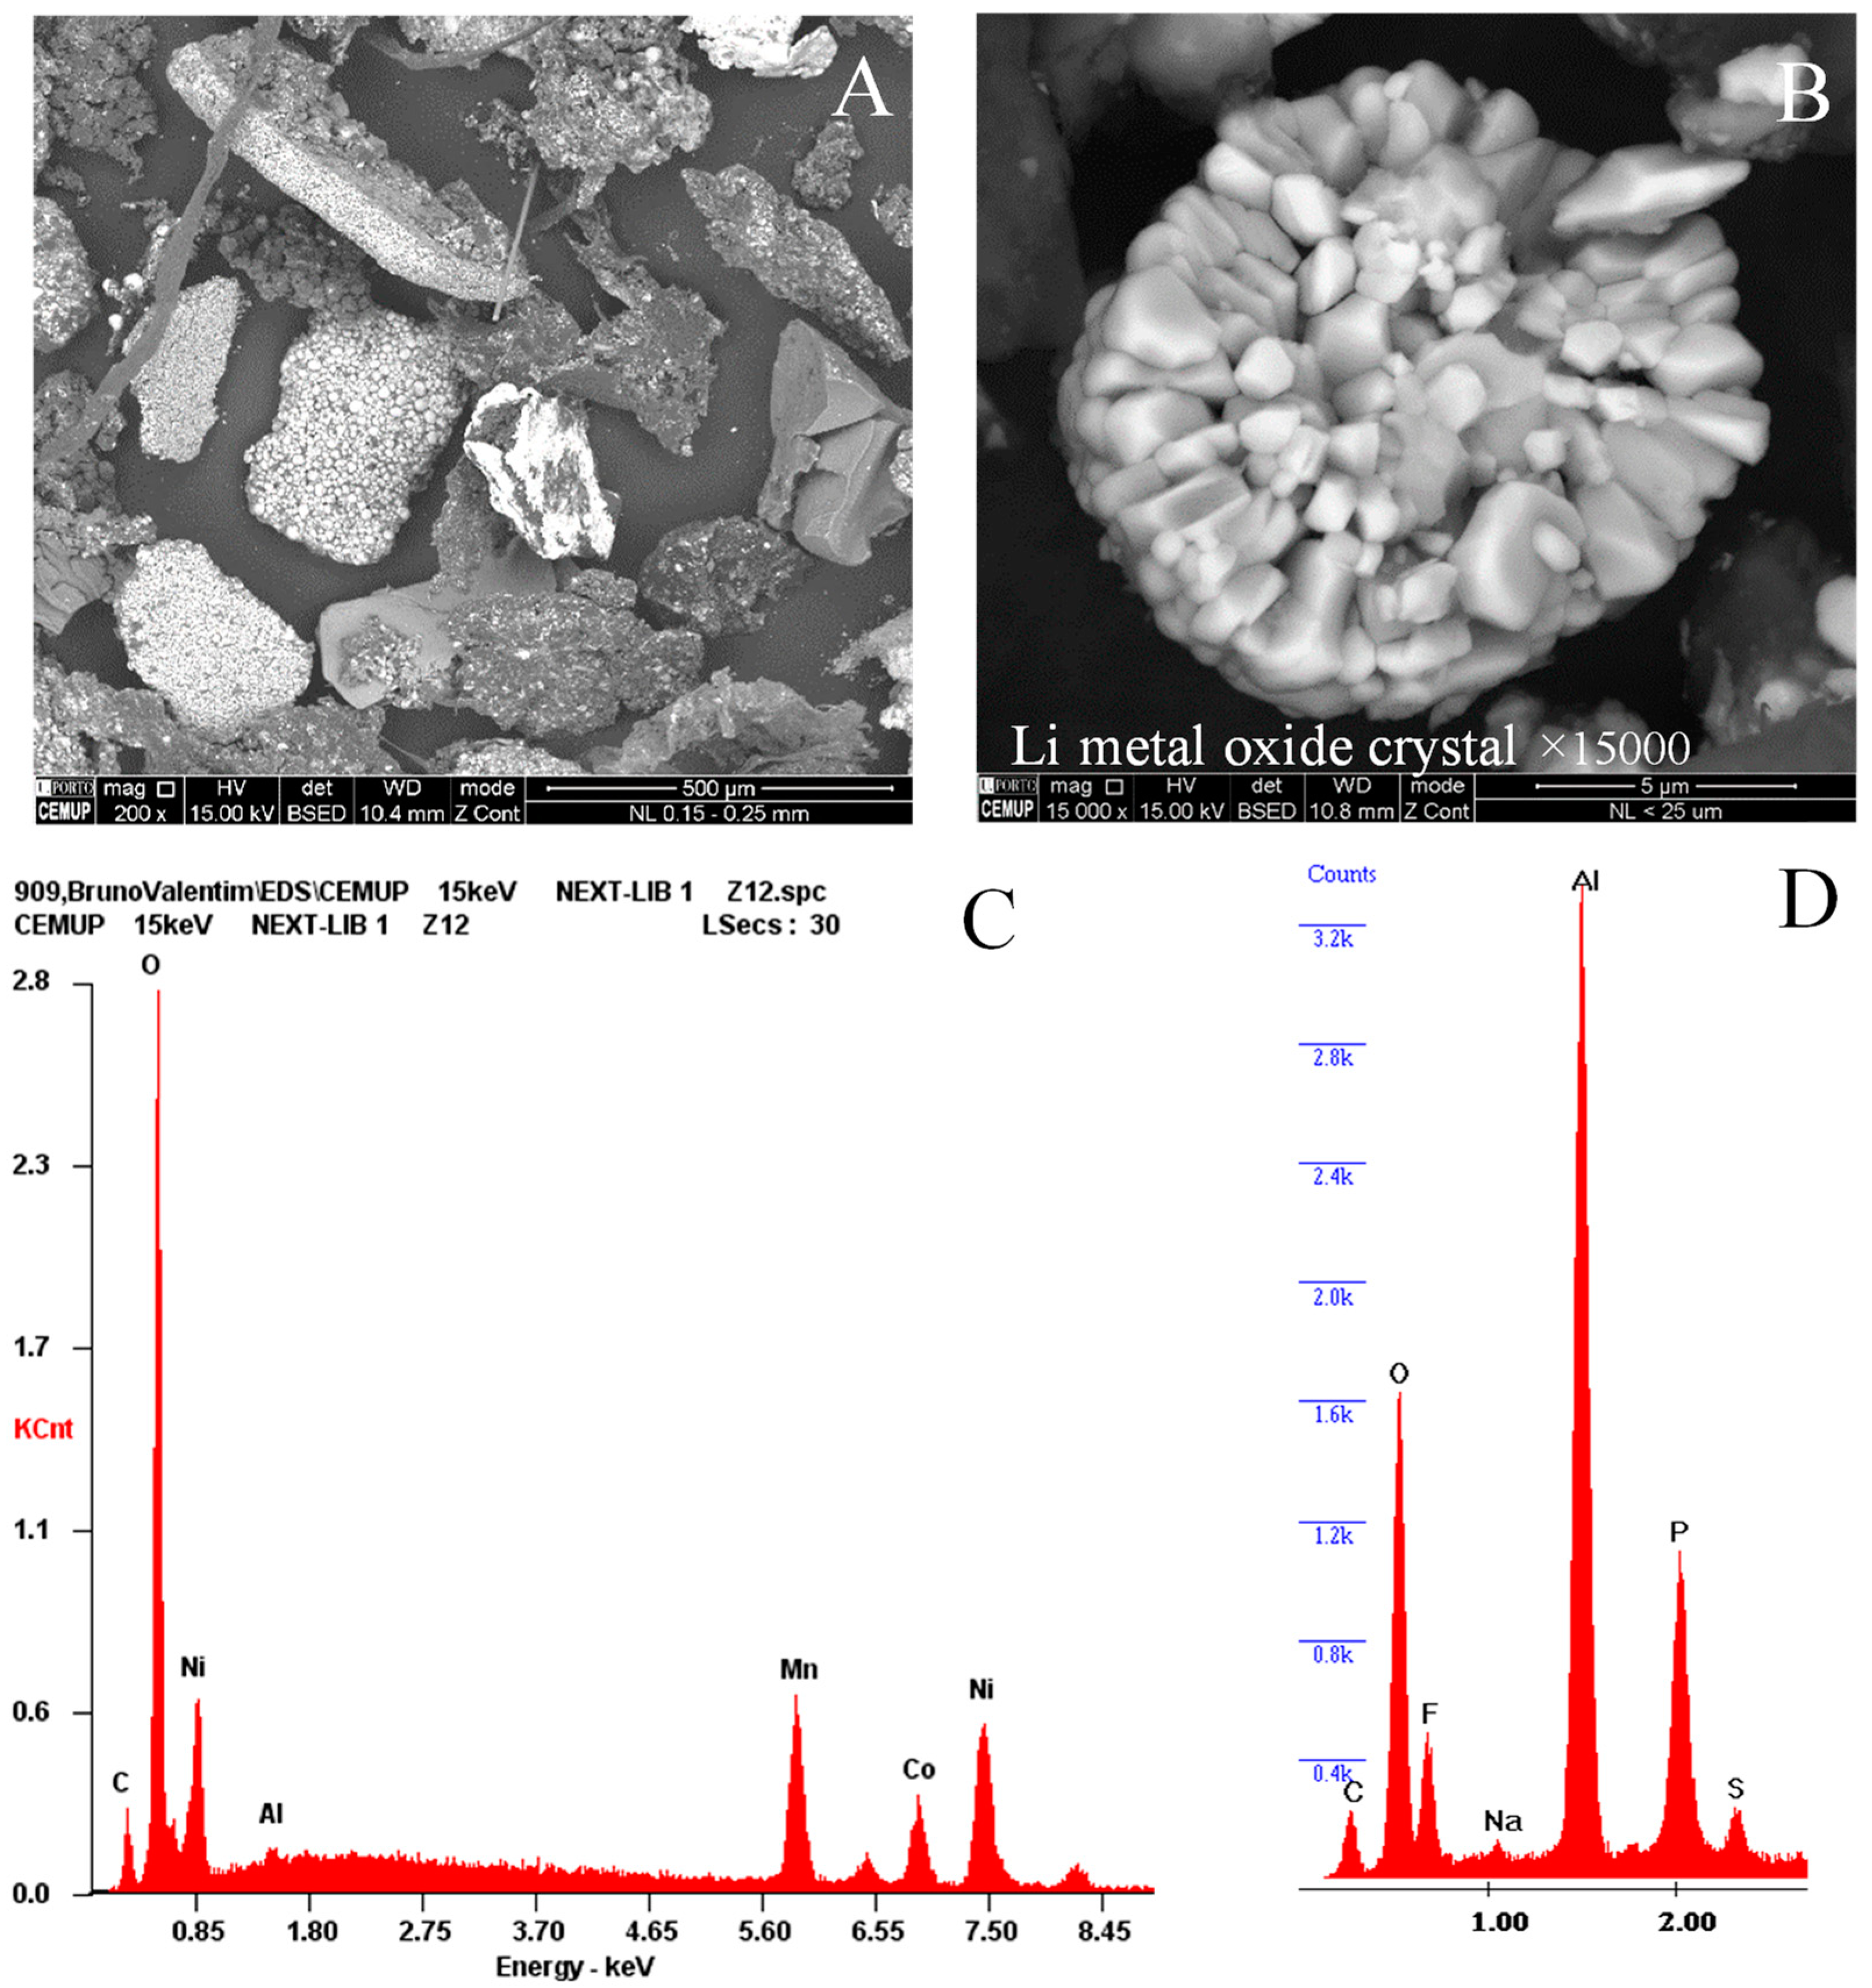
SEM-EDS allows us to identify the different materials in LIBs (Figure 3A–D) and helps to highlight transformations caused by thermal or hydrometallurgical processes.

4.2.1. Current Collectors: Al and Cu Foils

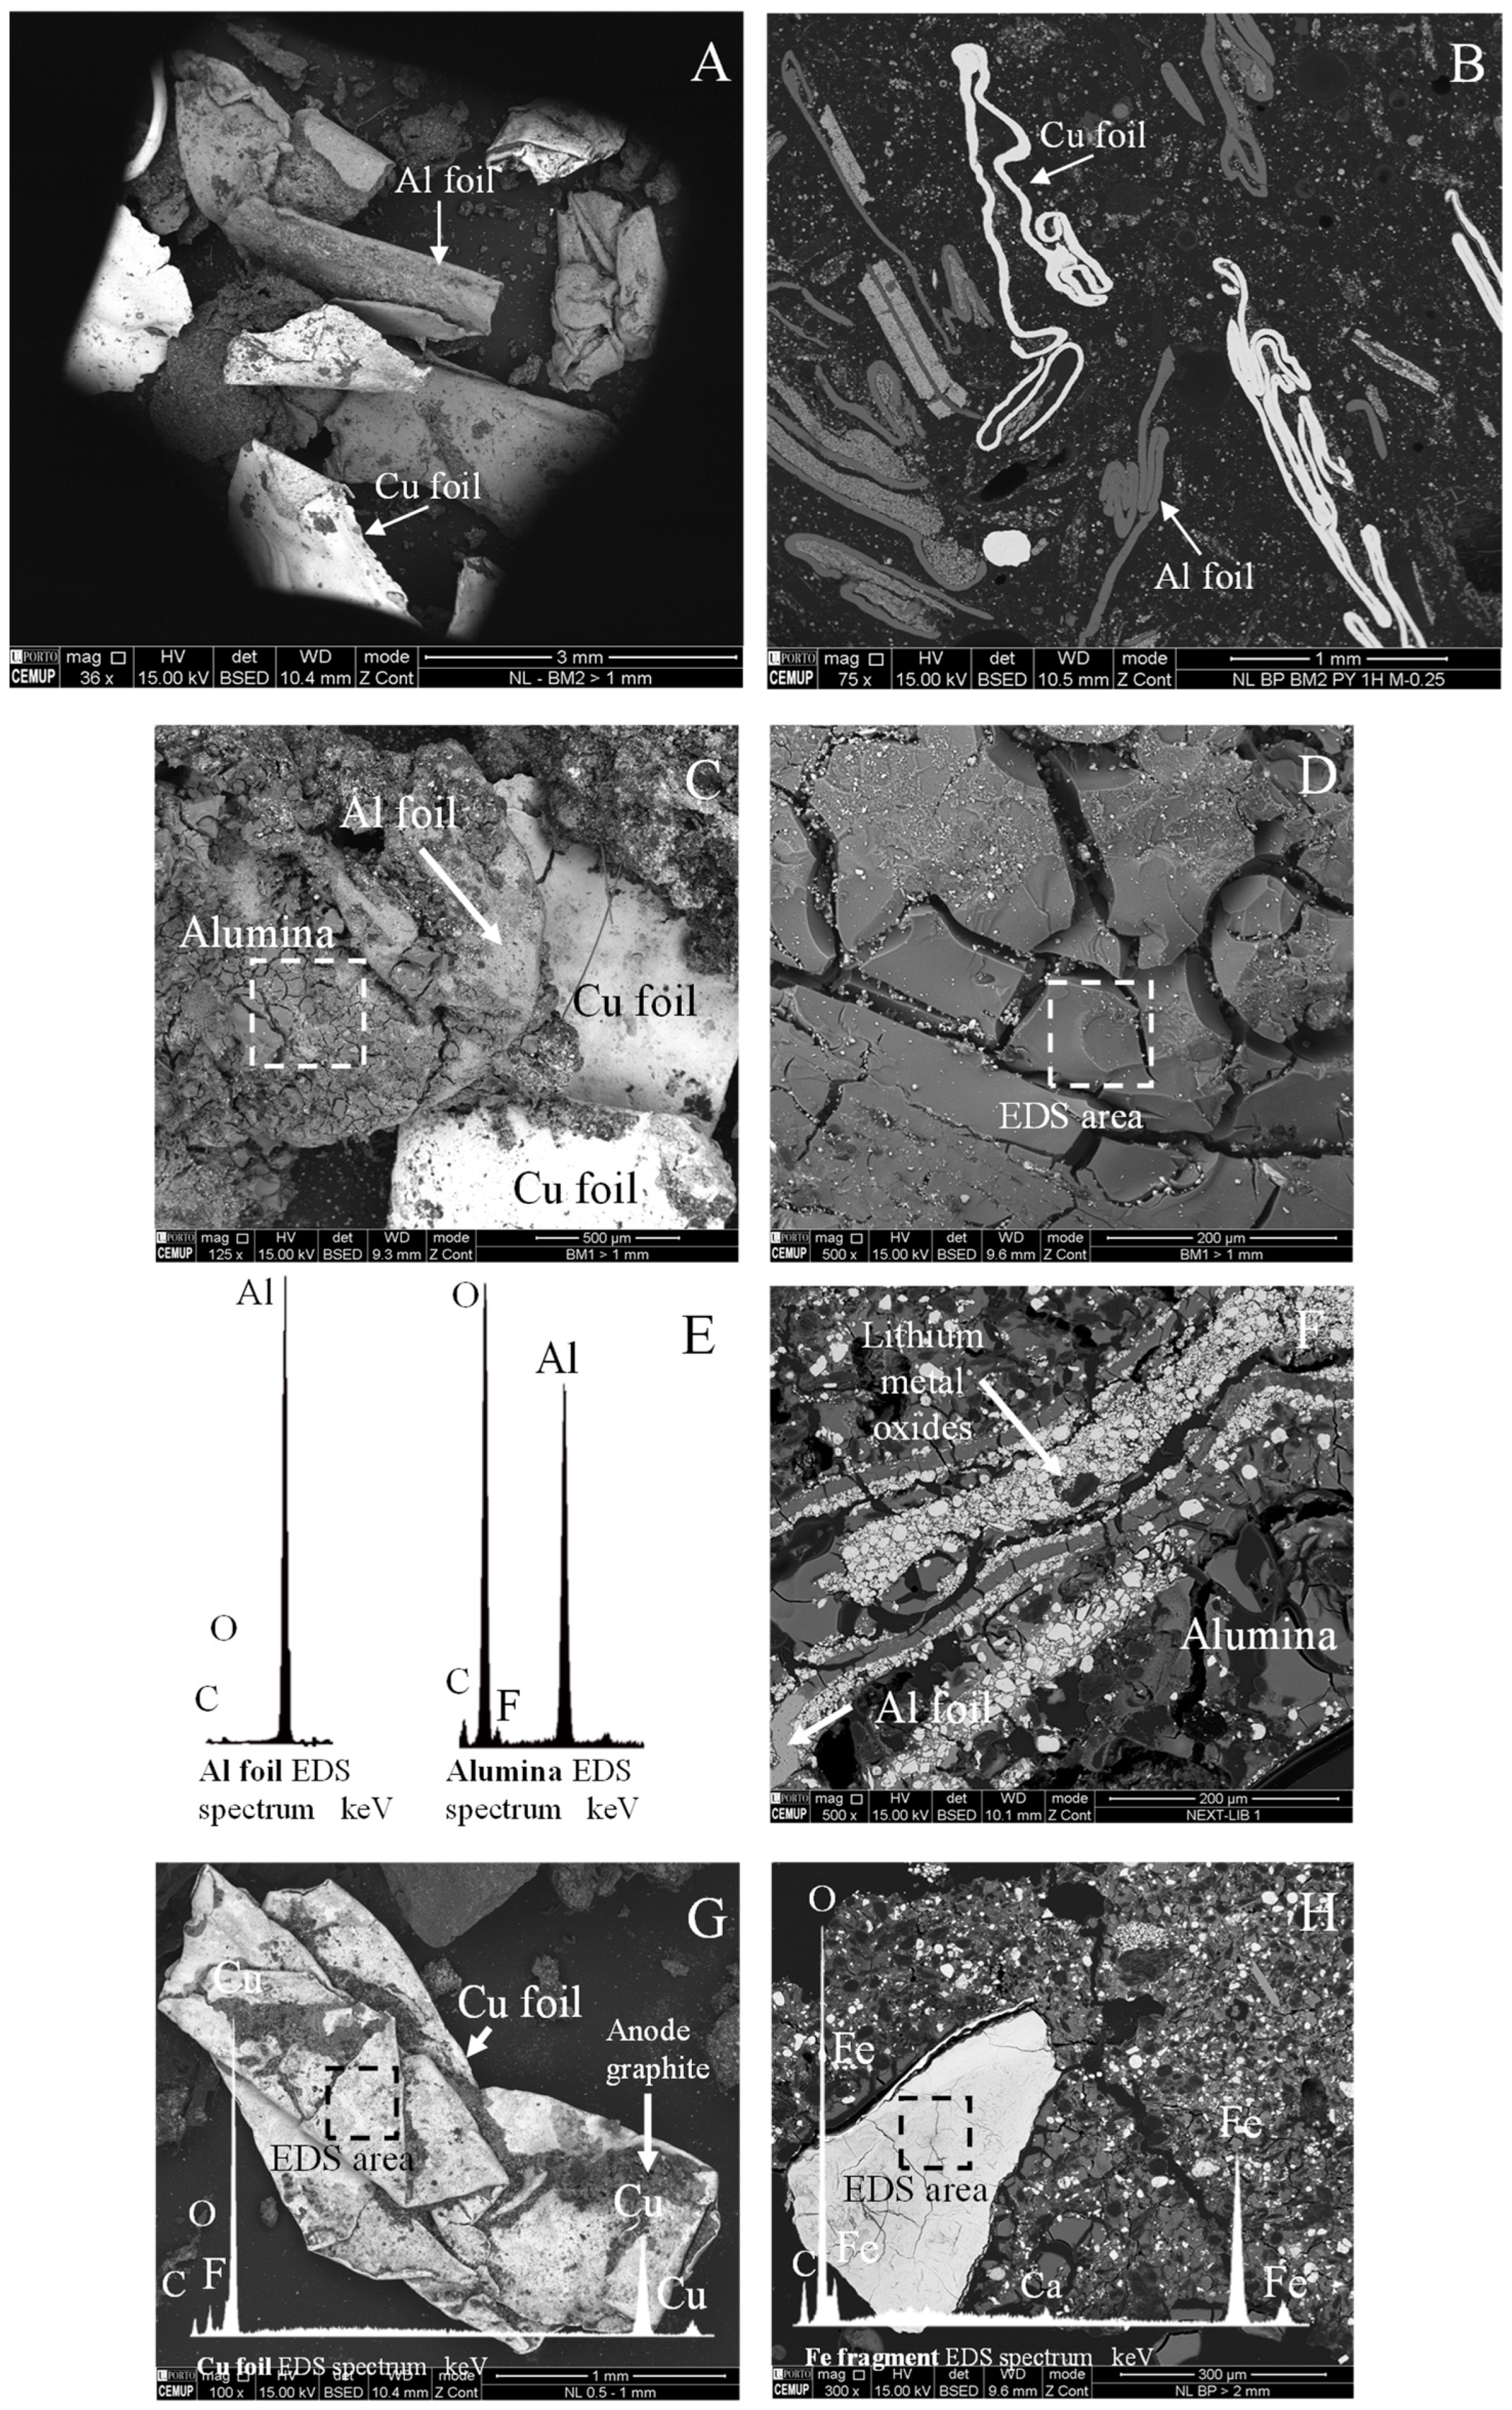
In the shredded LIB sample, the fragments of copper foils are white when compared with the gray aluminum foils. Both foil types are folded fragments, typically >2 mm, that appear as folded long lines with micrometric thickness in polished blocks.
Their EDS spectrum shows high peaks of Cu or Al. Still, it may also contain oxygen due to oxidation and residues of alumina and other peaks related to the binder and the active materials.
Alumina is typically cracked and was observed as layers between lithium metal oxides and Al foils (Figure 4A–G). As shown in stereo microscope images, the shredded LIB contains other metallic fragments, e.g., steel (Figure 4H).

4.2.2. Anode Graphite and Organic Polymers

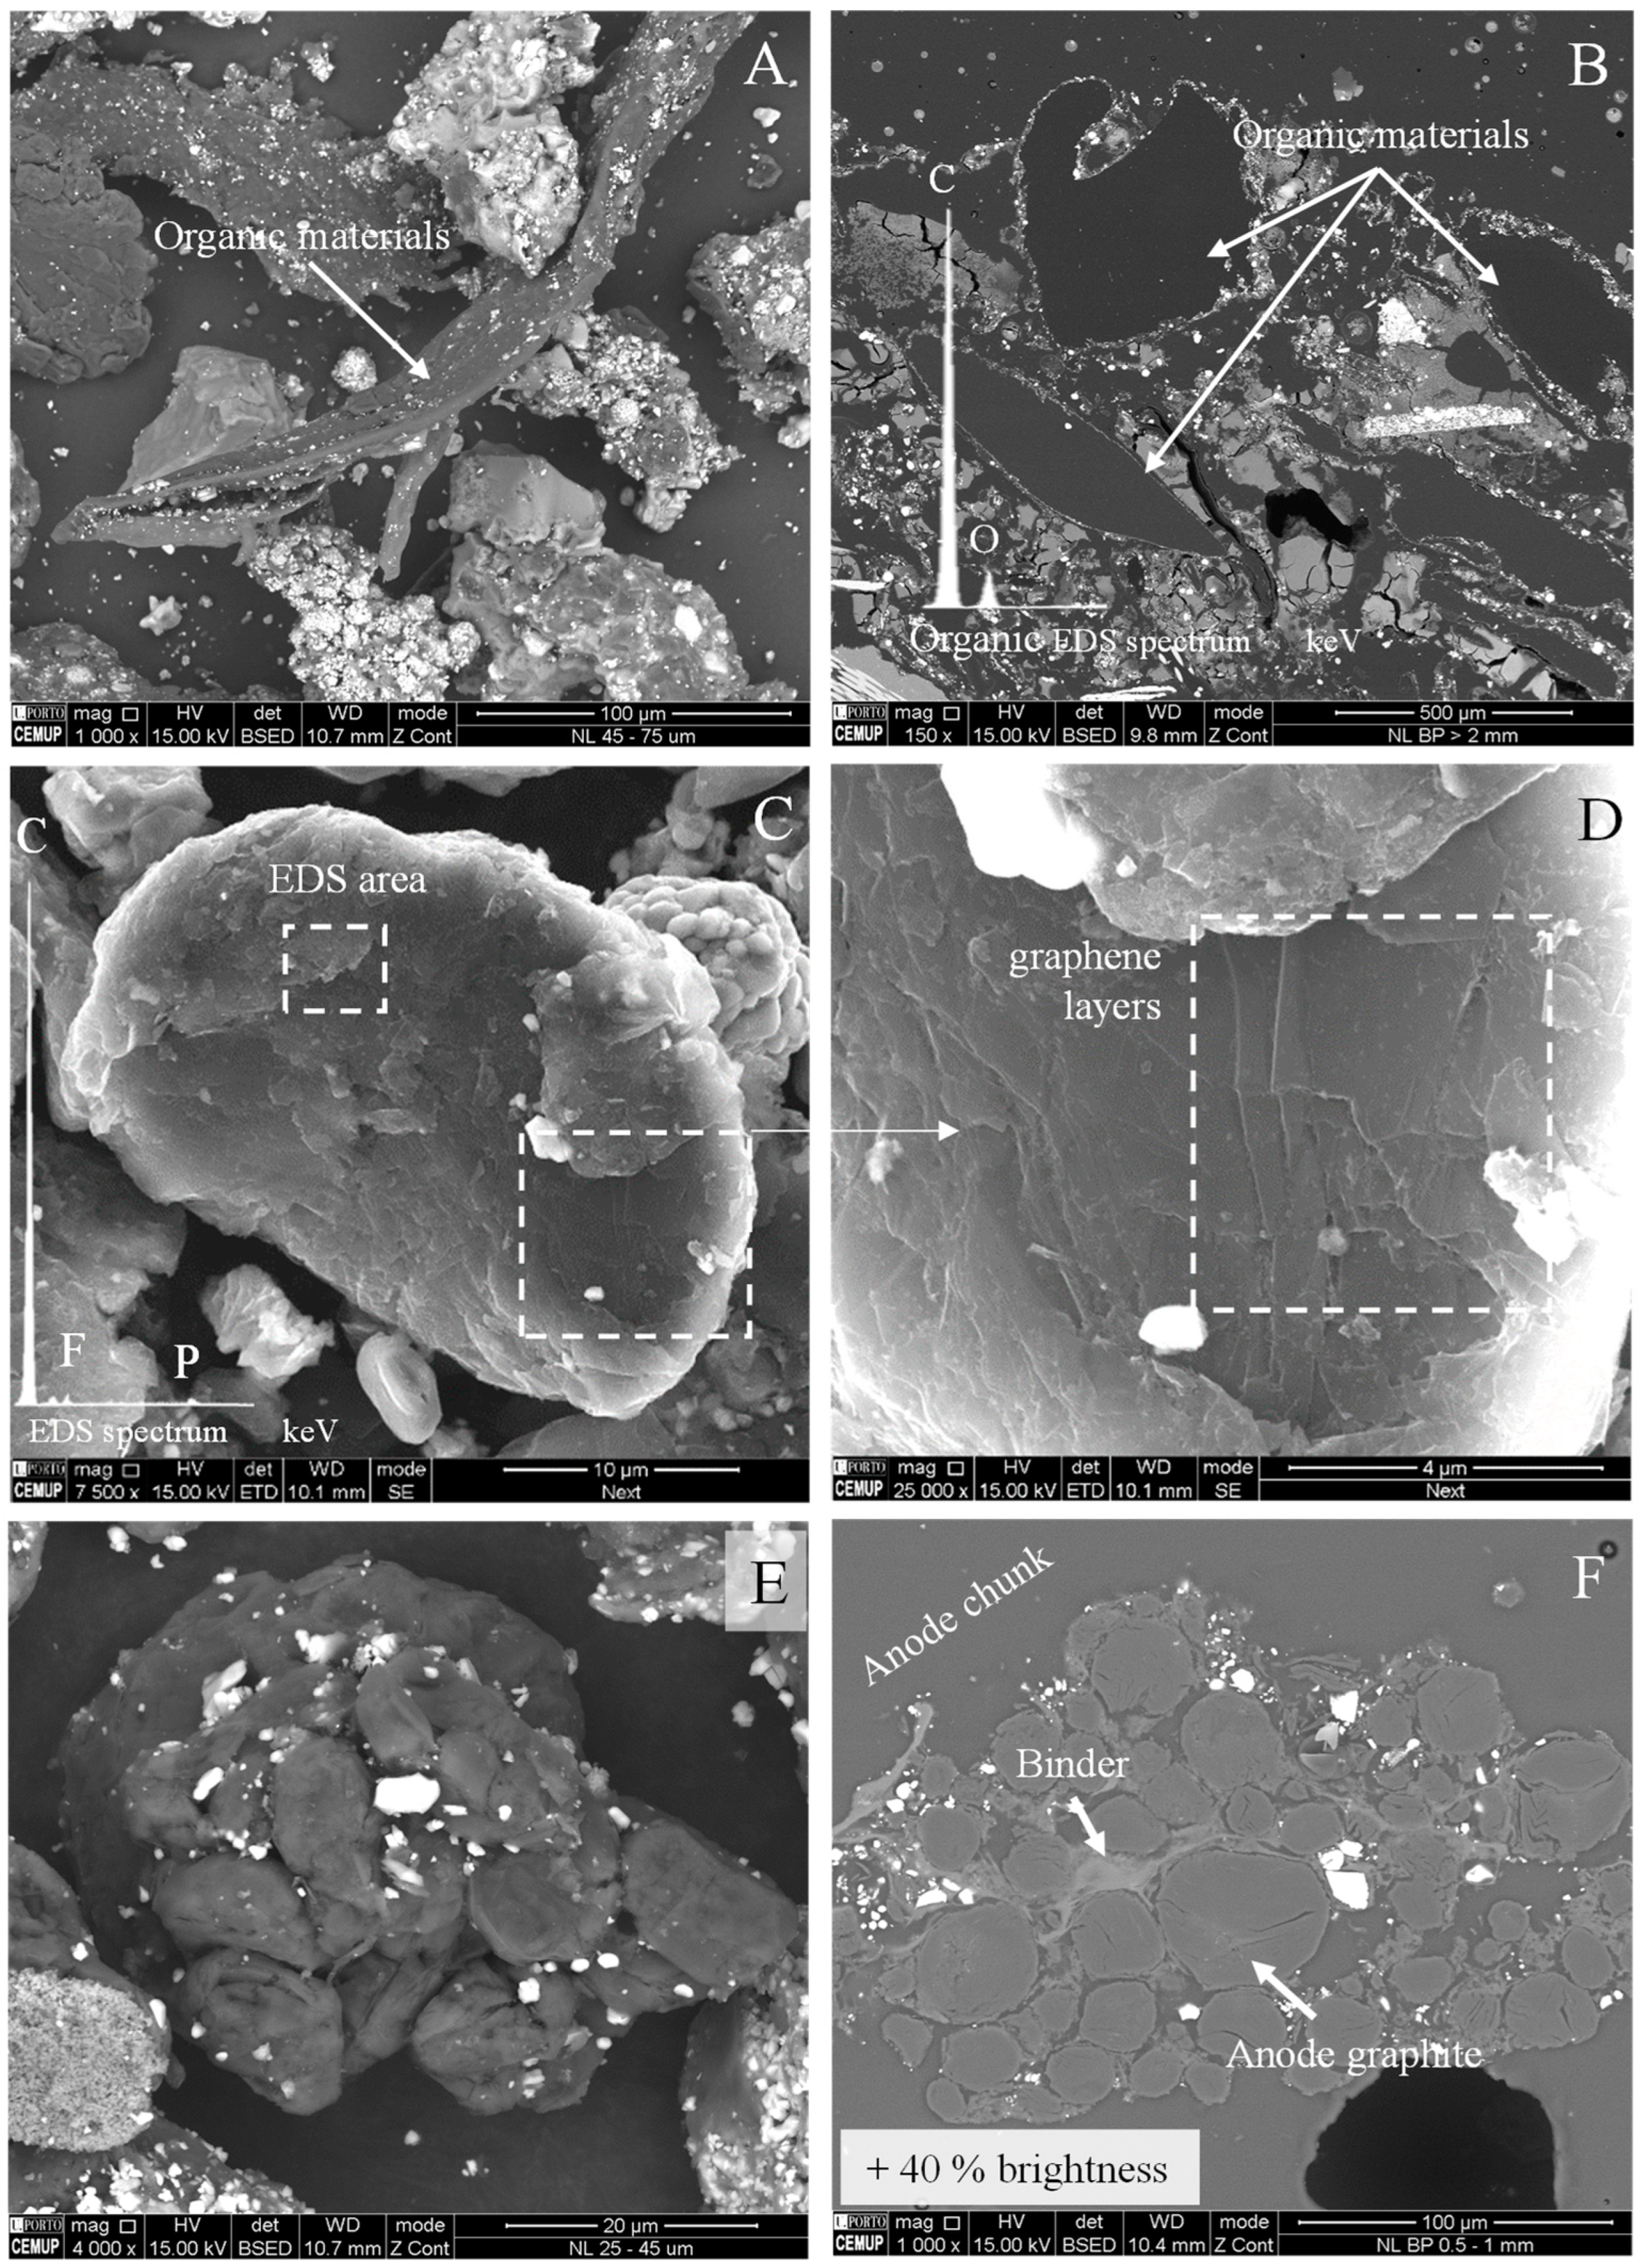
Through SEM BSE mode, carbonaceous materials are dark gray or even black since carbon is a low-density atom and will appear as dark as epoxy. This complicates their identification, especially in polished blocks.
One cannot be one hundred percent sure that a dark spherical or rounded grain with an EDS spectrum only with a C peak is anode graphite [58] since coal char, biochar, carbon black, and other rounded grains of carbonaceous materials also have similar characteristics (Figure 5A,B).
To improve their properties, the layered structure of natural flake graphite needs to be modified for application in advanced LIBs. One of the modifications includes the mechanical rolling/spheroidization of the flakes to spherical particles so that an isotropic property is expected and the intercalation rate of Li-ions is improved.
Graphite particles of different morphologies (beads, fibers, flakes, “potatoes”) may be used as anode material in Li-ion batteries. After spheroidization, anode graphite particles, ranging in size between 8 and 30 µm, should have a spherical shape, like a “potato”, but “pancake” shapes are common [59,60].
The surface topography of the anode graphite particles is also influenced by the original material: a smooth surface formed by graphene layers and basal planes in the case of flake graphite or an irregular surface due to the agglomeration of hexagonal microcrystals (stacks of prismatic planes) in the case of synthetic graphite [59,60,61,62].
In Figure 5C–F, one may observe pancake-shaped particles of anode graphite of approximately 20–40 µm that are either loose or still packed in anode graphite chunks. Ideally, its EDS spectrum only has one carbon peak [58], but shorter peaks of F and P (and others) may also be present due to the covering by the PVDF binder and SEI (Figure 5C, EDS spectrum).
The secondary electron detection mode and high magnifications allow us to make a topographic surface analysis and observation of graphene layers and flake-like particle morphology (basal planes and edge planes surfaces, the latter of which are also referred to as prismatic planes), ascertaining whether it is graphite (Figure 5C,D).
Despite being as dark as epoxy, a way to identify graphite in polished blocks through BSE mode is to increase the brightness of the computer screen (Figure 5F).

4.2.3. Lithium Metal Oxides

LIBs may have cathodes made of one lithium metal oxide species or a combination of crystal species and different cathodes [22]. Herein are examples of lithium metal oxides obtained under the scope of the ERA-MIN NEXT-LIB project that comprised samples of shredded LCO-rich and NMC-rich batteries.
After shredding, the black mass mainly comprises chunks and discrete particles of anode and cathode materials and other fragments.
Under SEM BSE mode, the cathode chunks are bright due to the high density of the elements, such as Ni and Co, which compose the crystals of lithium metal oxide. PVDF widely binds these crystals, and the chunks have a granular texture (Figure 6A,B).
X-ray microanalysis does not detect lithium, but its presence is inferred from its association with other typical elements forming the lithium metal oxides.
Lithium metal oxide crystals have characteristic shapes, structures, and chemical compositions. The LCO crystals are angular and have a lamellar structure, and the EDS spectrum only has Co peaks (Figure 6C,D).
NMC, LMO, and NCA crystals have a framboidal arrangement, a diameter of approximately 5 µm, and are composed of submicrometric crystals (Figure 6E,F). These framboids are not distinguishable unless the EDS analysis is made (Figure 6E–H shows examples of these crystal spectra). As will be shown further, at least two types of framboids may be immediately identified and quantified through optical microscopy.

4.2.4. Others

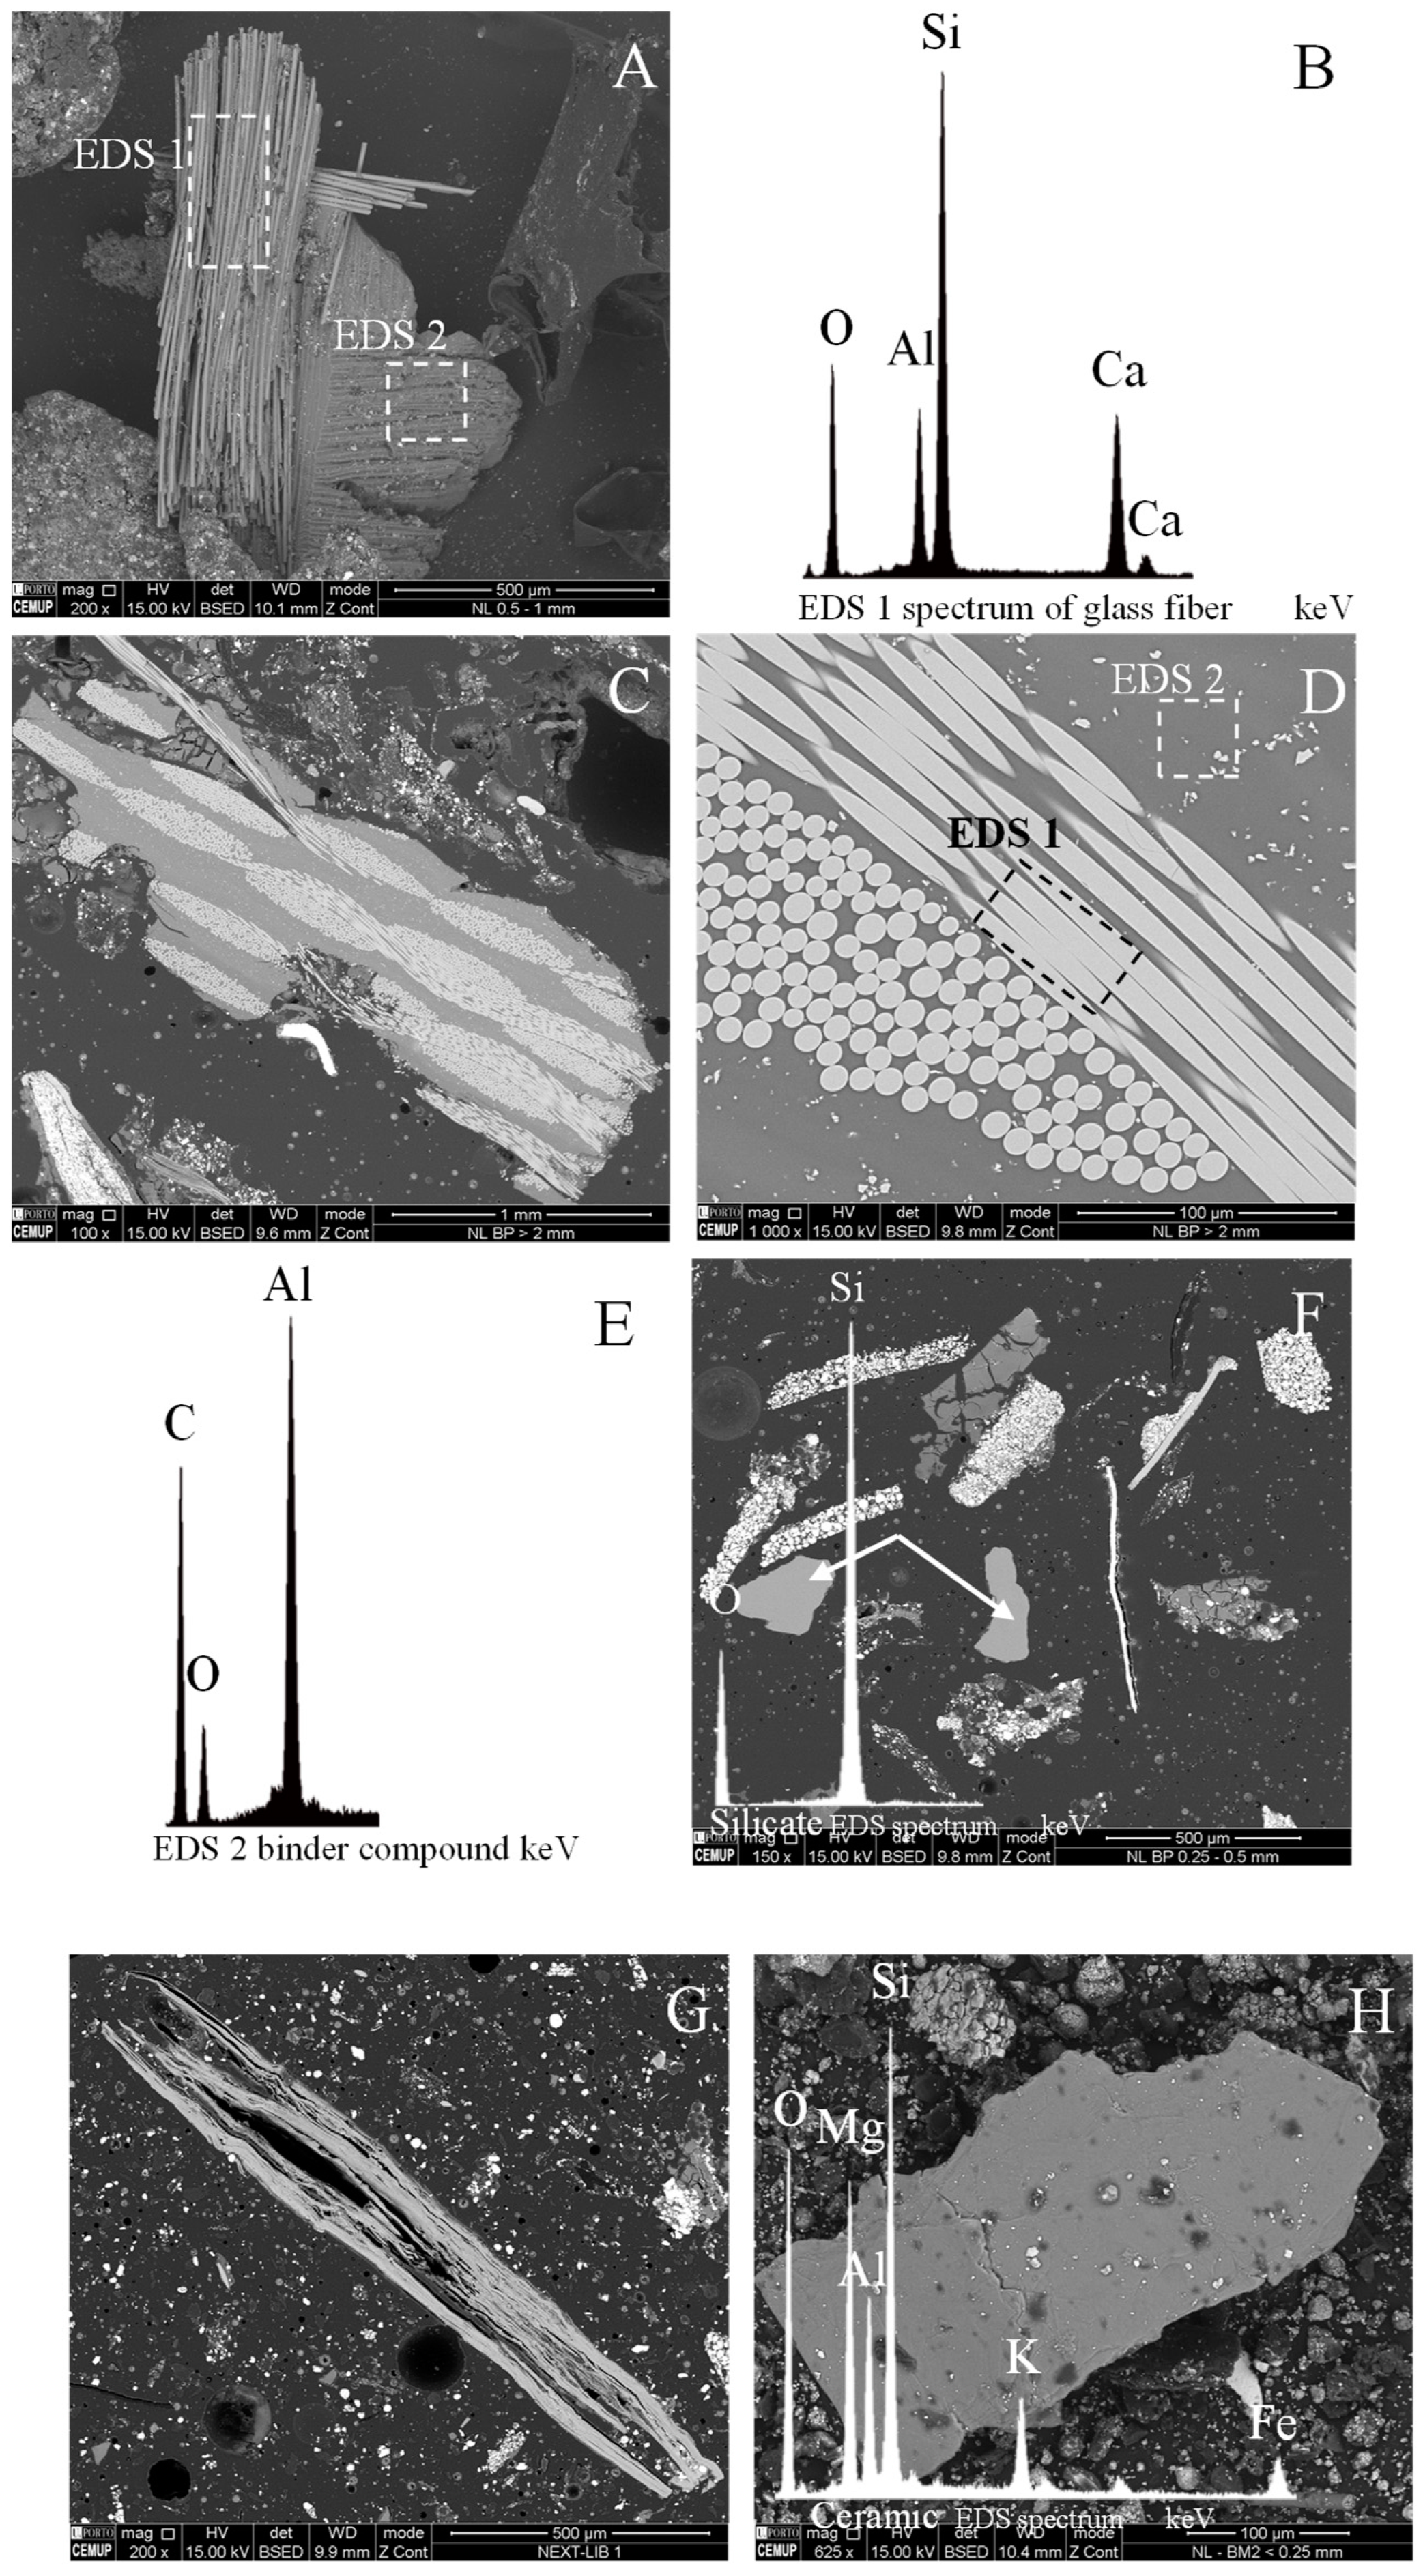
Glass fiber mats have characteristic mesh aspects in as-received or polished block samples. These mats are formed by fibers several millimeters in length and with diameters of approximately 10 µm, forming bundles, each comprising hundreds of fibers (Figure 7A). When these mats break apart, single “needles” of different lengths detach.
The spectra of these mats have a major silica peak since SiO2 is widely used for glass fibers (Figure 7A,E). This material is insoluble in most acids and becomes an impurity in hydrometallurgical recycling [45].
Other inorganic materials often observed include silicate fragments and ceramic plates (Figure 7F and Figure 7G,H, respectively).

4.3. Analysis Through Incident Light Optical Microscopy with Oil Immersion Objectives

Most of the EoL LIB materials, e.g., graphite, lithium metal oxide crystals, metals, etc., may be characterized through ILM methods used in the petrographic characterization of coals.
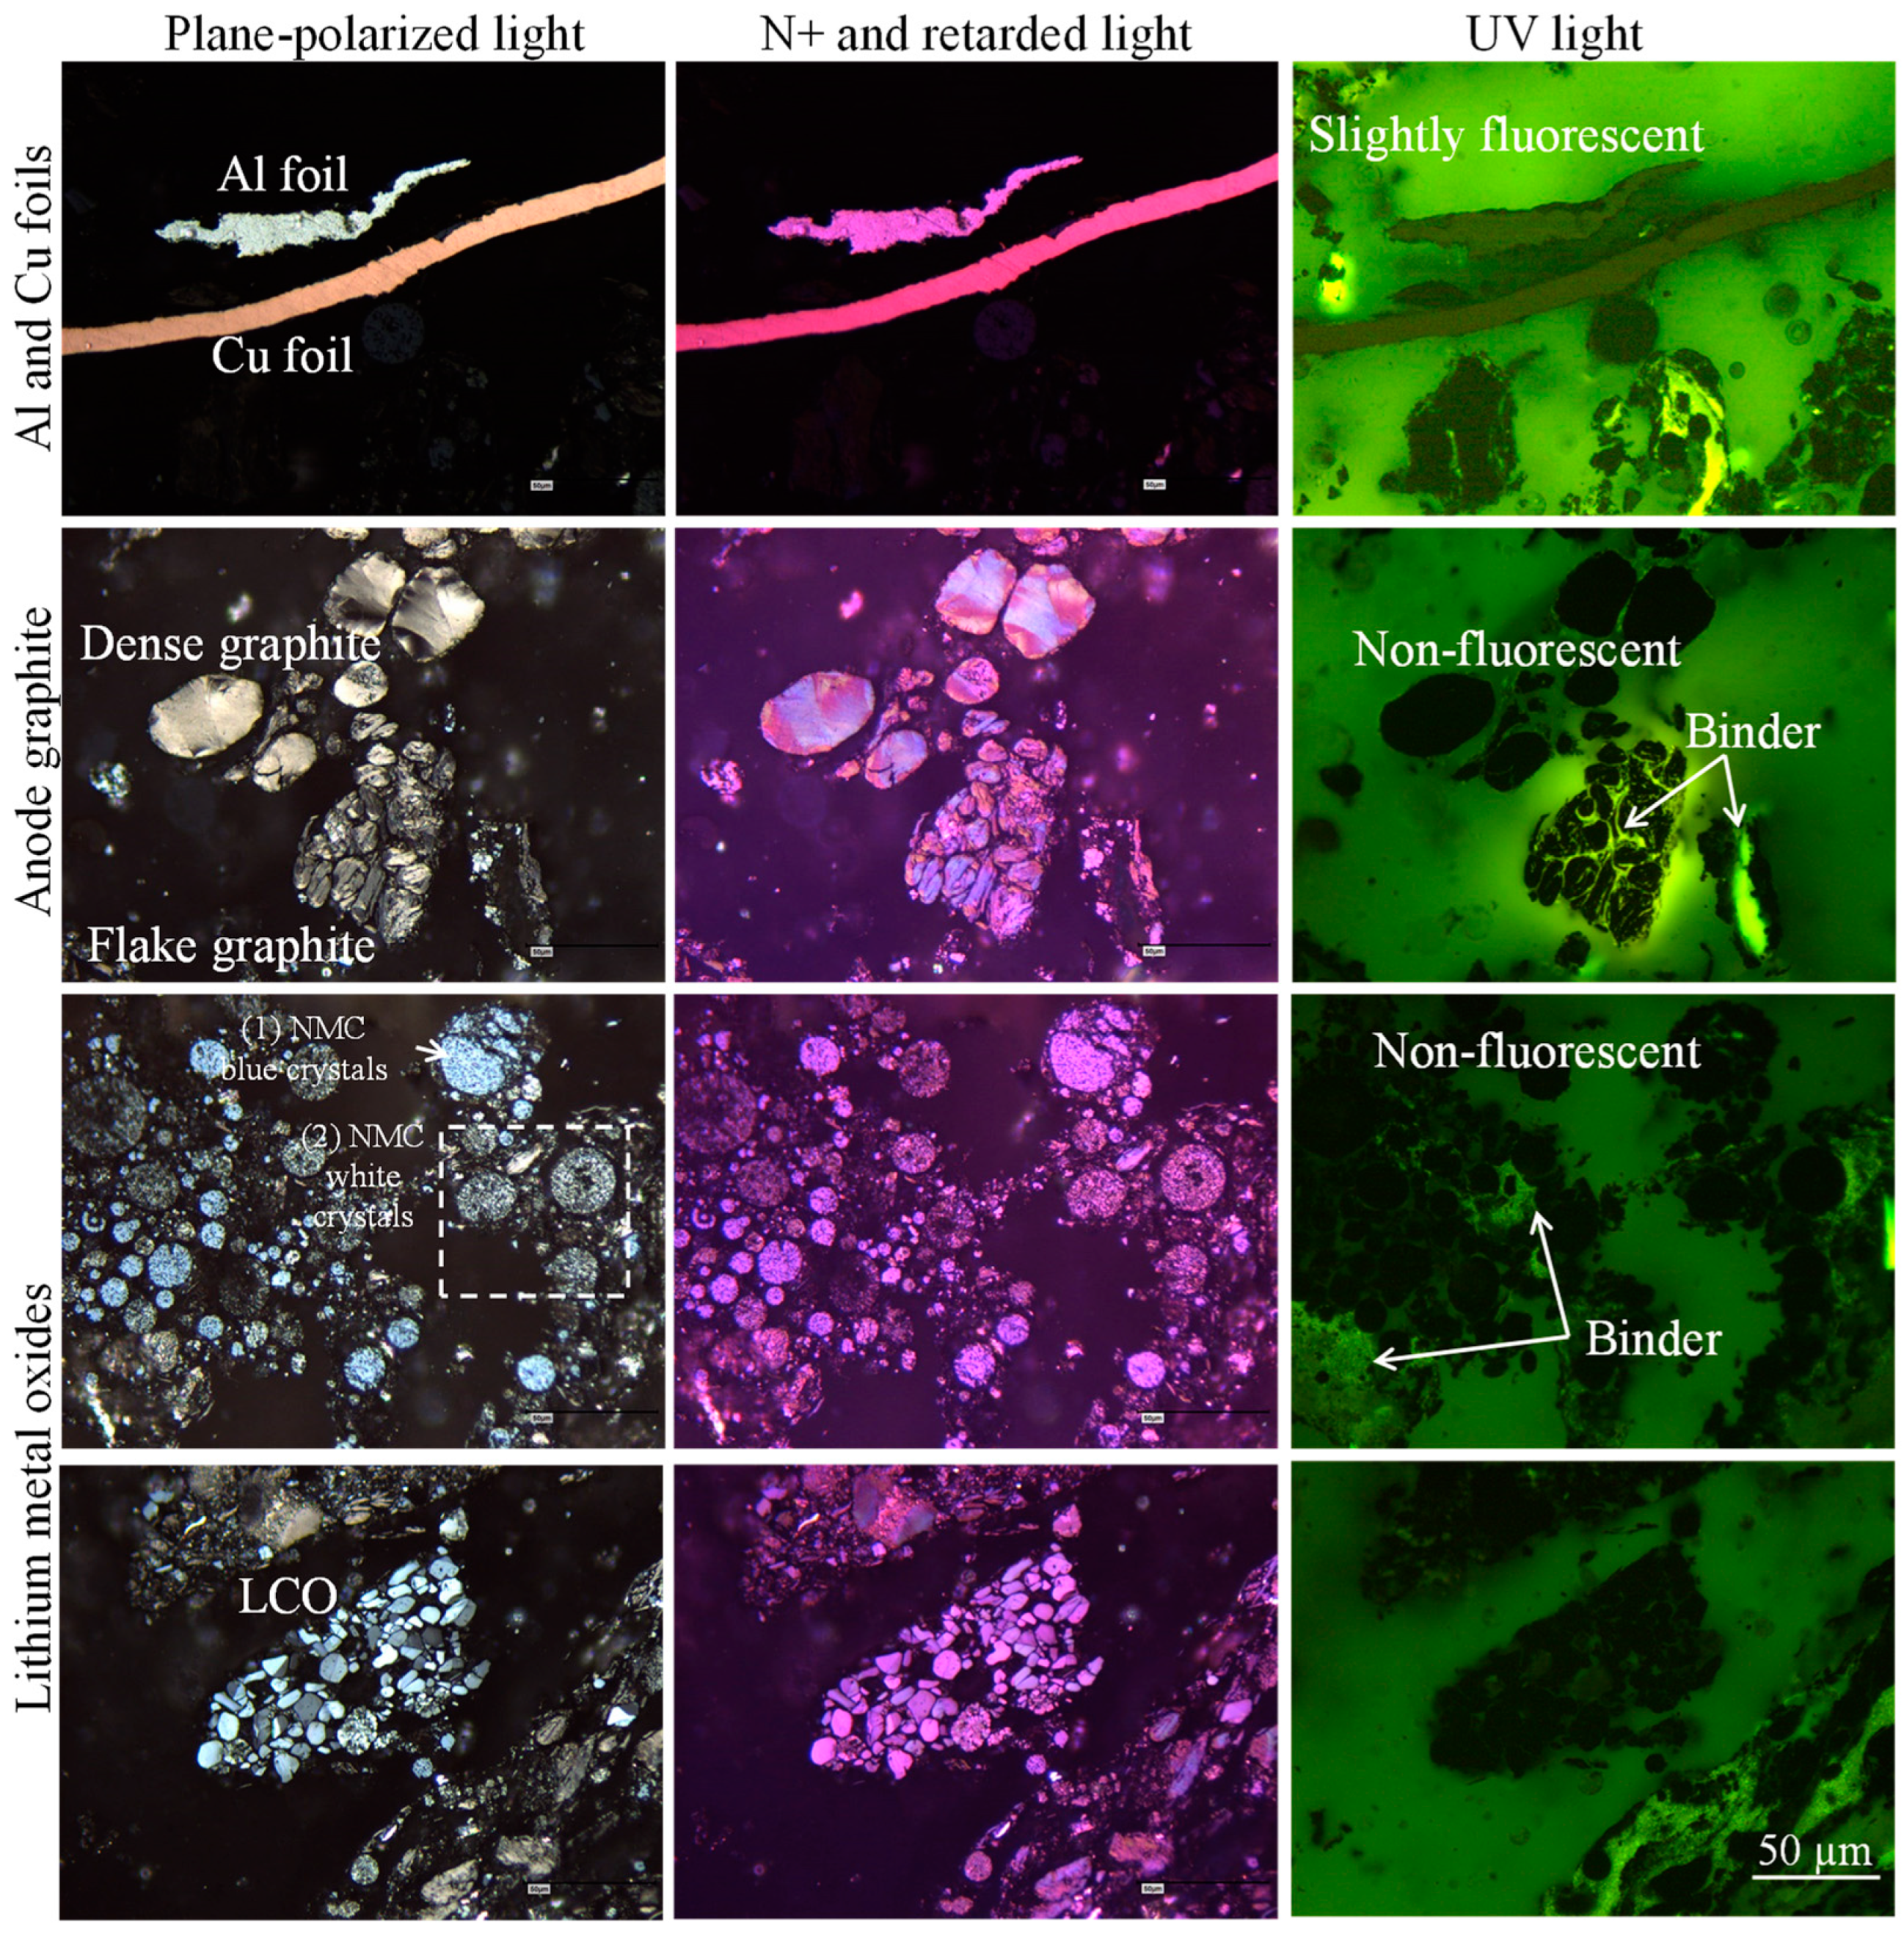
The analysis is made under white or UV light, using oil immersion objectives, light polarizers, and a retarded light plate to enhance the differences between the components. Figure 8 summarizes the petrographic characteristics of the electrode materials, including the binder.

4.3.1. Electrode: Al Foils, Cu Foils, and Alumina

Electrode chunks are typical components of the shredded EoL LIB material. The current collectors are strongly folded and may contain residues of the active materials.
Under incident white light microscopy, Cu and Al foils show a very high reflectance compared with the anode graphite and the lithium metal oxides, and the light intensity should be decreased to distinguish them. Then, the Cu foils will appear to be pinkish, while the Al foils will be gray.
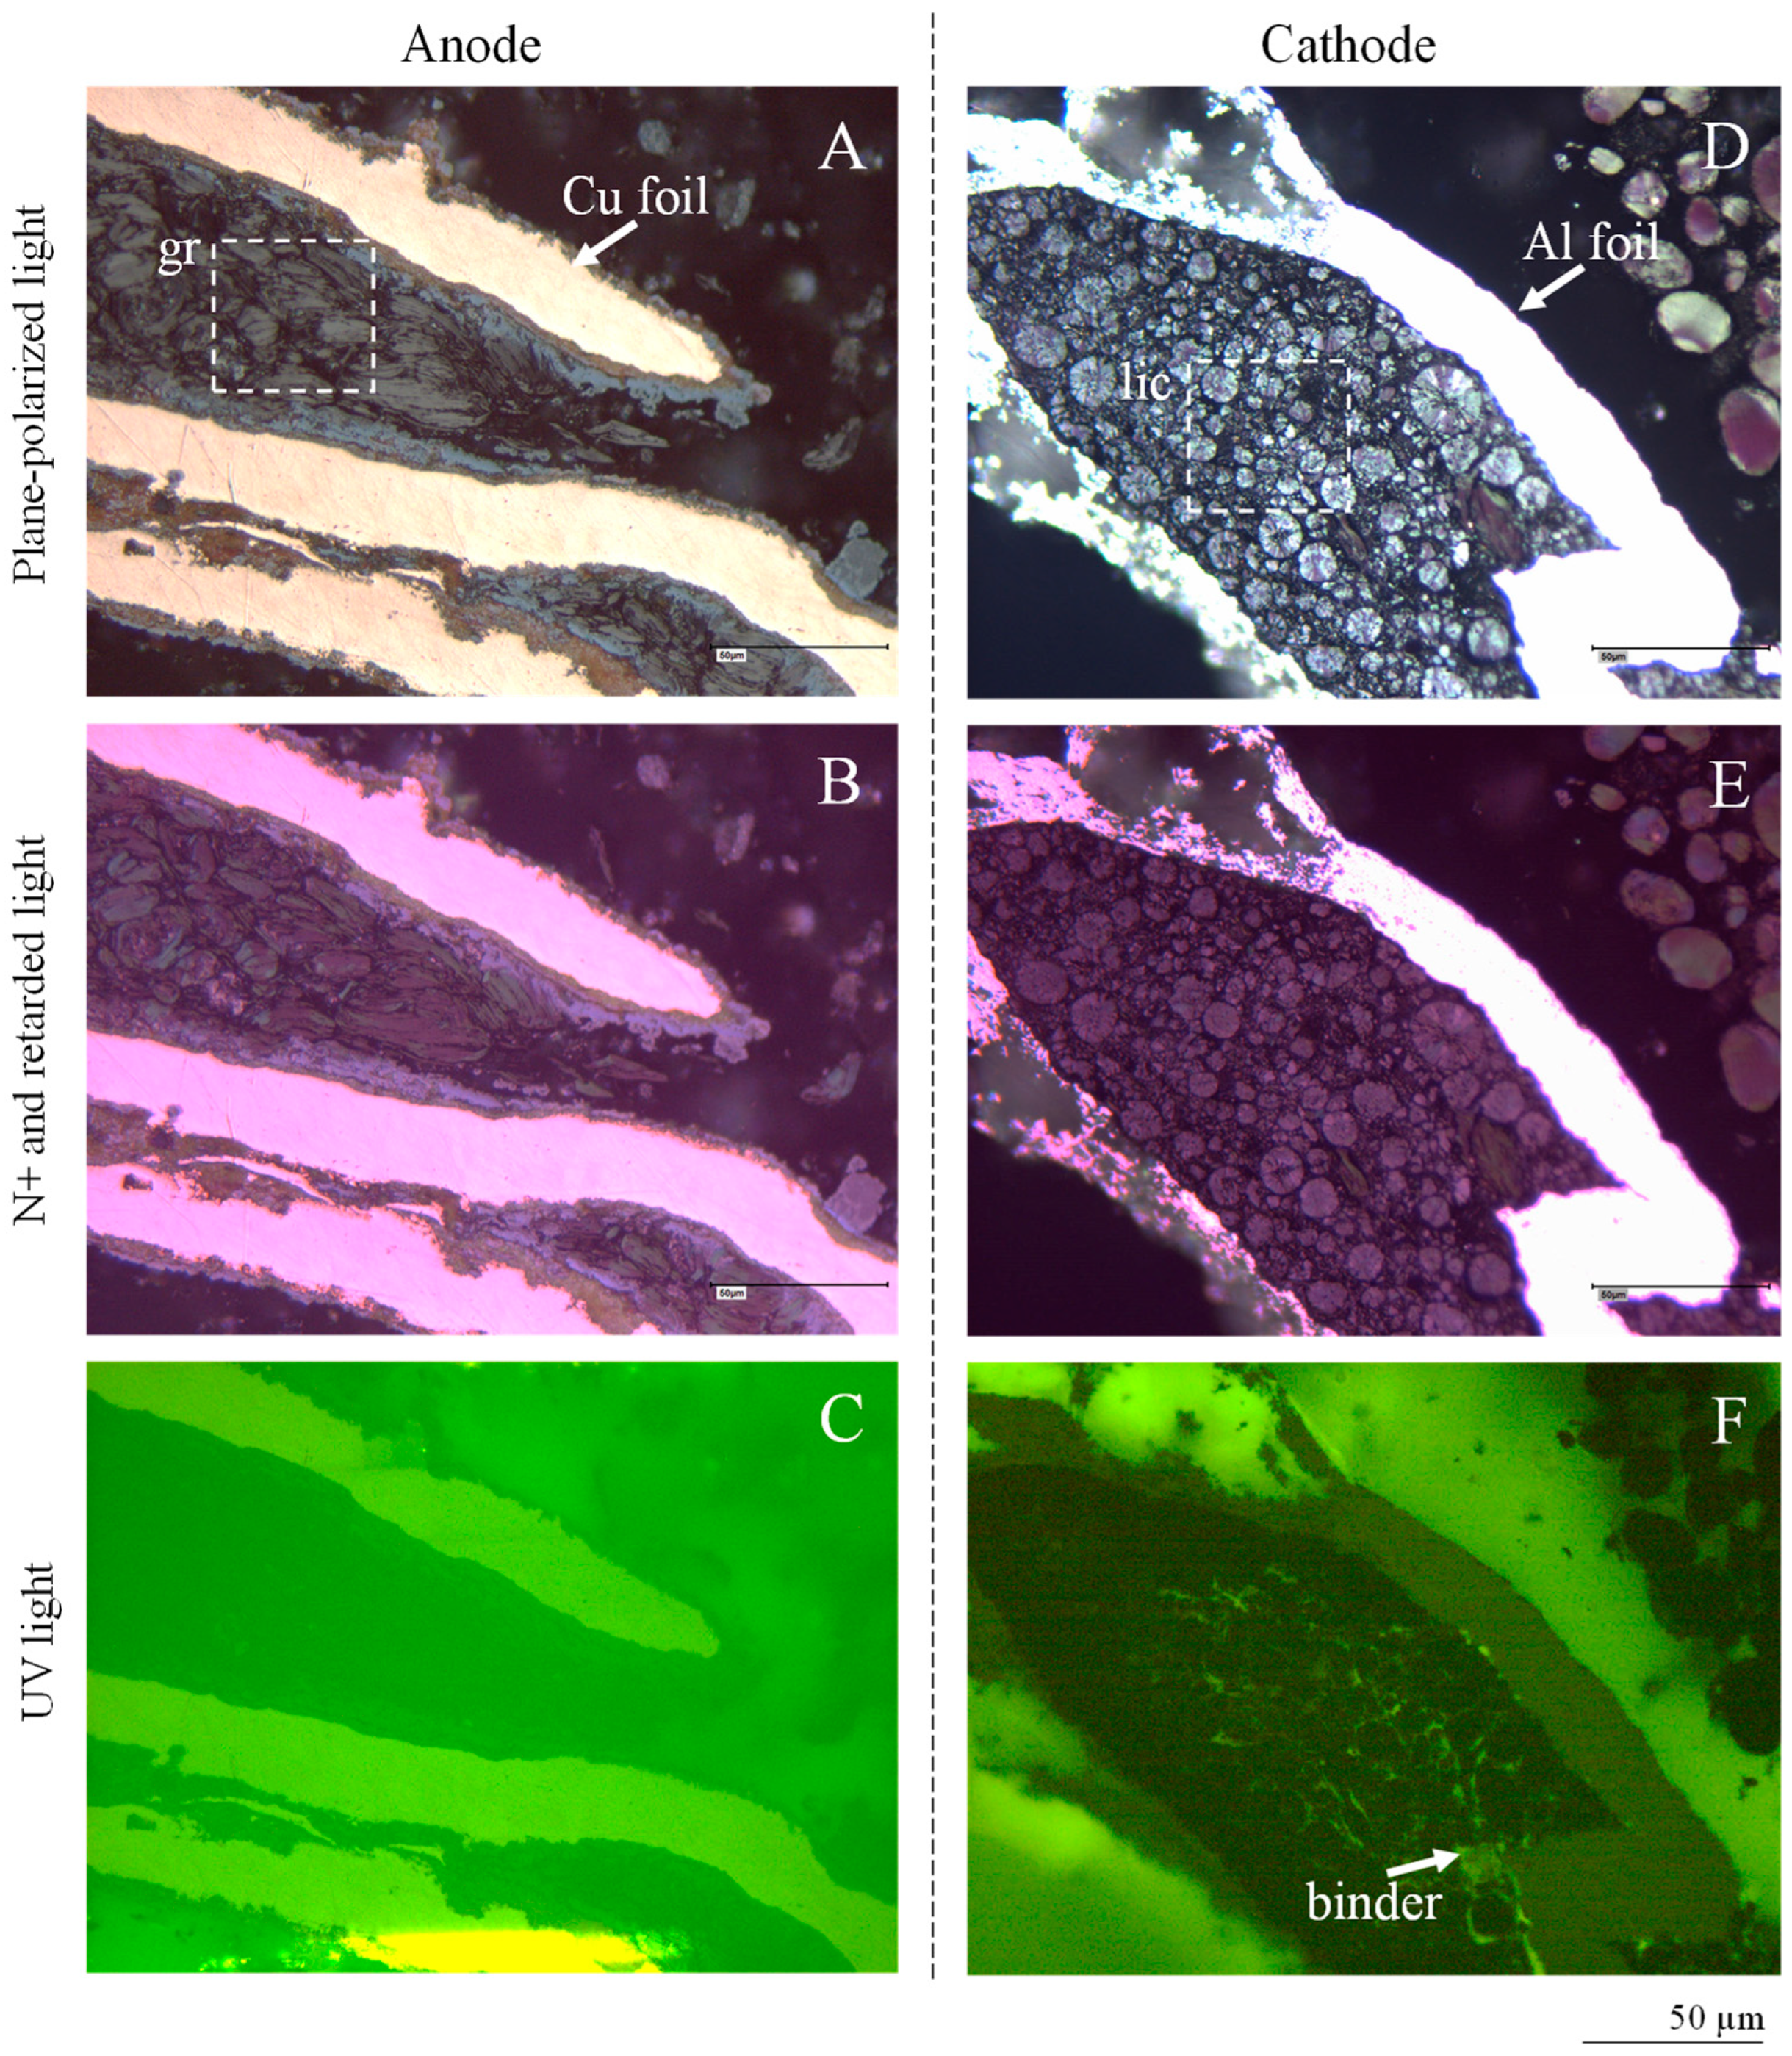
Under polarized and retarded light, Cu foils are pink-red, and Al foils are purple. These materials are slightly fluorescent, and it may be necessary to increase the screen light intensity to observe that the Cu and Al foils are pale green and dark green, respectively (Figure 9).
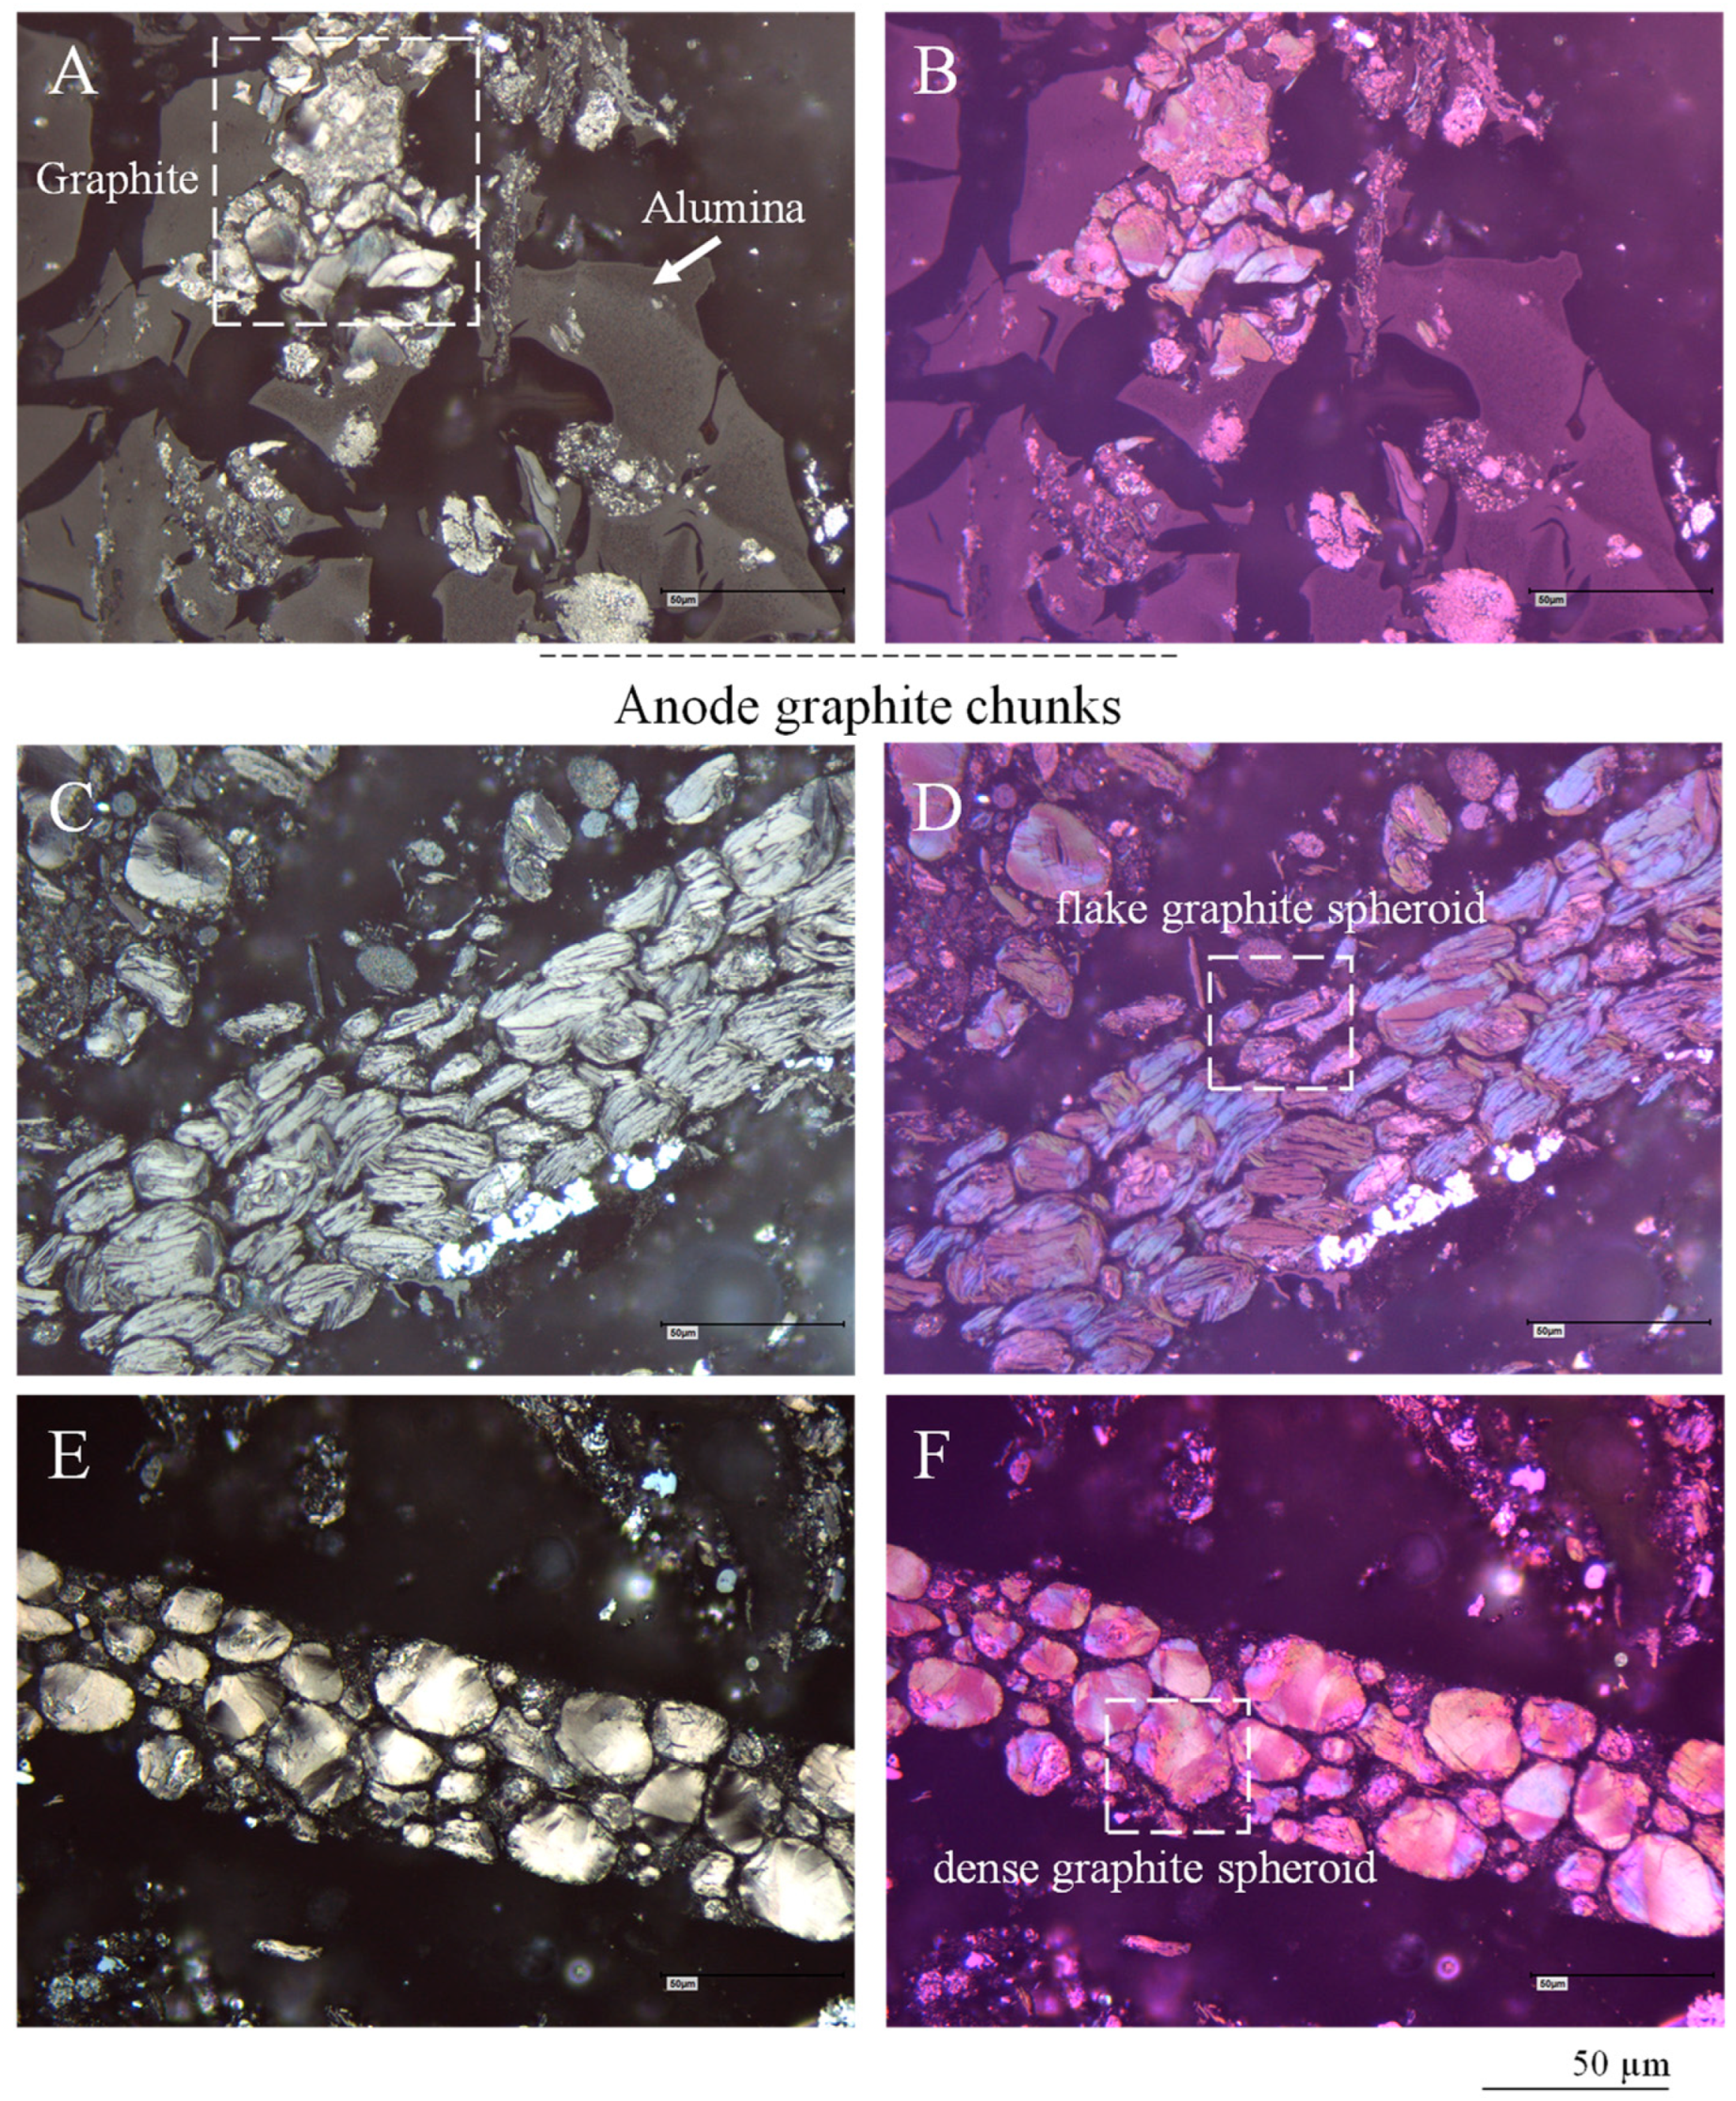
As seen in SEM-EDS analysis (Figure 4C,D), alumina is often observed embedding electrode active materials and is usually cracked. In incident light microscopy, alumina is a dense dark gray material (darker than graphite) with fissures, a distinctive feature. Alumina is also non-fluorescent (Figure 10A,B).

4.3.2. Anode Graphite

After the shredding of EoL LIBs, anode graphite may be observed in different associations:
  • Detached as discrete particles of graphite;
  • As anode graphite chunks comprising dozen to hundred particles;
  • As residues in the Cu foil surfaces;
  • As layer fragments trapped inside Cu folds;
  • As complex chunks of anode graphite and lithium metal oxides bound together by alumina (Figure 10A–F).
The differentiation between graphite types is mainly based on XRD analysis, which may also be complemented by transmitted electron microscopy (TEM). However, XRD data yield an average value, while TEM may only provide a punctual examination of particles [63].
As previously mentioned, the observation of graphene layers through SEM-EDS secondary electrons mode confirms the graphitic nature of the materials. Still, the quantification of graphite is not possible using this technique.
In brief, the diagnostic properties of natural graphite under ILM are the following: its color is brownish gray to grayish black, it has a very strong bireflectance and anisotropy, it has yellow to brown and violet gray anisotropy colors, and it is not fluorescent under UV light. The reflectance is very weak compared with most metallic ores. It occurs as small plates, laths, and bundles of blades, basal cleavage is visible, and undulose extinction is common [41,63,64].
Through ILM, the anode graphite’s surface appearance (optical texture) is characteristic and very different from almost all LIB materials. Nevertheless, “crossed polars” and retarded light will help distinguish graphite from other carbon-rich materials and distinguish different types of graphite. Afterward, anode graphite may be quantified using the point counting method.
Anode graphite is a spheroidized material made from natural or synthetic graphite (i.e., made of pet coke or coal tar pitch) [62]. Currently, the LIB industry mixes natural and synthetic graphite [65]. Thus, materials with different structures and optical textures, i.e., dense structures or flakes and various anisotropy patterns, could be observed in the same sample (Figure 10C–F).
The optical texture of anode graphite may also be used in quality assessment, for example, to assess if its origin is natural or artificial, if the graphite composing an anode has the same origin, or if it is a mixture.
The reflectance of anode graphite is much lower than that of the current collector foils but higher than that of alumina (Figure 9A and Figure 10A). The optical texture of graphite is anisotropic. It shows strong bireflectance and pleochroism [63]. Its optical structure, however, may be dense (massive) or formed by microcrystalline aggregates of graphite flakes (Figure 10C–F).
Eventually, the optical texture of anode graphite may also be used in quality assessment, for example, to assess if its origin is natural or artificial, if the graphite composing an anode has the same origin, or if it is a mixture. Crelling and Rimmer [64] provide an online open-access petrographic atlas with natural and synthetic graphite images.

4.3.3. Organic Polymers

The binder, previously identified as PVDF through SEM-EDS, owing to its fluorine signature, is dark under incident white light. Thus, it is not visible or distinguishable from epoxy and other organic polymers. However, a “light green” fluorescent material occurs under UV light as thin films between the anode graphite grains and the lithium metal oxide crystals (Figure 8).
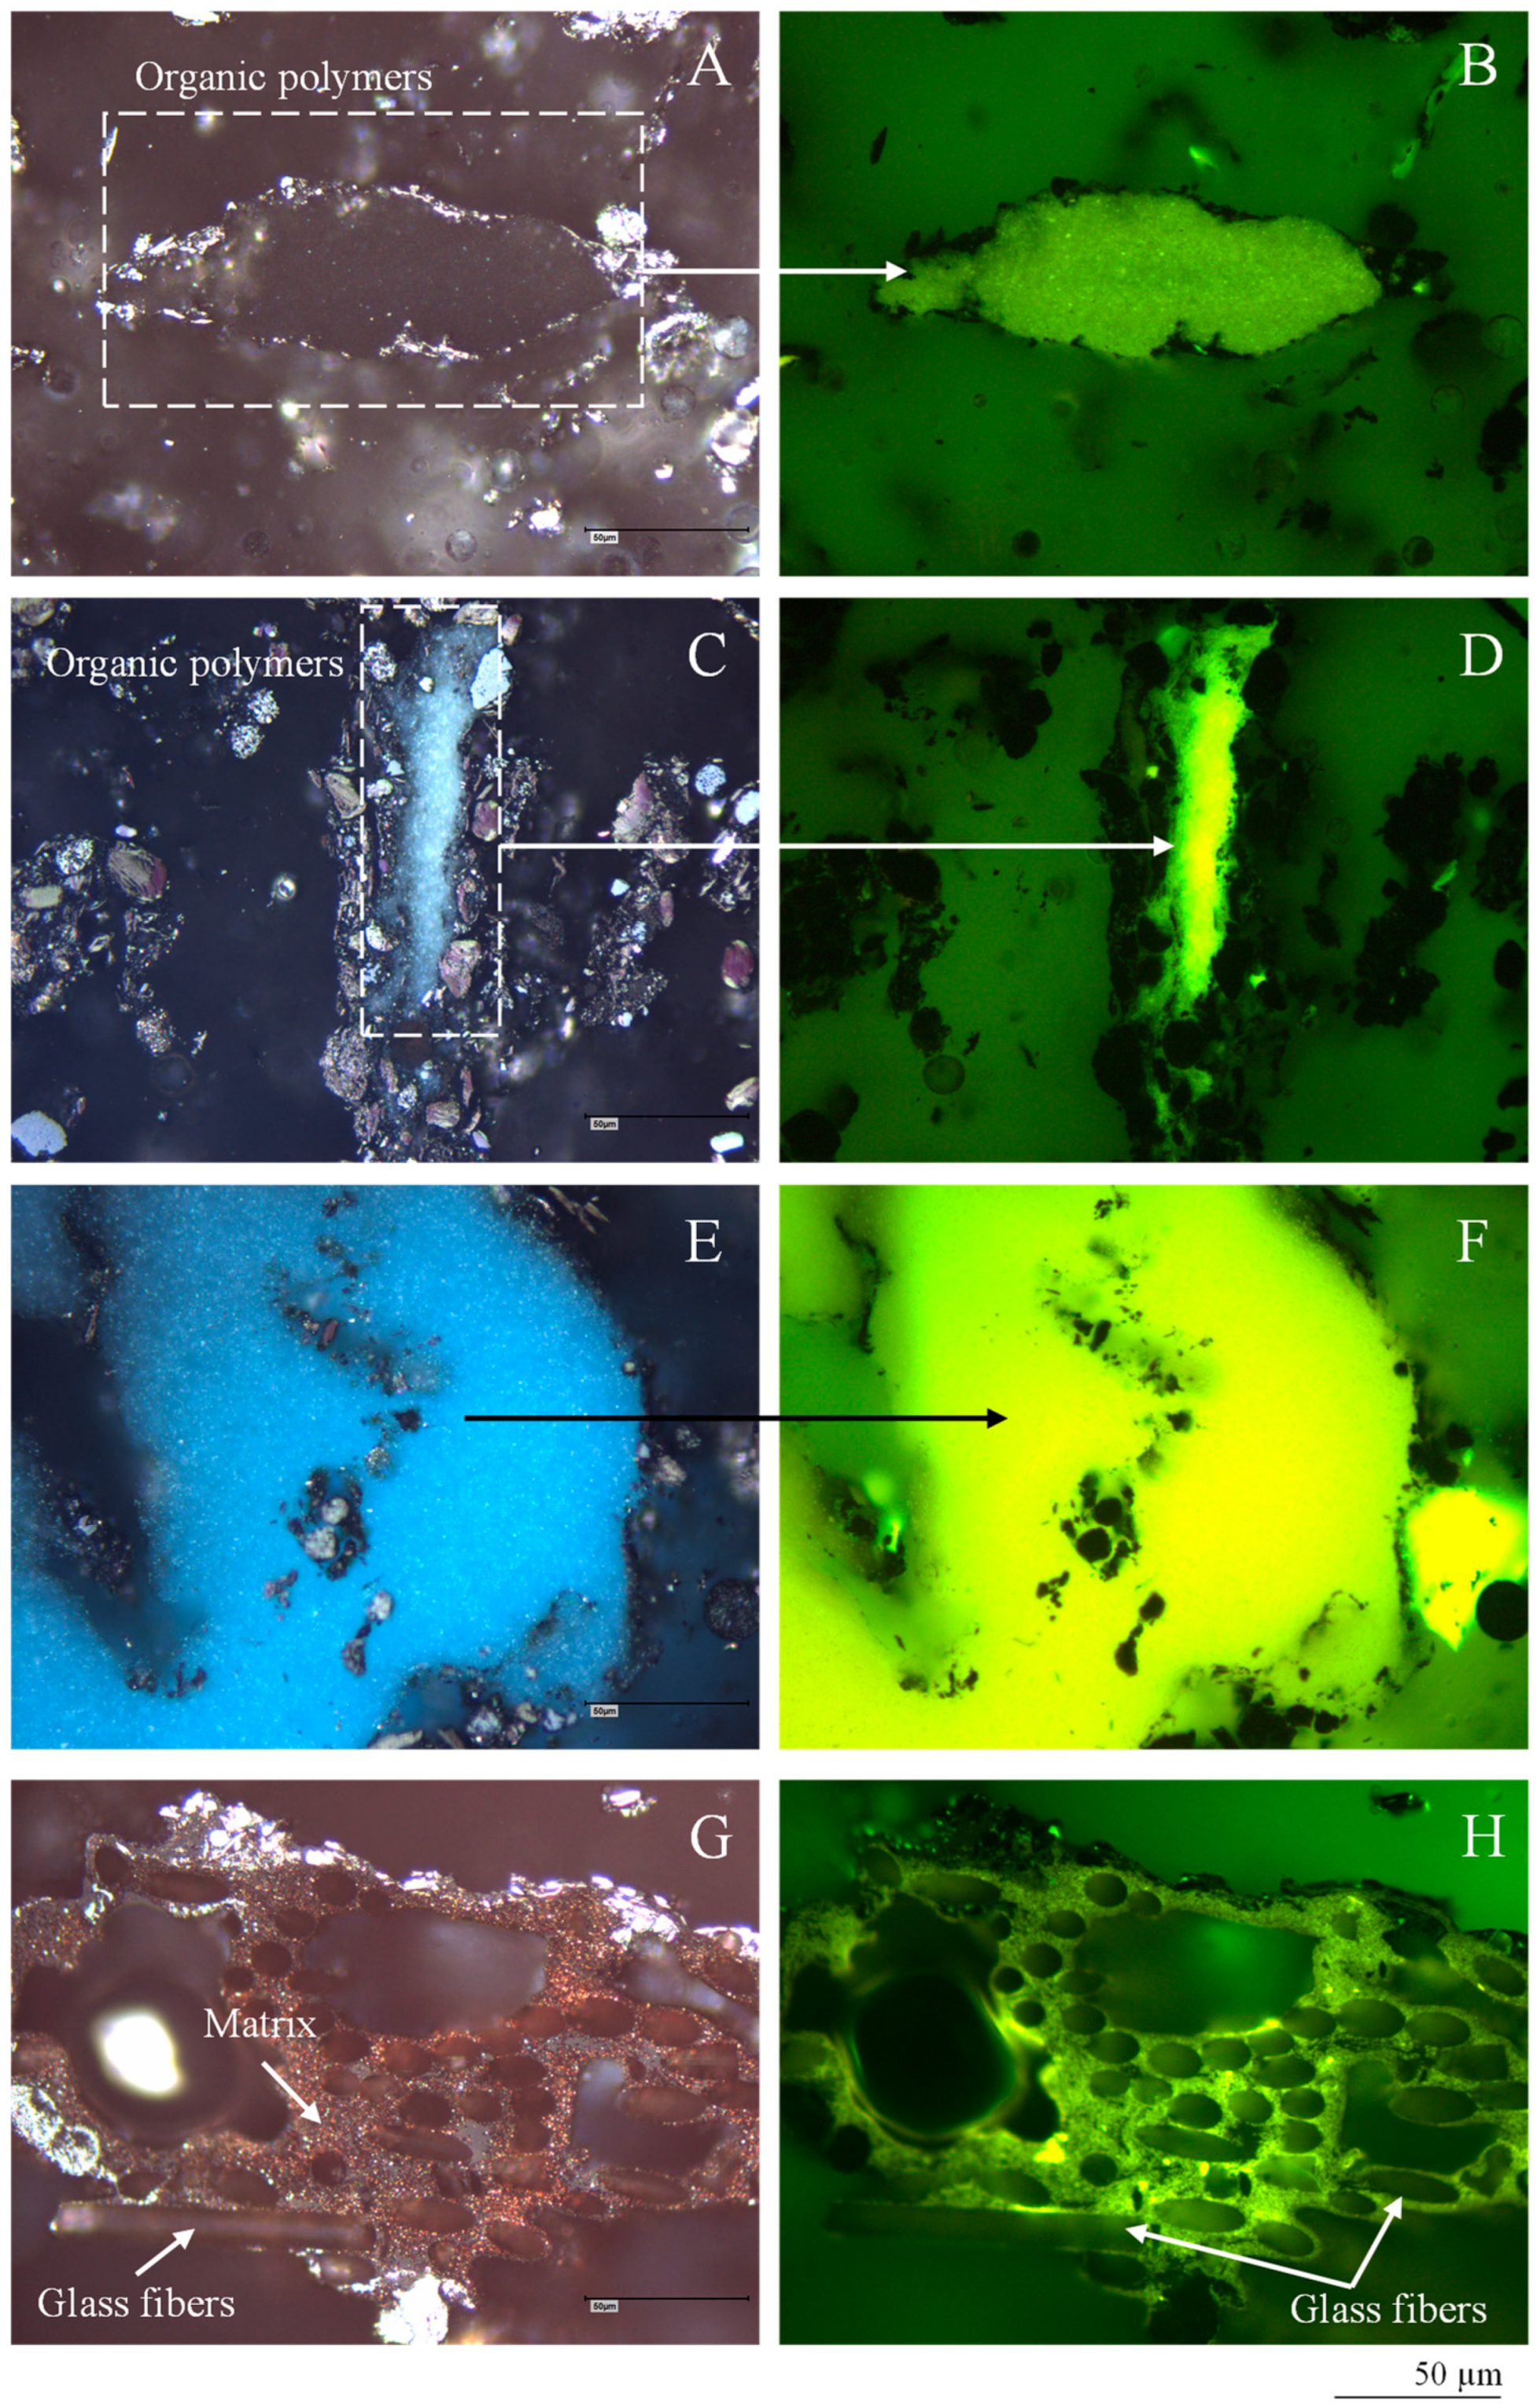
Fragments of organic polymers used in the LIB may also be observed and quantified through ILM. These may have different origins and colors under incident light (dark, white, red, blue, etc.), but they are all fluorescent materials.
The epoxy used to make the polished blocks is a fluorescent material with a slightly dark green color. In contrast, other materials are pale to light green and may be assumed to be organic polymers or comprising organic materials (plastics, binders, etc.) (Figure 10).
This is the case for separator fragments. For example, Figure 11G,H shows a matrix of a brownish material reinforced with a glass fiber mat, which is fluorescent under UV light. Like in the observations of glass fiber mats through SEM-EDS (Figure 7C,D), these mats are recognized by circles and elongated ellipsoids, are translucent and nonfluorescent, and are embedded by a matrix.

4.3.4. Lithium Metal Oxides Under Incident Light Microscopy

In incident light microscopy, it is possible to identify and quantify the lithium metal oxides. However, it is recommended that these tasks be combined with SEM-EDS and complemented with micro-Raman spectroscopy and X-ray diffraction. Some examples of this type of analysis are provided next.
After the shredding of EoL LIBs, lithium metal oxides may be observed in different ways:
  • As discrete particles;
  • Detached from the Al foils forming chunks;
  • As residues in the Al foil surfaces;
  • Trapped inside its folds (Figure 9 and Figure 12).
Meanwhile, the cathode may be composed of one or more species of lithium crystals (for example, in Figure 12B,D, only one species is present, while in Figure 12C,E–G, two species may be identified).
To quantify the lithium metal oxides using the point counting method, it is unnecessary to know the chemical composition of the crystal species observed since they may be described based on their optical microscopic properties, as shown in Figure 12. However, the samples should be previously analyzed through SEM-EDS to distinguish the different crystal species. For example [45]:
-
Blue spherical particles (Figure 12C), which are purple under polarized and retarded light, were described as Li-Mn-O after EDS analysis;
-
White spherical particles (Figure 12C,H), which are dark purple under polarized and retarded light, were described as Li-Ni-Co-O and Li-Ni-Mn-Co-O after EDS analysis;
-
Angular particles composed of twinned crystals and lamellae (Figure 12B,D), with colors varying between white, gray, dark gray, and pale blue, which are purple and pale purple under polarized and retarded light, were described as Li-Co-O after EDS analysis;
-
Blue angular crystals with dense or fractured optical structures occurring are associated with lithium crystal spheres (Figure 12E–H), which are intense purple (isotropic) under polarized and retarded light (their EDS analysis is missing).
-
None of the lithium crystals observed were fluorescent under UV light (Figure 8).

5. Applications to LIB Recycling

The following examples illustrate the application of petrography to assess LIB recycling. Structural differences before and after the thermal processes may be observed in the lithium crystals, the layers’ packing, and the graphite reflectance changes may be quantified.
In Section 4.1, petrography is used to assess the effect of thermal processes on lithium crystals and graphite, the fate of the binder, and its influence on particle unpacking.
Petrography is used in Section 4.2 to assess the residues left after the hydrometallurgical recovery of lithium metal oxides. It is possible to quickly identify the residue’s composition and the quantification of the graphite, plastics, binder, and other materials left after leaching.

5.1. Advanced Petrography as a Pyrometallurgical Aid (Pyrolysis and Roasting)

In high-temperature pyrometallurgical recycling, the organic and graphitic materials are eliminated during the process. At lower temperatures (e.g., 650 °C), pyrolysis is used to decompose PVDF and unpack the active materials from the current collectors, e.g., [66].
Advanced organic petrography may track the binder transformations and the heat treatment effect in the anode graphite and lithium metal oxides. Like in coal-derived carbon materials [38], any change in the structural order of the graphite may be detected from reflectance measurements, which may corroborate XRD, Raman spectroscopy, and TEM results.
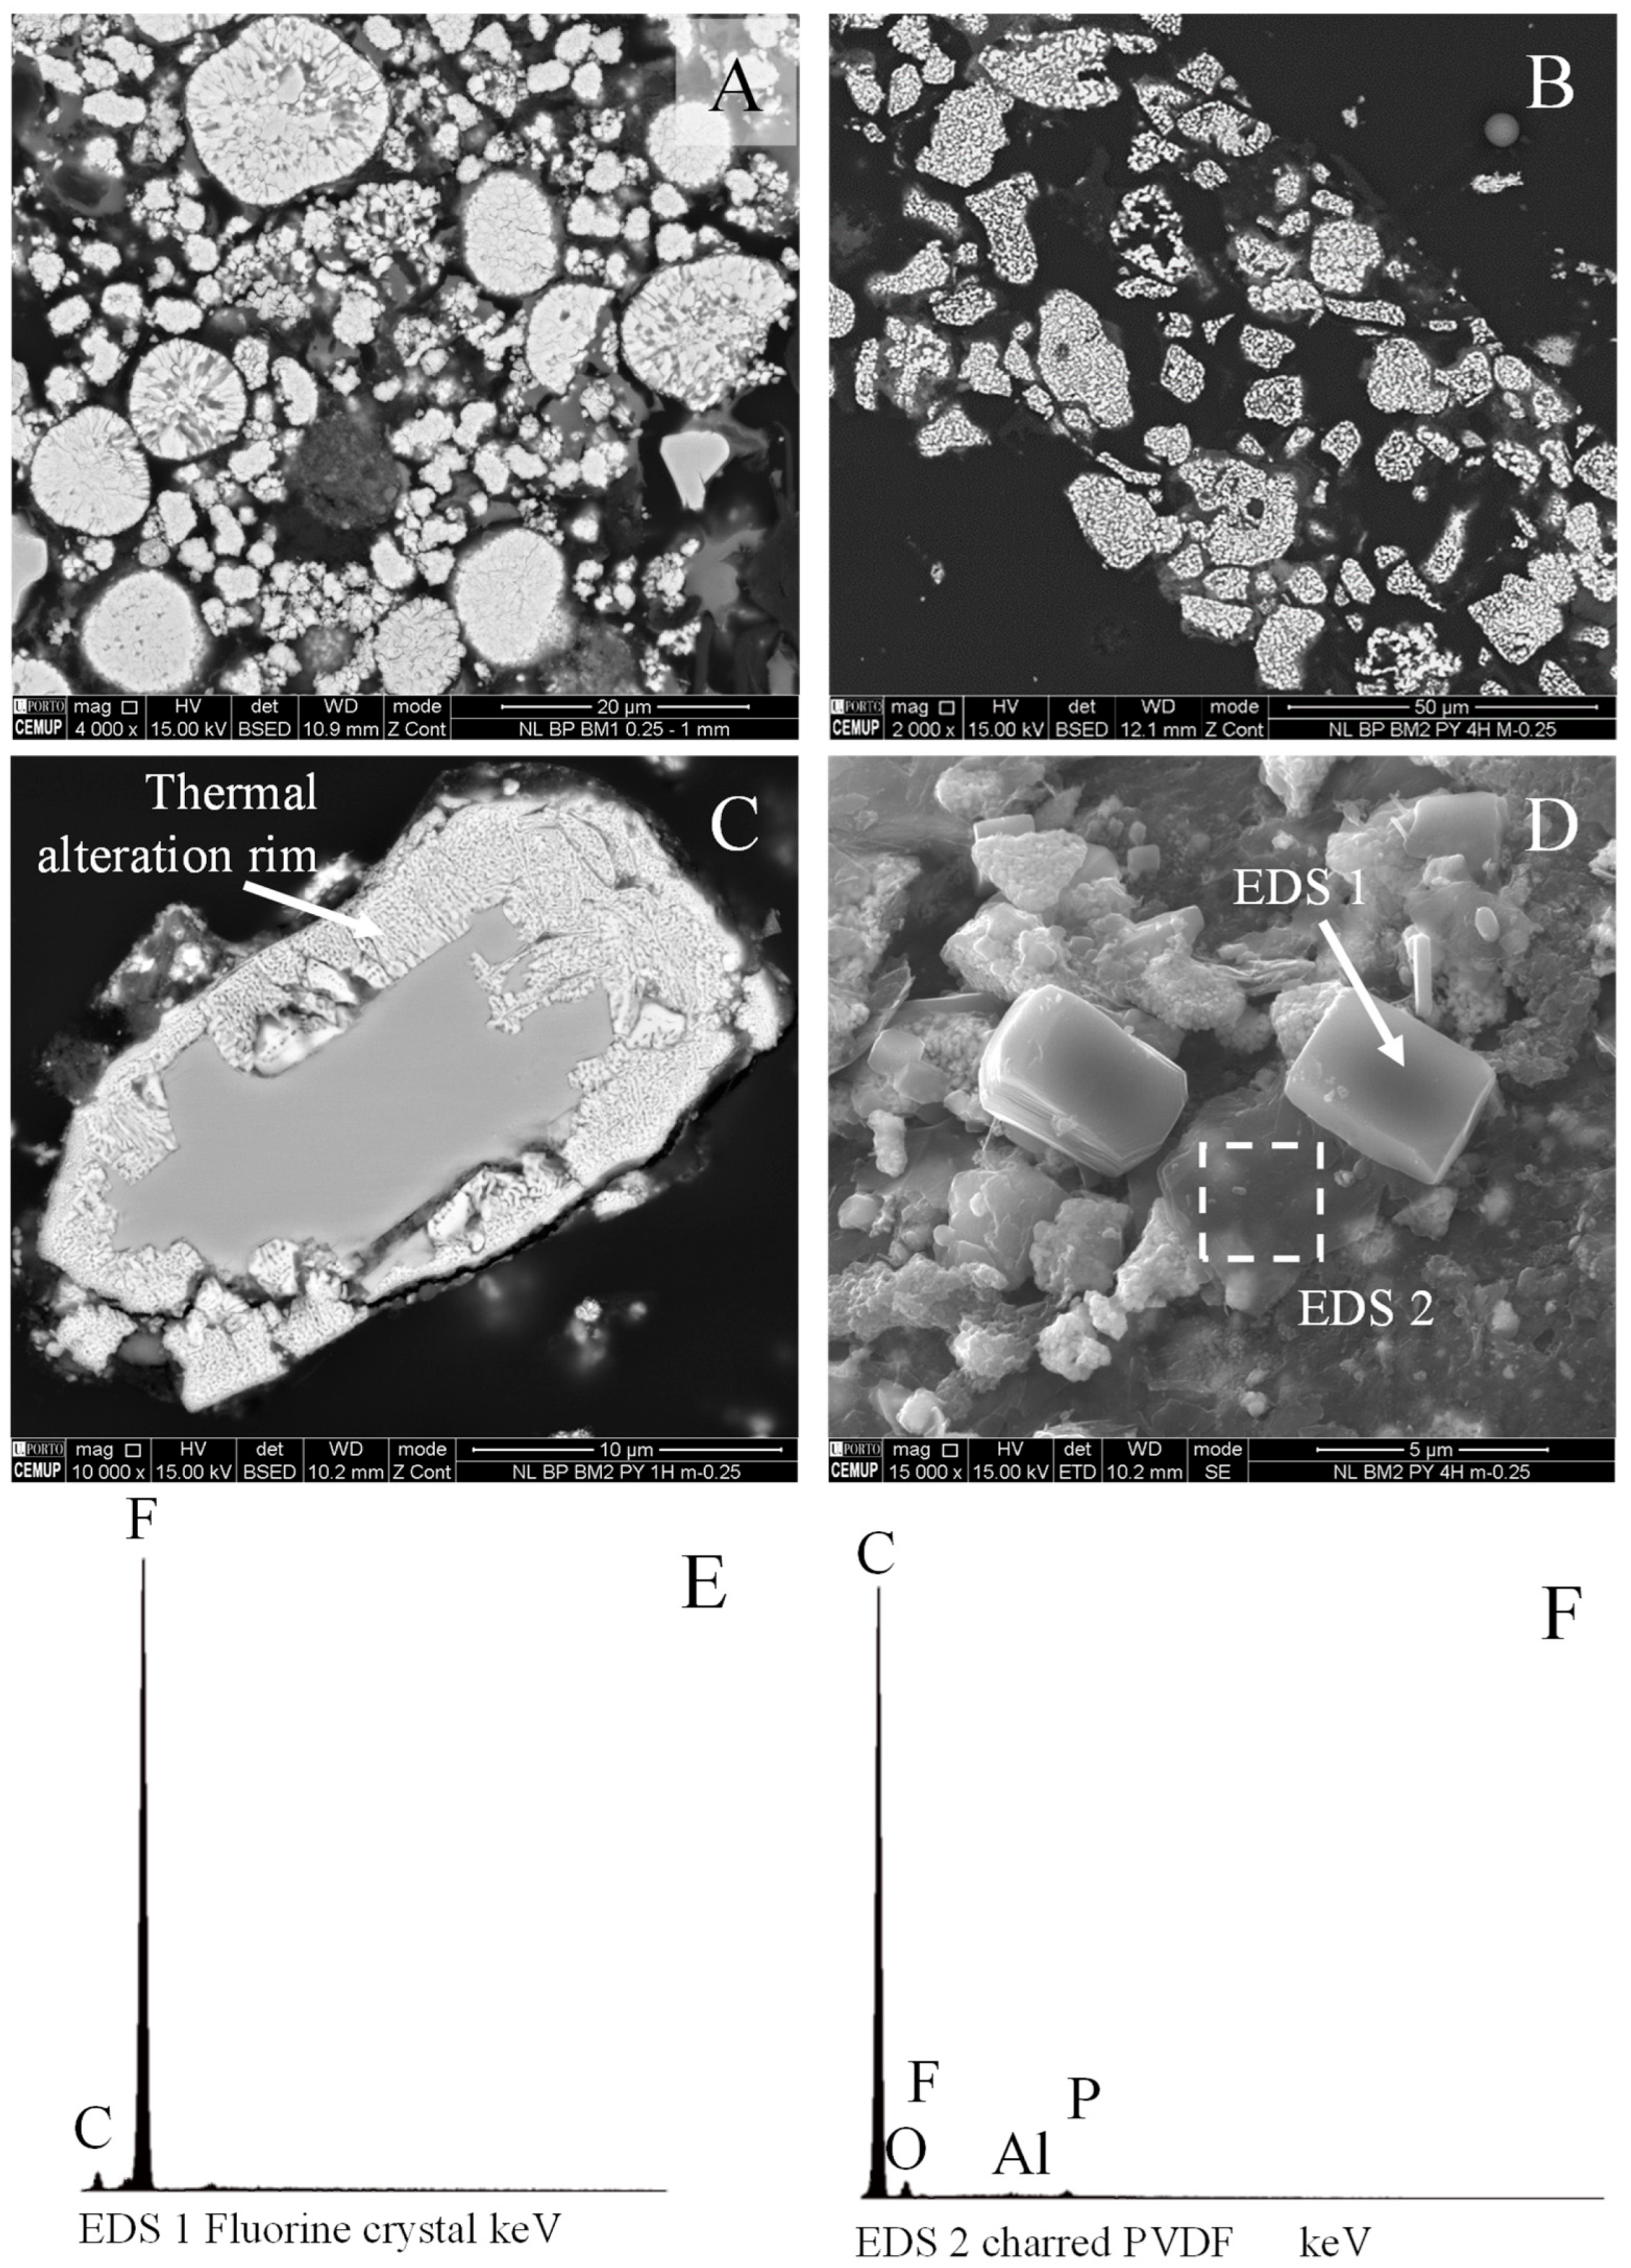
Analyzing polished blocks through SEM-EDS and ILM is probably the best way to highlight thermal transformations. Figure 13 and Figure 14 exemplify observations made after the pyrolysis of shredded EoL LIBs.
Many electrode chunks did not disintegrate, but more space between the grains was observed, and lithium metal oxide crystals were partially decomposed (Figure 13A–C).
The binder can still be observed, but fluorine crystalized while the carbonaceous portion charred (Figure 13D–F), and lost its fluorescence under ILM (Figure 14A–D).
Visually, graphite seems unchanged after the pyrolysis trials, and the XRD analysis did not detect any transformation. However, its average maximum reflectance increased (Figure 13E,F), and the graphite structure became more ordered, as shown in Mousa et al. [67] by the evolution of the different Raman parameters.

5.2. Advanced Organic Petrography as a Hydrometallurgy Aid

The assessment of the hydrometallurgical processes, at least at the laboratory scale and in research activities, may also be made using organic petrography to complement the chemical analysis, namely to check the scale of the chemical reactions on the lithium metal oxides and on the current collector foils, the type of impurities left.
Assessing the purity of anode graphite concentrates may also be relevant since this may be the most economically valuable material from low- to no-cobalt EV batteries [10].
Figure 14G,H shows anode graphite concentrates after physical separation and acid leaching. SEM-EDS may identify the impurities, whereas quantification may be carried out through ILM.

6. Final Remarks

Advanced organic petrography is here considered as a multi-technique analytical method. For shredded EoL LIBs, SEM-EDS is a powerful tool due to its capacity to distinguish different phases and attain very high magnifications.
However, the simplicity and low cost of stereo microscopy make this analytical technique very useful to check shredding efficiency, and it is a good idea to have it on hand.
Incident light optical microscopy is a unique analytical technique that can identify and quantify the current collectors (Cu foils and Al foils), the electrode active materials (anode graphite types and lithium metal oxide crystals), binders, organic polymers, glass fiber, alumina, other metals, among others, in the same analysis.
Thermal transformations may be observed in lithium crystals by SEM-EDS and ILM, but should also be assessed by micro-Raman spectroscopy. Graphite transformation is detectable in its reflectance increase.
Residue analysis is another application of advanced petrography to hydrometallurgical recycling. Graphite, silicates, and other unsolved materials may be identified and quantified.

Funding

This research was funded under the scope of the project “Novel Circular Economic Approaches for Efficient Extraction of Valuables from Spent Li-Ion Batteries (NEXT-LIB, coordinated by Dr. Guozhu Ye and Dr. Elsayed Mousa)”, the ERA-MIN2 program of the European Commission, and supported by the respective national funding agency represented in VINNOVA, Sweden (project no. 2019-03473), and the FCT—Foundation for Science and Technology, I.P., Portugal (ref. ERA-MIN/0003/2018), and by national funding awarded to the Institute of Earth Sciences by FCT, Projects UIDB/04683/2020 (accessed on 31 October 2024 at https://doi.org/10.54499/UIDB/04683/2020) and UIDP/04683/2020 (accessed on 31 October 2024 at https://doi.org/10.54499/UIDP/04683/2020).

Data Availability Statement

No new data were created or analyzed in this study. Data sharing is not applicable to this article.

Acknowledgments

I thank Charlotte Badenhorst, Ana Cláudia Santos, and Alexandra Guedes for their technical support in preparing samples and making microphotographs.

Conflicts of Interest

The author declares no conflicts of interest.

References

  1. Dahn, J.; Ehrlich, G.M. Lithium Secondary Cells, 5th ed.; Beard, K.W., Reddy, T.B., Eds.; McGraw-Hill: New York, NY, USA, 2019; Chapter 17; p. 757. ISBN 978-1-26-011593-2. [Google Scholar]
  2. Contestabile, M.; Panero, S.; Scrosati, B. A laboratory-scale lithium-ion battery recycling process. J. Power Sources 2001, 92, 65–69. [Google Scholar] [CrossRef]
  3. Zeng, X.L.; Li, J.H.; Ren, Y.S. Prediction of Various Discarded Lithium Batteries in China. In Proceedings of the 2012 IEEE International Symposium on Sustainable Systems and Technology, Boston, MA, USA, 16–18 May 2012; IEEE: Piscataway, NJ, USA, 2012; pp. 1–4. [Google Scholar] [CrossRef]
  4. Pavel, C.C.; Blagoeva, D.T. Materials Impact on the EU’s Competitiveness of the Renewable Energy, Storage and E-Mobility Sectors—Wind Power, Solar Photovoltaic and Battery Technologies; EUR 28774 EN; JRC108356; Publications Office of the European Union: Luxembourg, 2017; ISBN 978-92-79-73506-6. [Google Scholar] [CrossRef]
  5. Richa, K. Sustainable Management of Lithium-Ion Batteries After Use in Electric Vehicles. Ph.D. Thesis, Rochester Institute of Technology, Rochester, NY, USA, 2016. Available online: https://repository.rit.edu/cgi/viewcontent.cgi?params=/context/theses/article/10463/&path_info=KRichaDissertation12_2016.pdf (accessed on 31 October 2024).
  6. Melin, H.E. State of the Art in Reuse and Recycling of Lithium-ion Batteries—A Research Review. 2019. Available online: https://www.energimyndigheten.se/globalassets/forskning--innovation/overgripande/state-of-the-art-in-reuse-and-recycling-of-lithium-ion-batteries-2019.pdf (accessed on 13 May 2023).
  7. Available online: https://www.statista.com/topics/2049/lithium-ion-battery-industry/#topicOverview (accessed on 31 October 2024).
  8. Annex II of the Regulation Proposal COM/2023/160 Final. Proposal for a REGULATION OF THE EUROPEAN PARLIAMENT AND OF THE COUNCIL Establishing a Framework for Ensuring a Secure and Sustainable Supply of Critical Raw Materials and Amending Regulations (EU) 168/2013, (EU) 2018/858, 2018/1724 and (EU) 2019/1020. Available online: https://single-market-economy.ec.europa.eu/sectors/raw-materials/areas-specific-interest/critical-raw-materials_en#fifth-list-2023-of-critical-raw-materials-for-the-eu (accessed on 31 October 2024).
  9. Shin, S.M.; Kim, N.H.; Sohn, J.S.; Yang, D.H.; Kim, Y.H. Development of a metal recovery process from Li-ion battery wastes. Hydrometallurgy 2005, 79, 172–181. [Google Scholar] [CrossRef]
  10. Gaines, L.; Nelson, P. Lithium-Ion Batteries: Possible Materials Issues. In Proceedings of the 13th International Battery Materials Recycling Seminar and Exhibit, 2010, Broward County Convention Center, Fort Lauderdale, FL, USA, 16–18 March 2009; p. 16. [Google Scholar]
  11. Dunn, J.B.; Gaines, L.; Barnes, M.; Sullivan, J.; Wang, M. Material and Energy Flows in the Materials Production, Assemble, and End-of-Life Stages of the Automotive Lithium-Ion Battery Life Cycle; Report ANL/ESD/12-3; Argonne National Laboratory (ANL): Argonne, IL, USA, 2012.
  12. Ordoñez, J.; Gago, E.J.; Girard, A. Processes and technologies for the recycling and recovery of spent lithium-ion batteries. Renew. Sustain. Energy Rev. 2016, 60, 195–205. [Google Scholar] [CrossRef]
  13. Diekmann, J.; Hanisch, C.; Froböse, L.; Schälicke, G.; Loellhoeffel, T.; Fölster, A.-S.; Kwadea, A. Ecological Recycling of Lithium-Ion Batteries from Electric Vehicles with Focus on Mechanical Processes. J. Electrochem. Soc. 2017, 164, A6184–A6191. [Google Scholar] [CrossRef]
  14. Chen, M.; Ma, X.; Chen, B.; Arsenault, R.; Karlson, P.; Simon, N.; Wang, Y. Recycling end-of-life electric vehicle lithium-ion batteries. Joule 2019, 3, 2622–2646. [Google Scholar] [CrossRef]
  15. Gaines, L. Profitable recycling of low-cobalt lithium-ion batteries will depend on new process developments. One Earth 2019, 1, 413–415. [Google Scholar] [CrossRef]
  16. Li, J.; Shi, P.; Wang, Z.; Chen, Y.; Chang, C.-C. A combined recovery process of metals in spent lithium-ion batteries. Chemosphere 2009, 77, 1132–1136. [Google Scholar] [CrossRef]
  17. Buchert, M.; Sutter, J. Aktualisierte Ökobilanzen zum Recyclingverfahren LithoRec II für Lithium-Ionen-Batterien (Stand 09/2016). 2016. Available online: https://www.erneuerbar-mobil.de/sites/default/files/2017-01/LithoRec%20II-LCA-Update%202016.pdf (accessed on 25 May 2024).
  18. Costa, C.M.; Lee, Y.-H.; Kim, J.-H.; Lee, S.-Y.; Lanceros-Méndez, S. Recent advances on separator membranes for lithium-ion battery applications: From porous membranes to solid electrolytes. Energy Storage Mater. 2019, 22, 346–375. [Google Scholar] [CrossRef]
  19. Arora, P.; Zhang, Z. Battery Separators. Chem. Rev. 2004, 104, 4419–4462. [Google Scholar] [CrossRef]
  20. Saunier, J.; Alloin, F.; Sanchez, J.Y.; Barriere, B. Plasticized microporous poly(vinylidene fluoride) separators for lithium-ion batteries. I. Swelling behavior of dense membranes with respect to a liquid electrolyte—Characterization of the swelling equilibrium. J. Polym. Sci. Part B Polym. Phys. 2004, 42, 532–543. [Google Scholar] [CrossRef]
  21. Lee, H.; Yanilmaz, M.; Toprakci, O.; Fu, K.; Zhang, X. A review of recent developments in membrane separators for rechargeable lithium-ion batteries. Energy Environ. Sci. 2014, 7, 3857–3886. [Google Scholar] [CrossRef]
  22. Reddy, T.; Linden, D. Thoroughly Revised, Comprehensive Coverage of Battery Technology, Characteristics, and Applications. In Linden’s Handbook of Batteries, 5th ed.; McGraw-Hill: New York, NY, USA, 2019; ISBN 9781260115925. [Google Scholar]
  23. Liu, Z.; Fu, W.; Liang, C. Part IV: New Emerging Technologies. Lithium–Sulfur Batteries. In Handbook of Battery Materials, 2nd ed.; Daniel, C., Besenhard, J.O., Eds.; Wiley-VCH Verlag & Co.: Weinheim, Germany, 2011; p. 811. ISBN 978-3-527-32695-2. [Google Scholar]
  24. Zhang, J.-G.; Bruce, P.G.; Zhang, X.G. Part IV: New Emerging Technologies. Metal–Air Batteries. In Handbook of Battery Materials, 2nd ed.; Daniel, C., Besenhard, J.O., Eds.; Wiley-VCH Verlag & Co.: Weinheim, Germany, 2011; p. 759. ISBN 978-3-527-32695-2. [Google Scholar]
  25. Zhang, X.; Chung, M.; Kim, H.; Wang, C.-W.; Sastry, A.M. Part V: Performance and Technology Development for Batteries. Mechanics of Battery Cells and Materials. In Handbook of Battery Materials, 2nd ed.; Daniel, C., Besenhard, J.O., Eds.; Wiley-VCH Verlag & Co.: Weinheim, Germany, 2011; p. 877. ISBN 978-3-527-32695-2. [Google Scholar]
  26. Melin, H.E. The Lithium-Ion Battery End-of-Life Market 2018–2025; Analysis of Volumes, Players, Technologies and Trends. Circular Energy Storage, United Kingdom, 2018. Available online: https://static1.squarespace.com/static/587657ddbe659497fb46664c/t/5b511b990e2e7239c2bc7b0b/1532042145266/Table+of+content+The+lithium-ion+battery+end-of-life+market.pdf (accessed on 31 October 2024).
  27. FCAB, 2021. Federal Consortium for Advanced Batteries. Executive Summary. National Blueprint for Lithium Batteries. 2021–2030. DOE/EE-2348. Available online: https://www.energy.gov/eere/vehicles/vehicle-technologies-office (accessed on 31 October 2024).
  28. Gies, E. Recycling: Lazarus batteries. Nature 2015, 526, S100–S101. [Google Scholar] [CrossRef] [PubMed]
  29. Zhang, T.; He, Y.; Wang, F.; Li, H.; Duan, C.; Wu, C. Surface analysis of cobalt-enriched crushed products of spent lithium-ion batteries by X-ray photoelectron spectroscopy. Sep. Purif. Technol. 2014, 138, 21–27. [Google Scholar] [CrossRef]
  30. Zeng, X.; Li, J.; Shen, B. Novel approach to recover cobalt and lithium from spent lithium-ion battery using oxalic acid. J. Hazard. Mater. 2015, 295, 112–118. [Google Scholar] [CrossRef] [PubMed]
  31. Roy, J.J.; Rarotra, S.; Krikstolaityte, V.; Zhuoran, K.W.; Cindy, Y.D.-I.; Tan, X.Y.; Carboni, M.; Meyer, D.; Yan, Q.; Srinivasan, M. Green recycling methods to treat lithium-ion batteries E-Waste: A circular approach to sustainability. Adv. Mater. 2022, 34, 2103346. [Google Scholar] [CrossRef]
  32. Sakultung, S.; Pruksathorn, K.; Hunsom, M. Simultaneous recovery of valuable metals from spent mobile phone battery by an acid leaching process. Korean J. Chem. Eng. 2007, 24, 272–277. [Google Scholar] [CrossRef]
  33. Gratz, E.; Sa, Q.; Apelian, D.; Wang, Y. A closed loop process for recycling spent lithium ion batteries. J. Power Sources 2014, 262, 255–262. [Google Scholar] [CrossRef]
  34. Nayl, A.A.; Elkhashab, R.A.; Badawy, S.M.; El-Khateeb, M.A. Acid leaching of mixed spent Li-ion batteries. Arab. J. Chem. 2017, 10, S3632–S3639. [Google Scholar] [CrossRef]
  35. Bahaloo-Horeh, N.; Mousavi, S.M. Enhanced recovery of valuable metals from spent lithium-ion batteries through optimization of organic acids produced by Aspergillus niger. Waste Manag. 2017, 60, 666–679. [Google Scholar] [CrossRef]
  36. Das, D.; Manna, S.; Puravankara, S. Electrolytes, Additives and Binders for NMC Cathodes in Li-Ion Batteries—A Review. Batteries 2023, 9, 193. [Google Scholar] [CrossRef]
  37. Krekeler, M.P.S. Transmission electron microscopy (TEM) investigations of Mn-oxide rich cathodic material from spent disposable alkaline batteries. Waste Manag. 2008, 28, 2061–2069. [Google Scholar] [CrossRef] [PubMed]
  38. Suárez-Ruiz, I.; Crelling, J.C. Applied Coal Petrology: The Role of Petrology in Coal Utilization; Elsevier Science: Amsterdam, The Netherlands, 2008; ISBN 978-0-08-045051-3. [Google Scholar]
  39. ISO 7404-2; Methods for the Petrographic Analysis of Coals—Part 2: Methods of Preparing Coal Samples. International Organization for Standardization: Geneva, Switzerland, 2009; p. 12.
  40. Goldstein, J.I.; Newbury, D.E.; Michael, J.R.; Ritchie, N.W.M.; Scott, J.H.J.; Joy, D.C. Scanning Electron Microscopy and X-Ray Microanalysis, 4th ed.; Springer Nature: Berlin, Germany, 2018; ISBN 978-1-4939-6674-5. ISBN 978-1-4939-6676-9. [Google Scholar] [CrossRef]
  41. Craig, J.R.; Vaughan, D.J. Ore Microscopy and Ore Petrography, 2nd ed.; John Wiley & Sons, Inc.: New York, NY, USA; Chichester, UK; Brisbane, Australia; Toronto, ON, Canada; Singapore, 1994; p. 434. ISBN 0-471-55175-9. [Google Scholar]
  42. Alpern, B.; Cheymol, D. Réflectance et fluorescence des organoclastes du Toarcien du Bassin de Paris en fonction de la profondeur et de la température. Rev. Inst. Francais Pétrole 1978, 33, 515–535. [Google Scholar] [CrossRef]
  43. Pickel, W.; Kus, J.; Flores, D.; Kalaitzidis, S.; Christanis, K.; Cardott, B.J.; Misz-Kennan, M.; Rodrigues, S.; Hentschel, A.; Hamor-Vido, M.; et al. ICCP. Classification of liptinite—ICCP System 1994. Int. J. Coal Geol. 2017, 169, 40–61. [Google Scholar] [CrossRef]
  44. ISO 7404-3; Methods for the Petrographic Analysis of Coals—Part 3: Method of Determining Maceral Group Composition. International Organization for Standardization: Geneva, Switzerland, 2009; p. 7.
  45. Badenhorst, C.; Kuzniarska-Biernacka, I.; Guedes, A.; Mousa, E.; Ramos, V.; Rollinson, G.; Ye, G.; Valentim, B. Recovery of Graphite from Spent Lithium-Ion Batteries. Recycling 2023, 8, 79. [Google Scholar] [CrossRef]
  46. ISO 7404-5; Methods for the Petrographic Analysis of Coals—Part 5: Method of Determining Microscopically the Reflectance of Vitrinite. International Organization for Standardization: Geneva, Switzerland, 2009; p. 14.
  47. ASTM D2798-11; Standard Test Method for Microscopical Determination of the Vitrinite Reflectance of Coal. American Society for Testing and Materials: West Conshohocken, PA, USA, 2011; p. 5.
  48. Orlando, A.; Franceschini, F.; Muscas, C.; Pidkova, S.; Bartoli, M.; Rovere, M.; Tagliaferro, A.A. Comprehensive Review on Raman Spectroscopy Applications. Chemosensors 2021, 9, 262. [Google Scholar] [CrossRef]
  49. Tuinstra, F.; Koenig, J.L. Raman spectrum of graphite. J. Chem. Phys. 1970, 53, 1126–1130. [Google Scholar] [CrossRef]
  50. Guedes, A.; Valentim, B.; Prieto, A.C.; Noronha, F. Raman spectroscopy of coal macerals and fluidized bed char morphotypes. Fuel 2012, 97, 443–449. [Google Scholar] [CrossRef]
  51. Gokturk, P.A.; Kakenov, N.; Kocabas, C.; Suzer, S. Raman and X-ray photoelectron spectroscopic studies of graphene devices for identification of doping. Appl. Surf. Sci. 2017, 425, 1130–1137. [Google Scholar] [CrossRef]
  52. Tsujimoto, M.; Tanimura, M.; Tachibana, M. Temperature dependence of the Raman spectra of multilayer graphene nanoribbons fabricated by unzipping method. Diam. Relat. Mater. 2020, 109, 108047. [Google Scholar] [CrossRef]
  53. Liu, Y.; Shi, Y.; Zhou, W.; Shi, W.; Dang, W.; Li, X.; Liang, B. The split-up of G band and 2D band in temperature-dependent Raman spectra of suspended graphene. Opt. Laser Technol. 2021, 139, 106960. [Google Scholar] [CrossRef]
  54. Knight, D.S.; White, W.B. Characterization of diamond films by Raman spectroscopy. J. Mater. Res. 1989, 4, 385–393. [Google Scholar] [CrossRef]
  55. Adams, R.A.; Li, B.; Kazmi, J.; Adams, T.E.; Tomar, V.; Pol, V.G. Dynamic impact of LiCoO2 electrodes for Li-ion battery aging evaluation. Electrochim. Acta 2018, 292, 586–593. [Google Scholar] [CrossRef]
  56. Julien, C.M.; Mauger, A. In situ Raman analyses of electrode materials for Li-ion batteries. AIMS Mater. Sci. 2018, 5, 650–698. [Google Scholar] [CrossRef]
  57. Beccard, B.; Karavadra, S.N. Lithium-Ion Battery Manufacturing and Quality Control: Raman Spectroscopy, an Analytical Technique of Choice. Spectrosc. Suppl. Raman Technol. Todays Spectrosc. 2022, 37, 46–53. [Google Scholar] [CrossRef]
  58. Severin, K.P. Energy Dispersive Spectrometry of Common Rock Forming Minerals; Springer Nature: Berlin, Germany, 2004; ISBN 1-4020-2840-7. ISBN 1-4020-2841-5. [Google Scholar]
  59. Fischer, S.; Doose, S.; Müller, J.; Höfels, C.; Kwade, A. Impact of Spheroidization of Natural Graphite on Fast-Charging Capability of Anodes for LIB. Batteries 2023, 9, 305. [Google Scholar] [CrossRef]
  60. Lampe-Onnerud, C.; Shi, J.; Onnerud, P.; Chamberlain, R.; Barnett, B. Benchmark study on high performing carbon anode materials. J. Power Sources 2001, 97, 133–136. [Google Scholar] [CrossRef]
  61. Glazier, S.L.; Li, J.; Louli, A.J.; Allen, J.P.; Dahn, J.R. An Analysis of Artificial and Natural Graphite in Lithium Ion Pouch Cells Using Ultra-High Precision Coulometry, Isothermal Microcalorimetry, Gas Evolution, Long Term Cycling and Pressure Measurements. J. Electrochem. Soc. 2017, 164, A3545. [Google Scholar] [CrossRef]
  62. Asenbauer, J.; Eisenmann, T.; Kuenzel, M.; Kazzazi, A.; Chen, Z.; Bresser, D. The success story of graphite as a lithium-ion anode material—Fundamentals, remaining challenges, and recent developments including silicon (oxide) composites. Sustain. Energy Fuels 2020, 4, 5387. [Google Scholar] [CrossRef]
  63. Kwiecinska, B.; Petersen, H.I. Graphite, semi-graphite, natural coke, and natural char classification—ICCP system. Int. J. Coal Geol. 2004, 57, 99–116. [Google Scholar] [CrossRef]
  64. Crelling, J.C.; Rimmer, S.M. Crelling’s Petrographic Atlas of Coals and Carbons. Southern Illinois University Carbondale. 2015. Available online: https://coalandcarbonatlas.siu.edu/ (accessed on 20 July 2024).
  65. Olivetti, E.A.; Ceder, G.; Gaustad, G.G.; Fu, X. Lithium-Ion Battery Supply Chain Considerations: Analysis of Potential Bottlenecks in Critical Metals. Joule 2017, 1, 229–243. [Google Scholar] [CrossRef]
  66. Zhan, R.; Yang, Z.; Bloom, I.; Pan, L. Significance of a Solid Electrolyte Interphase on Separation of Anode and Cathode Materials from Spent Li-Ion Batteries by Froth Flotation. ACS Sustain. Chem. Eng. 2021, 9, 531–540. [Google Scholar] [CrossRef]
  67. Mousa, E.; Hu, X.; Ånnhagen, L.; Ye, G.; Cornelio, A.; Fahimi, A.; Bontempi, E.; Frontera, P.; Badenhorst, C.; Santos, A.C.; et al. Thermal Treatment and Characterisation of the Black Mass from Spent Lithium-ion Batteries. Sustainability 2023, 15, 15. [Google Scholar] [CrossRef]
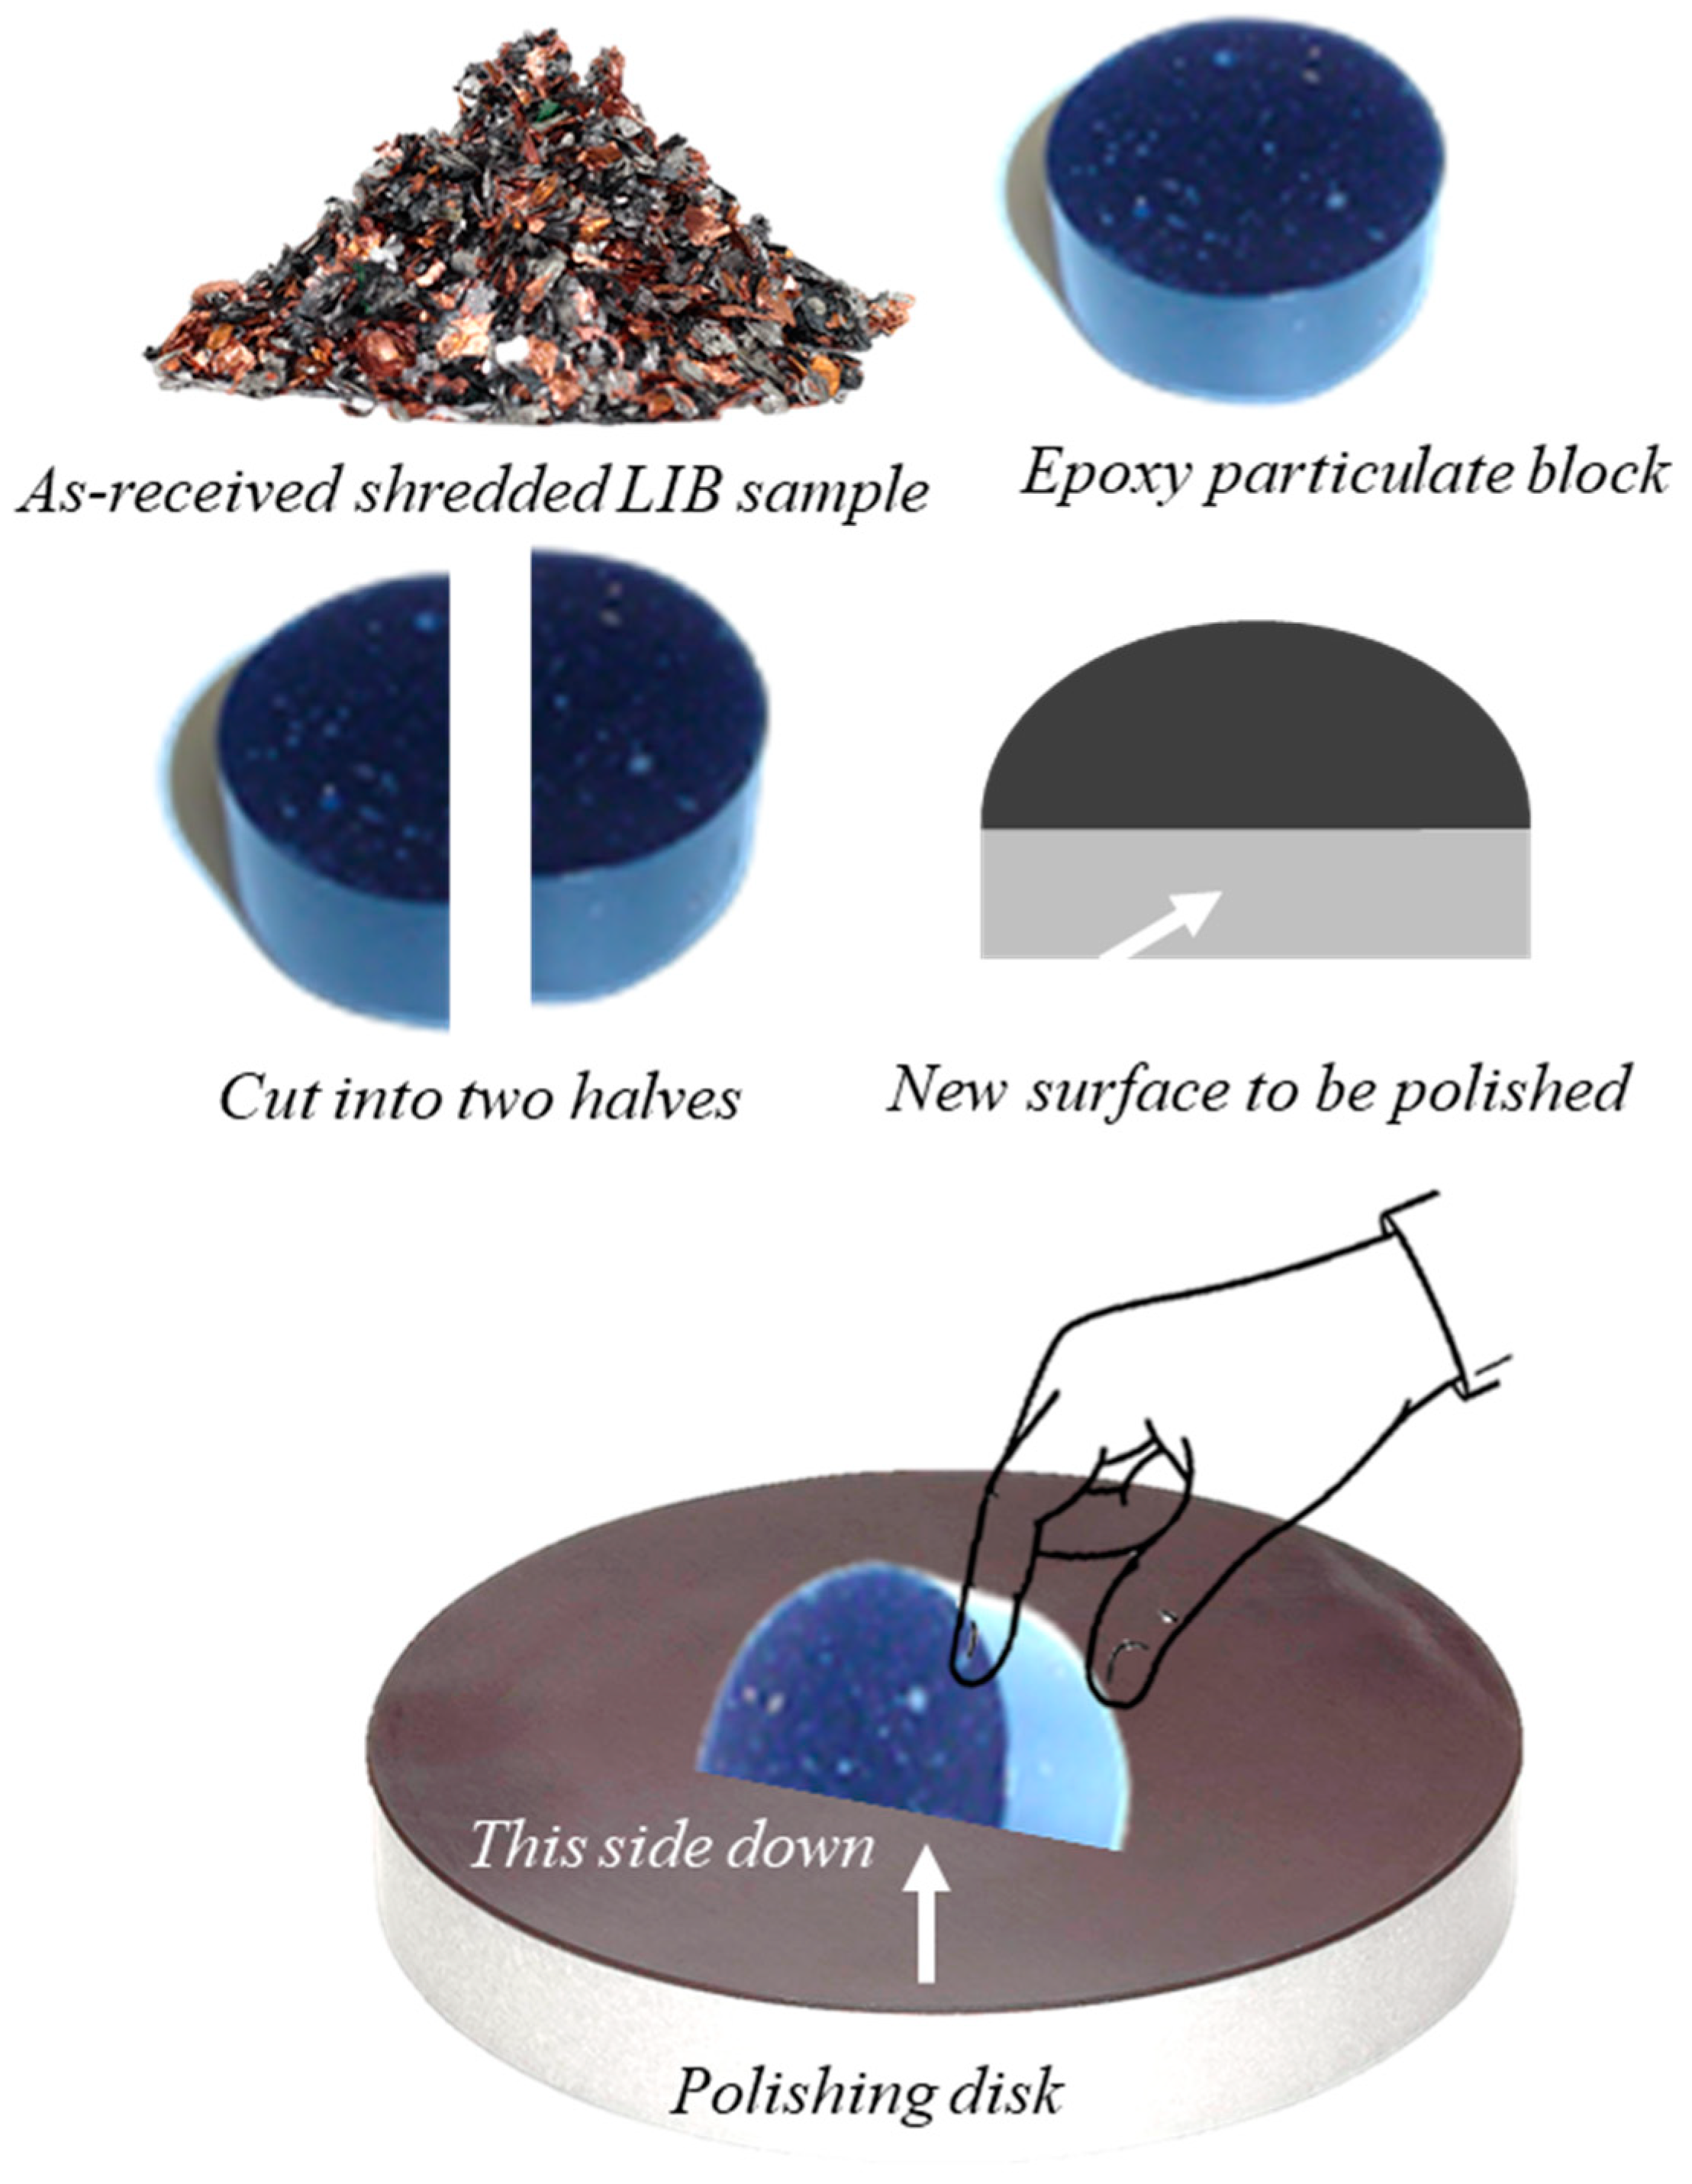
Figure 1. Shredded EoL LIB sample preparation for petrographic analysis. Adaptation of the method in ISO 7404-2, the preparation of coal particulate blocks for petrographic analysis [39].
Batteries 10 00391 g001
Figure 2. Stereo microscope analysis of shredded EoL LIBs (as-received sample): (A) Cu foils are reddish while aluminum foils are silver; (B) other metallic components (steel?); (C) green fragment with residual active components attached; (D) copper wire and round translucent material of unknown composition; (E) fiber bundle, possibly glass fiber; (F) very thin wire network still attached to anode and cathode chunks; (G) ball of very thin wires; (H) anode and cathode chunks.
Batteries 10 00391 g002
Figure 3. (A,B) Different phases’ identification and detailed imaging through SEM-EDS BSE mode; (C) EDS spectra of the lithium crystal in “B”: NMC oxide; (D) EDS of graphite grains’ interface in “E”. Fluorine is the binder signature in PVDF.
Batteries 10 00391 g003
Figure 4. SEM-EDS current collectors’ identification (BSE mode; as-received (a.r) and polished block (p.b.) samples): (A,B) aluminum and copper foils (a.r. and p.b., respectively); (C) alumina covering Al foil (a.r.); (D) typical alumina surface (magnification of “C”); (E) EDS spectra of Al foil and alumina; (F) cross-section of cathode (p.b.); (G) folded copper foil with residual anode graphite, and EDS spectrum (a.r.); (H) steel fragment (p.b.).
Batteries 10 00391 g004
Figure 5. SEM-EDS of organic polymers and anode graphite identification: (A,B) organic materials (plastics, others) and EDS spectrum (a.r., p.b.; BSE mode); (C) discrete particle of anode graphite and EDS spectrum (secondary electrons mode); (D) graphene layers (25,000× magnification of the surface of graphite in “D”; secondary electrons mode); (E) anode graphite chunk (a.r.; BSE mode); (F) increasing the screen brightness to find anode graphite chunks in polished blocks (p.b.; BSE mode).
Batteries 10 00391 g005
Figure 6. Cathode and lithium metal oxide identification (SEM-EDS BSE mode; as-received (a.r) and polished block (p.b.) samples): (A) cathode chunk (a.r.); (B) cathode chunks with different compositions (p.b.); (C) LiCoO2 (LCO) crystal and EDS spectrum (a.r.); (D) LiCoO2 (LCO) crystal and EDS spectrum (p.b.); (E) lithium crystal framboids and LiMn2O4 (LMO) spectrum (a.r.); (F) chunks of lithium framboids (p.b.); (G,H) EDS spectra LiNiCoAlO2 (NCA) and LiNixMnyCozO2 (NMC).
Batteries 10 00391 g006
Figure 7. Other materials’ identification (SEM-EDS BSE mode; as-received (a.r) and polished block (p.b.) samples): (AE) glass mat binder (a.r., p.b. and EDS spectra); (F) silicate fragments and EDS spectrum (p.b.); (G,H) ceramic (p.b., a.r. and EDS spectrum).
Batteries 10 00391 g007
Figure 8. Incident light optical microscopy images of LIB electrode components (polished block samples) obtained with the polarizer inserted (left column), with “crossed polars” (N+) and a 1λ retarder plate (column at center), and UV light (right column).
Batteries 10 00391 g008
Figure 9. Electrode chunks (incident light optical microscopy; polished block samples): (AC) anode fragment comprising folded copper foil with residual anode graphite; (DF) cathode chunk comprising folded aluminum foil entrapping lithium metal oxide crystals.
Batteries 10 00391 g009
Figure 10. Alumina and anode graphite chunks (incident light optical microscopy. Plane-polarized light (left) “crossed polars” and retarded light (right); polished block samples): (A,B) cracked alumina embedding anode graphite; (C,D) anode graphite chunk comprising flake graphite spheroids; (E,F) anode graphite chunk comprising dense graphite spheroids.
Batteries 10 00391 g010
Figure 11. Organic material chunks (incident light optical microscopy: white light (left), UV light (right); polished block samples): (AF) materials with different colors and fluorescence intensity; (G,H) brown chunk of separator with glass fiber mat.
Batteries 10 00391 g011
Figure 12. Cathode chunks (incident light optical microscopy (polished block samples): (A,B) cathode chunks with two different species of active components still attached; (C) chunk of spheroids of lithium metal oxides with different optical properties and composition; (D) LCO chunk; (EG) chunks with spheroids and blue angular lithium metal oxide species; (H) same image as “G” using polarized and retarded light.
Batteries 10 00391 g012
Figure 13. Pyrometallurgical trials checking (SEM-EDS BSE mode “A-C”, SE mode “D”; as-received (a.r) and polished block (p.b.) samples) (A) as-received sample: cathode chunk (p.b.); (B) cathode chunk after 4 h of pyrolysis at 650 °C (p.b.); (C) LCO crystal after pyrolysis at 650 °C for 1 h (p.b.); (D) PVDF, fluorine crystallization during pyrolysis (a.r); (E,F) EDS spectra in “D”.
Batteries 10 00391 g013
Figure 14. Pyrometallurgical and hydrometallurgical trials checking (as-received (a.r) and polished block (p.b.) samples) (AD) loss of binder fluorescence after pyrolysis (ILM, p.b.); (E,F) reflectograms of anode graphite maximum reflectance determinations before and after pyrolysis; (G) polished block of anode graphite after physical separation and acid leaching (ILM); (H) same concentrate as in “G” with impurities of glass fibers and P-bearing particle (SEM-EDS BSE mode).
Batteries 10 00391 g014
Disclaimer/Publisher’s Note: The statements, opinions and data contained in all publications are solely those of the individual author(s) and contributor(s) and not of MDPI and/or the editor(s). MDPI and/or the editor(s) disclaim responsibility for any injury to people or property resulting from any ideas, methods, instructions or products referred to in the content.