Article

Early Investigations on Electrolyte Mixing Issues in Large Flow Battery Tanks

by
Andrea Trovò
1,2,
Pablo A. Prieto-Díaz
3,
Nicolò Zatta
1,2,
Francesco Picano
1,2 and
Massimo Guarnieri
1,2,*
1
Department of Industrial Engineering, University of Padua, 35131 Padova, Italy
2
Interdepartmental Centre Giorgio Levi Cases for Energy Economics and Technology, University of Padua, 35131 Padova, Italy
3
Departamento de Ingeniería Térmica y de Fluidos, Universidad Carlos III de Madrid, Avd. de la Universidad 30, 28911 Leganés, Madrid, Spain
*
Author to whom correspondence should be addressed.
Batteries 2024, 10(4), 133; https://doi.org/10.3390/batteries10040133
Submission received: 7 March 2024 / Revised: 12 April 2024 / Accepted: 13 April 2024 / Published: 17 April 2024
(This article belongs to the Section Battery Modelling, Simulation, Management and Application)

Abstract

:
Most investigations on flow batteries (FBs) make the assumption of perfectly mixed electrolytes inside the tanks without estimating their likelihood, while specific analyses are missing in the literature. This paper presents a pioneering investigation of the electrolyte flow dynamics inside FB tanks. This study considers the Open Circuit Voltage (OCV) measured at the stack of a 9 kW/27 kWh Vanadium FB with 500 L tanks. Order-of-magnitude estimates of the measured dynamics suggest that differences in densities and viscosities of the active species drive gradients of concentrations with different patterns in the positive and negative tanks and in charge and discharge, affected by current and flow rate, which result in significant deviation from homogeneity, affecting the State of Charge (SoC) of the electrolytes flowed into the stack and thus the FB performance. In particular, stratifications of the inlet electrolytes may appear which are responsible for delays in reaching the outlets, with initial plateau and following step (s) in the SoC at the stack. These events can have a major impact in the performance of industrial FBs with large tanks and suggest that specific tank designs may improve the overall dynamics, calling for further analysis.

1. Introduction

Energy storage is an essential enabler of the energy transition [1,2]. Since the most common renewable sources, i.e., solar radiation and wind, are intermittent and to some extent unpredictable, energy storage is necessary to align grid power demand with the power generated by these sources [3,4]. Energy storage systems are required to provide different services, which, depending on the response and operating times, can be classified in power quality and energy management [5,6]. The former includes operations on the short timescale (up to few minutes), like voltage sag compensation, power smoothing, grid stabilization, frequency regulation, and UPS (uninterruptable power supply). The latter refers to operations on a longer timescale (several minutes to hours), such as peak shaving, load leveling, time shifting, energy arbitrage, load following, power balancing, load factor improvement, and investment deferral [7,8]. It has recently emerged that energy management services extending over longer times will play a pivotal role in the full decarbonization of the grid energy [9]. Such services converge into the Long-Duration Energy Storage (LDES) paradigm, which considers discharge times at full power longer than 8 h and storage times from some days to several weeks. A strong advocacy for LDES has been given by Linda L. Horton, Associate Director at the U.S. Department of Energy (DOE) Office of Science (SC), in her plenary lecture at the 243rd ECS Meeting in Boston on 29 May 2023 [10]. The importance of LDES is confirmed by the institution and growth of the LDES Council, which gathers 60 major manufacturers and stakeholders at present, including industrial giants such as Microsoft and Google [11].
Flow Batteries (FBs) are very attractive candidates for LDES, thanks to several advantages. In full FBs, both positive and negative electrolytes are liquid and are stored in tanks, to be pumped into the reactor when energy conversion is required. Several active ions may be used, solved in the positive and negative electrolytes, both metallic and organic [12]. The FB energy W (that depends on the volume of electrolytes stored in tanks) and power P (that depends on the electrochemical reactor size) are decoupled, allowing for very large W/P ratios, i.e., very long discharges. In addition, FBs can reach quite good round-trip efficiency at system level (50–80%, depending on the chemistry and system engineering) [13]. During operation, the electrolytes are pumped into the electrochemical reactor (stack) made of several piled cells, to flow through the positive and negative cell porous electrodes, and undergo the electrochemical reactions converting electrical energy into chemical energy during charge and vice versa during discharge [14]. The All-Vanadium FB (VFB or VRFB) is the most developed FB, due to its good power and energy densities among FBs, good efficiency, environmental impact, and very long shelf life and cycle life [15]. To gain a deeper understanding of the operation of VFB, a comprehensive electrochemical formalism, which aims to shed light on the role played by the equilibria and redox processes of the active Vanadium complexes in electrolytes on the battery electrical behavior, is proposed in [16]. Nevertheless, due to their widely unexplored potentials, FBs, both organic and metallic, are experiencing a period of volcanic fundamental research aimed at identifying the most competitive types, under the chemical, engineering, and economical points of view [17].
Over the past few years, extensive fundamental research was carried out at cell level on novel active materials, notably electrolytes with heightened energy densities [18,19], electrodes with low transport and activation overpotentials [20,21], membranes with high ionic selectivity, which constitute an efficient barrier towards Vanadium crossover, i.e., low Vanadium species crossover [22,23,24], and high-conductive bipolar plates [25,26]. The electrolyte transport in the stack-cell [27,28] and in the electrodes [29,30] was also widely investigated both in the flow-by/flow-through codesigns and inside the electrodes, but the attention dedicated to electrochemical cells and stacks greatly surpasses the attention given to other engineering aspects, which however play a major role in the system performance. Regarding the tanks, previous research has primarily focused on experimental studies related to industrial strategies for rebalancing and mixing their electrolytes [31,32]. Published fluid-dynamic modeling at the system level typically assumes the Continuous Stirred Tank Reactor (CSTR) for the tanks, i.e., instantaneous and perfect mixing of charged and discharged ions in each tank during energy conversion [33,34]. This assumption is actually poor in the case of FBs for LDES, necessarily provided with large tanks storing considerable volumes of electrolytes, whose ions are pumped toward the stack at a level of concentration and return at a different level as imposed by the energy conversion electrochemical reactions. In fact, delays in the adaptation of the state of charge are observed which reveal complex mixing effects and concentration gradient dynamics. A recent work by Wang et al. sheds light on the ion behavior in the tanks, modeling their concentration gradients and highlighting the importance of incorporating baffles to promote mixing [35]. Nevertheless, their studies disregarded the impact of buoyancy and focused on extremely low Reynolds numbers. A more recent work by Prieto-Díaz et al. provided more accurate numerical simulations and their order-of-magnitude estimates revealed that the electrolytes within tanks may not achieve perfect mixing [36]. Results showed the potential occurrence of buoyancy, depending on the current I (i.e., reaction rate) and electrolyte flow rate Q, which may affect the battery capacity and response readiness. However, this research solely comprised modeling and simulation experiments assuming lab-scale tanks and lacked experimental validation. The aim of this work is to examine the dynamics of ion concentration gradients in the tanks, making use of experimental data taken on a real industrial-scale VFB.
This paper is structured as follows. Section 2 describes the experimental set-up, the methodology, and the order-of-magnitude estimate which were used. Experimental results are presented in Section 3, followed by their discussion in Section 4. Finally, conclusions are outlined in Section 5.

2. Materials and Methods

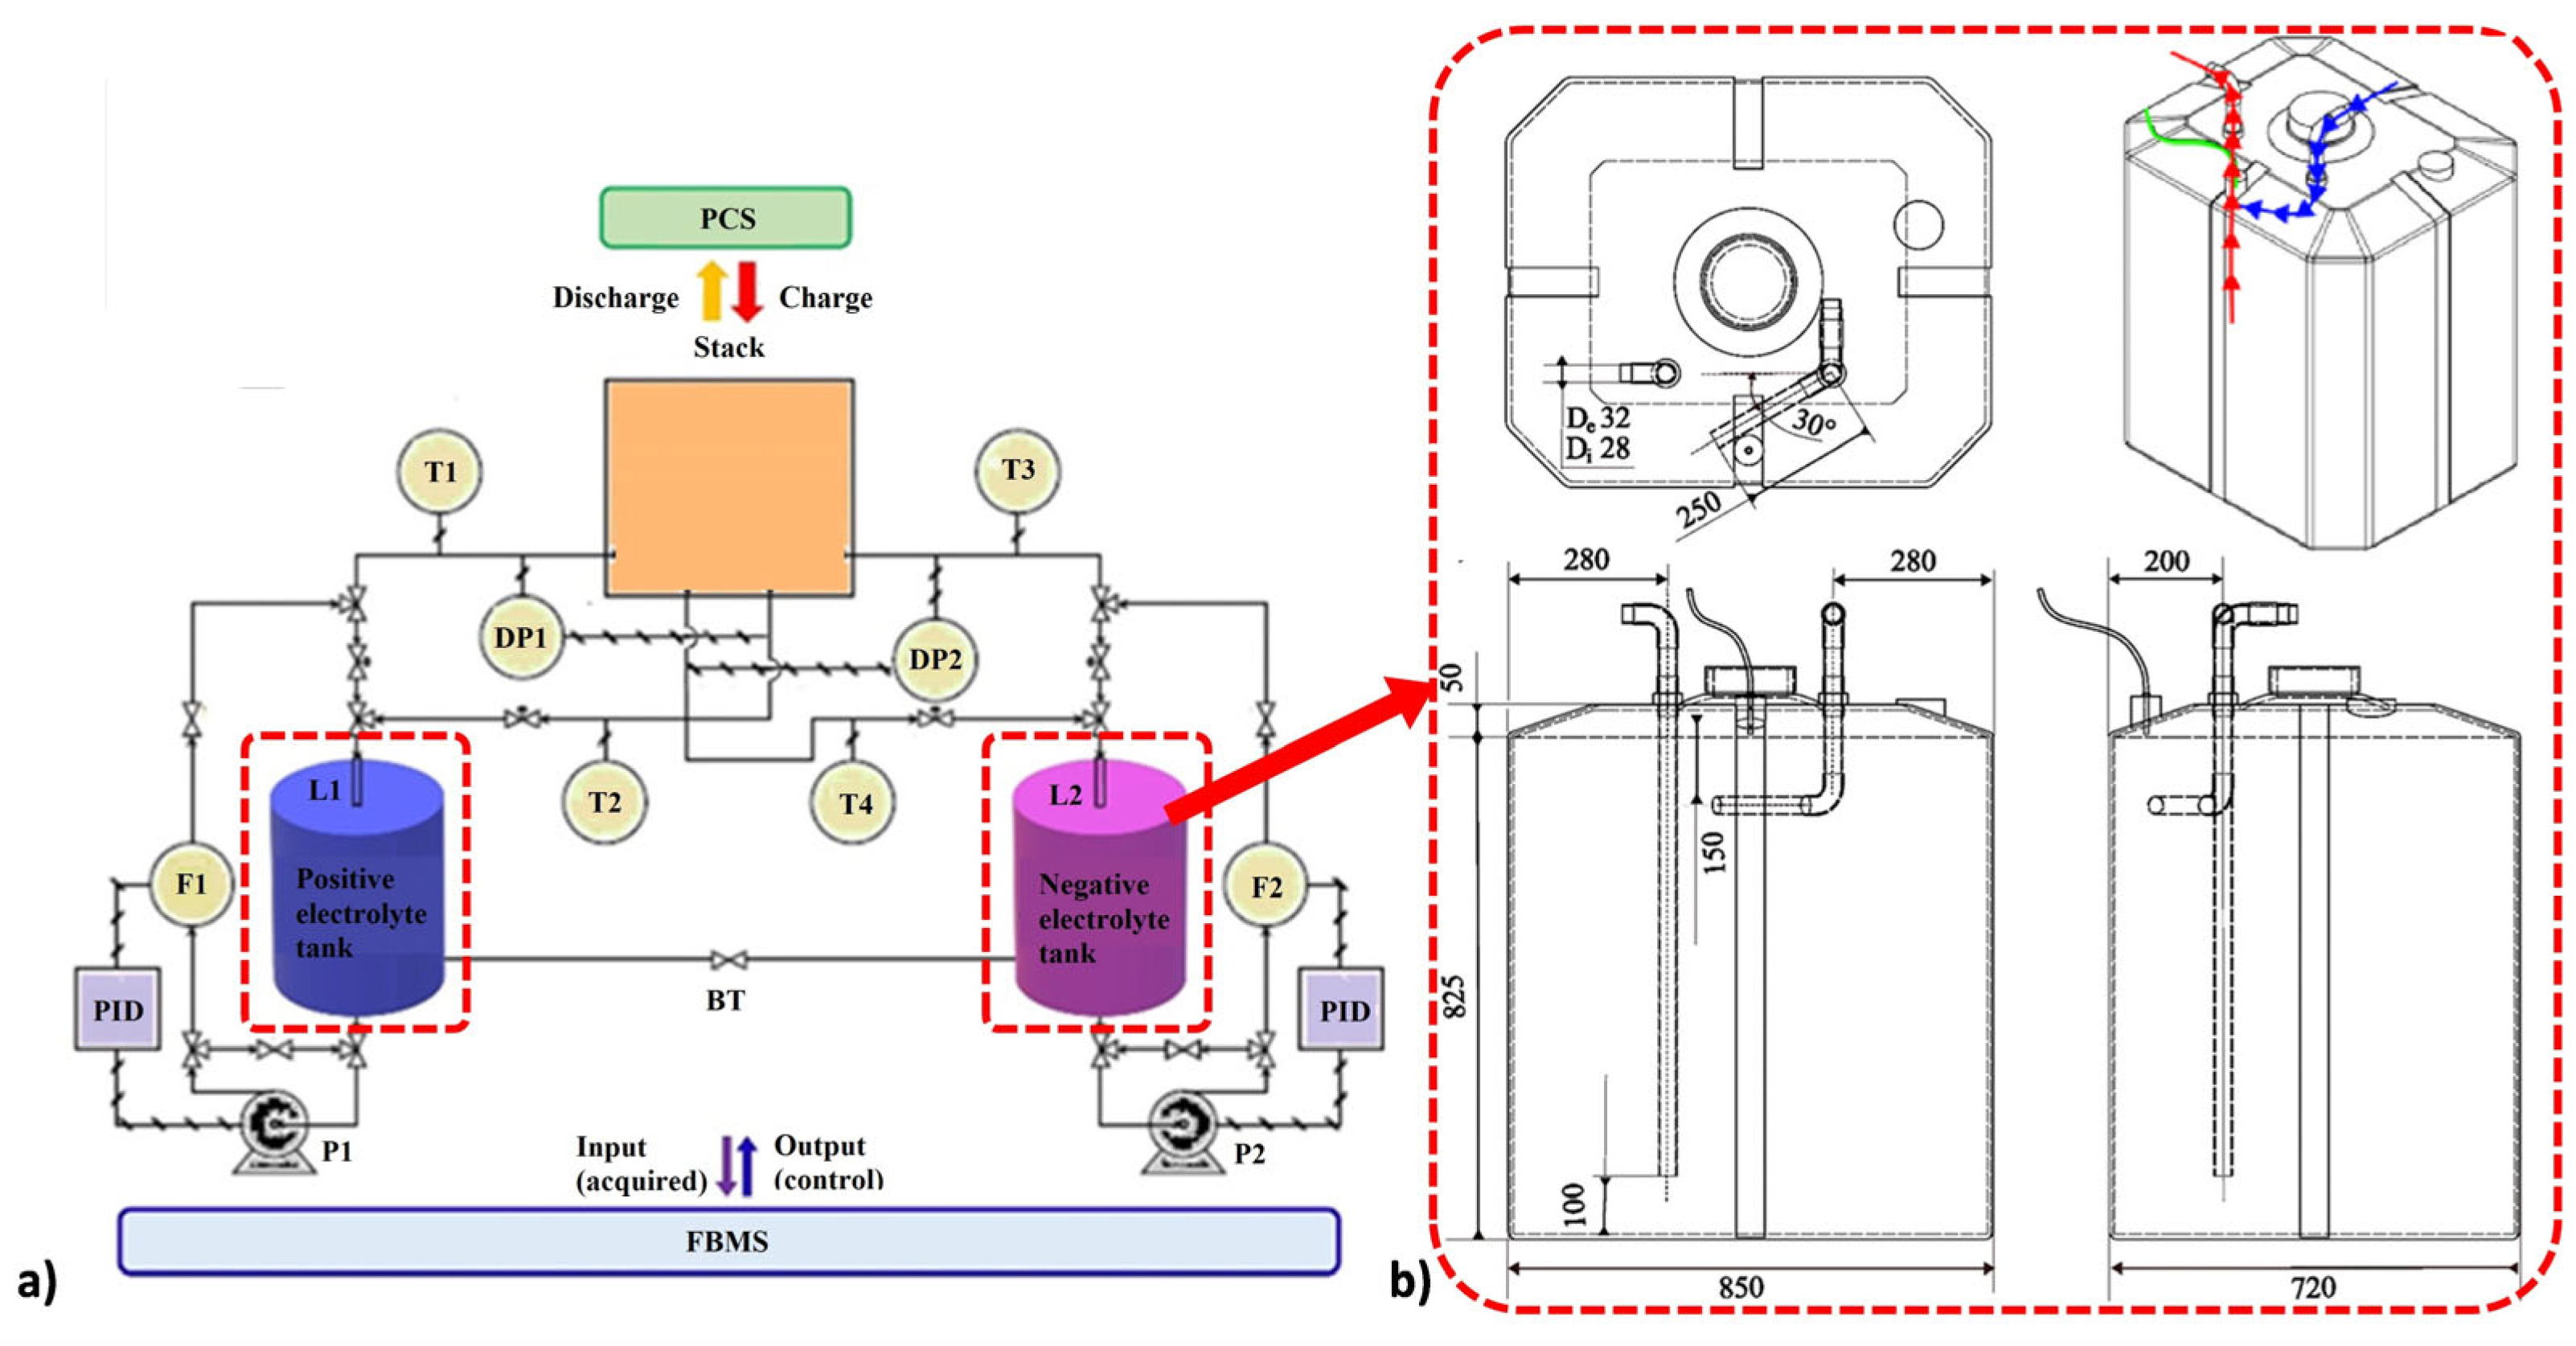
2.1. Experimental Set-Up

Experiments were carried out on an Industrial-Scale Vanadium Redox Flow Battery (IS-VRFB) test facility, installed at the Electrochemical Energy Storage and Conversion Lab (EESCoLab, University of Padua, Padua, Italy), sketched in Figure 1 [37]. It is provided with a 40-cell stack with an active area of 600 cm2 hydraulically connected in parallel by internal manifolds, and electrically in series via flat Bipolar Plates (BPs) with a flow-through architecture. The cells’ electrodes are made with 600 cm2 area and 5.7 mm thick (after compression) heat-treated graphite felts (Beijing Great Wall, Beijing, China), and the separator is untreated Nafion® 212 membrane. To enhance hydrophilicity [38] and electrochemical performance, the felts underwent heat treatments, mainly consisting of cyclic heating up to 400 °C. The stack has a top power of 9 kW at full State of Charge (SoC) and high Q.
The electrolytes are a commercial solution consisting of 1.6 M Vanadium dissolved in 4.5 M sulfuric acid (Oxkem Limited, Reading, UK). An amount of 2 × 550 L of electrolytes are stored in two tanks, providing an energy capacity of 27 kWh. Two centrifugal pumps, driven by ac brushless motors which are PID (proportional-integrative-derivative) controlled by two inverters, modulate the circulation of the electrolytes at the required flow rate Q. Each pump is capable of delivering a maximum flow rate of approximately 30 L min−1. The system is outfitted with sensors measuring tank levels, stack differential pressures, electrolyte flow rates, stack inlet and outlet temperature, stack current, individual cell and stack voltages, and electric power consumed by the pump inverters. The power conditioning system (PCS) comprises a two-quadrant ac/dc static converter rated ±75 A and 0–85 V and controls the power conversion both in charge and discharge. The operation of the PCS and pumps is controlled by the in-house Flow Battery Management System (FBMS), based on the SoC and programmed operation [39].

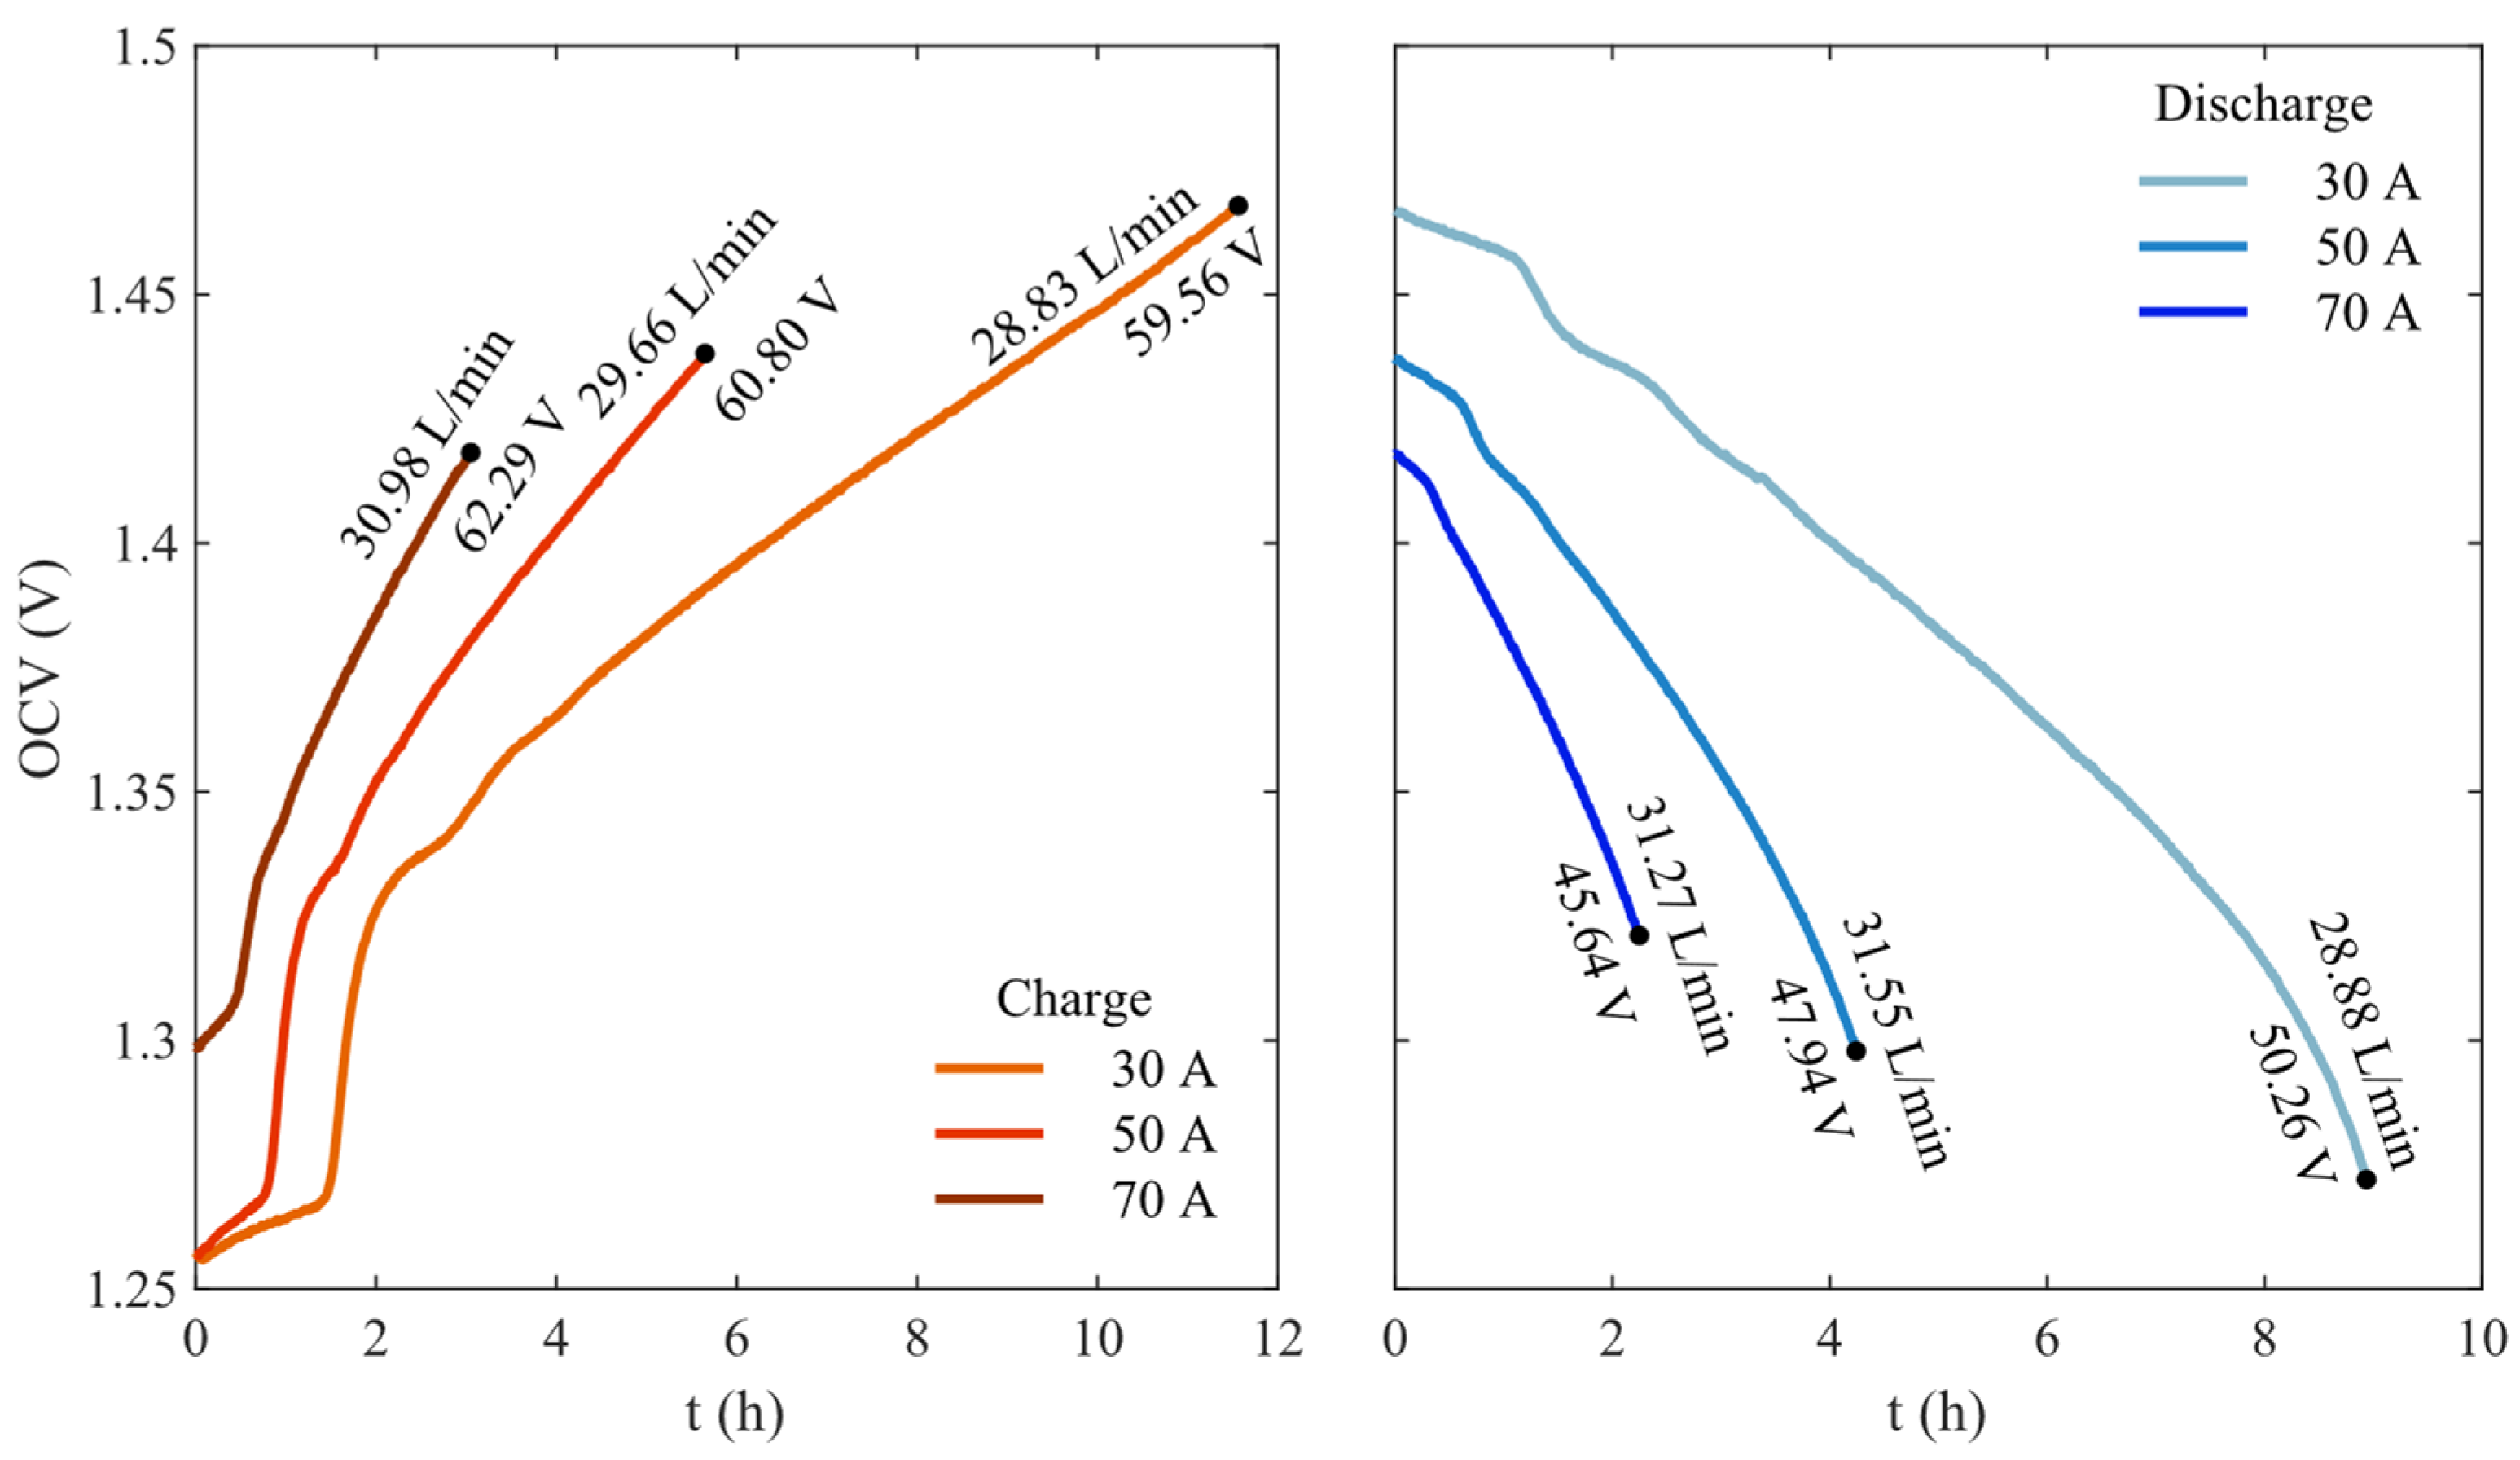
2.2. Cycling Procedure

The hydraulic behavior of the tanks has been analyzed in charge/discharge cycles at different current levels. A key parameter driving these cycles is the stoichiometric factor, or “flow factor”, that represents the ratio between the flow rate of the electric charges carried by the electrolytes moving in the stack and the charge rate generated in the cells by the electrochemical reactions (i.e., N times the cell current I):
α = Q   F   C v   1 S o C N   I Q   F   C v   S o C N   I                       i n   c h a r g e               i n   d i s c h a r g e ,
in which F is the Faraday constant and Cv is the total Vanadium concentration. The SoC of the positive and negative electrolytes are respectively as follows:
S o C + = C V / ( C V + C I V ) = C V / C v , S o C = C I I / ( C I I + C I I I ) = C I I / C v ,
where Ci (i = II, III, IV, V) are the concentrations of the Vanadium species V(i) among which V(V)/V(IV) and V(II)/V(III) are the species in the positive and negative electrolytes, respectively. Since the two electrolytes were balanced during the experiments, it was assumed that the positive and negative SoC were equal SoC+ = SoC = SoC. Experimentally, this SoC was deduced from the measured open-circuit voltage OCV of a small cell electrically unloaded and fed with the same electrolytes as the stack, in order to provide the real-time stack OCV. The SoC measurement was calibrated with potentiometric titration, which provided a fair linear regression between OCV and SoC in the OCV range = 1.24–1.58 V, i.e., in the SoC range 10–90%, expressed as follows:
S o C   = 235.3   O C V 281.7 %
The resulting SoC value pertained to the electrolytes at the tank outlets, i.e., stack inlet, whereas the concentration gradients inside the tanks result in space distributions of SoC+ and SoC with different average values.
It is worth noting that tests discussed in this paper were carried out with pristine electrolytes, which had only undergone a pre-charging process which led a V3.5+ condition (CIII = 50% + CIV = 50% in both tanks) to SoC = 0% and SoC+ = 0% (CIII = 100% in the negative tank and CIV = 100% in the positive one), i.e., SoC = 0% of the whole battery. From such condition, three charge/discharge pre-cycles were carried out (at constant α = 10, I = 50 A), and then the tests here discussed were carried out, with electrolytes initially completely balanced and negligible unbalancing effects all along them.

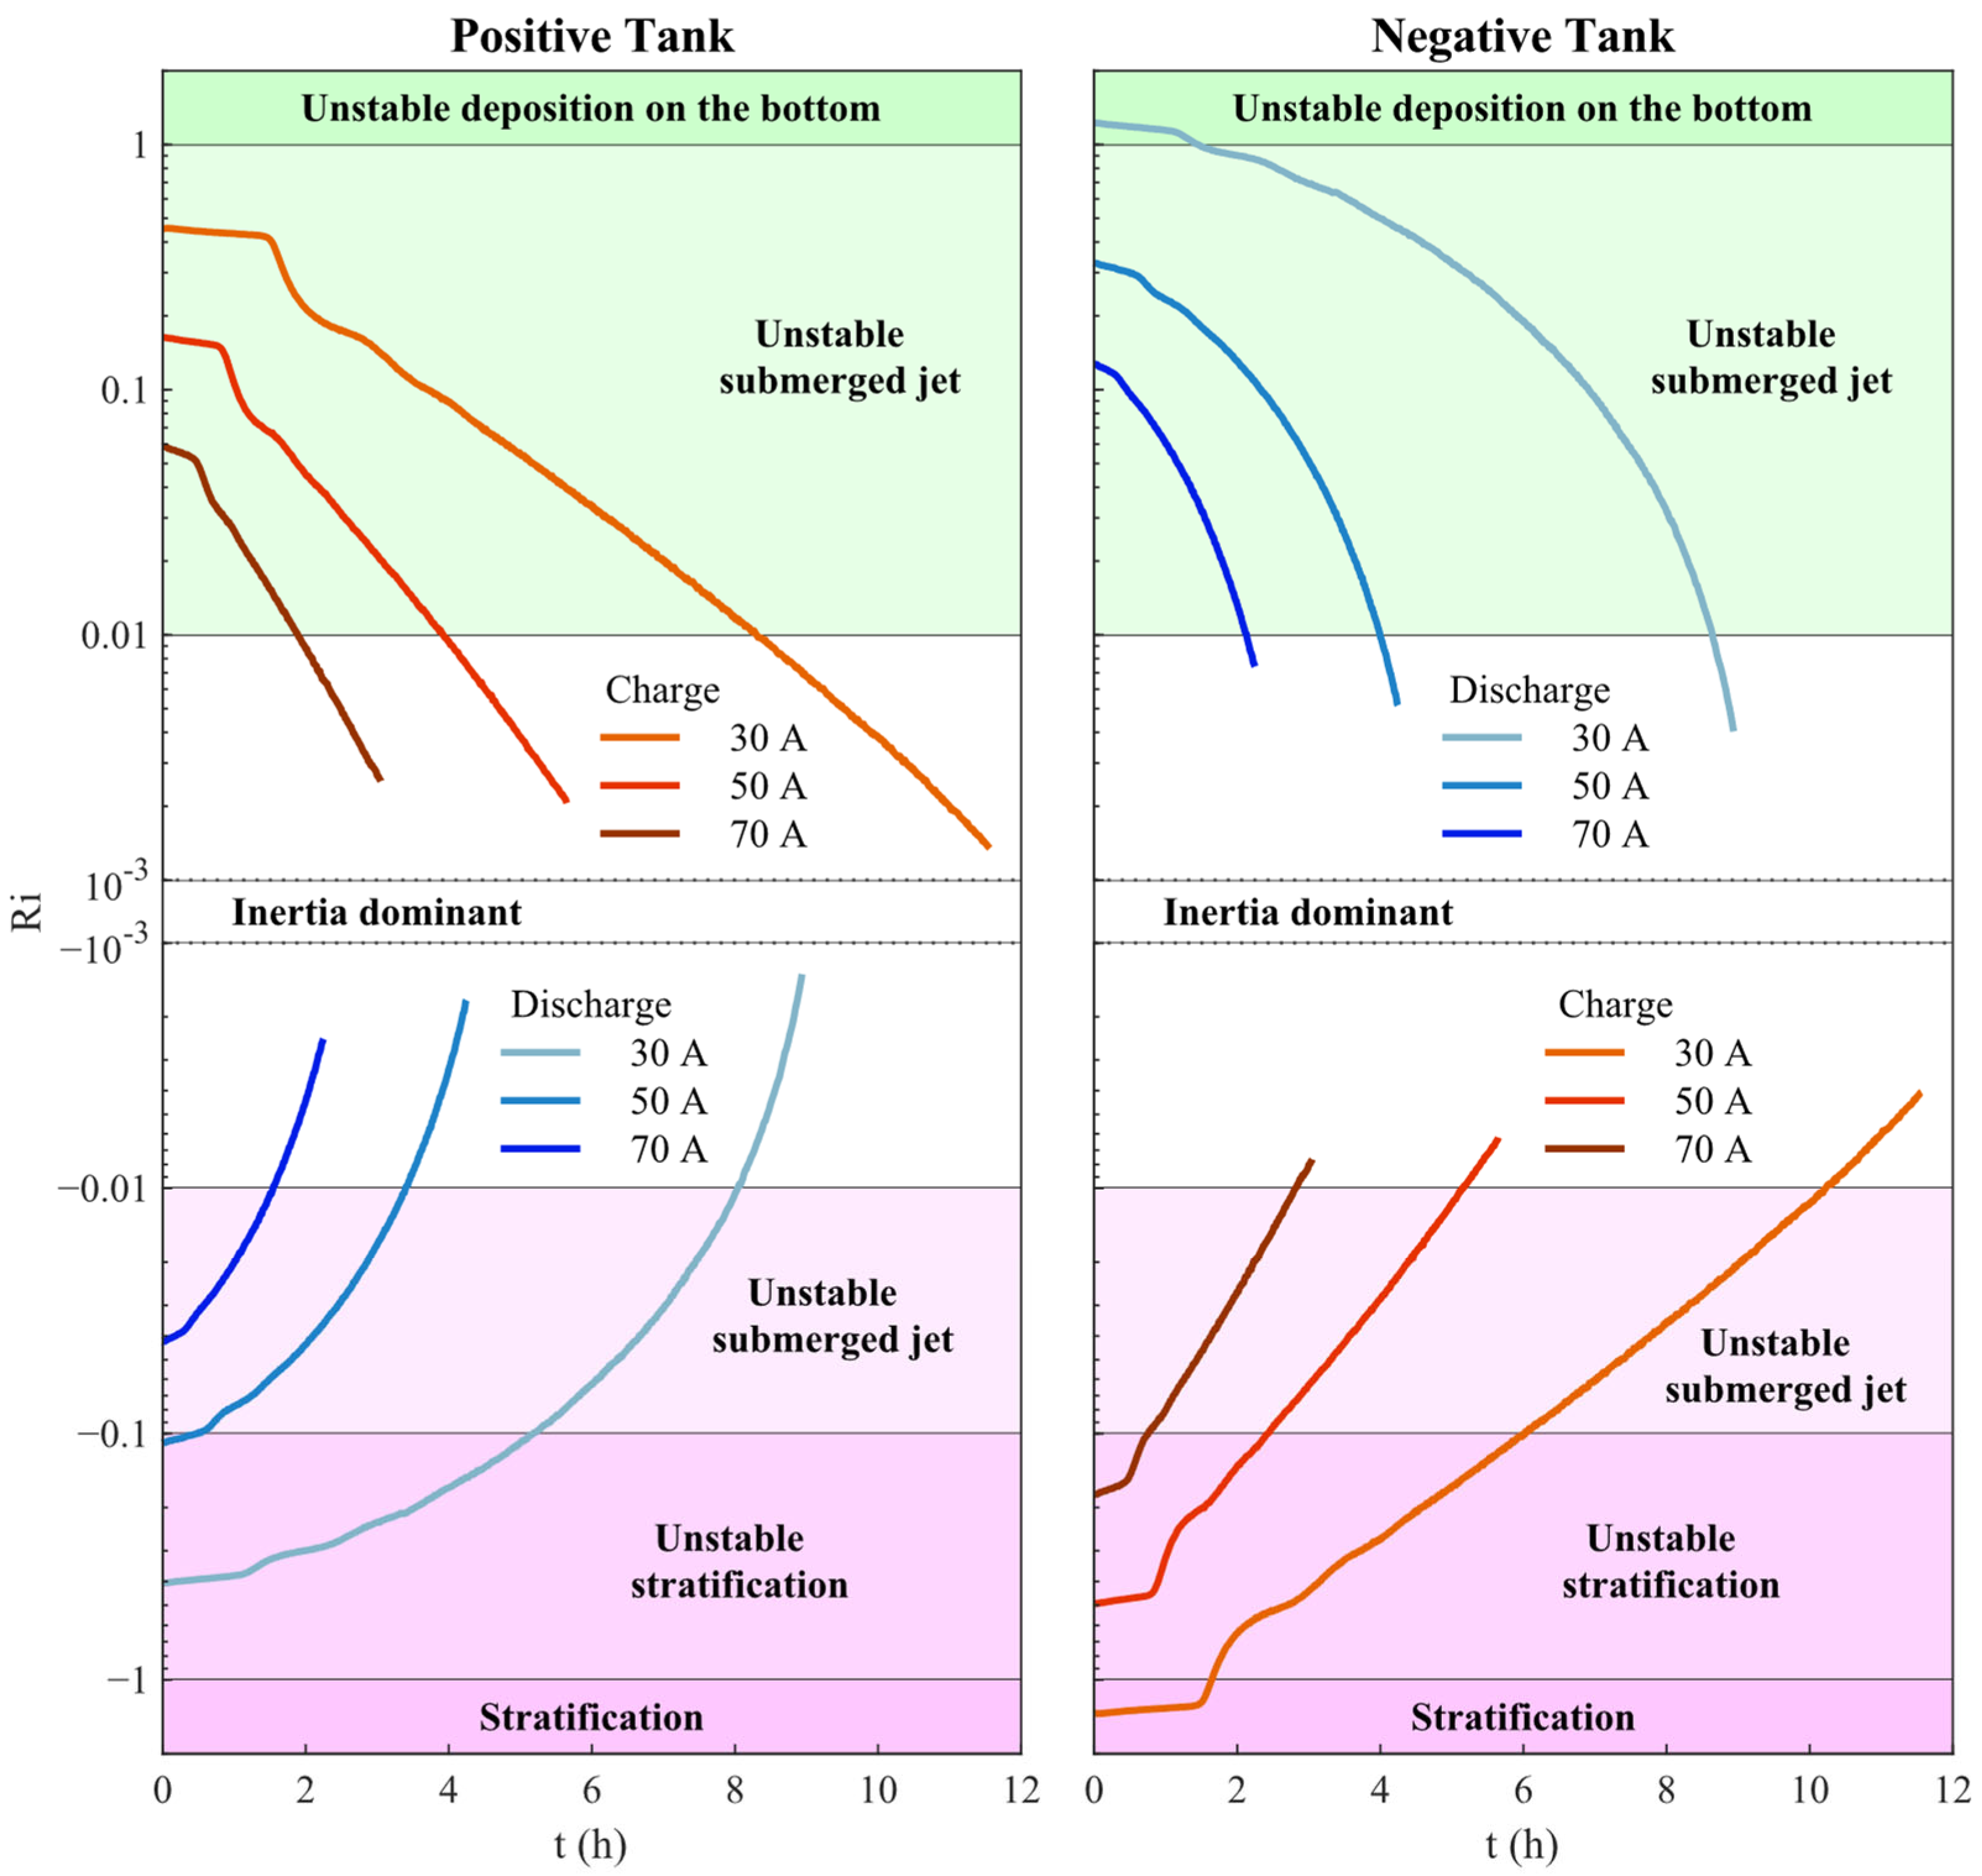
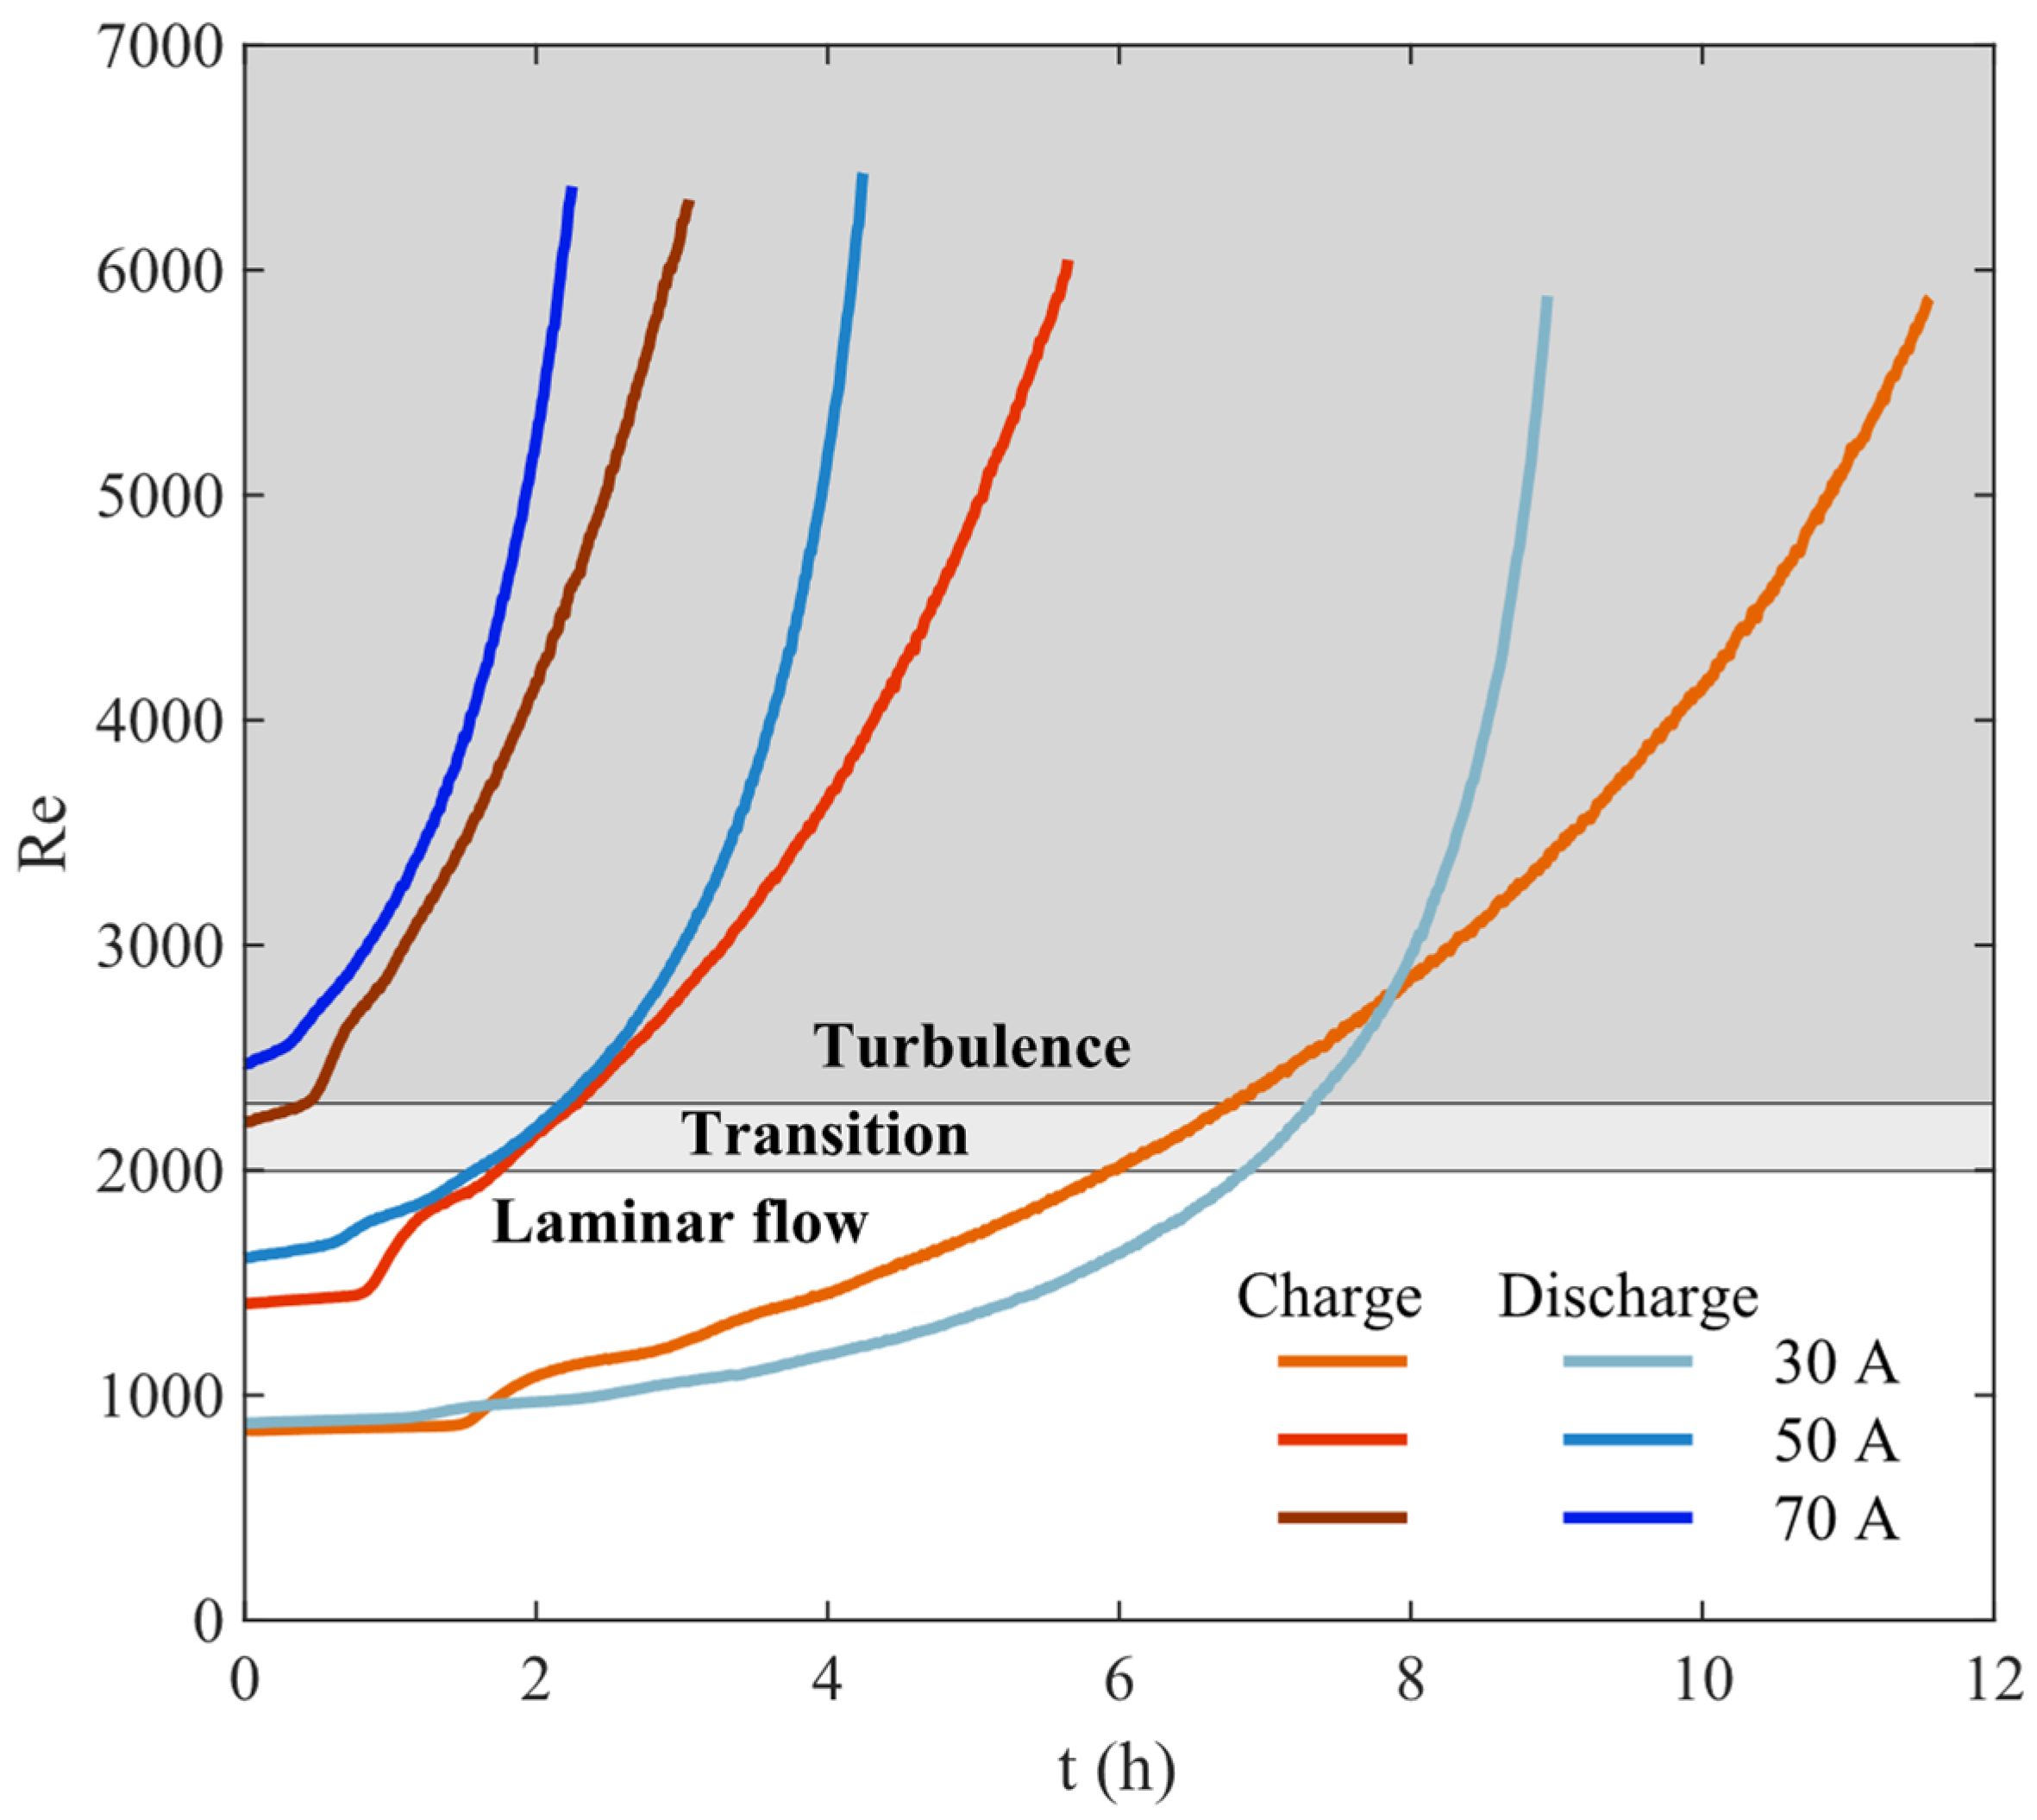
2.3. Fluid Mechanics in the Tanks

The SoC distributions inside the tanks and the difference between their average value and their value at the tanks’ outlets affect the battery performance, so that the electrolyte fluid dynamics inside the tanks deserve being studied. Depending on the operating conditions and tank geometries, different flow regimes may arise within the tanks. These regimes stem from the interplay of conflicting phenomena such as buoyancy (arising from density disparities between charged and discharged species) and inertia (flow shear induced by the momentum of the discharging jet). Since the numerical computation of a three-dimensional transient—and even turbulent—convection field is computationally expensive, an order-of-magnitude estimation approach was adopted, profiting from the results presented in [36]. It was assumed that the density ρj of each electrolyte (j = +,−) depends on both SoCj (i.e., relative species concentrations) and temperature Tj. As regards the dependence on SoCj, a linear regression was considered:
ρ j = ρ 0 j + ρ j S o C j   S o C j ,
where ρ 0 j is a reference density value and the constant partial derivative ρ S o C j = ρ j / S o C j values are reported in Table 1. As regards the dependance on T, a similarly constant partial derivative ρ T j = ρ j / T j = 0.6   k g   m 3 K 1 was deduced from the literature [36,40,41]. Given the small variations of T, the effect of such ρ T j value resulted in a lower-order magnitude compared to ρ S o C j , so that the effects of T were neglected in the experimental data analysis. When an electrolyte flows through the N cell electrodes, it undergoes the dimensionless relative variation of density:
ρ j ρ 0 j = ρ S o C j S o C ρ 0 j ,
being ΔSoC the variation of SoC needed to sustain the stack current I at a given flow rate Q:
S o C = N I F   Q   c v .
Considering negligible the crossover and shunt current effects, the positive and negative electrolytes exhibit the same variation of state of charge, ΔSoC+ = ΔSoC = ΔSoC, and concentrations. Conflicting buoyancy and inertia effects are quantified with the Richardson number:
R i j = ρ j ρ 0 j g H u 2 = ρ S o C j N   I ρ 0   j F   c v   Q π 2   D i n 4 g   H 16   Q 2 ,
where g is gravity, H is the height of the electrolyte-free surface and u the electrolyte average inlet jet velocity into the tank. In the buoyancy estimation, the height of the electrolyte volume is a more representative measurement than the distance between inlet and outlet pipes (Figure 1b), since the former describes the path of an inertia-driven submerged jet. For R i j 1 buoyancy dominates, for R i j 1 inertia does, and for R i j 1 both forces are effective. In addition, a positive Rij is related to stratifications, whereas a negative Rij indicates jets and depositions at the bottom. This approach is extensively described in [36].
The jet flowing from the inlet pipe may be laminar or turbulent, based on the Reynolds number R e = ρ 0 u D i n / μ 0 value, with Din the diameter of the inlet pipe, and ρ0 and μ0 the reference density and viscosity, respectively. Since the density of the two electrolytes are close to each other, the two Re values are also similar, so a unique averaged Re number was used in the computation. As no precise value of the positive reference density ρ0+ was found in the literature for the 1.6 M Vanadium electrolyte, the value reported by Skyllas-Kazacos et al. for a 2 M Vanadium electrolyte was adopted [42]. The densities of both electrolytes exhibited changes under 2% at varying SoC [42], with a resulting of negligible effects on the Re computation. Similarly, viscosity showed fluctuations around 25% for SoC in the range 10–90% at 30 °C [43], exceeding the values of the experiments, and thus they were assumed negligible in a first approximation. Furthermore, the flow rate varied up to 721%, emerging as the main contributor to the Re variability. The viscosity μ0 was computed with a regression at T = 25 °C and SoC = 0% from data reported by Li et al. [43]. Since the tanks are open volumes, the viscosity variations produce secondary changes in the fluid dynamics, so they have been considered negligible for the purpose of this work. Lastly, in all cases studied, the buoyancy effects were considered laminar, so no buoyancy-induced turbulence occurred. The electrolyte used parameters are listed in Table 1.

3. Results

This section presents the experimental results obtained from the IS-VRFB facility. The experiments were carried out at stack currents of 30 A, 50 A, and 70 A, with the flow factor maintained at a constant value of α = 8. This setting is considered representative of common operational protocols for IS-VRFBs, because yielded performance results are comparable to the optimal constant value of α = 7.5 reported by Tang et al. [44] in their study conducted on a 40-cell stack. During the tests, the flow rate Q varied according to Equation (1), depending on the measured stack current I and SoC values. It must be noted that charging and discharging at full battery power would last about 3 h, given the battery capacity (2 × 550 L of electrolytes providing 27 kWh). Indeed, tests were performed at lower powers and currents, so that much longer durations were experimented. The pumps were feedback-controlled to provide electrolyte dynamic flow rate Q consistent with Equation (1). The resulting flow rates are reported in Table 2.
Figure 2 shows the voltage measurements from the OCV cell vs. time, during charge (left) and discharge (right). The tests began with the battery in a standby condition after a period of inactivity, which is a common condition in stationary applications and is the most interesting for showcasing the effect of tank electrolyte fluid dynamics on the battery performance. As expected, the higher I, the shorter the time to reach the cut-off voltage, since the cut-off load voltages were the same in all tests (1.65 V in charge and 1.1 V in discharge). In all tests, and more clearly when charging, an initial quasi-stationary plateau appeared where the OCV varied not more than 0.2 V. The plateau duration tPD was longer as I was lower, being always less than 2 h. After that time, a second step appeared at I = 50 A and two at I = 30 A. After these steps, the OCV curves evolved smoothly. The SoC was computed with Equation (3), showing the same trend as the OCV, given the linear of the equation, characterized by variation delays revealed by the plateaus and steps. The SoC ranged differently, depending on the current and charging/discharging time. The ranges covered during discharge are listed in Table 2. No accurate deduction of coulombic efficiency can be drawn from these results since charge and discharge were run at constant flow factor (α = 8) and were terminated when the flow rates reached the maximum value provided by the pumps (Q ≈ 30 L min−1).

4. Discussion

The observed OCV plateaus during the first two hours of the charge/discharge tests cannot be explained in terms of electrochemical and hydraulic behavior inside the stack cells. To the best of our knowledge, these steps can only be generated by variations in species concentration. Since we started from a SoC ≈ 15%, and the crossover effects played a secondary role, those variations should be attributed to other system components, notably mixing events inside the 550 L tanks. The impact of pipes and pumps which connect the stack to the tanks can be neglected since their fluid residence times are much smaller than those in the tanks and OCV piping [45]. In fact, the total volume of the electrolyte contained inside the main piping and pumps is approximately 3 L for each tank, and the maximum piping residence time is Vp/Q < 1 min for all flow rates considered, i.e., much shorter than the times in which the OCV dynamics under investigation occur.
The SoC are likely related to a piston flow effect inside them, i.e., a downward flow in which the velocity of the electrolyte is evenly distributed around a mean value, causing the electrolyte flowing out the inlet pipe to remain stratified in the upper part of the tank from where it flows slowly downward, toward the outlet pipe, gradually filling the tank volume. The horizontal axis of the inlet pipe increases such piston flow effect. The residence time characterizing this effect tPF is the time required to fill the volume VPF = 349 L of the electrolyte between the inlet and the outlet pipes in the tank, consistently with the following equation:
V P F = 0 t P F Q ( t )   d t .
Plateau durations tPD and piston flow times tPF for each test are compared in Table 3.
Some of the values align with the initial hypothesis, but they tend to overestimate the times in all cases except for the 30 A charging case, where tPF is lower than plateau duration by 8.0%. This underestimation suggests that, in this case, there is an excess volume of electrolyte filling the tank compared to what is expected. Actually, the electrolyte may rise from the inlet, creating a piston flow from the top. This condition can occur if there is a stratification with a negative ∆ρ upward. In the 50 A charging case, the times match better (with a difference of 1.9%), indicating that the piston flow is plausible. However, the 70 A charging case tPF more significantly deviates (9.8%), indicating the potential presence of other types of flows. As regards discharges, tPF consistently overestimates the duration of the plateau, especially as I increases, reaching a difference of 36% at 70 A. Therefore, this hypothesis is not accurate in all cases and particularly not for both tanks.
A more detailed analysis regarding flow estimation for each tank and case uses of the Richardson number Ri of Equation (7) is shown. Figure 3 shows Ri number evolution in the positive (left) and negative (right) tanks for all cases, with annotations about estimations of the dominating fluid dynamics in different Ri ranges. As ρ + > 0 and ρ < 0 during charge and opposite variations occurred during discharge, the tanks exhibited opposite flows. During charge (red lines), the positive tank presented unstable submerged jets, as the Ri values remain lower in the Ri ≈ 1 condition, being more influenced by the buoyancy at 30 A (Ri ≈ 0.45), with inertia playing a major role at 70 A (Ri ≈ 0.06). In all three cases at different I, a high mixing was expected, as the Ri values were not high enough to induce buoyancy and, since ρ + > 0 , to generate significant depositions at the bottom of the tanks. According to Equation (7), the higher I, the stronger the buoyancy effects, but due to the constant α operations, Q increases linearly with I, so the Ri number decreases allowing the charged electrolyte to flow faster toward the tank, increasing jet momentum and therefore the convective mixing. The charged positive electrolyte showed a stronger mixing in all cases, as Ri+ consistently fell within a range influenced by the jet momentum. Conversely, the negative tank (right) showed a higher dependence on buoyancy, leading to stratifications during the plateau phases. These stratifications conformed expectations from the estimations described above. Stratification was more pronounced at 30 A (Ri ≈ −1), where the charged electrolyte filled the entire tank, less prominent at 50 A (Ri ≈ −0.5), where a piston flow filled the tank more rapidly, and even less significant at 70 A (Ri ≈ −0.2), where an unstable flow filled the tank. The plateau originated from the negative tank, where the charged electrolyte tended to stay at the top and only after a time tPF the piston flow effect allowed it to arrive down at the outlet and thereafter to reach the OCV cell. Then, the OCV cell received the charged electrolyte, resulting in the SoC and in a higher Q, as we maintained a constant α. From that time on, Ri values decreased leading to a flow more dominated by the inertia, although at 30 A two more steps appeared (because Ri values did not decrease as fast as in the other cases).
During discharge the roles were inverted, but since ρ S o C = 3 ρ S o C + in Equation (4), the fluid dynamics were not symmetric. The positive tank experienced an unstable stratification at 30 A and the other cases were more related to unstable jets. The negative tank exhibited unstable submerged jets (consistently with Ri > 0.1 and similarly to the positive one during charge), but Ri > 1 at 30 A so that a stronger deposition of the discharged electrolyte occurred at the bottom. However, as the positive tank was producing a stratification, the OCV remained quasi-stationary. In all cases, the plateaus were not as steady as those during charge, as there were more cases related to jets which expanded in the tank faster.
The two steps (30 A) and the one step (50 A) after the initial plateau corresponded to phases when the Richardson numbers produced stratification in one tank and mixing in the other one. At certain times, all cases became highly influenced by inertia, as the volumetric flow increased with the SoC.
As a consequence of the deductions above, it was necessary to compute the Reynolds numbers to estimate the turbulence effect on the mixing when Q is large enough. Figure 4 shows the Reynolds number evolution in each test, also showing the laminar, transition, and turbulence regimes. The 30 A case showed a laminar flow for half of the charge/discharge, indicating that the mixing was mainly due to the natural and mixed convection. The two steps after the initial plateau occurred in the laminar region, consistently with the reduction in mixing. The 50 A case also began in the laminar region, but after 1.6 h, the discharging jet entered a transition regime and then a turbulent regime. The step after the plateau occurred while the jet was laminar and disappeared when the flow entered the turbulent regime. The 70 A case was different. During charge, the jet was very close to a turbulent regime and during discharge a turbulent flow occurred from the beginning. This produced a higher mixing, contributing to reducing the length of the plateau and eliminating steps in the OCV curve. All result in developed turbulent jets, increasing the mixing and smoothing the OCV curves, as the stack received more homogeneously charged electrolytes.
Finally, it must also be noted that the OCV cell signal may have been affected in the measurement. If the pipe feeding the OCV cell presents a significant pressure drop, the electrolyte crossing the OCV cell may have a lower velocity than the main stack pipe, resulting in a signal delay with respect to the electrolyte SoC in the stack. The OCV cell design should minimize this delay. In any case, such an effect is higher when the main flow rate Q is lower. So, although the plateaus are mainly explained and justified by the stratifications of the inlet electrolytes, it is possible that a slight portion of the SoC dynamic delay depends on the OCV cell.

5. Conclusions

The electrolyte flow and mixing inside the tanks may impact on the electrical performance of large industrial-size VRFB, especially if sized for long-duration energy storage. Such an effect has been investigated in this paper, by analyzing experimental data taken on a kW-class VFB test facility rated 9 kW/27 kWh.
The measured delays in the voltage response of the battery in both charge and discharge operation at different currents and constant flow factor were considered. It was found that such delays may arise from two possible reasons. The primary factor was identified as the stratification of the electrolytes flowing into the tanks from the stack. The density variations associated with the different concentrations may result in a stratification when the jet momentum is not predominant (i.e., R i j 1 ). These phenomena generate a piston flow that fills the tank gradually and by steps, taking a characteristic time tPF that depends on the electrolyte volume and flow rate. The Richardson number analysis explains the experimental results with enough precision to suggest that the stratification of the electrolyte is the primary contributing factor to the observed experimental results. The piston flow intensity depends on the position and geometry of the inlet pipes, and the discharging jet has less tendency to flow to the outlet if its axis is placed horizontally rather than vertically.
Our findings highlight the importance of the hydraulic behavior of the electrolyte inside the tanks, resulting in a deviation of the OCV from the expected behavior and thereafter affecting the stack performance. Further study is needed to more accurately identify the different flow regimes which may arise in the tanks and their impact on the stack electrical performance and overall battery capacity. In addition, investigations about the pipe shapes, sizes, and locations would provide more insights into the electrolyte mixing.
The SoC signal delay may also depend on the OCV sensor, which is typically fed in parallel to the pipes which feed the stack and thus its performance depends on the pressure drop in the stack itself. At low pressure, the electrolytes flow slower in that OCV piping that in the stacks. The final effect may be an additional delay to the major one occurring in the tanks. Since the estimation of the SoC via the OCV cell is the usual practice in the industry, these results can shed light on the design of the components of large VFBs.

Author Contributions

Conceptualization, A.T. and P.A.P.-D.; methodology, A.T. and P.A.P.-D.; software, A.T., P.A.P.-D., N.Z. and F.P.; validation, A.T., P.A.P.-D. and N.Z.; formal analysis, A.T. and P.A.P.-D.; investigation, A.T. and P.A.P.-D.; resources, M.G.; data curation, A.T., P.A.P.-D. and N.Z.; writing—original draft preparation, A.T., P.A.P.-D. and N.Z.; writing—review and editing, A.T., P.A.P.-D., F.P. and M.G.; visualization, A.T., F.P. and M.G.; supervision, F.P. and M.G.; project administration, M.G.; funding acquisition, M.G. All authors have read and agreed to the published version of the manuscript.

Funding

This research was funded by the EU funded project MUR-PE000021 Progetto—NextGenerationEU—Piano Nazionale di Ripresa e Resilienza (PNRR)—Mission 4 Component 2 Investment 1.3—Call N. 341 of 15.03.2022 of the Italian Ministero dell’Università e della Ricerca (MUR).

Data Availability Statement

The original contributions presented in the study are included in the article, further inquiries can be directed to the corresponding author.

Conflicts of Interest

The authors declare no conflicts of interest.

References

  1. Amir, M.; Deshmukh, R.G.; Khalid, H.M.; Said, Z.; Raza, A.; Muyeen, S.; Nizami, A.-S.; Elavarasan, R.M.; Saidur, R.; Sopian, K. Energy storage technologies: An integrated survey of developments, global economical/environmental effects, optimal scheduling model, and sustainable adaption policies. J. Energy Storage 2023, 72, 108694. [Google Scholar] [CrossRef]
  2. Kueppers, M.; Pineda, S.N.P.; Metzger, M.; Huber, M.; Paulus, S.; Heger, H.J.; Niessen, S. Decarbonization pathways of worldwide energy systems–Definition and modeling of archetypes. Appl. Energy 2021, 285, 116438. [Google Scholar] [CrossRef]
  3. Bloomfield, H.; Brayshaw, D.; Troccoli, A.; Goodess, C.; De Felice, M.; Dubus, L.; Bett, P.; Saint-Drenan, Y.-M. Quantifying the sensitivity of european power systems to energy scenarios and climate change projections. Renew. Energy 2021, 164, 1062–1075. [Google Scholar] [CrossRef]
  4. Harsini, A.E. Resilience-oriented district energy system integrated with renewable energy and multi-level seasonal energy storage. J. Energy Storage 2023, 72, 108645. [Google Scholar] [CrossRef]
  5. Bovo, A.; Poli, N.; Trovò, A.; Marini, G.; Guarnieri, M. Hydrogen energy storage system in a Multi–Technology Microgrid:technical features and performance. Int. J. Hydrogen Energy 2023, 48, 12072–12088. [Google Scholar] [CrossRef]
  6. Rana, M.; Uddin, M.; Sarkar, R.; Meraj, S.T.; Shafiullah, G.; Muyeen, S.; Islam, A.; Jamal, T. Applications of energy storage systems in power grids with and without renewable energy integration—A comprehensive review. J. Energy Storage 2023, 68, 107811. [Google Scholar] [CrossRef]
  7. Trovo, A.; Di Noto, V.; Mengou, J.E.; Gamabaro, C.; Guarnieri, M. Fast Response of kW-Class Vanadium Redox Flow Batteries. IEEE Trans. Sustain. Energy 2021, 12, 2413–2422. [Google Scholar] [CrossRef]
  8. Yamujala, S.; Jain, A.; Bhakar, R.; Mathur, J. Multi-service based economic valuation of grid-connected battery energy storage systems. J. Energy Storage 2022, 52, 104657. [Google Scholar] [CrossRef]
  9. Jenkins, J.D.; Sepulveda, N.A. Long-duration energy storage: A blueprint for research and innovation. Joule 2021, 5, 2241–2246. [Google Scholar] [CrossRef]
  10. Horton, L. Sustainable Clean Energy–Foundational Research Challenges and Opportunities. In Proceedings of the Plenary Session at 243rd ECS Meeting, Boston, MA, USA, 29 May 2023; Available online: https://www.youtube.com/watch?v=fp1FwUIGwV4 (accessed on 12 April 2024).
  11. LDES Council. Available online: https://www.ldescouncil.com/ (accessed on 29 July 2023).
  12. Zhou, H.; Zhang, R.; Ma, Q.; Li, Z.; Su, H.; Lu, P.; Yang, W.; Xu, Q. Modeling and Simulation of Non-Aqueous Redox Flow Batteries: A Mini-Review. Batteries 2023, 9, 215. [Google Scholar] [CrossRef]
  13. Viswanathan, V.V.; Crawford, A.J.; Thomsen, E.C.; Shamim, N.; Li, G.; Huang, Q.; Reed, D.M. An Overview of the Design and Optimized Operation of Vanadium Redox Flow Batteries for Durations in the Range of 4–24 Hours. Batteries 2023, 9, 221. [Google Scholar] [CrossRef]
  14. Gundlapalli, R.; Jayanti, S. Effective splitting of serpentine flow field for applications in large-scale flow batteries. J. Power Sources 2021, 487, 229409. [Google Scholar] [CrossRef]
  15. Bogdanov, S.; Parsegov, S.; Schubert, C.; Ibanez, F.M.; Pettinger, K.-H.; Pugach, M. Parameter identification algorithm for dynamic modeling of industrial-scale vanadium redox flow batteries. J. Power Sources 2023, 580, 233423. [Google Scholar] [CrossRef]
  16. Di Noto, V.; Vezzù, K.; Crivellaro, G.; Pagot, G.; Sun, C.; Meda, L.; Rutkowska, I.A.; Kulesza, P.J.; Zawodzinski, T.A. A general electrochemical formalism for vanadium redox flow batteries. Electrochim. Acta 2022, 408, 139937. [Google Scholar] [CrossRef]
  17. Arenas, L.F.; de León, C.P.; Walsh, F.C. Redox flow batteries for energy storage: Their promise, achievements and challenges. Curr. Opin. Electrochem. 2019, 16, 117–126. [Google Scholar] [CrossRef]
  18. Aberoumand, S.; Dubal, D.; Woodfield, P.; Parsa, S.M.; Mahale, K.; Pham, H.D.; Tung, T.; Nguyen, H.-Q.; Dao, D.V. Enhancement in vanadium redox flow battery performance using reduced graphene oxide nanofluid electrolyte. J. Energy Storage 2023, 72, 108343. [Google Scholar] [CrossRef]
  19. Roe, S.; Menictas, C.; Skyllas-Kazacos, M. A High Energy Density Vanadium Redox Flow Battery with 3 M Vanadium Electrolyte. J. Electrochem. Soc. 2015, 163, A5023–A5028. [Google Scholar] [CrossRef]
  20. Banerjee, R.; Bevilacqua, N.; Eifert, L.; Zeis, R. Characterization of carbon felt electrodes for vanadium redox flow batteries—A pore network modeling approach. J. Energy Storage 2019, 21, 163–171. [Google Scholar] [CrossRef]
  21. Greco, K.V.; Forner-Cuenca, A.; Mularczyk, A.; Eller, J.J.; Brushett, F.R. Elucidating the nuanced effects of thermal pretreatment on carbon paper electrodes for vanadium redox flow batteries. ACS Appl. Mater. Interfaces 2018, 10, 44430–44442. [Google Scholar] [CrossRef]
  22. Sun, C.; Zlotorowicz, A.; Nawn, G.; Negro, E.; Bertasi, F.; Pagot, G.; Vezzù, K.; Pace, G.; Guarnieri, M.; Di Noto, V. [Nafion/(WO3)x] hybrid membranes for vanadium redox flow batteries. Solid State Ionics 2018, 319, 110–116. [Google Scholar] [CrossRef]
  23. Gandomi, Y.A.; Aaron, D.S.; Mench, M.M. Influence of Membrane Equivalent Weight and Reinforcement on Ionic Species Crossover in All-Vanadium Redox Flow Batteries. Membranes 2017, 7, 29. [Google Scholar] [CrossRef] [PubMed]
  24. Sun, C.; Negro, E.; Nale, A.; Pagot, G.; Vezzù, K.; Zawodzinski, T.A.; Meda, L.; Gambaro, C.; Di Noto, V. An efficient barrier toward vanadium crossover in redox flow batteries: The bilayer [Nafion/(WO3)x] hybrid inorganic-organic membrane. Electrochim. Acta 2021, 378, 138133. [Google Scholar] [CrossRef]
  25. Darling, R.M.; Perry, M.L. The influence of electrode and channel configurations on flow battery performance. J. Electrochem. Soc. 2014, 161, A1381–A1387. [Google Scholar] [CrossRef]
  26. Kumar, S.; Jayanti, S. Effect of flow field on the performance of an all-vanadium redox flow battery. J. Power Sources 2016, 307, 782–787. [Google Scholar] [CrossRef]
  27. Ke, X.; Prahl, J.M.; Alexander, J.I.D.; Wainright, J.S.; Zawodzinski, T.A.; Savinell, R.F. Rechargeable redox flow batteries: Flow fields, stacks and design considerations. Chem. Soc. Rev. 2018, 47, 8721–8743. [Google Scholar] [CrossRef] [PubMed]
  28. Zheng, Q.; Xing, F.; Li, X.; Ning, G.; Zhang, H. Flow field design and optimization based on the mass transport polarization regulation in a flow-through type vanadium flow battery. J. Power Sources 2016, 324, 402–411. [Google Scholar] [CrossRef]
  29. Chen, F.; Cheng, X.; Liu, L.; Han, L.; Liu, J.; Chen, H.; Zhang, Q.; Yan, C. Modification of carbon felt electrode by MnO@C from metal-organic framework for vanadium flow battery. J. Power Sources 2023, 580, 233421. [Google Scholar] [CrossRef]
  30. Kim, J.D.; Park, H. Synergistic effect of nanofluid as catalyst with carbon foam electrode for improved rheological properties of aqueous electrolytes for vanadium redox flow battery. J. Power Sources 2021, 500, 229974. [Google Scholar] [CrossRef]
  31. Poli, N.; Trovò, A.; Fischer, P.; Noack, J.; Guarnieri, M. Electrochemical rebalancing process for vanadium flow batteries: Sizing and economic assessment. J. Energy Storage 2023, 58, 106404. [Google Scholar] [CrossRef]
  32. Bhattarai, A.; Ghimire, P.C.; Whitehead, A.; Schweiss, R.; Scherer, G.G.; Wai, N.; Hng, H.H. Novel approaches for solving the capacity fade problem during operation of a vanadium redox flow battery. Batteries 2018, 4, 48. [Google Scholar] [CrossRef]
  33. Trinidad, P.; Walsh, F.C.; Gilroy, D. Conversion expressions for electrochemical reactors which operate under mass transport controlled reaction conditions, Part I: Batch reactor, PFR and CSTR. Int. J. Engng. 1998, 14, 431–441. [Google Scholar]
  34. Tang, A.; Ting, S.; Bao, J.; Skyllas-Kazacos, M. Thermal modelling and simulation of the all-vanadium redox flow battery. J. Power Sources 2012, 203, 165–176. [Google Scholar] [CrossRef]
  35. Wang, Y.; Smith, K.C. Numerical investigation of convective transport in redox flow battery tanks: Using baffles to increase utilization. J. Energy Storage 2019, 25, 100840. [Google Scholar] [CrossRef]
  36. Prieto-Díaz, P.A.; Ibáñez, S.E.; Vera, M. Fluid dynamics of mixing in the tanks of small vanadium redox flow batteries: Insights from order-of-magnitude estimates and transient two-dimensional simulations. Int. J. Heat Mass Transf. 2023, 216, 124567. [Google Scholar] [CrossRef]
  37. Trovò, A.; Poli, N.; Guarnieri, M. New strategies for the evaluation of Vanadium Flow Batteries: Testing prototypes. Curr. Opin. Chem. Eng. 2022, 37, 100853. [Google Scholar] [CrossRef]
  38. McArdle, S.; Marshall, A.T. Why electrode orientation and carbon felt heterogeneity can influence the performance of flow batteries. J. Power Sources 2023, 562, 232755. [Google Scholar] [CrossRef]
  39. Trovo, A.; Guarnieri, M. Battery management system with testing protocols for kW-class vanadium redox flow batteries. In Proceedings of the 2020 2nd IEEE International Conference on Industrial Electronics for Sustainable Energy Systems (IESES), Cagliari, Italy, 1–3 September 2020; pp. 33–38. [Google Scholar] [CrossRef]
  40. Mousa, A. Chemical and Electrochemical Studies of V (III) and V (II) Solutions in Sulfuric Acid Solution for Vanadium Battery Ap-plications. Ph.D. Thesis, University of New South Wales, Sydney, Australia, 2003. [Google Scholar]
  41. Ressel, S.; Bill, F.; Holtz, L.; Janshen, N.; Chica, A.; Flower, T.; Weidlich, C.; Struckmann, T. State of charge monitoring of vanadium redox flow batteries using half cell potentials and electrolyte density. J. Power Sources 2018, 378, 776–783. [Google Scholar] [CrossRef]
  42. Skyllas-Kazacos, M.; Cao, L.; Kazacos, M.; Kausar, N.; Mousa, A. Vanadium electrolyte studies for the vanadium redox battery—A review. ChemSusChem 2016, 9, 1521–1543. [Google Scholar] [CrossRef] [PubMed]
  43. Li, X.; Xiong, J.; Tang, A.; Qin, Y.; Liu, J.; Yan, C. Investigation of the use of electrolyte viscosity for online state-of-charge monitoring design in vanadium redox flow battery. Appl. Energy 2018, 211, 1050–1059. [Google Scholar] [CrossRef]
  44. Tang, A.; Bao, J.; Skyllas-Kazacos, M. Studies on pressure losses and flow rate optimization in vanadium redox flow battery. J. Power Sources 2014, 248, 154–162. [Google Scholar] [CrossRef]
  45. Chen, H.; Li, X.; Gao, H.; Liu, J.; Yan, C.; Tang, A. Numerical modelling and in-depth analysis of multi-stack vanadium flow battery module incorporating transport delay. Appl. Energy 2019, 247, 13–23. [Google Scholar] [CrossRef]
Figure 1. (a) IS-VRFB scheme with stack, tanks, hydraulic piping, and instrumentation, including electrolyte flow-meters F1 and F2, electrolyte level sensors L1 and L2, electrolyte differential pressure gauges DP1 and DP2, electrolyte input temperature T1 and T3, and output temperatures T2 and T4 gauges. P1 and P2 are the electrolyte pumps, FBMS the Flow Battery Management System, and PCS the Power Conditioning System. (b) Tank tech drawing with outlet flow (red arrows), and inlet flow (blue).
Batteries 10 00133 g001
Figure 2. Time evolution of the OCV during charge (left) and discharge (right) at I = 30, 50, 70 A and constant α = 8, reporting the Q and stack voltage values at the end of each charge/discharge.
Batteries 10 00133 g002
Figure 3. Evolution of Richardson number vs. time during charge (red lines, above) and discharge (blue lines, below) in the positive tank (left) and negative tank (right) at I = 30, 50, 70 A.
Batteries 10 00133 g003
Figure 4. Evolution of Reynolds number vs. time during charge (red lines) and discharge (blue lines) at I = 30, 50, 70 A.
Batteries 10 00133 g004
Table 1. Electrolyte properties used in the order-of-magnitude estimate model.
ParameterValueReferences
ρ 0 + 1381   k g   m 3 [42]
ρ 0 1374   k g   m 3 [41]
ρ S o C + 10   k g   m 3 [36,42]
ρ S o C 30   k g   m 3 [36,41,42]
c v 1.6   M -
μ 0 5.312 · 10 3   P a   s [43]
Table 2. SoC and Q ranges reached in the tests performed at three current values.
I [A]SoC Range [%]Q [L min−1]
3017–634.2–30.3
5023–567.8–32.6
7029–5211.8–32.3
Table 3. Plateau duration tPD and piston flow times tPF for each charge/discharge cycle.
CurrentChargeDischarge
I [A]tPD [h]tPF [h]tPD [h]tPF [h]
301.4981.3871.1821.328
500.8130.8290.6160.717
700.4710.5220.2970.464
Disclaimer/Publisher’s Note: The statements, opinions and data contained in all publications are solely those of the individual author(s) and contributor(s) and not of MDPI and/or the editor(s). MDPI and/or the editor(s) disclaim responsibility for any injury to people or property resulting from any ideas, methods, instructions or products referred to in the content.

