Abstract
The development of accurate dynamic battery pack models for electric vehicles (EVs) is critical for the ongoing electrification of the global automotive vehicle fleet, as the battery is a key element in the energy performance of an EV powertrain system. The equivalent circuit model (ECM) technique at the cell level is commonly employed for this purpose, offering a balance of accuracy and efficiency in representing battery operation within the broader powertrain system. In this study, a second-order ECM model of a battery cell has been developed to ensure high accuracy and performance. Modelica, an acausal and object-oriented equation-based modeling language, has been used for its advantageous features, including the development of extendable, modifiable, modular, and reusable models. Parameter lookup tables at multiple levels of state of charge (SoC), extracted from lithium-ion (Li-ion) battery cells with four different commonly used cathode materials, have been utilized. This approach allows for the representation of the battery systems that are used in a wide range of commercial EV applications. To verify the model, an integrated EV model is developed, and the simulation results of the US Environmental Protection Agency Federal Test Procedure (FTP-75) driving cycle have been compared with an equivalent application in MATLAB Simulink. The findings demonstrate a close match between the results obtained from both models across different system points. Specifically, the maximum vehicle velocity deviation during the cycle reaches 1.22 km/h, 8.2% lower than the corresponding value of the reference application. The maximum deviation of SoC is limited to 0.06%, and the maximum value of relative voltage deviation is 1.49%. The verified model enables the exploration of multiple potential architecture configurations for EV powertrains using Modelica.
1. Introduction
Technological advancements in the area of energy storage are expected to accelerate the transition to a global energy sector with a significant reduction in air pollutant emissions by limiting the combustion of fossil fuels. Among other benefits, these advancements will enable the maximum possible exploitation of renewable energy sources (RES) through temporal power flexibility and the electrification of mobility. The ongoing progress in research, industry, and policymaking positions lithium-ion batteries as a key solution in the field of energy storage.
From a technological perspective, the turning point for the establishment of lithium-ion batteries as a mass energy storage option is marked by several breakthroughs: (i) a significant increase in battery energy and power density, thereby reducing raw material costs; (ii) the optimization of the life-cycle logistics of raw materials in a sustainable and environmentally friendly manner; and (iii) the optimal integration of batteries within broader energy systems, such as electric vehicles (EVs), distributed generation plants, and large continental power grids. A key process in achieving the latter is creating an efficient and accurate framework for battery modeling.
In this respect, battery models should have the capability to couple with models of multi-domain physical systems. For example, an EV includes mechanical, electrical, electronic, and hydraulic subsystems that should be studied at the level of an integrated system. The authors of [] define two approaches to performing multi-domain modeling: co-simulation of specialized professional software for each subdomain; or utilization of a unified multi-domain modeling language. The first approach is associated with specific difficulties for broad system modeling, namely, increased costs for using multiple software products and technical difficulties in model coupling and solver setup. The second approach offers the advantageous feature of convenient coupling between system models. Modelica, an acausal, object-oriented language governed by mathematical equations to model multi-domain cyber–physical systems from first principles with the advantage of extendable, modifiable, modular, and reusable models, belongs to this category [].
Battery models that are widely used can be classified into three main categories: (i) electrochemical models []; (ii) data-driven models (e.g., artificial neural network–ANN) []; and (iii) equivalent circuit models (ECMs) [,]. Batteries are integrated within broader systems, such as, in the case of EVs, through a battery management system (BMS) that targets optimal performance in terms of energy efficiency, safety, and remaining lifetime. On top of that, an adequate balance between model accuracy and computational complexity is necessary. For this purpose, the ECM is widely selected since it enables the representation of battery operation dynamics without delving into complex electrochemical internal phenomena, yet ensuring high accuracy within its applicable scope and the ability to conveniently couple with a thermal model []. This is achieved by limiting the large computational power needed by electrochemical models and the large experimental datasets needed by ANN models. ECM utilizes an equivalent electrical circuit to capture the battery response dynamics. The circuit encompasses parameterized components of a voltage source, a series resistor, and multiple resistor-capacitor (RC) branches.
Recent research includes several case studies on the implementation of battery ECMs for integration into EV applications using equation-based modeling languages. In ref [], an ECM with a capacity degradation component has been developed with Modelica for a lithium iron phosphate (LFP) lithium-ion (Li-ion) battery cell. Manufacturer datasheets and test cycles have been used to validate the cell model with a maximum error of 11.5 mV. The simulations refer only to a single-cell operation and do not focus on the battery pack and its integration within an EV. Bairwa et al. [] have designed a battery model to create an EV powertrain system model with MATLAB Simulink in order to evaluate the performance of different combinations of possible battery and motor technologies. The findings contribute to the efficient modeling of EV powertrains. However, the battery pack has been modeled as a single cell, and the utilized ECM topology differs from the usual selection as it consists of a series resistor and two capacitors. Additionally, the applied load refers to a short period of 20 s and, most importantly, is not related to any standardized driving cycle. In [], the authors have developed an integrated EV system model in MATLAB Simulink to study the behavior of the Mercedes-Benz EQS 350 under the Worldwide Harmonized Light Vehicles Test Procedure (WLTP) driving cycle. The adoption of a multi-domain approach and the utilization of the WLTP cycle are important for EV simulation, but the effect of the battery pack is completely ignored. Meszaros et al. [] have considered a battery cell model with 1 RC branch for an EV powertrain system model, along with vehicle dynamics, electric motor, and power electronics models, to examine different options in braking control for the maximization of recuperated energy. The authors have performed simulations for the Urban Dynamometer Driving Schedule (UDDS) driving cycle. Even though a valuable EV system model integrating dynamic models of all power and mechanical subsystems is presented and simulated for a well-known driving cycle, there is no comparison against experimental data or the results of relevant and reliable software. Moreover, the outdated advanced vehicle simulator (ADVISOR) database for Toyota Prius and guess values have been utilized for the selection of system parameters. Adegbohun et al. [] utilized MATLAB/Simulink to model and simulate an EV powertrain, with results compared against drive cycle test measurements. However, they employed a significantly simplified battery model comprising a constant voltage source and a constant internal resistance, neglecting transient voltage response and dependence on variable state of charge (SoC) and temperature. In [], a commercial Modelica library dedicated exclusively to cell-level battery modeling with ECM is introduced. However, the parameter estimation stage is only accessible through the purchase of proprietary battery and optimization libraries developed by Modelon, and no validation or verification results for battery or vehicle operation are provided. Qin et al. [] have reproduced an ECM battery model of an LFP battery cell using the Modelica language, incorporating hysteresis effects and a third-order circuit. The model was validated after applying the UDDS driving cycle with an average error of 0.23%, yet only at a cell level. The battery model was integrated into a multi-domain EV system model with MWorks, which includes a permanent magnet synchronous motor (PMSM), controller, driver, and mechanical components. The system was simulated under the New European Driving Cycle (NEDC) but only the theoretical vehicle mileage was used as a verification indicator, with a deviation of 0.54% between this value and the simulation results.
This work aims to fill the aforementioned research gaps in the development of ECM battery models for EV applications, leveraging physical modeling languages. For this purpose, a second-order ECM with Modelica is developed. Parameter lookup tables, dependent on the SoC, for four commercial Li-ion cells with different chemistry types have been considered. To ensure acceptable model accuracy for battery integration into EV applications, a model of the entire EV system is created using Modelica, and the simulation results are compared against a MATLAB reference application for verification purposes. Customized dynamic models have been developed for the motor, the power converter, the control unit, the energy recuperation due to regenerative braking, the driver actions, and the thermal and mechanical subsystems. The widely approved US Environmental Protection Agency (EPA) Federal Test Procedure (FTP-75) driving cycle is applied as a requested velocity profile, allowing for the evaluation of the developed model in real-world scenarios and providing comprehensive insights into battery and vehicle energy performance, including remaining SoC, energy consumption, and fuel economy. The simulations have been performed using the Dymola integrated development environment, which supports the Modelica language and integrates numerical tools for model translation and simulation. The monitored output variables have been compared against the corresponding results of the MATLAB application at different system points, encompassing the battery pack, the motor, and the vehicle body. By constructing a tested virtual EV representation model that covers a wide range of battery chemistry type options using the Modelica language, this work paves the way for exploring and assessing the energy performance of various battery–powertrain coupling configurations in terms of specifications and architecture.
In a nutshell, the main contributions of this work, compared to previous studies, lie in the following:
- The creation of Modelica-based cell-level battery models using the second-order ECM representation technique;
- The utilization of parameter lookup tables with dependence on SoC for four commercial Li-ion battery cells with different chemistry type;
- The integration of the battery model with electrical, mechanical, thermal. and control subsystems into an EV-level model that is exclusively designed with Modelica;
- The evaluation of battery performance under an EV simulation using the standardized FTP-75 driving cycle;
- The verification of the model results against a well-established MATLAB EV reference application.
2. Materials and Methods
2.1. Equivalent Circuit Model Background
The most widespread battery cell modeling technique that ensures a good trade-off between accuracy and computational complexity is the ECM [,]. This combination is key for reproducibility within an effective BMS, where high accuracy and minimum possible computational time must be ensured. The ECM technique represents the complex internal electrochemical phenomena of the battery cell through an equivalent circuit of electrical components: a voltage source, a single resistor, and n parallel resistor–capacitor subcircuits connected in series. The ECM order number n can vary to achieve the desired characteristics for each application, but generally, the second-order (n = 2) ensures an effective balance between model computational complexity and accuracy. The topology of a second-order equivalent electric circuit is presented in Figure 1.
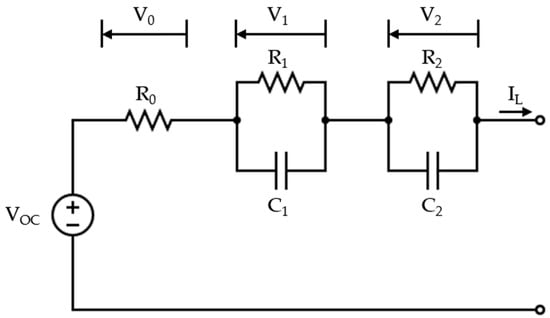
Figure 1.
Schematic representation of the topology of a second-order equivalent circuit model.
In the circuit, the voltage source is denoted as VOC in the figure circuit and is called the open-circuit voltage. The voltage drop V0 across the series resistor, denoted as R0 in the circuit, represents the instantaneous voltage drop due to an applied current profile. The transient voltage drops V1 and V2 across the 2 RC branches, denoted as R1-C1 and R2-C2 in the circuit, capture the diffusion effect through their corresponding time constants. IL is the current supplied by (positive) or injected into (negative) the battery cell through its terminals.
The equation set of the second-order ECM is as follows:
Characterization tests may include (i) the capacity test; (ii) the pulse discharge test; and (iii) the hybrid pulse power characterization (HPPC) test. Voltage response is monitored, and the measurements are used for parameter fitting. A detailed description of the implementation of the parameter extraction process through experimental measurements is provided in []. Tran et al. [] recently published parameter datasets extracted from measurements of four different Li-ion battery chemistry types, listed in Table 1. These types, classified by the positive electrode material, are lithium iron phosphate (LFP), lithium manganese oxide (LMO), lithium nickel cobalt aluminum oxide (NCA), and lithium nickel manganese cobalt oxide (NMC). The authors validated the battery model for each chemistry type through two different applied current profiles. The extracted OCV–SOC curves and the parameter lookup tables for each Li-ion chemistry type are retrieved from this source and are reproduced in this study. These cells refer to four commonly used chemistry types in EV battery applications, which is crucial for reproducing the model developed in this research work for a wide range of applications with different operating requirements (e.g., high-power or high-energy battery cells could be selected depending on the application).

Table 1.
Cell specifications for each chemistry type. Data from [].
2.2. Battery Model Implementation with Modelica
The graphical representation of the single-cell model developed with Modelica within the Dymola user interface is presented in Figure 2. In the electrical domain, a variable voltage source component is used to incorporate the open-circuit voltage, while the series resistor and 2 RC branches correspond to the Rs and R1-C1 and R2-C2 circuit elements, respectively, according to the notation in Section 2.1. The battery terminals correspond to the positive and negative pins. The SoC is continuously estimated based on the applied terminal current, with the available capacity varying depending on cell temperature and whether charging or discharging is underway, as seen in the highlighted available capacity calculation area. In the thermal domain, heat is stored through a heat capacitor with a mass equal to the battery cell mass, and heat transfer with the surroundings occurs through convection. The cooling load for maintaining the temperature value within desired levels is calculated using a PI controller. The cell quantities are scaled up to the entire pack level, based on the number of cells connected in series and in parallel within the battery pack configuration. Alternatively, the model can automatically create as many cell models as the battery cells and establish predefined connections. However, since capacity imbalance between cells is neglected in this study, the scaled model is used.
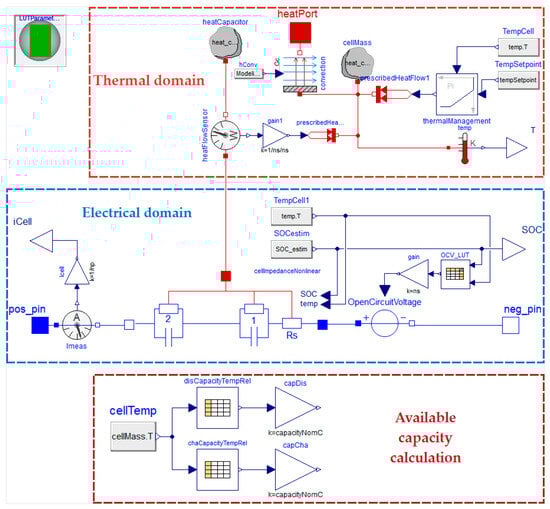
Figure 2.
Battery model within the Dymola graphical user interface.
A key remark for model replication is that although users can currently select the lookup table parameters from the four available chemistry types, the modeling technique based on parameter lookup tables allows for the extension of the model application to account for any battery parameter dataset extracted from Li-ion battery cells after the characterization tests described in Section 2.1.
2.3. EV Model with Modelica
To verify the developed battery model, an EV application has been selected as a test case. The well-documented MATLAB/Simscape EV reference application [] is chosen from several available software solutions for EV simulation for benchmarking the developed models. This application focuses on EV system-level simulation, taking into account all of its powertrain and control subsystems.
These include the following:
- The driver’s control actions to close the gap between the requested and actual vehicle velocity;
- The battery controllers that ensure operation within the allowed technical limits;
- The power recovery through regenerative braking;
- The EV powertrain, including physical models of the battery pack (array of cells connected in series and in parallel), the electric motor, the electric drive, and the mechanical drivetrain of the vehicle.
The EV system-level model is presented in Figure 3. The model consists of subsystems for the driver, powertrain control module, electric plant, and drivetrain. Based on the input velocity profile, the controllers actuate on the EV powertrain, which, in turn, transfers the required power to the vehicle drivetrain.
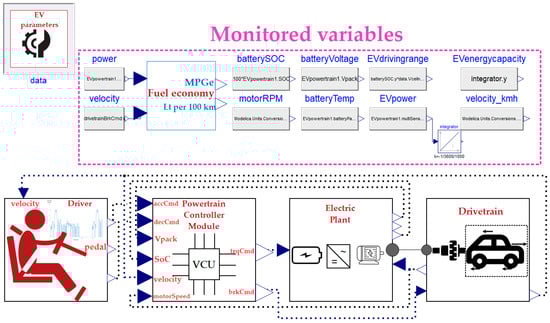
Figure 3.
System-level model of an electric vehicle application within the Dymola graphical user interface.
2.3.1. Driver Subsystem
The driver subsystem models the user response to the requested velocity profile through a proportional controller. A normalized signal of the pedal position command is adjusted to minimize the error between the velocity profile and the measured vehicle body velocity. These signal values range from −1 to 0 when decelerating and from 0 to 1 when accelerating. The output command is fed to the powertrain control unit.
2.3.2. Powertrain Control Module Subsystem
The powertrain control module (PCM) is the operation control center of the EV. Based on the requested pedal position from the driver subsystem, the torque that should be applied by the motor is produced as the output, considering the operating limits. Intermediate blocks limit discharge or charge power according to SoC and current limits and arbitrate torque according to the wheels’ rotational speed. Additionally, a power management algorithm is incorporated into the PCM block. As well as complying with power limits, it estimates the required electric power to supply the necessary mechanical power based on the motor efficiency map. The efficiency map of the EV motor used for the simulations is retrieved from predefined tables of the MATLAB application and is plotted in Figure 4.
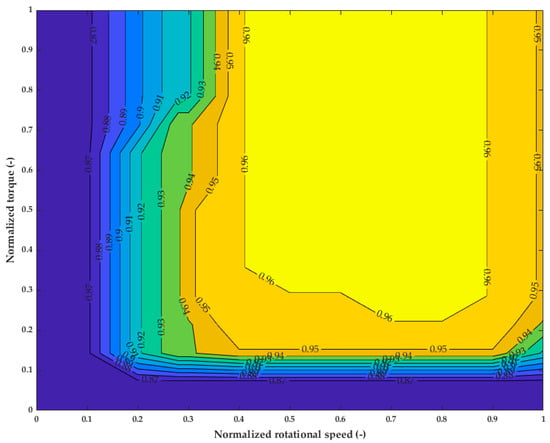
Figure 4.
EV motor efficiency map used for the simulations.
For deceleration, based on the deceleration normalized command (−1 to 0), the brake pressure applied to the wheels is calculated. The maximum available regenerative torque is then calculated and exploited for motor braking. The mechanical parts of the transmission system and the dependence of the regenerative torque on the vehicle’s instant speed are considered. The regenerative torque limits the torque applied by the brake on the wheel during deceleration. The regenerative torque is subtracted from the total required brake torque, and the residual output torque feeds the drivetrain subsystem, where it is applied to the vehicle wheels.
2.3.3. Electric Plant Subsystem
The electric plant subsystem models all vehicle components involved in power transfer, including the battery, power converter, and motor. The battery pack model is based on the battery cell model described thoroughly in Section 2.1 and can provide instantaneous response estimations of battery voltage and SoC for the selected cell specifications (e.g., configuration, chemistry type, capacity). Inside the electric drive subsystem, the operation of both the motor and power converter is incorporated. Depending on the instantaneous value of the wheels’ rotation speed, the requested torque is limited. A tabular characteristic torque-speed curve should be imported into the model.
Furthermore, the motor efficiency map, also used in the PCM unit, is employed to consider the electric drive losses. The final power demand consumption is modeled by a variable resistance, continuously adjusted by an integrator, and connected to the battery pack terminals.
2.3.4. Drivetrain Subsystem
To proceed with the EV system simulation, a drivetrain model is also necessary. However, since this study focuses on the electric propulsion system, the drivetrain model can be kept simple and efficient in terms of computational time. The forces applied to the vehicle body include the motor tractive force, the braking force, the aerodynamic drag force, and the rolling resistance force. A flat ground is considered, neglecting the effect of gravitational force on vehicle motion. The corresponding model is built using components from the Modelica Standard Library 4.0.0 [] by extending the main idea of the drivetrain model from the Electric and Hybrid Power Trains (EHPT) library [], as presented in Figure 5.
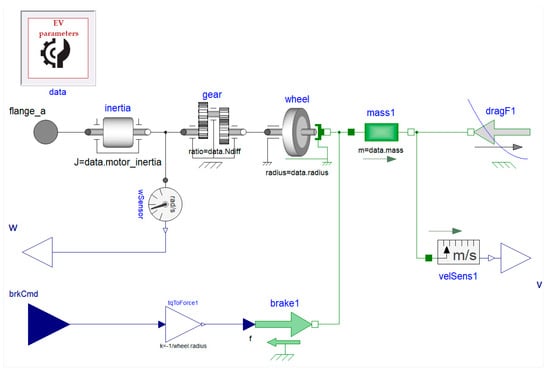
Figure 5.
The drivetrain model developed within the Dymola graphical user interface.
2.4. EV Model Modifications with MATLAB Simscape
To proceed with a meaningful comparison of the two EV system-level models, a prerequisite step is to apply the necessary simplifications to the detailed existing drivetrain model of the MATLAB EV application to align with the Modelica model described in Section 2.3. In the available MATLAB application model, three degrees of freedom are considered for vehicle body motion, and whether differential axle coupling is made to the front or rear wheel is taken into account to provide high-accuracy quantity estimations for the interacting mechanical parts. To prevent potential errors in the verification process arising from the complex modeling of mechanical components, a more simplified approach is followed. As a result, a simplified model is developed within the Simulink environment using the Simscape libraries, as shown in Figure 6.
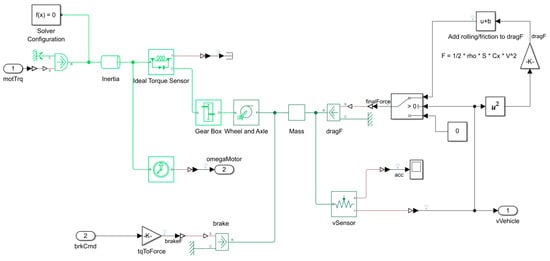
Figure 6.
Simplified drivetrain model developed in MATLAB Simulink environment.
3. Results
3.1. Model Verification Setup
As mentioned in Section 2.3, a MATLAB EV reference application has been selected to verify model results. The developed models are simulated in the Dymola user interface. The FTP-75 driving cycle, introduced by the US EPA [], has been used to import the user velocity profile for model verification. Furthermore, the model input parameters and assumptions must be common in both software applications. The input data for both applications are categorized as follows:
- Overall EV technical parameters;
- User velocity profile;
- Battery specifications;
- Electric motor specifications.
The parameters used for the simulations in both models to achieve a meaningful comparison of the results are listed in Table 2. All of the required inputs are retrieved through a combination of available data from the MATLAB application and the EHPT Modelica library.
Table 2.
Parameters used for model verification in both software.
The common assumptions for both cases include the simplification of drivetrain mechanical interactions and the neglect of gravitational effect due to road slope. Additionally, four passengers are considered inside the EV cabin, and the initial SoC is assumed to be 75%.
Moreover, to proceed with a proper evaluation of the simulation results, some critical quantities have been selected to verify the accuracy of the developed models at certain system points. These include the following:
- The vehicle velocity against the requested velocity profile (driving cycle);
- The deviation between simulated and requested vehicle velocity;
- The current supplied to/by the battery by/to the motor;
- The power supplied to/by the battery by/to the motor;
- The battery pack state of charge;
- The voltage at battery pack terminals;
- The torque applied by the motor;
- The motor rotational speed;
- The fuel economy;
- The brake, drag, and rolling resistance forces applied to the vehicle body.
3.2. Model Verification Results
The key verification results of the battery models are presented in this section. Results at all EV system points indicate a strong match between the results of the developed models and the MATLAB reference application. Specifically, in Figure 7a, the simulated vehicle velocity is plotted against the requested velocity profile imported by the FTP-75 driving cycle, along with the corresponding MATLAB results. The operation of all subsystems, including the designed control process, ensures that the desired driving behavior is achieved through the developed models. In Figure 7b, relatively low values of instantaneous deviation between the desired and output velocity are observed, further affirming model validity. The maximum absolute value of 0.34 m/s is equivalent to 1.22 km/h, which can be considered acceptable given that the latency of the driver’s response is taken into account. This value is 8.2% lower than the maximum absolute value of the MATLAB application, which is 1.33 km/h. It can also be seen that the amplitude of velocity deviation spikes is lower compared to the MATLAB application.
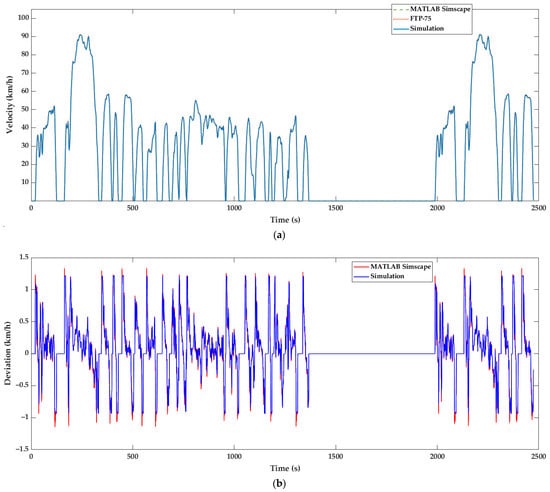
Figure 7.
Vehicle velocity simulation results compared with MATLAB reference application: (a) velocity against the FTP-75 velocity profile; (b) velocity deviation from the FTP-75 velocity profile.
The simulation results associated with the battery pack are presented in the next figures. In Figure 8a, the evolution of the battery voltage throughout the FTP-75 cycle is plotted against the corresponding results from MATLAB. As can be seen, the voltage curve consistently follows the trend of the transient response incorporated in the MATLAB simulations. The maximum value of the relative deviation equals 1.49% during steep changes in desired velocity. In Figure 8b, by convention, the current is positive when injected into the battery and negative when supplied by the battery. Multiple spikes denote that current changes sharply to achieve rapid changes in velocity rate of change, i.e., vehicle acceleration. A slight difference observed in the amplitude of a few instantaneous current spikes can be associated with a similar deviation in the torque requested by the driver control subsystem described in the related figure. This amplitude deviation is carried to the SoC graph in Figure 9a, where the maximum deviation between simulation results and the MATLAB application is limited to 0.06%. SoC is calculated from the integration of current timeseries; therefore, the final divergence of the two curves can be explained by the accumulation of instantaneous deviations of current curves. The final value of SoC reduction equals 4.50%, which is 1.4% larger than the corresponding MATLAB result of 4.44%. In Figure 9b, the evolution of the power injected into the battery is plotted and is also in line with the MATLAB results, which is expected from the aforementioned similarity of current and voltage curves. Positive and negative battery peak power absolute values are 39.2 kW and 56.2 kW, respectively, 7.9% and 1.8% lower than the corresponding results of the MATLAB reference application. This is associated with the decrease in voltage and current peaks. These results allow us to conclude that accurate estimations of power transactions throughout the EV powertrain are achieved.
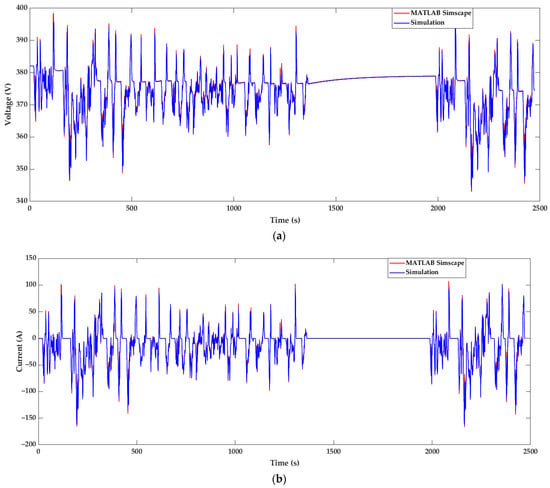
Figure 8.
Battery pack simulation results compared with MATLAB reference application: (a) voltage; (b) current (positive in charging mode).
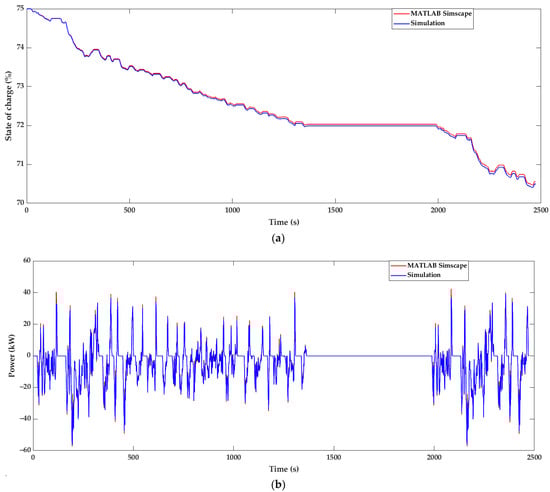
Figure 9.
Battery pack simulation results compared with MATLAB reference application: (a) state of charge; (b) power (positive in charging mode).
Next, the focus is given to the simulation results of the motor subsystem. In Figure 10, the results of the torque applied by the motor show a close match between the results of the developed models and the MATLAB application. The evolution of torque throughout the entire cycle is depicted in Figure 10a, whereas a more detailed view between 165 s and 215 s is shown in Figure 10b to highlight the nature of the instantaneous divergence of the two applied torque curves. Divergence is connected with the requested control command. The model control achieves a smoother response of the requested torque command in comparison with MATLAB. This is related only to the selection of PI controller constants of the driver subsystem in MATLAB and does not imply any model malfunction. The MATLAB results include a maximum positive torque absolute value of 164.5 N⋅m and a maximum negative torque absolute value of 142.9 N⋅m. The maximum positive torque of the simulation results is 152.8 N⋅m, and the maximum negative is 133.8 N⋅m, a relative decrease of 7.1% and 6.4%. Nevertheless, the overshoot avoided in the simulations of the developed model can provide an explanation for the mismatch between the amplitude of torque instantaneous spikes, and consequently, the corresponding mismatch of current values referred to in Figure 8b. Overall, the curves of the torque applied by the motor present a significant similarity throughout the FTP-75 cycle.
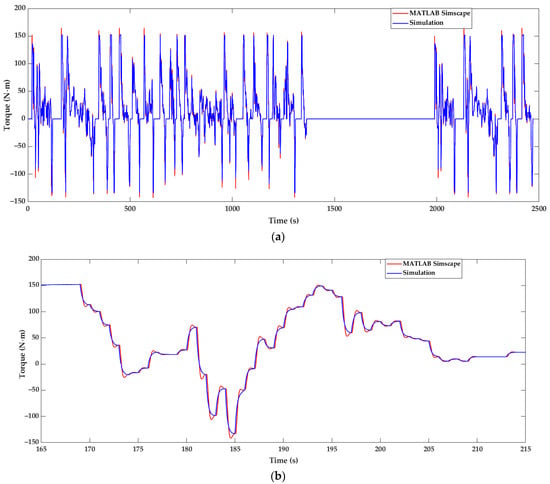
Figure 10.
Motor torque simulation results compared with MATLAB reference application: (a) view of the entire driving cycle; (b) detailed view between 165 s and 215 s.
The similarity in the motor rotational speed results, shown in Figure 11a, is anticipated based on the results presented up to this point. To measure fuel economy, the evolution of the MPGe index, introduced by the US EPA in 2010 [], is monitored and compared with the MATLAB results in Figure 11b. A slight divergence is carried throughout the simulation, leading to a final difference of 2.27 MPGe or a relative difference of 1.43%. This index evolves cumulatively over time, so in the same way, as explained for the SoC quantity, instantaneous value deviations during peak currents lead to the carried-out divergence until the end of the cycle.
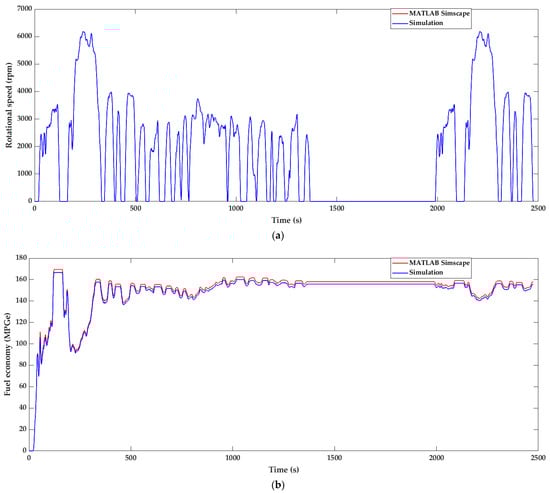
Figure 11.
Simulation results compared with MATLAB reference application: (a) motor rotational speed; (b) fuel economy expressed in miles per gallon of gasoline-equivalent (MPGe).
Examining the evolution of the quantities monitored in Figure 12 is also necessary to verify the simplifications made in the coupling of the drivetrain components and the vehicle kinetics. Results show that the estimations of the applied forces of aerodynamic drag and rolling resistance are in agreement with those exported from MATLAB. The quantity of total EV brake force is generally close to the MATLAB curve, except for certain instantaneous deviations that can also be explained by the aforementioned peak torque mismatches.
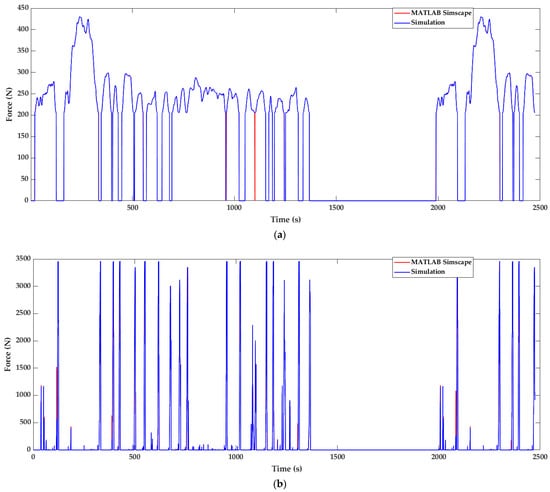
Figure 12.
Vehicle kinetics simulation results compared with MATLAB reference application: (a) sum of drag and rolling resistance applied forces; (b) vehicle brake force.
Regarding the performance of the Modelica-developed model, the EV application under study can be simulated for 10 repetitions of the FTP-75 cycle in 25 s. The corresponding battery’s actual operation time is 6.87 h. This time-efficient feature is convenient for model-based optimization, given that the system model can be exported in a functional mock-up unit (FMU) and be coupled with software compatible with the functional mock-up interface (FMI) standard.
A comparison of the key FTP-75 simulation results of battery and vehicle performance between the developed models and the MATLAB reference applications is presented in Table 3. The smoother response of the system’s control, compared to the MATLAB application, leads to lower velocity deviation from the driving cycle setpoint (decrease by 1.11 km/h or 8.2%) and also to lower maximum absolute values of battery power and motor torque (1.8% and 7.1% decrease, respectively). Energy consumption and SoC reduction are estimated to be 1.4% larger than the MATLAB equivalent example. As a result, the value of total fuel economy is 2.7% lower than the corresponding MATLAB value.
Table 3.
Comparison of the key simulation results between the developed models and the MATLAB reference application.
4. Conclusions
This study focuses on the development of dynamic battery models for EV applications. The models are based on the second-order ECM technique and developed using the Modelica language for four different types of Li-ion cell chemistry commonly found in commercial EVs. The thermal behavior of the battery at the cell level is also considered. Recently published parameter datasets of the four Li-ion battery cells have been sourced from literature and used for the simulations.
To verify the developed models, an EV powertrain system model has been built and compared against a well-established reference application designed with MATLAB Simulink/Simscape. This comprehensive Modelica model includes all necessary subsystems for accurately representing the overall EV system, such as the motor, power converter, regenerative braking system, driver actions, and control unit. Additionally, a simplified version of the drivetrain subsystem has been modeled in both Modelica and Simscape, ensuring alignment between the two models. The simplified drivetrain models reduce the dependence of the verification process on the precise representation of mechanical system interactions.
The FTP-75 driving cycle was used to simulate the system, and results indicate that the integrated system satisfactorily follows the desired velocity profile. The maximum vehicle velocity deviation is 1.22 km/h, which is 8.2% lower than the MATLAB results, and is considered acceptable given the time required by the controller’s response time. The evolution of the battery pack quantities also illustrates an accurate match between the model and the MATLAB results. Specifically, the relative deviation in simulated voltage reaches its maximum value of 1.49% during high values of acceleration or deceleration. The divergence of SoC decrease at the end of the cycle equals 0.06%, and the strong similarity in both current and power curves strengthens estimation accuracy. Results associated with motor performance and vehicle kinetics also agree with those exported from the MATLAB reference application, whereas instantaneous deviations in the requested torque that affect the estimation of cumulative quantities (SoC and fuel economy) are associated with slight differences in the driver’s control approach.
The overall agreement of the results with those obtained from MATLAB across various system points, each associated with different physics domains, strengthens the conclusion that an accurate and reliable representation of an EV system can be achieved using the developed models. The consideration of four battery cell parameter datasets enables the virtual representation of a wide range of commercial EVs. The system model can be exported as an FMU and used in any software product supporting the FMI standard.
Furthermore, the exploration and early assessment of multiple approaches to battery integration into broader EV powertrain architectures is made possible and could be the subject of future studies. This is facilitated by the advantageous feature of Modelica being object-oriented and acausal, which mitigates possible risks during model coupling. Incorporating a more detailed and sophisticated motor model could help extract useful conclusions regarding motor performance within the powertrain. Additionally, the performance of the EV model was tested by simulating 10 repetitions of the FTP-75 cycle in 25 s, corresponding to 6.87 h of actual battery operation. Consequently, the model could be included in hardware-in-the-loop simulations with the appropriate equipment, potentially leading to the fine-tuning of system control modules. Evaluating different BMS strategies for optimal battery operation within the powertrain, such as developing cell balancing algorithms, is also facilitated. Finally, a potential next step after verifying the models against reliable MATLAB results would be to validate the models with experimental measurements from the battery pack and powertrain.
Author Contributions
Conceptualization, R.R., P.I., N.N., D.R. and A.T.; methodology, R.R.; software, R.R.; validation, R.R.; investigation, R.R.; writing—original draft preparation, R.R., P.I., N.N., D.R. and A.T.; writing—review and editing, R.R., P.I., N.N., D.R. and A.T.; visualization, R.R.; supervision, N.N. and A.T. All authors have read and agreed to the published version of the manuscript.
Funding
This research has been carried out in the framework of the European Union’s Horizon Europe research and innovation programme under grant agreement 101056874 (SCALE-Smart Charging Alignment for Europe).
Data Availability Statement
The raw data supporting the conclusions of this article will be made available by the authors on request.
Conflicts of Interest
The authors declare no conflicts of interest.
References
- Qin, D.; Li, J.; Wang, T.; Zhang, D. Modeling and Simulating a Battery for an Electric Vehicle Based on Modelica. Automot. Innov. 2019, 2, 169–177. [Google Scholar] [CrossRef]
- Fritzson, P. Principles of Object-Oriented Modeling and Simulation with Modelica 3.3: A Cyber-Physical Approach, 2nd ed.; IEEE Press [u.a.]: Piscataway, NJ, USA, 2015; ISBN 978-1-118-85912-4. [Google Scholar]
- Doyle, M.; Newman, J.; Gozdz, A.S.; Schmutz, C.N.; Tarascon, J. Comparison of Modeling Predictions with Experimental Data from Plastic Lithium Ion Cells. J. Electrochem. Soc. 1996, 143, 1890–1903. [Google Scholar] [CrossRef]
- Tamilselvi, S.; Gunasundari, S.; Karuppiah, N.; Razak RK, A.; Madhusudan, S.; Nagarajan, V.M.; Sathish, T.; Shamim, M.Z.M.; Saleel, C.A.; Afzal, A. A Review on Battery Modelling Techniques. Sustainability 2021, 13, 10042. [Google Scholar] [CrossRef]
- Chen, M.; Rincon-Mora, G.A. Accurate Electrical Battery Model Capable of Predicting Runtime and I-V Performance. IEEE Trans. Energy Convers. 2006, 21, 504–511. [Google Scholar] [CrossRef]
- Huria, T.; Ceraolo, M.; Gazzarri, J.; Jackey, R. High Fidelity Electrical Model with Thermal Dependence for Characterization and Simulation of High Power Lithium Battery Cells. In Proceedings of the 2012 IEEE International Electric Vehicle Conference, Greenville, SC, USA, 4–8 March 2012; pp. 1–8. [Google Scholar]
- Bui, T.M.N.; Dinh, T.Q.; Marco, J.; Watts, C. Development and Real-Time Performance Evaluation of Energy Management Strategy for a Dynamic Positioning Hybrid Electric Marine Vessel. Electronics 2021, 10, 1280. [Google Scholar] [CrossRef]
- Milishchuk, R.; Bogodorova, T. Thevenin-Based Battery Model with Ageing Effects in Modelica. In Proceedings of the 2022 IEEE 21st Mediterranean Electrotechnical Conference (MELECON), Palermo, Italy, 14 June 2022; pp. 243–248. [Google Scholar]
- Bairwa, B.; Supraja, B.; Pratiksha, C.; Sumanth, A. Modeling and Simulation of Electric Vehicle Powertrain for Dynamic Performance Evaluation. In Proceedings of the 2023 International Conference on Distributed Computing and Electrical Circuits and Electronics (ICDCECE), Ballar, India, 29 April 2023; pp. 1–7. [Google Scholar]
- Chandra, S.; Nair, A.C.; Yadav, A.K.; Singhal, S. An Integrated Approach for Modelling Electric Powertrain. In Proceedings of the 2023 5th Global Power, Energy and Communication Conference (GPECOM), Nevsehir, Turkiye, 14 June 2023; pp. 175–180. [Google Scholar]
- Meszaros, S.; Bashash, S. Optimal Electric Vehicle Braking Control for Maximum Energy Regeneration. In Proceedings of the 2023 American Control Conference (ACC), San Diego, CA, USA, 31 May 2023; pp. 2475–2480. [Google Scholar]
- Adegbohun, F.; Von Jouanne, A.; Phillips, B.; Agamloh, E.; Yokochi, A. High Performance Electric Vehicle Powertrain Modeling, Simulation and Validation. Energies 2021, 14, 1493. [Google Scholar] [CrossRef]
- Gerl, J.; Janczyk, L.; Krüger, I.; Modrow, N. A Modelica Based Lithium Ion Battery Model. In Proceedings of the 10th International Modelica Conference, Lun, Sweden, 10 March 2014; pp. 335–341. [Google Scholar]
- Rotas, R.; Iliadis, P.; Nikolopoulos, N.; Tomboulides, A.; Kosmatopoulos, E. Dynamic Simulation and Performance Enhancement Analysis of a Renewable Driven Trigeneration System. Energies 2022, 15, 3688. [Google Scholar] [CrossRef]
- Tran, M.-K.; DaCosta, A.; Mevawalla, A.; Panchal, S.; Fowler, M. Comparative Study of Equivalent Circuit Models Performance in Four Common Lithium-Ion Batteries: LFP, NMC, LMO, NCA. Batteries 2021, 7, 51. [Google Scholar] [CrossRef]
- EV Reference Application—MATLAB & Simulink. Available online: https://www.mathworks.com/help/autoblks/ug/electric-vehicle-reference-application.html (accessed on 24 January 2024).
- Modelica/ModelicaStandardLibrary. Available online: https://github.com/modelica/ModelicaStandardLibrary (accessed on 10 January 2024).
- Ceraolo, M. Max-Privato/EHPT. Available online: https://github.com/max-privato/EHPT (accessed on 24 January 2024).
- US EPA Offiice. EPA Federal Test Procedure (FTP). Available online: https://www.epa.gov/emission-standards-reference-guide/epa-federal-test-procedure-ftp (accessed on 24 January 2024).
- US EPA Offiice. Text Version of the Electric Vehicle Label. Available online: https://www.epa.gov/fueleconomy/text-version-electric-vehicle-label (accessed on 26 January 2024).
Disclaimer/Publisher’s Note: The statements, opinions and data contained in all publications are solely those of the individual author(s) and contributor(s) and not of MDPI and/or the editor(s). MDPI and/or the editor(s) disclaim responsibility for any injury to people or property resulting from any ideas, methods, instructions or products referred to in the content. |
© 2024 by the authors. Licensee MDPI, Basel, Switzerland. This article is an open access article distributed under the terms and conditions of the Creative Commons Attribution (CC BY) license (https://creativecommons.org/licenses/by/4.0/).