Abstract
Residential energy storage systems offer significant potential for price arbitrage by capitalizing on fluctuations in electricity prices throughout the day. This study investigates the potential revenue from optimal battery scheduling for residential storage in different north-western European electricity price zones during 2023. Using Nord Pool day-ahead prices, we applied an optimization model to determine the revenue for two types of batteries: 5 kW/10 kWh and 10 kW/10 kWh. The analysis considered battery capacity, charging and discharging efficiency, and maximum charge/discharge rates. Our results show notable variations in potential revenue across different regions, with the Baltic states demonstrating the highest revenue potential. The findings indicate that while 10 kW batteries can generate higher total revenue, 5 kW batteries are more efficient in terms of revenue per cycle. These regional disparities underscore the need for targeted incentives and policies to enhance the economic viability of residential energy storage. The research results provide valuable insights into optimizing residential battery storage for price arbitrage, offering guidance for consumers, policymakers, and energy providers to maximize economic benefits in various electricity markets.
1. Introduction
Price arbitrage is based on profiting by charging the battery during periods when electricity prices are low and discharging the battery when prices are high. The greater the price difference between peak and valley prices, the greater the economic benefit will be. Electricity prices fluctuate during the day according to the so-called California ‘‘duck curve’’ [1,2], where the x-axis represents hours and the y-axis represents the quantity of electricity net demand. Fluctuations in electricity prices during the day depend on the dynamics of electricity demand and supply. The integration of renewable energy sources, such as solar and wind power plants, into the grid has a significant impact on the variability of electricity prices. First peak demand is in the morning as consumers wake up and businesses start. From the morning until midday, the net demand decreases as solar production increases. The second demand peak appears in the evening as solar energy production wanes due to the sunset. Energy storage is a notable way to flatten the mismatch level of the overall load that emerges at high solar penetrations.
Based on information reported by Bloomberg in [3], cumulative residential energy storage capacity to be installed globally in 2030 will reach 93 GW/196 GWh. Already, in Germany and Italy, over 70% of new home solar systems have batteries attached. This allows to shift the use of daytime generated solar power to the evening and night time. Customers are concerned with installing residential batteries mainly for three reasons: a desire to increase solar self-consumption, to reduce their bills, and to have backup power. Self-consumption allows to reduce the grid load, especially at peak times, and thereby reduce the necessity of grid expansion. Changing policies from net metering to net billing and reducing feed-in tariffs are other reasons to incline consumers to install residential batteries and maximize self-consumption.
Energy prices are rising while installation costs of energy storage systems are decreasing. Bloomberg’s annual battery price survey finds a 14% drop from 2022 to 2023 [4]. Electricity customers can take advantage of price arbitrage by installing residential batteries without solar power. This type of installation is good for power backup and resilience.
The study presented in [5] proposes two day-ahead battery-behavior-aware operation scheduling strategies to maximize profitability and longevity in residential grid-connected applications with dynamic electricity pricing. The strategy with a low charge/discharge rate extends the battery lifetime but the profit is negative of −3 EUR/kWh/year. Strategies with high and moderate charge/discharge rates resulted in positive profits of 8.3 EUR/kWh/year and 9.2 EUR/kWh/year, despite having shorte-r battery lifetimes estimated at 10.1 years and 13.6 years, respectively.
Four energy arbitrage strategies, including mirror arbitrage, back-to-back arbitrage, and statistical-based operation strategy, are applied to determine the strategy with the best performance for a BESS that would participate in the Colombian market [6]. A financial evaluation shows that the income obtained from battery energy storage systems when only performing energy arbitrage in the Colombian electricity market does not compensate for the investment costs.
The economic viability of hydrogen storage and Li-ion batteries based on price arbitrage in the day-ahead Poland market is presented in [7]. The net present value for Li-ion technology is significantly higher than for hydrogen but the results show that both technologies are unprofitable in the current price fluctuations and capital cost of the systems.
The study presented in [8] proposes a stochastic bidding approach for grid-level battery storage arbitrage profit maximization using day-ahead and real-time market prices. Case studies show that profits using the MILP (Mixed Integer Linear Programming) algorithm are higher than the LP (Linear Programming) algorithm. The profit of the same capacity but lower power batteries is lower as the battery requires a longer time to charge/discharge.
Increasing the penetration level of renewable energy poses challenges to the stability of the power system [9,10]. The integration of the smart grid with renewable energy sources, opportunities, and challenges are discussed in [11]. The advantages and disadvantages of hybrid wind and solar energy integration systems are discussed in [12]. Wind power plants cannot produce electricity when the wind is not strong enough and solar power plants cannot generate at night or on a cloudy day. The opposite case is also possible when, on windy or very sunny days, the amount of energy produced exceeds the net demand. Battery energy storage systems provide a range of benefits and support functions to the power grid, including frequency regulation, peak shaving operating reserves, and others. Batteries can charge and discharge quickly, making them ideal for balancing the grid on demand or production side. Balancing services can be differentiated into frequency containment reserve (FCR), automatic frequency restoration reserve (aFRR), and manual frequency restoration reserve (mFRR) [13]. The study presented in [14] proposes a two-stage optimization technique to schedule batteries owned by commercial consumers through an aggregator, considering energy arbitrage and peak shaving benefits at the consumer level and the frequency regulation benefit at the grid level. Consumers have no possibility to participate directly in the balancing services because the size of residential batteries is too small; therefore, this is organized through an aggregator. The possibility to participate in balancing services gives additional revenues for residential battery owners [15].
The economics for residential storage in Europe are often poor without incentives; therefore, many governments subsidize consumer adoption of batteries. However, customers lack good data on the actual potential revenue [3]. This paper provides a comparative study of the potential revenue for residential battery price arbitrage in the different north-western European power market electricity price zones of 13 countries. The revenue is obtained by using optimal battery scheduling during day-ahead prices in 2023. We used 5 kW/10 kWh and 10 kW/10 kWh batteries for optimal battery scheduling. The model evaluates the battery capacity, charging, and discharging efficiency, maximum charging, and discharging rate. The obtained results indicate the price zones with the highest and lowest possible revenue and show the revenue and battery cycle differences between 5 kW and 10 kW power batteries.
The remainder of this paper is organized as follows. Section 2 describes the day-ahead prices in 2023 and the battery scheduling optimization model. Section 3 explains the residential battery price arbitrage scenario and analyses the results by applying the optimization model presented in Section 2. Section 4 provides the concluding remarks.
2. Materials and Methods
2.1. Energy Price Data
For the price arbitrage study, we used Nord Pool day-ahead prices in 2023 [16]. Nord Pool is the north-western European power market covering 20 bidding zones in 13 countries. Usually, the day-ahead prices are announced to the market at 12:45 CET or later. Knowing the 24-h day-ahead prices makes it possible to build the optimal schedule for the battery to maximize the revenue during this period. Table 1 summarizes the mean, maximum, minimum, standard deviation, and total sum of day-ahead market prices of 21 zones in 2023.

Table 1.
Summary of the Nord Pool day-ahead prices in 2023.
The highest electricity mean price of 102.14 EUR/MWh was in Austria. Also, we see that this corresponds to the highest total sum of all hourly prices per year: 894.76 thousand EUR. The price range in the day-ahead market is limited to −500 (minimum) and 4000 (maximum) EUR/MWh. The highest electricity price, 777.18 EUR/MWh, was reached in four zones (EE, FI, LV, and LT) at the same hour on 22 November 2023. It is worth mentioning that the absolute maximum of prices was reached on 17 August 2022 in the Baltic region (EE, LV, and LT). That day, the price hits 4000 EUR/MWh for one hour, even after the activation of Lithuanian peak load reserves. The absolute price minimum was spotted for two days in 2023. The first time, it was on Sunday 2 July 2023 and included three zones: NL, AT, and DE-LU. High wind and solar generation coincided with low demand. The second time, it was related to an electricity trading error. Kinect Energy sent an incorrect bid for Finland for delivery on 24 November. Starting from 14:00 CET until midnight, the price was at −500 EUR/MWh.
The European Clean Power Pathways Explorer by EMBER provides insights into the energy landscapes of various European countries [17]. For example, Austria relies significantly on renewable energy, particularly hydroelectric power. The availability of water for hydropower can fluctuate, leading to price variability. Belgium’s energy mix mainly comprises nuclear and gas-powered generation. The Baltic states rely on imported energy, contributing to higher price variability. Energy prices are affected by their interconnections with neighboring markets and the integration of wind and solar power. Germany is undergoing an energy transition to increase its share of renewable energy, particularly wind and solar. A large portion of energy in Denmark comes from wind turbines. Wind power’s intermittent nature leads to price fluctuations. France has a large nuclear fleet that helps to stabilize electricity prices. Periods of maintenance or reduced nuclear output can cause price spikes. The Netherlands is transitioning from natural gas to more renewable energy sources. The integration of wind and solar power contributes to price variability. Finland’s energy mix includes nuclear, hydro, and increasing wind power. Norway’s electricity prices are influenced by its reliance on hydropower. Sweden’s energy mix includes nuclear, hydro, and increasing wind power.
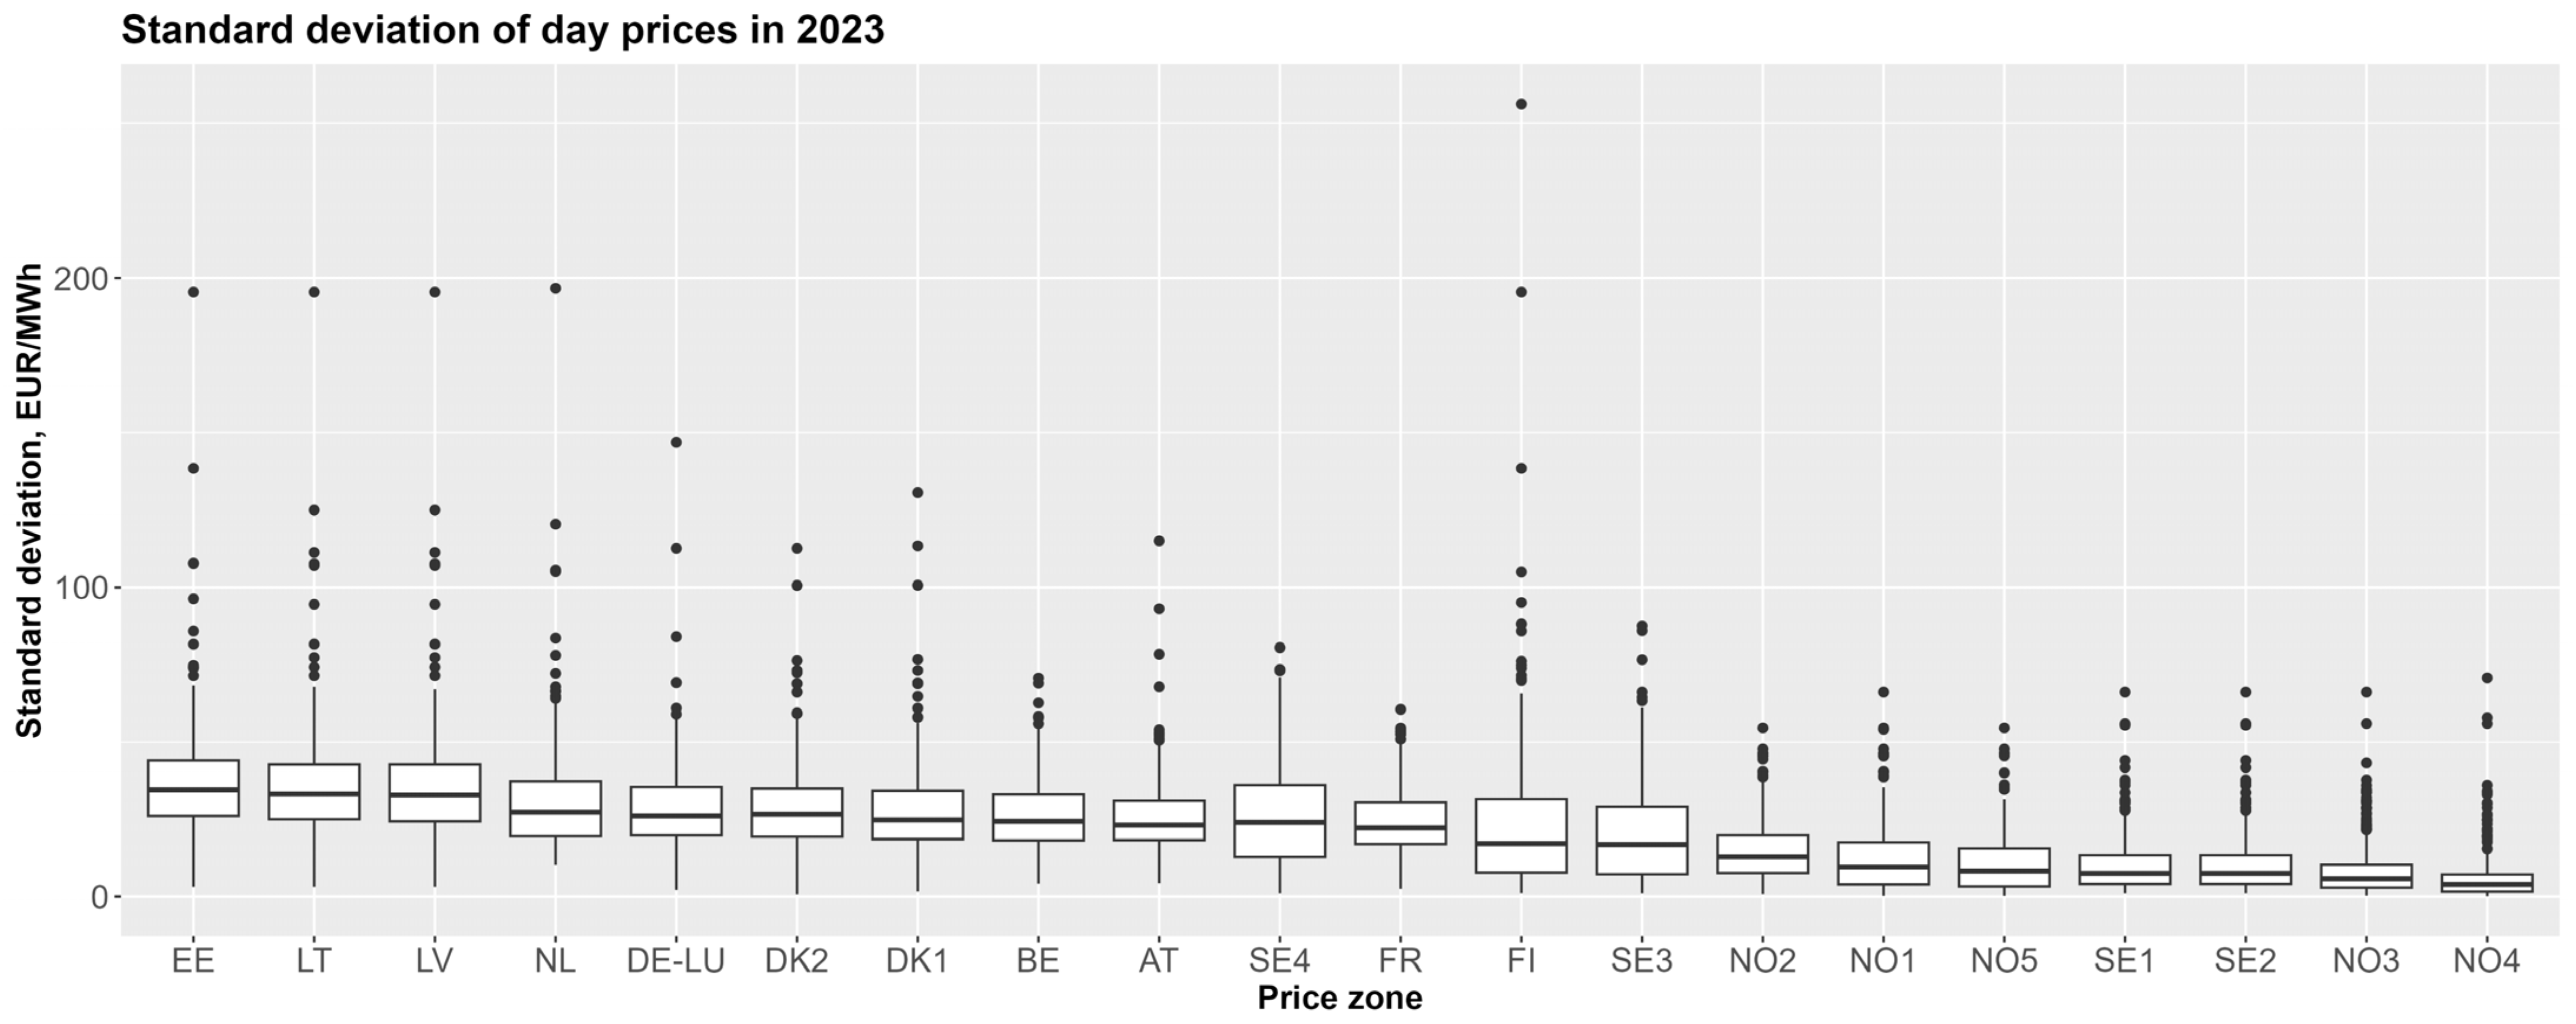
The standard deviation (SD) shows the amount of variation about its mean price. We can expect that a higher standard deviation indicates a higher potential revenue of price arbitrage. But the standard deviation of the whole year’s prices is not a good indicator. As prices are announced 24 h ahead, the optimal schedule of the battery can be built based on this period; therefore, the better indicator would be the standard deviation of the day prices. Figure 1 shows the boxplot of the standard deviation of day prices in 2023 ordered from the highest to the lowest. Based on the values presented in Table 1, the highest and the lowest prices were in Finland. The highest standard deviation was in Finland too. However, by analyzing the standard deviation of day prices (Figure 1), the Finland zone is twelfth. The highest standard deviation of day prices is in the Baltic region, positioning Estonia first, Lithuania second, and Latvia third. Based on that, we can make an assumption that revenue also will be the highest in the Baltic region. The exact revenue values of optimal battery scheduling for price arbitrage are presented and discussed in Section 3.
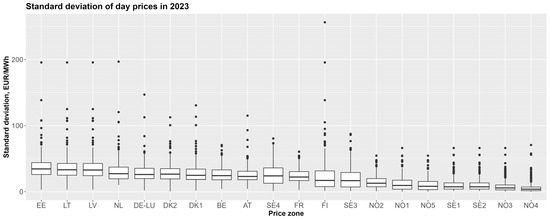
Figure 1.
Standard deviation of day prices in 2023 by price zone.
A small deviation in electricity prices refers to a scenario where there is relatively little fluctuation or volatility in electricity costs over time. This stability can offer several advantages, particularly in the context of energy planning, investment, and consumption. Predictable prices help in assessing the true cost of renewables versus conventional energy sources. This facilitates the achievement of grid parity. Grid parity is the point at which the cost of generating electricity from renewable sources becomes equal to or less than the cost of purchasing electricity from the grid. The timing of reaching grid parity is closely related to the price of electricity in a given country. Higher electricity prices make renewable energy more competitive sooner, accelerating the achievement of grid parity. Conversely, lower electricity prices can delay the integration.
The total sum reflects the cumulative cost of electricity over the year, indicating the overall economic impact on consumers and industries.
2.2. Battery Scheduling Optimisation Model
The battery scheduling optimization model is based on models presented in [6,18,19,20,21]. The main purpose of the implemented model is to determine the optimal battery scheduling for the day-ahead prices. The model accounts for the battery capacity, charging and discharging efficiency, maximum charging and discharging rate, initial charge state, state of the charge, and discharge limit. The time resolution of the model is one hour.
2.2.1. Objective Function
The objective function (Equation (1)) seeks to maximize revenue from the price arbitrage over a day-ahead prices period, as follows:
where t is the time period of one hour, T is the day-ahead optimization period, C(t) is the energy price at time period t, and Edis(t) and Echg(t) correspond to the discharge and charge energy at each time period t.
2.2.2. Constraints
A set of constraints are applied to keep battery operation within its physical limitations during the optimization period.
The state of charge (SOC) of the battery at the time t depends on the previous state of charge and the charging Pchg(t) and discharging Pdis(t) power, as shown by Equation (2). Δt refers to time between t − 1 and t.
The charging and discharging power are also limited by the maximum allowed battery charging and discharging rate (Rchg_max and Rdis_max) and battery capacity Bcap:
where Ichg(t) and Idis(t) are binary variables used to ensure that the battery can only charge or discharge at each time period t. It is constrained by Equation (5).
The state of charge of the battery at each time period must be within its minimum and maximum limits, as shown in Equation (6),
The actual energy that is used to charge the battery until a specific SOC level or energy, that is removed from the battery and sold to the grid depends on the battery efficiency. The required energy to charge the battery from SOC(t − 1) until SOC(t) with efficiency ηchg is given by Equation (7).
The actual energy, which is sold to the grid when the battery state of charge decreases by ΔSOC(t) with efficiency ηdis, is given by Equation (8).
3. Results
The potential revenue for residential battery price arbitrage in different north-western European power market electricity price zones is obtained using two the same 10 kWh capacity but different charge–discharge rate batteries. The first battery has 5 kW (0.5 C) charge–discharge power. It takes two hours to fully charge this battery, which means that the daily optimal battery scheduling plan requires at least two hours with the lowest price. The situation is analogous to the discharge battery. Two hours with the highest price are needed to discharge the battery to the minimum level of the specified state of the charge (SOC).
We can make an assumption that the same capacity but 1 C rate battery gives more revenue as the time needed to charge and discharge the battery is shorter. In this case, the advantage is that the battery can be fully charged in an hour, i.e., at the lowest price and fully discharged in an hour at the highest price.
In both cases, we use the following main battery parameters:
- Capacity: 10 kWh;
- Charging/Discharging power: 5 kW (for Case 1) and 10 kW (for Case 2);
- Charging/Discharging efficiency: 95%;
- SOC upper limit: 90%;
- SOC lower limit: 10%;
- Optimization scenario: max revenue.
3.1. Case Study with a 5 kW/10 kWh Battery
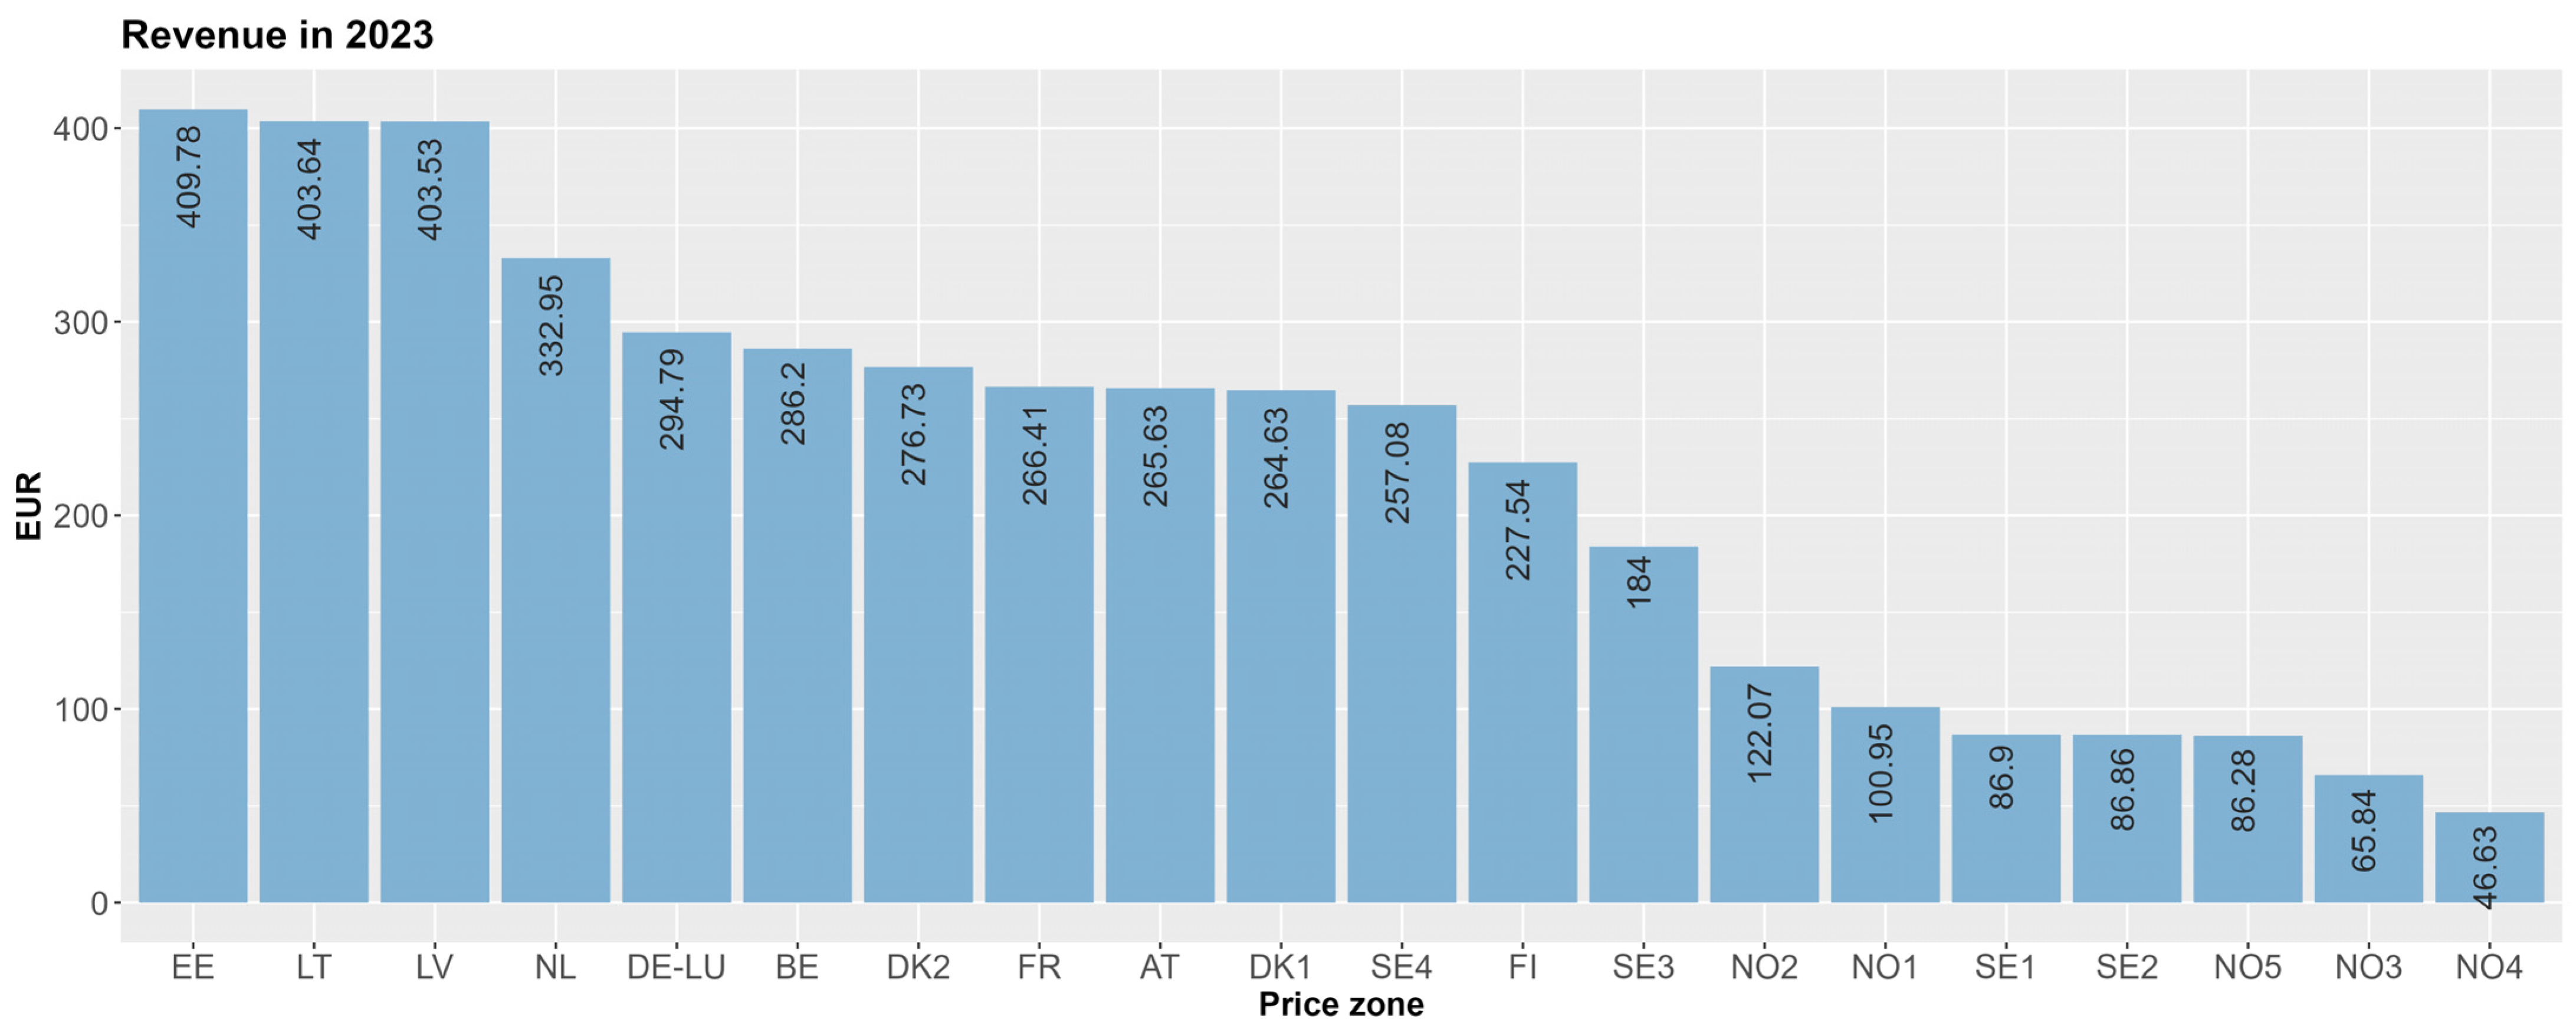
The revenue of price arbitrage with a 5 kW/10 kWh battery in 2023 is shown in Figure 2. The highest revenue is in the Baltic region with the top 1 of 409.78 EUR in the Estonian price zone and the top 2–3 with almost identical revenue in Lithuania and Latvia. The lowest possible revenue is in Norway zone 4. Norway has five price zones where the difference between the lowest revenue zone NO4 and the highest revenue zone NO2 is 2.6 times or 75.44 EUR per year. The similar situation is in Sweden where the SE3 zone gives a revenue of 184 EUR compared to the SE2 zone with a revenue of 86.86 EUR. It can be seen that the price zone revenues highly correlate with the standard deviation of day prices. The Person correlation coefficient is equal to 0.99. But the correlation coefficient between the revenues and standard deviation of the hole year prices is equal to 0.85. This shows that the standard deviation of day prices is a much better indicator of the possible arbitrage revenue than the standard deviation of the whole year prices.

Figure 2.
Price arbitrage revenue of a 5 kW/10 kWh battery in 2023.
The revenue of price arbitrage is a result of battery scheduling during the day. This means that the battery goes through a certain number of charge and discharge cycles during the day. The total number of battery cycles during the whole year is presented in Figure 3. The mean number of cycles per year in all price zones is 523 or 1.4 cycles per day. We can also see that a higher number of cycles does not necessarily mean a higher revenue. Norway, NO2, with a lower number of cycles, gives higher revenue compared with Sweden’s SE1 and SE2 zones. The battery cycles of the Netherlands’ price zone are lower than in Finland’s price zone but the revenue is 68% higher. It depends on the day-ahead price variation. Bigger differences between the hourly prices give higher revenue at the end of the day. It is also worth mentioning that the price difference should compensate for the charging and discharging efficiency of the battery. The optimal battery scheduling model evaluates the battery efficiency and charges or discharges the battery only when the revenue is positive.
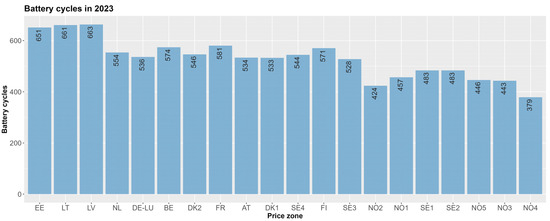
Figure 3.
Total battery cycles of a 5 kW/10 kWh battery in 2023.
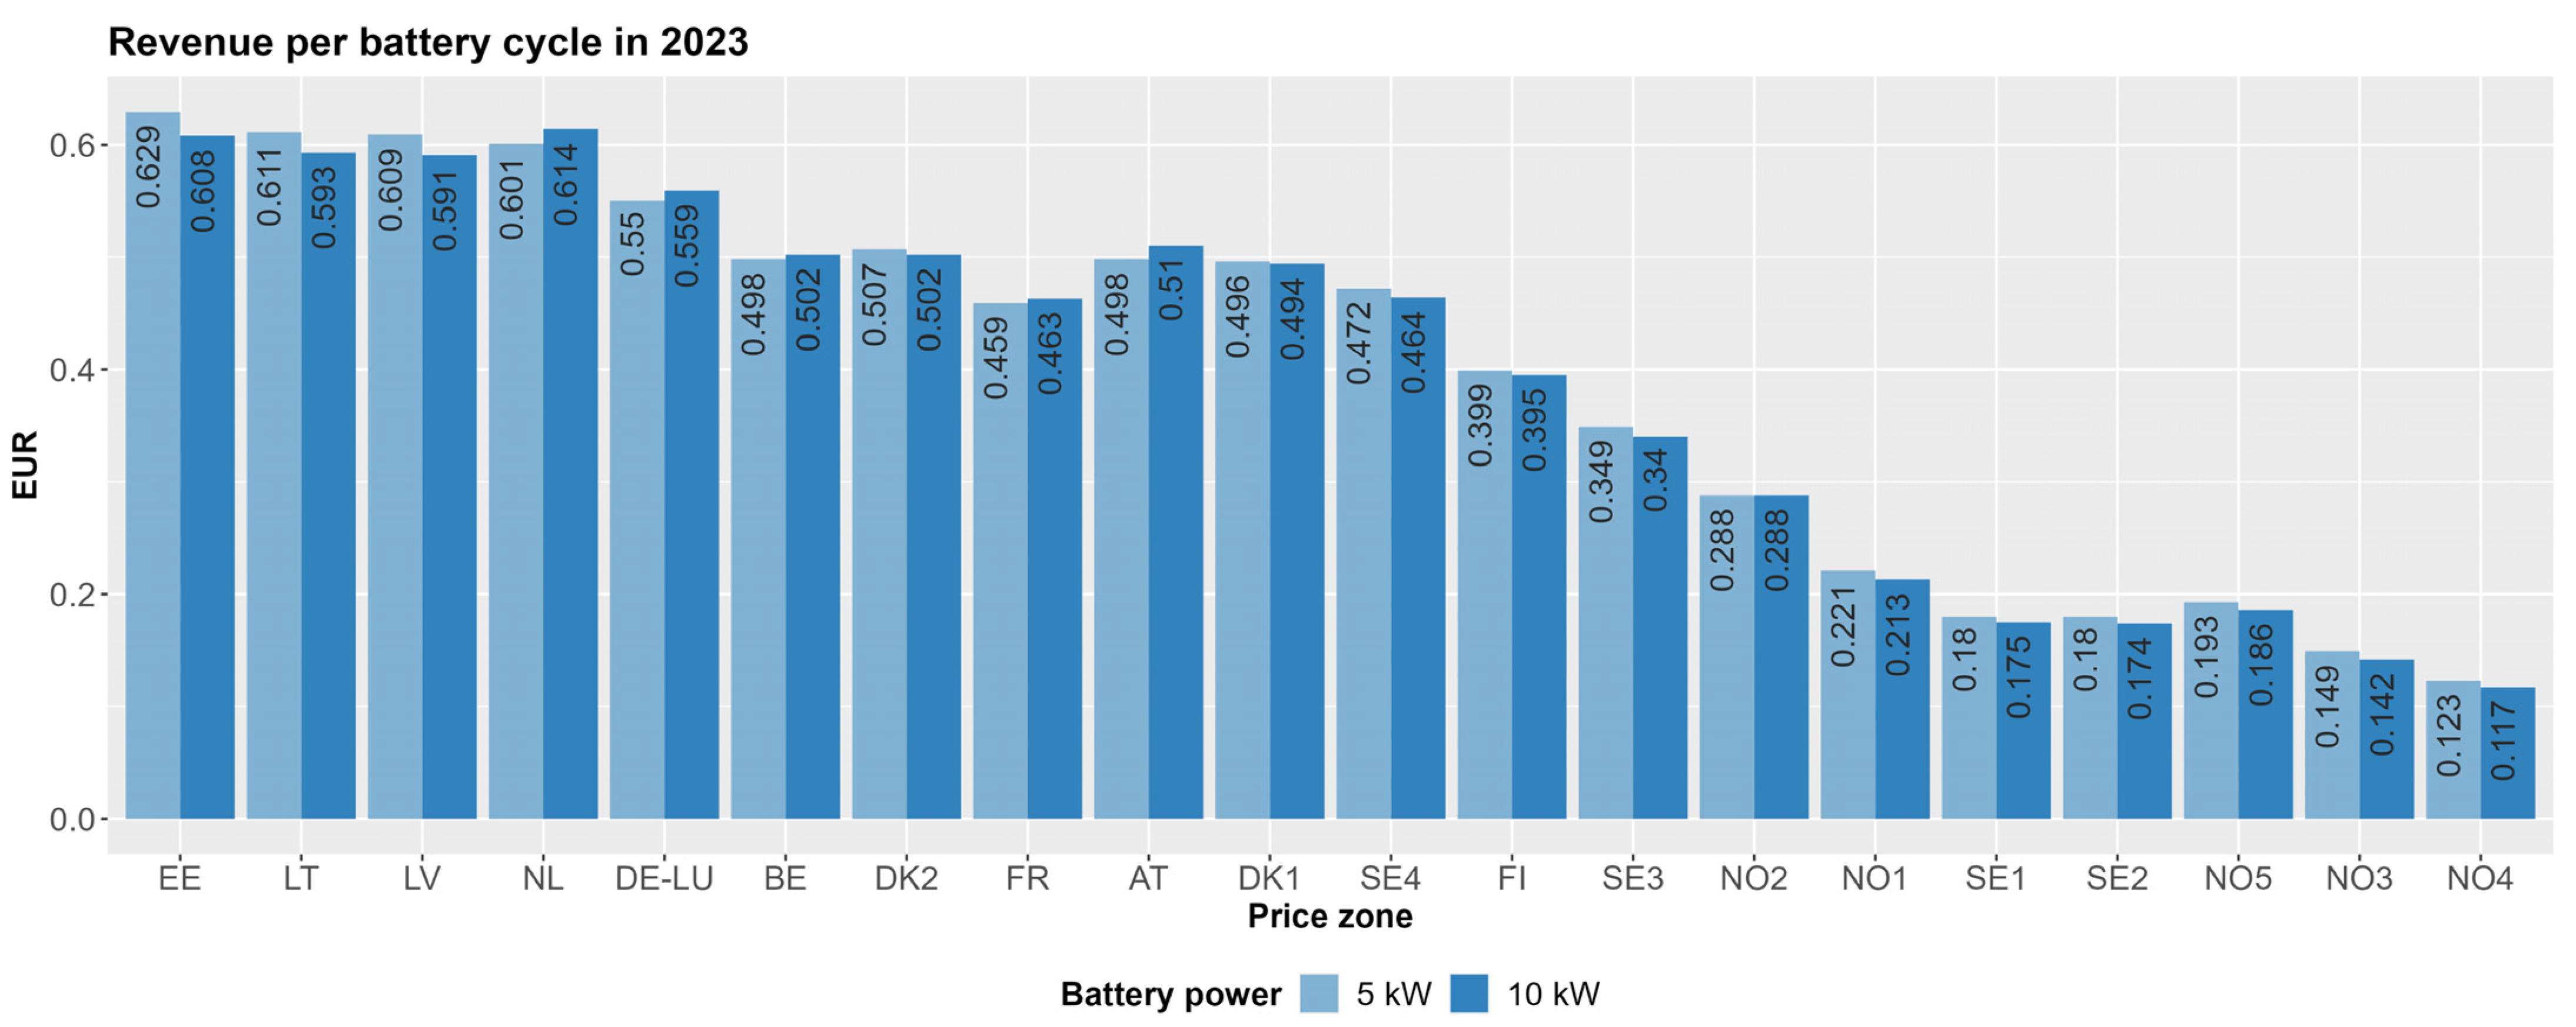
Revenue per battery cycle is presented in Figure 4. We can see that revenue per one battery cycle in the Netherlands is very close to that in the Baltic states and is equal to 0.601 EUR, which is not the case comparing only the yearly revenue. Therefore, the revenue per one battery cycle is a better criterion to compare the possible revenue of price arbitrage in different price zones. The revenue per battery cycle divided by battery capacity gives the revenue per battery cycle for 1 kWh, which allows to compare revenue of batteries with different capacities. For example, the revenue of one battery cycle gives 1.8 cent/1 kWh in Sweden zone 1 (SE1).
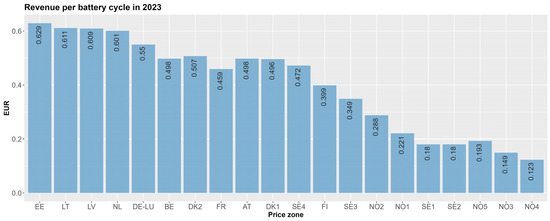
Figure 4.
Revenue per battery cycle of a 5 kW/10 kWh battery in 2023.
Making an assumption that revenue per one battery cycle will not change during all of the battery lifetime and assuming that the number of battery cycles is equal to 6000, then the total possible revenue of 5 kW/10 kWh battery in Estonia will be 3774 EUR and only 738 EUR in Norway zone 4 (NO4). The revenue differs more than 5 times. It should also be noted that this revenue does not include taxes on electricity distribution, fixed periodic electricity supplier taxes, power cost, and others, which are different in different price zones.
3.2. Case Study with 10 kW/10 kWh Battery
The 10 kW/10 kWh battery can be fully charged or discharged in one hour. This gives an opportunity to take advantage of cases when there is only one hour during a day with the lowest or highest price. The 5 kW/10 kWh battery needs two hours in a row with the lowest and the highest prices to be charged and discharged to achieve the maximum revenue.
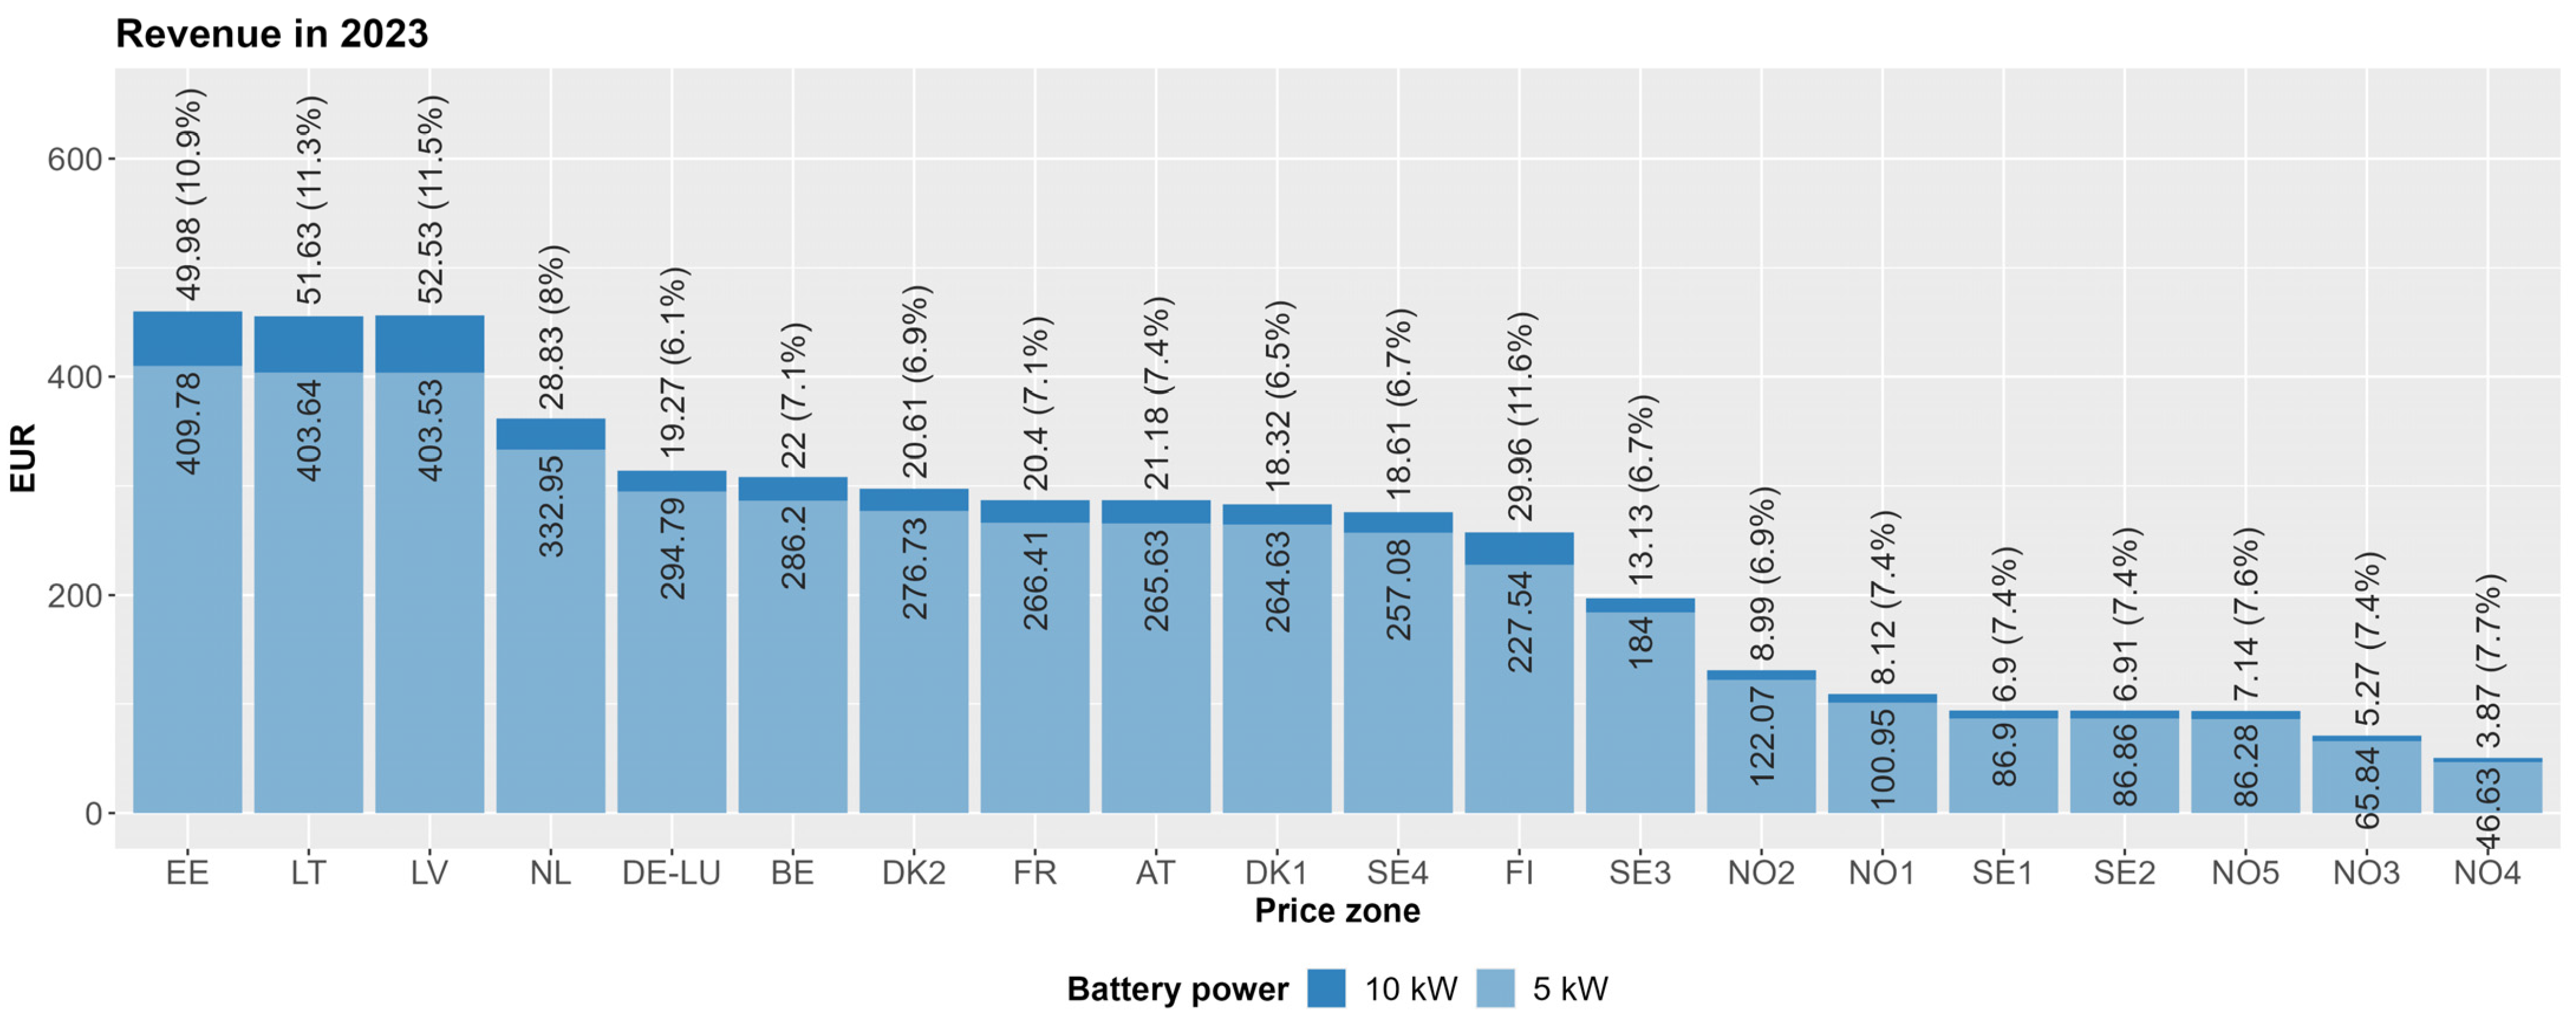
Figure 5 shows the revenue increase of 10 kW power battery compared to a 5 kW battery. The highest revenue increase of 11.6% is in Finland’s price zone and the lowest, with 6.14%, is in Germany–Luxembourg. The average increase in all price zones is 7.98%. The biggest monetary increase is in Latvia and is equal to 52.53 EUR and the smallest one is only 3.87 EUR in Norway zone 4 (NO4). The average monetary increase in all price zones is 20.68 EUR.

Figure 5.
Revenue increase by using a 10 kW power battery compared to a 5 kW power battery.
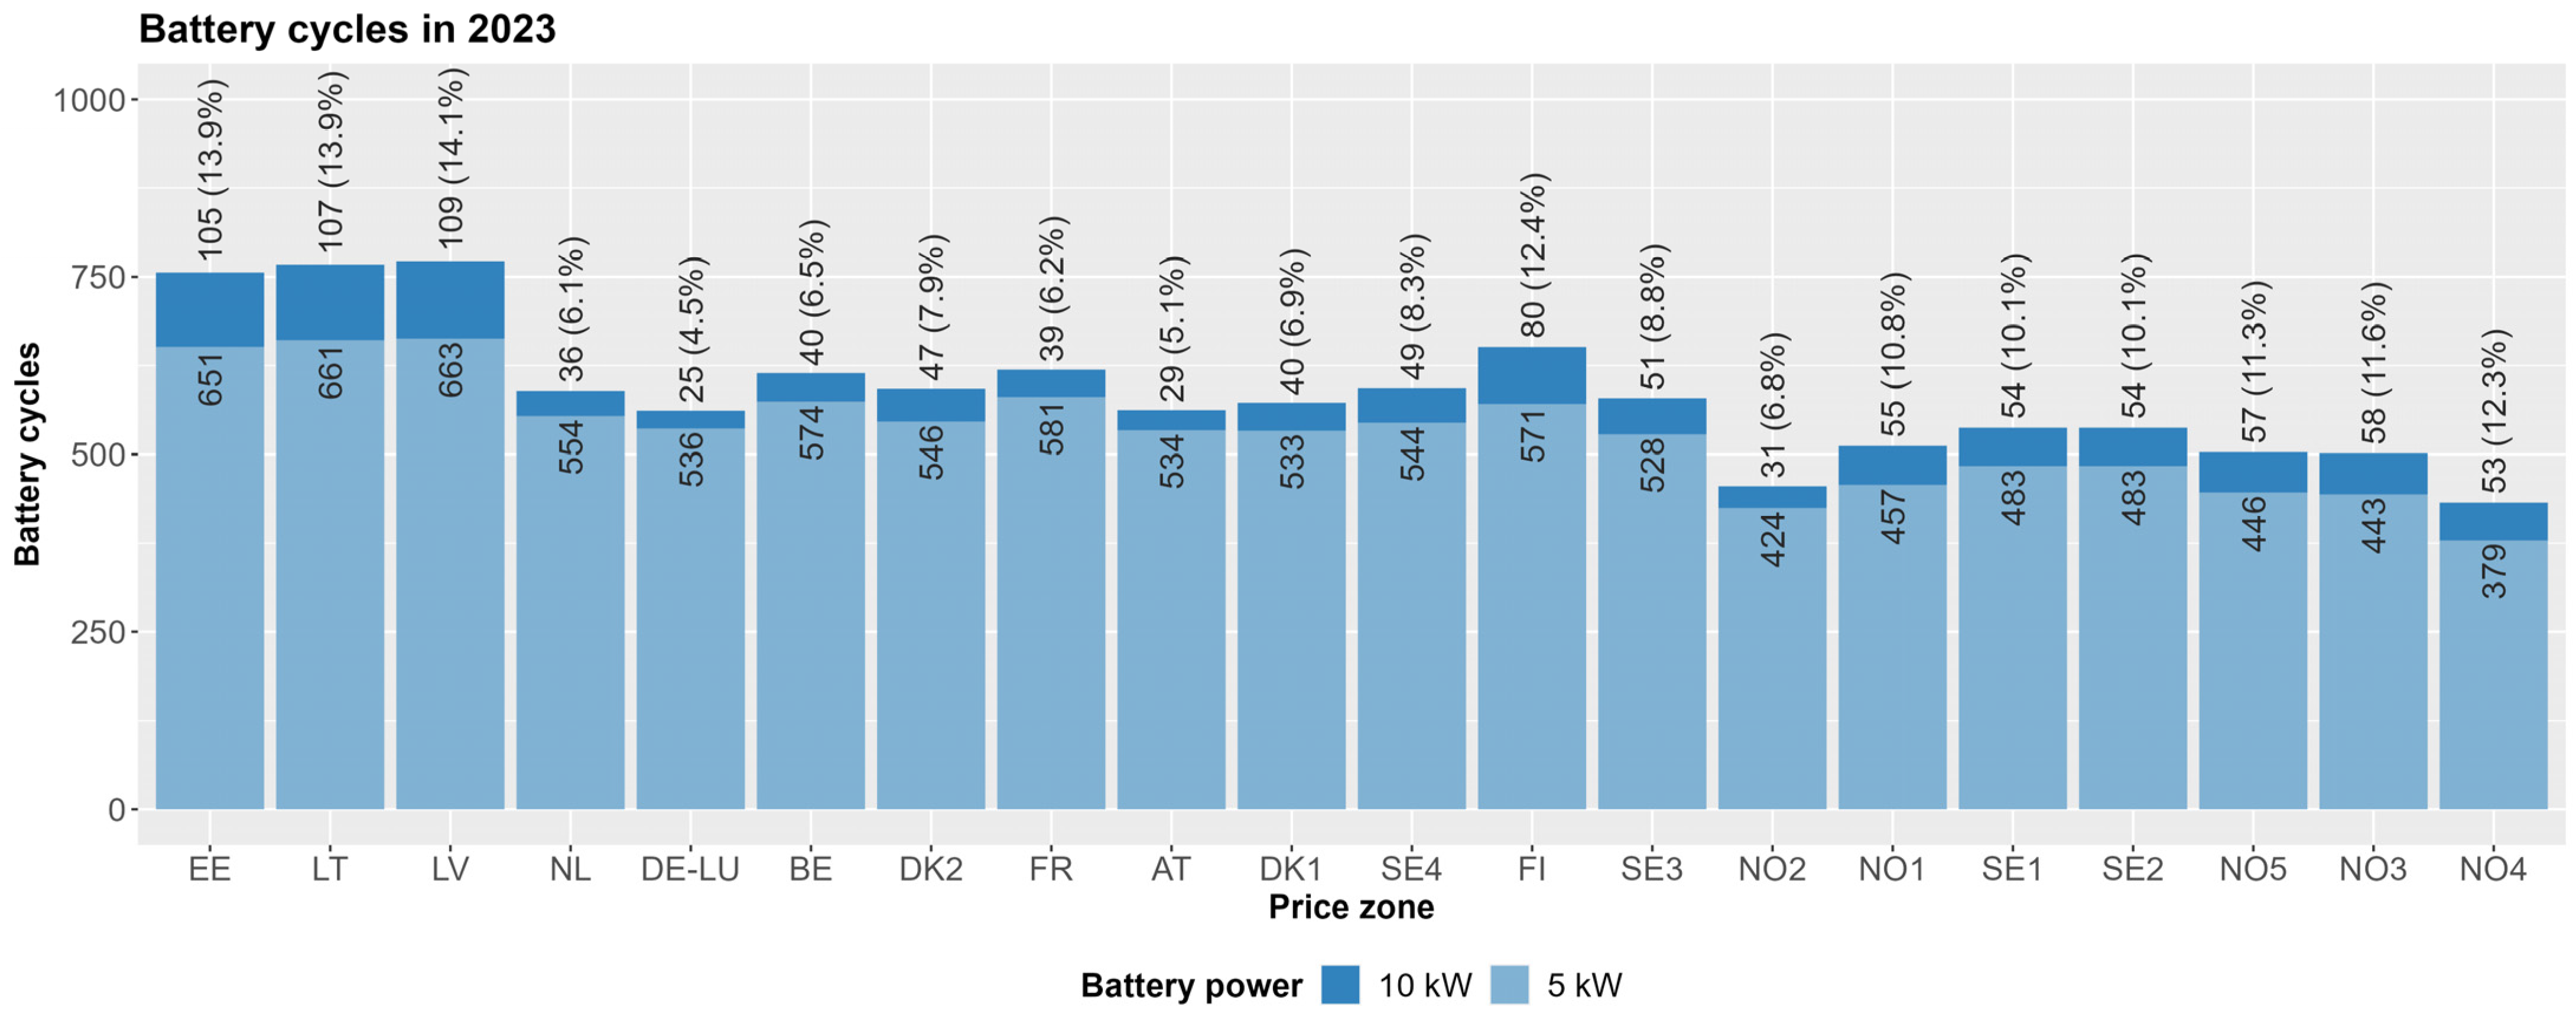
Figure 6 illustrates the percentage increase in total battery cycles when using a 10 kW power battery instead of a 5 kW power battery. The data show that on average, the 10 kW battery results in a 9.38% increase in battery cycles across various price zones. This increase is greater than the corresponding revenue increase, indicating that although the 10 kW battery is cycled more frequently, the revenue per cycle decreases on average (Figure 7). The highest revenue increase per one battery cycle using 10 kW power battery is in the Netherlands (0.0124 EUR) and in Austria (0.0123 EUR). The highest decrease of −0.0212 EUR is in the Estonia price zone and in Latvia −0.0180 EUR. In Norway zone 2 (NO2), there is no difference between using 10 kW or 5 kW power battery. Prices zones where the increase in cycles does not correspond to a substantial increase in revenue indicate inefficiencies in the use of the higher power battery.

Figure 6.
Total battery cycles increase by using a 10 kW power battery compared to a 5 kW power battery.
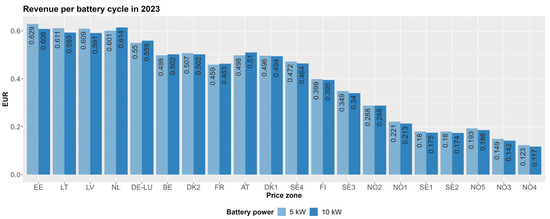
Figure 7.
Revenue per 10 kWh battery cycle by using a 10 kW power battery compared to a 5 kW power battery.
The comparative analysis of results reveals that the economic viability of residential energy storage for price arbitrage varies significantly across different north-western European electricity price zones. The 10 kW power batteries generally result in higher total revenue but not necessarily higher revenue per cycle, indicating a trade-off between battery usage and efficiency. Regions with significant price fluctuations, like the Baltic states, offer the best opportunities for maximizing revenue through optimal battery scheduling. Conversely, areas with smaller price variations may see less benefit from higher power batteries, underscoring the need for targeted policies and incentives to enhance the economic appeal of residential energy storage systems.
4. Conclusions
This study provides a comparative analysis of the potential revenue from residential battery price arbitrage across different north-western European power market electricity price zones. By employing optimal battery scheduling during the day-ahead prices of 2023, we evaluated the performance of 5 kW/10 kWh and 10 kW/10 kWh batteries. The results reveal significant differences in potential revenue among various price zones, highlighting both the opportunities and challenges associated with residential energy storage in the region.
The analysis identified specific price zones with the highest and the lowest potential revenues from battery arbitrage, as follows:
- A 5 kW/10 kWh battery gives the highest revenue in the Baltic region with the top 1 of 409.78 EUR in the Estonian price zone and the top 2–3 with almost identical revenue in Lithuania and Latvia;
- The lowest possible revue is in Norway zone 4 (NO4);
- The mean number of cycles per year in all price zones is 1.4 cycles per day;
- The 10 kW battery results on an average 7.98% increase in total revenue across various regions. The average monetary increase in all price zones is 20.68 EUR;
- The findings indicate that while 10 kW batteries can generate higher total revenue, 5 kW batteries are more efficient in terms of revenue per cycle.
This study provides insights into the economic performance of residential battery storage price arbitrage in different north-western European electricity markets. The methodology and results can guide future studies and inform consumers and energy providers on optimizing residential energy storage for maximum economic benefit. As future work, we plan to analyze battery scheduling strategies when battery storage is coupled with a PV generation system.
Author Contributions
Conceptualization, N.P.; methodology, N.P.; validation, N.P. and V.K.; formal analysis, N.P. and V.K.; investigation, N.P. and V.K.; writing—original draft preparation, N.P. and V.K.; writing—review and editing, N.P. and V.K.; visualization, N.P. and V.K. All authors have read and agreed to the published version of the manuscript.
Funding
This research received no external funding.
Data Availability Statement
According Nord Pool’s policy the price data cannot be published or redistribute to third parties. We provided an url in the references, number [16], where interested parties can find all necessary information about Nord Pool market data (https://data.nordpoolgroup.com/auction/day-ahead/prices, accessed on 10 July 2024).
Conflicts of Interest
The authors declare no conflicts of interest.
Nomenclature
| Zone Definitions | Description |
| AT | Austria |
| BE | Belgium |
| DK1 | Denmark |
| DK2 | Denmark |
| EE | Estonia |
| FI | Finland |
| FR | France |
| DE-LU | Germany–Luxembourg |
| LV | Latvia |
| LT | Lithuania |
| NL | Netherlands |
| NO1 | Norway |
| NO2 | Norway |
| NO3 | Norway |
| NO4 | Norway |
| NO5 | Norway |
| SE1 | Sweden |
| SE2 | Sweden |
| SE3 | Sweden |
| SE4 | Sweden |
| Symbols | Description |
| t | Steps of time |
| Δt | Duration of time period t, 1 h |
| T | Day-ahead optimization period, 24 h |
| C(t) | Energy price at time period t, EUR/kWh |
| Echg(t) | Charge energy at each time period t, kWh |
| Edis(t) | Discharge energy at each time period t, kWh |
| Pchg(t) | Charge power at each time period t, kW |
| Pdis(t) | Discharge power at each time period t, kW |
| Rchg_max | Maximum charging rate |
| Rdis_max | Maximum discharging rate |
| Bcap | Battery capacity, kWh |
| Ichg(t) | Binary variable indicating that battery is charging |
| Idis(t) | Binary variable indicating that battery is discharging |
| SOC(t) | State of charge of the battery at the time t, kWh |
| ηchg | Battery charge efficiency, % |
| ηdis | Battery discharge efficiency, % |
References
- Sioshansi, F.P. California’s ‘Duck Curve’ Arrives Well Ahead of Schedule. Electr. J. 2016, 29, 71–72. [Google Scholar] [CrossRef]
- Sheha, M.; Powell, K. Using Real-Time Electricity Prices to Leverage Electrical Energy Storage and Flexible Loads in a Smart Grid Environment Utilizing Machine Learning Techniques. Processes 2019, 7, 870. [Google Scholar] [CrossRef]
- BloombergNEF. Scaling the Residential Energy Storage Market. November 2023. Available online: https://assets.bbhub.io/professional/sites/24/Scaling-the-Residential-Energy-Storage-Market.pdf (accessed on 16 April 2024).
- BloombergNEF. Lithium-Ion Battery Pack Prices Hit Record Low of $139/kWh. November 2023. Available online: https://about.bnef.com/blog/lithium-ion-battery-pack-prices-hit-record-low-of-139-kwh/ (accessed on 16 April 2024).
- Shabani, M.; Shabani, M.; Wallin, F.; Dahlquist, E.; Yan, J. Smart and optimization-based operation scheduling strategies for maximizing battery profitability and longevity in grid-connected application. Energy Convers. Manag. X 2024, 21, 100519. [Google Scholar] [CrossRef]
- Peñaranda, A.F.; Romero-Quete, D.; Cortés, C.A. Grid-Scale Battery Energy Storage for Arbitrage Purposes: A Colombian Case. Batteries 2021, 7, 59. [Google Scholar] [CrossRef]
- Komorowska, A.; Olczak, P.; Hanc, E.; Kamiński, J. An analysis of the competitiveness of hydrogen storage and Li-ion batteries based on price arbitrage in the day-ahead market. Int. J. Hydrogen Energy 2022, 47, 28556–28572. [Google Scholar] [CrossRef]
- Krishnamurthy, D.; Uckun, C.; Zhou, Z.; Thimmapuram, P.R.; Botterud, A. Energy Storage Arbitrage Under Day-Ahead and Real-Time Price Uncertainty. IEEE Trans. Power Syst. 2018, 33, 84–93. [Google Scholar] [CrossRef]
- Salles, M.B.C.; Huang, J.; Aziz, M.J.; Hogan, W.W. Potential Arbitrage Revenue of Energy Storage Systems in PJM. Energies 2017, 10, 1100. [Google Scholar] [CrossRef]
- Kataray, T.; Nitesh, B.; Yarram, B.; Sinha, S.; Cuce, E.; Shaik, S.; Vigneshwaran, P.; Roy, A. Integration of smart grid with renewable energy sources: Opportunities and challenges—A comprehensive review. Sustain. Energy Technol. Assess. 2023, 58, 103363. [Google Scholar] [CrossRef]
- Soudagar, M.E.M.; Ramesh, S.; Khan, T.M.Y.; Almakayeel, N.; Ramesh, R.; Ghazali, N.N.N.; Cuce, E.; Shelare, S. An overview of the existing and future state of the art advancement of hybrid energy systems based on PV-solar and wind. Int. J. Low-Carbon Technol. 2024, 19, 207–216. [Google Scholar] [CrossRef]
- Lew, D.; Bartlett, D.; Groom, A.; Jorgensen, P.; O’Sullivan, J.; Quint, R.; Rew, B.; Rockwell, B.; Sharma, S. Getting to 100% renewables: Operating experiences with very high penetrations of variable energy resources. IET Renew. Power Gener. 2020, 14, 3899–3907. [Google Scholar] [CrossRef]
- Belmonte, B.B.; Mouratidis, P.; Franke, G.; Rinderknecht, S. Developments in the cost of grid balancing services and the design of the European balancing market. Energy Rep. 2023, 10, 910–931. [Google Scholar] [CrossRef]
- Wang, Z.; Kirschen, D.S. Two-stage optimal scheduling for aggregators of batteries owned by commercial consumers. Transm. Distrib. IET Gener. 2019, 13, 4880–4887. [Google Scholar] [CrossRef]
- Brogan, P.V.; Best, R.; Morrow, J.; Duncan, R.; Kubik, M. Stacking battery energy storage revenues with enhanced service provision. IET Smart Grid 2020, 3, 520–529. [Google Scholar] [CrossRef]
- Nord Pool|Day-Ahead Prices. Available online: https://data.nordpoolgroup.com/auction/day-ahead/prices (accessed on 28 May 2024).
- European Clean Power Pathways Explorer. Ember. Available online: https://ember-climate.org/data/data-tools/european-clean-power-pathways-explorer/ (accessed on 30 June 2024).
- Barbour, E.; González, M.C. Projecting battery adoption in the prosumer era. Appl. Energy 2018, 215, 356–370. [Google Scholar] [CrossRef]
- Wankmüller, F.; Thimmapuram, P.R.; Gallagher, K.G.; Botterud, A. Impact of battery degradation on energy arbitrage revenue of grid-level energy storage. J. Energy Storage 2017, 10, 56–66. [Google Scholar] [CrossRef]
- Pena-Bello, A.; Burer, M.; Patel, M.K.; Parra, D. Optimizing PV and grid charging in combined applications to improve the profitability of residential batteries. J. Energy Storage 2017, 13, 58–72. [Google Scholar] [CrossRef]
- Hassan, A.S.; Cipcigan, L.; Jenkins, N. Optimal battery storage operation for PV systems with tariff incentives. Appl. Energy 2017, 203, 422–441. [Google Scholar] [CrossRef]


Disclaimer/Publisher’s Note: The statements, opinions and data contained in all publications are solely those of the individual author(s) and contributor(s) and not of MDPI and/or the editor(s). MDPI and/or the editor(s) disclaim responsibility for any injury to people or property resulting from any ideas, methods, instructions or products referred to in the content. |
© 2024 by the authors. Licensee MDPI, Basel, Switzerland. This article is an open access article distributed under the terms and conditions of the Creative Commons Attribution (CC BY) license (https://creativecommons.org/licenses/by/4.0/).