Abstract
Lithium-ion batteries are pervasive in contemporary life, providing power for a vast array of devices, including smartphones and electric vehicles. With the projected sale of millions of electric vehicles globally by 2022 and over a million electric vehicles in Europe alone in the first quarter of 2023, the necessity of securing a sustainable supply of lithium-ion batteries has reached a critical point. As the demand for electric vehicles and renewable energy storage (ESS) systems increases, so too does the necessity to address the shortage of lithium batteries and implement effective recycling and recovery practices. A considerable number of electric vehicle batteries will reach the end of their useful life in the near future, resulting in a significant increase in the number of used batteries. It is of paramount importance to accurately identify the manufacturer and model of cylindrical batteries to ascertain their State of Health (SoH) and guarantee their efficient reuse. This study focuses on the automation of the identification of cylindrical cells through optical character recognition (OCR) and the analysis of the external color of the cell and the anode morphology based on computer vision techniques. This is a novel work in the current limited literature, which aims to bridge the gap between industrialized lithium-ion cell recovery processes and an automated SoH calculation. Accurate battery identification optimizes battery reuse, reduces manufacturing costs and mitigates environmental impact. The results of the work are promising, achieving 90% accuracy in the identification of 18,650 cylindrical cells.
1. Introduction
Lithium batteries are ubiquitous in contemporary society. They are utilized in a multitude of applications, including electronic devices, smartphones, and electric vehicles (EVs) [1]. These batteries are essential for the operation of these devices and vehicles. In 2022, 10.5 million electric cars were sold worldwide. In the first quarter of 2023, 1,177,637 electric cars were sold across Europe, representing 10% of total vehicle sales [2]. In countries such as Norway, 84.5% of vehicles sold in the first three months of 2023 were 100% electric vehicles [3]. These data underscore the growing relevance of electric vehicles and the necessity to ensure a sustainable supply of lithium batteries to meet this ever-increasing demand [4]. However, the increasing popularity of electric vehicles, as well as other electronic devices, has also highlighted the importance of addressing the challenge of lithium battery shortages. Furthermore, the necessity to implement effective recycling and recovery practices for these batteries that can still be useful to the industry is evident [5]. In this context, the recovery and reuse of lithium batteries play a crucial role in sustainable resource management and in reducing the environmental impact associated with the production and disposal of these batteries [6].
Lithium-ion batteries are widely used in the field of transportation due to their high energy capacity (200–250 Wh/kg), their near-100% columbic performance, and the absence of a memory effect. In the electric vehicle industry, a battery is generally considered to be no longer suitable if its performance drops below 80% of its rated capacity [7]. It is anticipated that a significant number of electric vehicle batteries will be retired in the coming years. Some estimates suggest that in 2025 alone, approximately 250,000 metric tons of electric vehicle lithium-ion batteries will reach the end of their useful life. According to studies, even with the most optimistic estimates, approximately 3.4 million kilograms of lithium-ion vehicle batteries could end up in common landfills by the year 2040 [8].
Concurrently, in response to global climate change, there has been a notable increase in the transition towards the use of renewable energy sources such as solar or wind [9]. However, power generation from these sources is intermittent, variable over time, and dependent on weather conditions. This has an impact on the performance, voltage stability, and reliability of the power grid [10]. To effectively mitigate this problem, it is beneficial to store the energy generated from renewable sources in batteries before converting it through power inverters to adjust it to the grid requirements, such as voltage, frequency, and total harmonic distortion allowed [11].
Moreover, as the integration of renewable energy systems into the electric grid increases, it is anticipated that the demand for energy storage systems (ESSs) will rise in the coming years. This necessitates the development of sustainable manufacturing processes for these devices [12]. Consequently, it is of paramount importance to investigate the potential for repurposing batteries that have reached the end of their useful life in other industries, such as automotive, for reuse in ESS manufacturing. This operation would not only contribute to the economy and the environment but it would also help reduce the overall demand for batteries, resulting in a substantial decrease in the extraction of chemical materials. Moreover, it would significantly benefit applications related to energy transportation systems.
The reuse of lithium-ion batteries has the potential to reduce manufacturing costs and mitigate waste produced by direct disposal [13]. Furthermore, other aspects must be addressed, including the collection, storage, handling, verification, and recycling of batteries. Nevertheless, due to their high energy potential, the use of these retired batteries has attracted interest. As stated by the authors of [14], the combined capacity of used EV batteries could exceed 185 GWh/year by 2025, with approximately three-quarters of used EV batteries being reused. Second-life batteries (SLBs) have the potential to generate more than 200 GWh by 2030, with a global value of more than USD 30 billion [15]. To maximize the economic and environmental benefits of batteries, those with remaining value can be reused rather than recycled or discarded. Lithium-ion batteries that have reached the end of their useful life due to low performance can be recycled to recover valuable materials or disposed of during the reuse process.
In the contemporary market, there are three principal types of cells utilized in lithium-ion batteries employed in the electric automotive industry. Firstly, there are the so-called prismatic cells. The principal distinguishing feature of these batteries is that they are packaged in a stacked layer format. There is no pre-defined format for this type of cell, as each manufacturer chooses a specific size or design that best suits its purpose. At present, this format represents 40% of the battery cell market [16]. Secondly, there are pouch cells. These batteries are characterized by a lightweight design, primarily due to the use of aluminum as a coating material. Additionally, they are characterized by a compact size and flexible cells that can adapt to a wide range of spaces, with a packaging efficiency of between 90% and 95% [17]. Additionally, they exhibit a higher energy density. These types of cells account for approximately 35% of the electric car market today. However, they have the peculiarity of lacking a standardized format, rendering them susceptible to variations in production costs. Thirdly, cylindrical battery cells are another type of battery cell. The popularity of these types of cells has been significantly enhanced by their adoption by the automotive company Tesla [18]. At present, they account for approximately 10% of the global market. It is anticipated that this format will experience a surge in adoption over the next decade. In 2019, the market volume for cylindrical cells was approximately USD 8 billion [19]. However, one of the main drawbacks of this format is its poor space utilization. The primary advantage of cylindrical cells lies in cost savings, as they are cheaper to manufacture. Additionally, this type of cell is much easier to manipulate to extend their useful life.
Cylindrical cells exhibit several common characteristics, including a metal casing that serves as the negative pole of the cell. The positive pole is typically situated at the top and is isolated from the external environment by a hermetic seal. Internally, cylindrical cells comprise layers of active material, electrolytes, and separators, enabling the regulated flow of lithium ions during electrochemical reactions [20]. Another common feature of this type of cells is that they are usually printed with a series of characters that encode the manufacturer, model, and nominal capacity of the cell, among other data. It is also common among the main manufacturers to assign a color code to the plastic coating that insulates and protects the cells against short circuits. Furthermore, manufacturers also assign a shape and size to the top of the cells where the positive pole (anode) is located, which is another identifying feature of the cell.
The reuse of lithium cells in cylindrical format at the industrial level faces numerous technical and logistical challenges. One of the main obstacles lies in the precise identification of the manufacturer and model of each cell, a critical step to obtain its technical specifications and, consequently, to calculate its State of Health (SoH) based on its nominal values. In an industrial environment, recovered cylindrical cells come from a variety of sources and applications, resulting in a heterogeneous mix of cells with different characteristics and degradation levels. Manufacturer and model identification is essential because technical specifications, such as capacity, voltage, life cycle, and chemistry, vary significantly between manufacturers and models [21]. Without this information, it is extremely difficult to accurately assess the performance and safety of cells for reuse.
In order to calculate the SoH of a cell, it is essential to know its factory ratings, such as initial capacity, internal resistance, and expected life cycle. Without these data, any evaluation of the SoH would be incomplete and potentially inaccurate. This is because the SoH is calculated relative to the original values of the cell; for example, a cell whose capacity has decreased to 80% of its rated capacity may be considered in good condition for certain applications, but without knowing the rated capacity, this assessment cannot be made. Many recovered cells have discolored or damaged labels, and in some cases, manufacturer and model information may be completely absent. The proliferation of battery manufacturers in the market has led to a great diversity in cell specifications. The presence of counterfeit cells on the market can further complicate identification, as they may have incorrect or misleading specifications.
Implementing automated systems to identify cells requires advanced technology, such as machine vision systems and machine learning algorithms, which can recognize cell manufacturers and models from their physical characteristics. However, the variability and condition of the recovered cells complicates the accuracy of these systems. The inability to accurately identify the manufacturer and model of cylindrical cells negatively affects the feasibility of large-scale reuse. Without this information, it is not only difficult to calculate the SoH but also increases the risk of failures and safety issues in secondary applications. This limits the market acceptance of reused cells and can lead to higher operational costs due to the need for more extensive and complex testing.
The precise identification of manufacturers and models of cylindrical lithium cells is a critical aspect for their effective reuse in second-life applications. However, this topic has been scarcely addressed in the current scientific literature, presenting a significant gap that limits the development of industrialized circular economy processes for these cells. Most current studies focus on generating physical models of lithium cells based on parameters such as internal resistance and charge/discharge capacity [22,23]. These approaches, although useful for characterizing the performance and State of Health (SoH) of the cells, are not applicable to an industrial environment where thousands of cells need to be analyzed daily. Traditional methods based on internal resistance are slow and require specialized equipment, which hinders their scalability and efficiency in large-scale processes.
Another line of research focuses on the use of computer vision and artificial intelligence (AI) technologies for the detection of lithium-ion cells in waste treatment plants [24,25,26]. These works mainly aim to identify and segregate loose cells among other waste to prevent fires and severe damage during waste processing. Although these advanced technologies are promising, their goal is limited to the general identification of cells, without considering the specification of the manufacturer or model necessary for detailed analysis and reuse in second-life applications. There are also studies that address the process of unpacking EV batteries through the monitoring of computer vision systems to improve and optimize the processes [27,28,29]. These studies do not focus on analyzing each of the disassembled cells since all the cells in a pack mounted in an EV battery are from the same manufacturer and model. There is a study [30] that has explored the use of computer vision to identify lithium-ion cells based on the standardized IEC 60086 code. This code provides information about the cell type but not about the specific manufacturer or model. As a result, this approach is insufficient to determine the precise technical specifications of the cells, which are crucial for evaluating their SoH and suitability for reuse.
Currently, there are no studies that incorporate the identification of lithium cells using external characteristics such as printed codes, cell color, or anode shape through an integrated system. This type of identification is essential to create an efficient and scalable process for the industrialized reuse of lithium cells. Therefore, this study contributes a significant novelty given the lack of comprehensive studies that enable the creation of systems capable of quickly recognizing the manufacturer and model of a cell based on its visual characteristics. The innovative system designed (1) facilitates the acquisition of technical data necessary to calculate the SoH based on the original nominal values; (2) allows for rapid and accurate classification of recovered cells, optimizing industrialized evaluation and reuse processes; and (3) minimizes the time and costs associated with exhaustive testing, enabling the efficient handling of large volumes of cells.
This work addresses the task of accurately identifying the manufacturer and model of the main cylindrical cells available in the market, through their external characteristics. This task will be performed using two identification techniques based on artificial vision: basic text recognition with optical character recognition (OCR) and dot matrix recognition on the one hand, and through the analysis of the color of the batteries and the morphology of the anode of the cells on the other hand. This document is structured as follows: Section 1 deals with the introduction to the problem and the different elements to consider. Section 2 provides an overview of the system proposed in the article. Section 3 details the methodology used in the work, including the automated image acquisition system, the techniques for text detection on cells, the mechanism for cell identification through the external color of the insulating coating, and the identification model through cell anode characteristics. Finally, Section 4 details the experimental results and the conclusions are presented in Section 5.
2. Proposed System
The proposed system is designed to address one of the initial steps necessary for the reuse of cylindrical lithium cells. This involves classifying the cells by manufacturer and model to determine their nominal capacity. This stage is after the acquisition of waste and disassembly of the battery groups (cells) prior to their testing to ascertain their SoH and final classification. This process is illustrated in Figure 1.
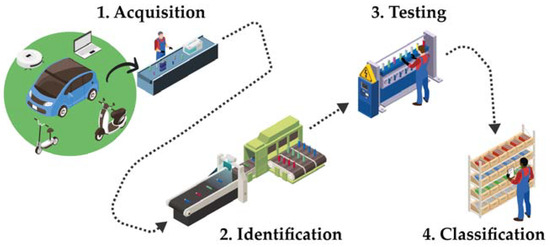
Figure 1.
The four main steps in the second-life recovery process of lithium-ion cells are as follows: (1) Acquisition—collecting used cells from various sources; (2) Identification—determining the manufacturer and model to obtain technical specifications; (3) Testing—evaluating the cells’ State of Health and performance; and (4) Classification—sorting cells based on their suitability for reuse in second-life applications.
The classification process by automatic identification allows for the classification of a set of batteries incorporated into the system according to a specific criterion, such as the manufacturer or the nominal capacity. For this to be accomplished, the battery database utilized must contain this information for each record.
To implement the proposed classification system, we have utilized several collaborative and open databases that contain information on cylindrical battery cells manufactured by the leading manufacturers [31]. These databases provide basic data on each cell, including manufacturer, model, shape factor, external and ring color, and high-resolution images (one side view and another of the anode tab view). Furthermore, additional technical data, including nominal voltage, nominal charge and discharge capacities, operating temperatures, and weight, among other variables, are available for each record. Additionally, datasheets from leading lithium cell manufacturers have been compiled.
After a comprehensive examination of the available options to identify the most effective solution for the intended purpose, it was determined that two complementary identification mechanisms would be most suitable. The first mechanism is designed to identify the batteries by recognizing the text printed on the cell. A second mechanism is employed to classify them according to their external characteristics, including external color, anode morphology, and color of the upper ring. If conclusive results are not obtained with the first mechanism, the second method will be applied as a complementary method. In both cases, computer vision solutions are utilized through automated image acquisition and subsequent processing. Figure 2 depicts the decision flow diagram utilized in the system. It can be observed in this diagram that, following the automated acquisition of images of the exterior of the cell, a preprocessing step is performed for normalization. Subsequently, a preliminary search for printed text on the cell is initiated. If no text is detected, the complementary method of color analysis and anode morphology is initiated. If text is detected, the OCR mechanism is employed to ascertain the intelligibility of the text for the system. If the text is identifiable, the cell is successfully identified. Conversely, if the text is not intelligible, it is likely to have been generated by matrix printing, and a second recognition process, specialized in matrix text recognition, is initiated. If this recognition process is successful, the cell is successfully identified. Otherwise, it is classified alternatively by color and anode morphology. If, following an evaluation of the external color and anode morphology, the system is unable to obtain a result with a high level of confidence, the cell will be classified as unclassified and will be subject to further manual study by the operators of the treatment plant.
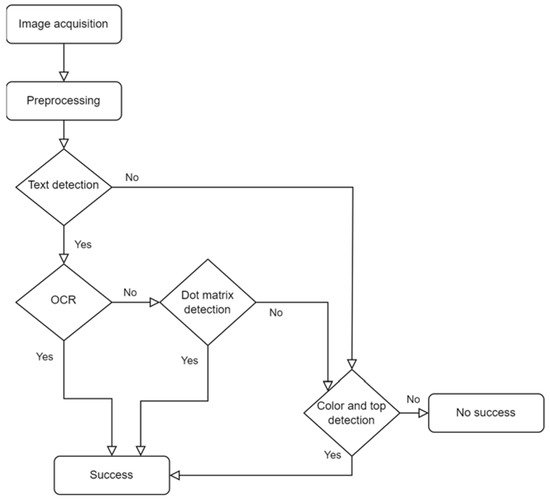
Figure 2.
Flow chart for the identification of cells in the system. If text is detected on the image of the cell, the cell is identified by means of the text; if no text is detected, the process of identification by color and anode begins.
3. Methodology
3.1. Image Acquisition
This section describes the process of acquiring the cell images in the automated identification and validation process. As illustrated in Figure 3, the image acquisition system comprises a set of two cameras, a light source, and a rotor with an encoder moving across the conveyor belt. The upper camera is a line scan camera that captures a 2048-pixel line and is synchronized with the motor encoder that rotates the cells to obtain a panoramic image of their exterior. The rotor with encoder is anchored to the rotating system on which the cell is placed for analysis. During the 360-degree rotation of the cell, the upper camera performs a total of 1025 lines of capture, resulting in a high-resolution image of 2048 pixels by 1025 pixels. The lower camera is an area scan camera that photographs the anode tab of the cell with a resolution of 2064 × 1544 pixels.
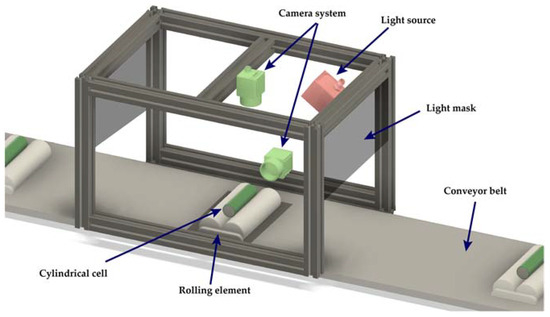
Figure 3.
Image acquisition device for recovered cells consisting of a conveyor belt, a cell turning system and a system of two cameras, and a fixed point of light to record the outside of the cell.
The LED illumination system is designed to avoid possible reflections on the cell surface. As the cells have a bright color coating, uniformly illuminating the surface for proper capture is a fundamental task in the image acquisition system. For this purpose, an LED spotlight is placed on one of the sides of the capture area. To prevent reflections, the entire area is obscured with opaque elements, ensuring a uniformly illuminated capture area.
Figure 4 illustrates the outcome of scanning the surface (a) of a cell (c) exhibiting an irregularity (in red). The adhesive in question is utilized to join the cells in the battery packs from which the cell has been extracted. The blue coloration allows for the observation of the code printed on the cell, which serves to identify the model and manufacturer of this cell. Additionally, the image of the anode tab area with the protection ring is visible in white (b).
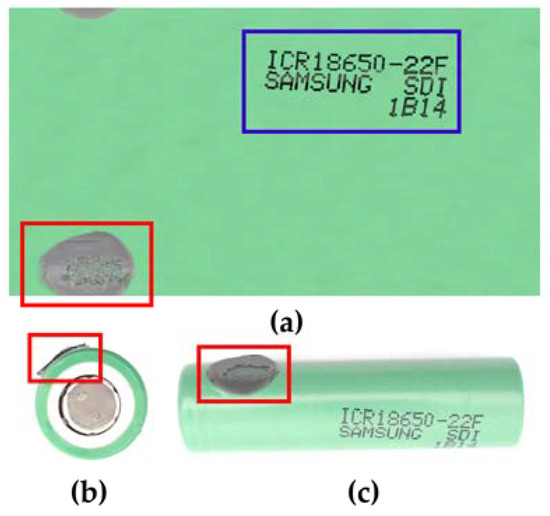
Figure 4.
Example of the image generated by the image acquisition device for an 18,650 cell. The printed code, which identifies the model and manufacturer of the cell, is shown in blue. A piece of adhesive, attached to the surface, is shown in red. (a) Full image of the outside of the cell. (b) Top image of the anode of the cell. (c) Image of the analyzed 18,650 cell.
3.2. Preprocessing
It is crucial to acknowledge that both the images captured by the imaging device and the database images must undergo normalization. The process of contrast normalization (homogenization) of an image entails the forced conversion of brighter pixels to white, the darker ones to black, and the linear rescaling of intermediate pixels to produce comparable images. One of the principal challenges associated with the utilization of a computer vision system is that the RGB (red, green, blue) color data obtained originate from signals generated by a charge-coupled device that is dependent upon itself [32]. Consequently, the color sensitivity of the device and the spatial illumination vary considerably, rendering the generation of normalized data without ad hoc processing challenging.
To circumvent the issues associated with the device, it is possible to employ the algorithm proposed by [33], which enables the conversion of device-dependent RGB color data into non-device-dependent L*a*b* color data with a minimal error rate. The algorithm achieves an error rate of 2.2 units in the Lab color space [34]. The algorithm employs a combination of linear transformations of the color space and complex multiple regression mechanisms. The algorithm is adaptive and can be readily recalibrated to integrate with any computer vision system.
For the data obtained to be reliable, it is necessary to employ a tool that allows for an initial color calibration. This is achieved through the utilization of a commercially available high-precision physical palette, such as the GretagMacbeth ColorChecker®, which is employed in the calibration of industrial precision cameras. The tool comprises a series of pre-selected color patches that are employed for the purpose of testing and assisting in image processing. Because of the deployment of these devices, the corrected color profile is obtained and subsequently applied to the captured images. This markedly enhances the probability of success in the battery identification process.
3.3. Text Detection
One of the most notable characteristics of cylindrical cells is their external marking through dot matrixes. This low-cost printing system is widely used in the industry to print on three-dimensional and irregular surfaces in a timely and efficient manner. In certain instances, this marking on the surface of the batteries is produced in motion, when the cells are not stable and rotate on themselves. This makes the reading process more complex. Figure 5a illustrates the comparative difference in the marking of two identical cells. Another issue is the inconsistency between the color of the marking and its deterioration over time, as illustrated in Figure 5b. This is a significant factor that impedes optimal optical recognition of the printed characters on the cell. In these cases, if the designed system is not able to detect the text on the cell due to its poor condition, the identification process is initiated through the method of identifying the color of the external wrapping and the shape of its anode, as described in Figure 2.
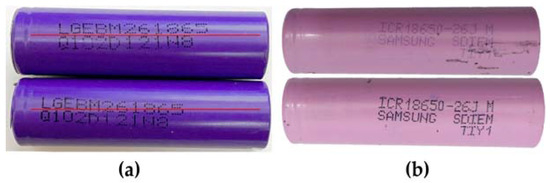
Figure 5.
Example of 18,650 cells with inconsistencies in their printed code. (a) The printed code is rotated between cells in the same batch. (b) The code in some cells is partially erased or with a minor amount of ink.
Another factor that impedes optimal recognition is the external condition of the re-covered cells once they have been disassembled from the original pack. In many cases, the disassembly process damages the outer coating, preventing a correct visualization of the code printed on the cell. As illustrated in Figure 4, there are traces of the adhesive used in the pack assembly process that could not be removed from the recovered cell but that do not affect the text area. In other instances, these residual materials and imperfections impede the accurate visualization of the text, as illustrated in Figure 6. This issue necessitates the implementation of a sophisticated two-phase methodology for the identification and recognition of text in cells where at least partial characters are discernible. In cases where the requisite number of characters cannot be detected, we will proceed to classify these cells based on their anode tab color and morphology.
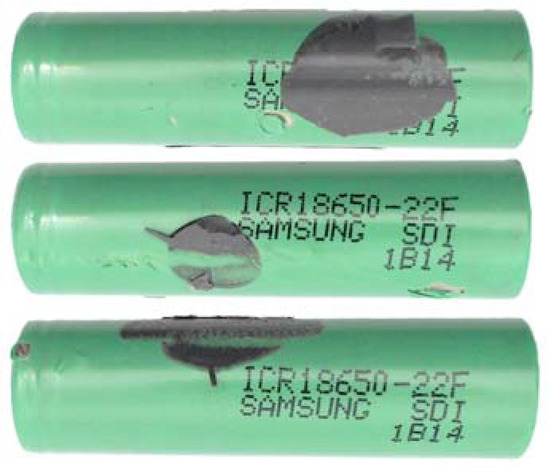
Figure 6.
18,650 cells with adhesive particles on the printed code on the outside of the cell making it difficult to identify.
Considering the issues, we propose the use of a detection model based on a Differentiable Binarization (DB) network to identify the text by performing binarization on the segmented image network, as illustrated in Figure 7. The image representation is converted into a high-dimensional convolutional feature map through the feature pyramid backbone network, based on the ResNet architecture [35]. The map is used to predict both the probability map and the threshold map, after which the binarized map is generated to localize the text. Binarization post-processing is crucial for segmentation-based detection, transforming the probability map into a binarized map of the text region to identify its location. This process is performed with adaptive binarization for each pixel in the image, adjusting the threshold by learning the network. Binarization is meticulously integrated into the network training process to guarantee threshold robustness in the final output image. This facilitates post-processing and enhances text detection. This mechanism is responsible for highlighting strong correlations and ignoring irrelevant information, ensuring that the network focuses solely on character features to improve the accuracy of the detection algorithm. This minimizes the potential for interference due to imperfections or elements stuck on the cell surface.
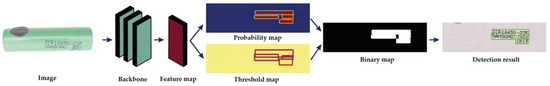
Figure 7.
Architecture of text detection model based on Differentiable Binarization.
The network’s fundamental structure is a pyramidal feature configuration, based on the ResNet18 model, which integrates feature layers of varying scales using a Feature Pyramid Network (FPN). The FPNs are resampled to the same scale and cascaded to produce features, which are then used to predict probability maps (P) and threshold maps (T) from the feature maps. The approximate binary map (B) is then calculated using P and F. The calculation process is carried out using Differentiable Binarization. The formula is as follows:
B represents the approximate binary map, T denotes the learned adaptive threshold map of the network, and k denotes the amplification factor. The amplification factor k is empirically set to 50, as indicated by the authors of [35]. This approximate binarization function is differentiable, thereby enabling optimization with the segmentation network during training.
Once the text has been located, the next step is to determine whether it can be recognized using a standard OCR mechanism. If it cannot be recognized, it is recognized using the dot matrix reading mechanism, which is explained in detail below (Section 3.4). For the initial reading of the text, Tesseract 4.0 OCR is used. This OCR system bases its operation on image analysis in different stages [36]:
- The first is a connected component analysis in which the contours of the elements are stored, attempting to recognize words. If successful, the word is passed to an adaptive classifier as training data.
- A second pass applies possible learning from the previous step, which attempts to recognize words that were not recognized well enough.
- A final stage tries to resolve the scattered spaces and tests alternative hypotheses of height to locate the use of versals in the text.
Tesseract makes use of the following procedures:
- Line and word search: line search, baseline adjustment, fixed and cut-off pitch detection, proportional word search.
- Word recognition: cut and overlapping characters, association of “broken” characters.
- Static character classifier.
- Language analytics.
- Adaptive classification.
To ascertain whether the cell information has been correctly identified, the percentage confidence score provided by Tesseract in its prediction is initially examined. Currently, there is no standardized value for the confidence threshold score that an OCR application must exceed to be considered sufficiently adequate. According to some authors, this value can vary between 71% and 98%, depending on the context and specific requirements of the digitization and OCR evaluation project [37,38]. In the case of this work, after numerous tests, results that reached a value equal to or greater than 75% provided sufficient results for correct identification. Below this value, the number of identified cells drops to 50%. Therefore, it is considered an adequate value and within the margins indicated in different research studies.
Therefore, if the initial confidence score provided by Tesseract exceeds 75% (Tesseract OCR confidence threshold score), it is then investigated whether this manufacturer and model information is present in the extant commercial cell database, resulting in the generation of an accuracy indicator score based on the degree of similarity between characters. This accuracy indicator is based on the “edit distance algorithm,” proposed by Levenshtein [39] and adapted in [40] using a dynamic programming algorithm. The mechanism is based on the calculation of the minimum number of operations required (deletions, insertions, or substitutions) to transform one string of characters into another. This is the most used algorithm in spell checkers and predictive text systems, which act similarly to software designed by searching a dictionary. The algorithm for calculating the precision indicator has a bottom-up design. The Levenshtein distance between two strings, a and b, is calculated by the function , where and represent the length of strings a and b, respectively.
where 1 is the indicator function, being equal to 0 if or 1 in any other case. is the distance between the prefixes of the strings (the first i characters of a and the first j characters of b). Figure 8 shows the pseudocode that allows us to calculate this distance between two strings, str1 and str2.
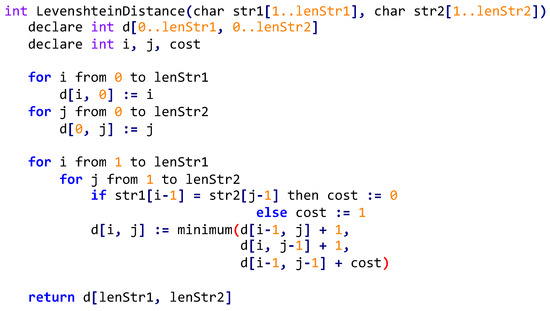
Figure 8.
Pseudocode based on the Levenshtein distance that allows us to calculate this distance between two strings, str1 and str2.
In case the confidence percentage of the Tesserat OCR is less than 75% or the calculated accuracy indicator score is less than 45%, the next step is to analyze the text through the dot matrix identification system. In this case, the selected threshold for the accuracy indicator score has been set at 45% as a starting point, taking into account the number of elements available in the database and the tests performed with different threshold values. Below 45%, the tests performed indicate that character strings in cells where only one or two characters change are recognized with a higher error rate.
3.4. Recognition of Dot Matrixes
To identify and read the cells containing printed characters using the dot matrix technique, it is necessary to carry out a preliminary process. First, the image of the text is segmented into individual characters to identify each character more precisely. To perform this segmentation task, we start from the binary map of the text localization process described in Figure 7. In this binary segment, the black pixels are dilated, and the basic contours are searched. Subsequently, the bounding box of a connected component is extracted as a character region based on the methodology proposed by the authors of [41].
The definition of (region of interest) is given by the following equation: , where i is the i-th character region, and where and are the coordinates of the upper left of the region, and and are the height and width of the region, respectively. If several regions overlap by more than 20%, these regions are combined and considered as an isolated character. When is greater than , the method considers to be separated into several isolated characters. The number of segmentations required to form isolated characters increases from s + 1 to s + 5, with the region divided so that the width of each character is the same. In this case, the split regions become candidates for segmentation, with the true segmentation determined in a subsequent step. The value s is the floor of (. Figure 9 illustrates the process of extracting dot matrix characters from the identified text regions.
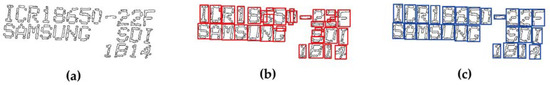
Figure 9.
Example of dot matrix approximation of the printed characters for an 18,650 cell. (a) Input image obtained from the capture system. (b) First approximation of the algorithm with some errors. (c) Correct identification of the individual characters.
Once all the regions corresponding to each of the localized characters have been obtained, we proceed to their recognition. For this purpose, we make use of one of the most widely used convolutional neural networks (CNNs) in the field of pattern recognition and specifically in the recognition of printed and handwritten characters, LeNet-5. The LeNet-5 architecture, modified for this purpose, consists of six layers, excluding the input and output layers. It follows a classical CNN design that has influenced many subsequent architectures. The neural network has been trained through a proprietary dataset, which has been tuned to meet the character recognition requirements present in most cylindrical cell manufacturers. Specifically, there are a total of 39 characters shown in Figure 10. Only uppercase characters have been considered since no entries with lowercase labels have been identified in the database. The images were converted to greyscale, normalized and adjusted to uniform sizes to improve data quality and consistency. The dataset was divided into 80% for training and 20% for model validation. The network was configured with six layers, maintaining its classical design but adapted to the project specifications. As for the hyperparameters of the model training, parameters such as learning rate and batch size were adjusted to optimize the training process. The backpropagation algorithm with the Adam optimizer was used to adjust the network weights. Accuracy and loss metrics were monitored to adjust the hyperparameters and iteratively improve the model. This detailed approach ensures that the neural network is able to accurately recognize the characters printed on the cylindrical cells, even in the presence of common label variations and defects.
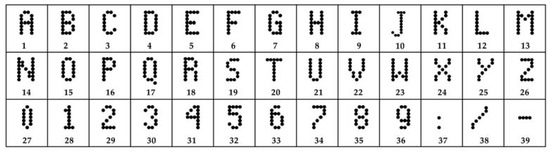
Figure 10.
The 39 dot matrix characters trained to be recognized across the network.
LeNet-5 accepts images of 32 × 32 × C pixels, where C is the number of image channels. When working with grayscale images, only one channel is utilized. The implemented architecture is illustrated in Figure 11 and described in detail below.
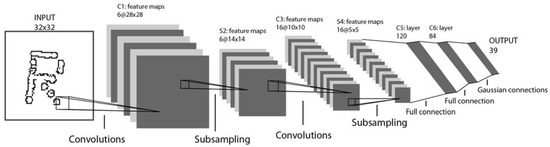
Figure 11.
LeNet-5 architecture implemented for printed character recognition with dot matrix technique.
- Layer 1: This convolutional layer employs a grayscale image as its input and is processed by six feature maps of filter size 5 × 5 with a stride of one. This results in an output of size 28 × 28 × 6 from the input image of 32 × 32 × 1. Furthermore, two activation functions are applied to determine the output of this layer. First, the SoftMax function is applied to normalize the convolution output to a probability distribution. Then, the ReLU function is applied to convert the possible negative inputs to zero.
- Layer 2: The pooling layer is of average complexity, comprising six feature maps of filter size 2 × 2 and a stride of 2. The resulting output image has a final dimension of 14 × 14 × 6.
- Layer 3: This is another convolutional layer with 16 feature maps of filter size 5 × 5 and a single stride level. Only 10 of the 16 feature maps in this layer are linked to the 6 feature maps in layer 1. This is to break the symmetry of the network while maintaining a manageable number of connections. The output image has a dimension of 10 × 10 × 16, in addition to which ReLU is applied as an activation function.
- Layer 4: This is another average pooling layer with a filter size of 2 × 2 and a stride of 2, but with a total of 16 feature maps. The output image dimension is 5 × 5 × 16.
- Layer 5: A final convolutional layer is introduced, comprising 120 feature maps of filters of size 5 × 5 and a stride of 1. The three-dimensional output is flattened to a one-dimensional array of length 120. Finally, the 400 nodes (5 × 5 × 16) of layer 4 are connected to each of the 120 units of layer 5.
- Layer 6: This is a fully connected dense convolutional layer with 84 feature maps of size 1 × 1. Each feature map is connected to the 120 nodes of the matrix returned by the previous layer. ReLU is applied as an activation function.
- Output layer: The SoftMax output layer has 39 potential values corresponding to the labeled characters in the training dataset (Figure 10); it is the last layer.
Once each of the characters have been classified, the cell model is identified from the text obtained. This is achieved by employing the Levenshtein edit distance algorithm. The text string is decomposed by separating it into words, and the search is initiated in the database. As in the case of OCR, a score value is generated, which determines the most probable match among the available values in the database. Figure 12 illustrates the process of recognizing a Samsung ICR18650-22F cell, with the corresponding processed image presented in Figure 9.
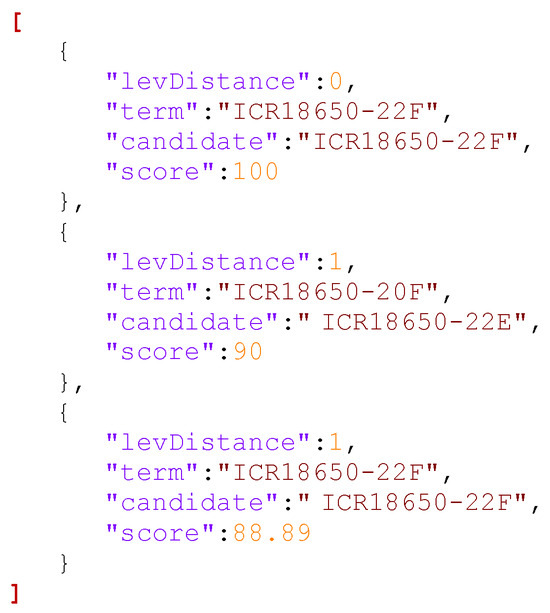
Figure 12.
Example output of the distance calculation algorithm for an ICR18650-22F cell.
3.5. Identification by Color Analysis
As previously stated, a significant proportion of the cells lack an easily discernible printed code, or alternatively, the code is embossed rather than inked, which renders the identification process by OCR mechanisms challenging. Additionally, the outer coating of the cell may be in a deteriorated state due to the recovery operation of the cell from the original battery or pack. Consequently, it is proposed to utilize a second complementary mechanism: classification by means of chromatic identification.
The objective of this phase is to identify the predominant colors present in the captured image and contrast them with the colors stored in the reference battery database. This allows for the classification of the model based on the color of its coating. To obtain the predominant colors of each image, the OpenCV tool and the scikit-learn library in Python are employed. This mechanism receives an image as a parameter and returns the dominant colors in plain text in RGB format.
The tool’s operation is based on the use of the K-means clustering algorithm, also known as Lloyd’s algorithm [42]. In particular, the tool makes use of an optimized version of the algorithm that uses geometric methods for acceleration, as proposed by the authors in [43].
The K-means algorithm is designed to group objects into k clusters based on their characteristics. It employs a refinement technique in an iterative manner, whereby an initial set of k centroids, , is used as a reference point. The algorithm then alternates between two steps, as outlined in reference [44].
- Assignment: assign each observation to the group with the closest mean:
- Update: calculate the new centroids as the centroid of the observations in the group.
The algorithm is considered to have converged when the assignments no longer change. In the specific case of the proposed system, the process begins with a random estimation of the number k of image colors (centroids). At each iteration, each pixel of the image is traversed to identify its nearest centroid (in color). The centroids then calculate the average of the colors near them, moving towards that color. The process is repeated until the centroids cease to move or until the maximum number of defined iterations has been reached.
The proposed system employs color-based groups to facilitate independent channel-to-channel distance determination. The output returns the predominant colors in an ordered manner, with the first being the most likely to identify the battery in most cases. The second, closely resembling white, is influenced by the background and is expected to be the second most dominant color in all captured images. Consequently, procedures have been designed to discard it. Once this information is obtained, it is necessary to make a comparison with the dominant colors of the batteries stored in the database. Analogously to the OCR system, a function will be used to determine the distance between the colors stored in the database and the dominant colors in the image, to obtain a quantitative result. For this purpose, the algorithm proposed by [45] and implemented in [46] will be used. The mechanism is characterized by a low computational cost, resulting from the combination of weighted Euclidean distance functions. The weighting factors depend on the magnitude of the red component of the color.
The system is based on the RGB model, which is a three-dimensional orthogonal space, which facilitates the calculation of the Euclidean distance, something that does not occur with other color spaces. The Euclidean distance (4) between two colors is determined by , where C represents each color and the subscripts R, G, B represent the channels:
The algorithm first calculates the average level of the red channel (5):
Later, it will weight the signals according to this average level. The distance between the colors and (where each one integrates the three channels) has a range from 0 to 255, resulting from the possible values for each channel contemplated by the RGB model.
The increase in value is calculated for each of the colors independently:
To then determine the Euclidean distance,
The potential color combinations in the RGB model result from the product of color combinations of each channel, 2(8—3), which yields 16,777,216 possible variations. This figure is considerably higher than the number of colors that humans can distinguish, which is estimated to be approximately two million [47]. This abundance of color options justifies the choice of this model for the present case.
3.6. RGB Color Distance Score Calculation Function
To establish a similarity value between the analyzed color data and the data available in the database, the algorithm depicted in Figure 13 has been implemented based on the one proposed by [34]. The authors of the algorithm have considered including constants by modifying the value of the red and blue channel to adjust the gamma correction, which has been incorporated into the function during coding.
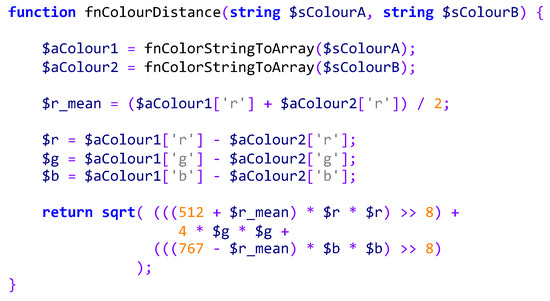
Figure 13.
Pseudocode of the function for calculating distance between RGB colors.
To validate the designed algorithm, 16 pairs of colors were presented, as illustrated in Figure 14. In case 1, the pair consisted of the same color (pure white), resulting in a distance value of 0. In the second case, pure black and white were confronted, resulting in the highest possible value of percentage distance. Subsequently, in Sets 3 and 4, the differences between the independent channels were measured at 100%: red vs. green and green vs. blue. The resulting distances were 85 and 88, respectively. It should be noted that the distance is not identical in each case, as the parameters for gamma correction were included in the calculations. In cases 10 to 14, the color #FFC0CB was deliberately selected in lieu of visually similar colors (#FFB6C1, #DDA0DD, #EE82EE, #FA8072, and #DB7093) because this color range is present in a significant number of batteries. This illustrates that the algorithm calculates distance values that are sufficiently disparate to correctly distinguish similar colors. Furthermore, the designed system is sufficiently robust to discard elements that may interfere with the recognition of primary colors, such as potential flaws or silicon adhered to the cell surface.
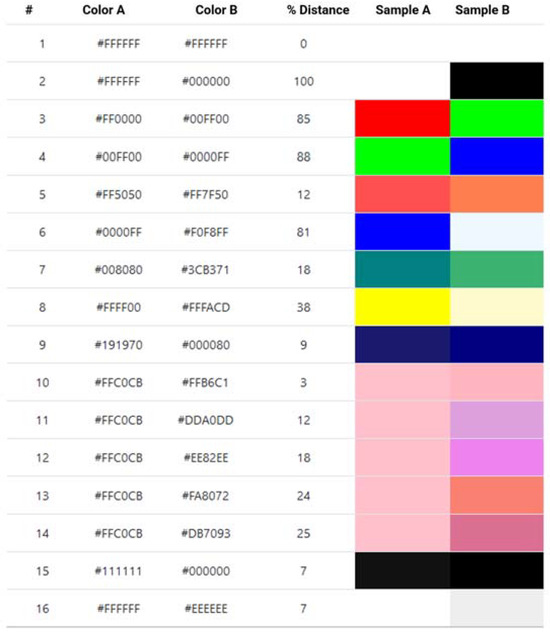
Figure 14.
Generated test results to validate the calculation of distance between colors.
To illustrate the operation of the chromatic identification system, the data pertaining to the recognition of a cell model, Sanyo NCR18650BL, are presented below. This is a cell that has no printed data on its exterior; instead, it has an embossed code that is impossible to read through the OCR reading method. Figure 15 shows the results of the analysis of one of these cells, which contains traces of adhesive on the top. The four predominant colors have been calculated. A comparison of the color parameters of the captured battery with the database image is performed. The algorithm compares the four most dominant colors of the captured image with those of the image stored in the database, resulting in the calculation of 16 possible combinations. Figure 16 illustrates the data of the battery model indexed in the database.
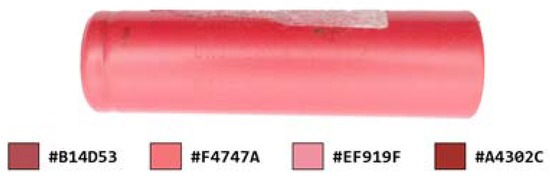
Figure 15.
Image of a Sanyo NCR18650BL cell without codes printed on the surface.
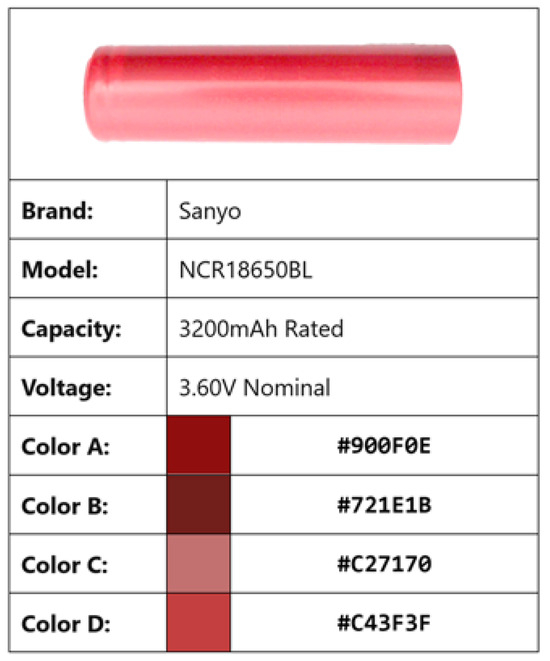
Figure 16.
Color data sheet for Sanyo NCR18650BL stored in the database.
Figure 17 presents a color-to-color comparison between the four primary colors of the captured image depicted in Figure 15 and the available data. Six instances are identified where the score is less than 12, with the percentage of distance highlighted in gray. This indicates that the algorithm is functioning correctly in the identification of the battery. The threshold value, which in this case is 12, is a parameter that has been demonstrated to be constant when identifying the colors stored in the database. An image is considered to have been identified when the percentage difference between the four most predominant colors in the image and the four most predominant colors in the reference image is less than 12 percentage points on at least five occasions.
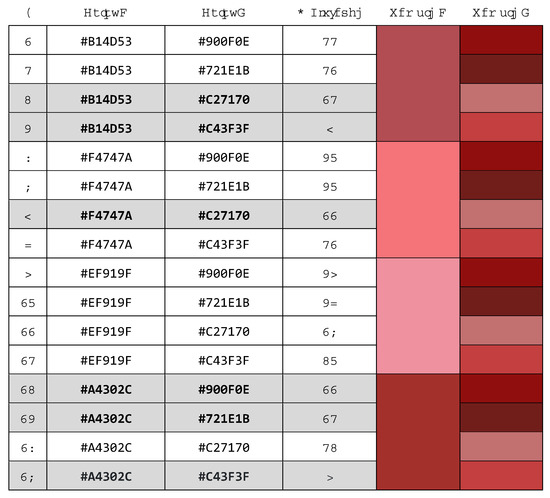
Figure 17.
Result of comparison of the cell shown in Figure 14 and the data stored in the database.
3.7. Identification by Shape of Anode
The shape and color of the cell anode can also be employed to facilitate more accurate identification of a cell. While these characteristics are not inherently unique, they can be pivotal in identifying a cell that has more than one match with the color identification algorithm described above. Cylindrical cells, such as 18,650 cells, contain a series of standardized elements at the top (anode) that serve as safety features. Figure 18 illustrates the principal visible components of the anode, which comprise safety elements such as the outer thermo-shrinkable coating, the sealing seal that isolates the positive terminal from other parts of the cell to prevent short circuits, and the different slots of the safety vent valve. In the event of an increase in the internal pressure of the switchgear due to faults such as overheating or overloading, these valves will open to release the accumulated gas, thus avoiding a possible explosion. Manufacturers have designed different variations of these slots (as shown in Figure 19), which do not follow a particular standard in indicating the number and size of the slots. The distinctive variations in the number and configuration of the slots permit the differentiation of two cells with similar colors and disparate anodes.
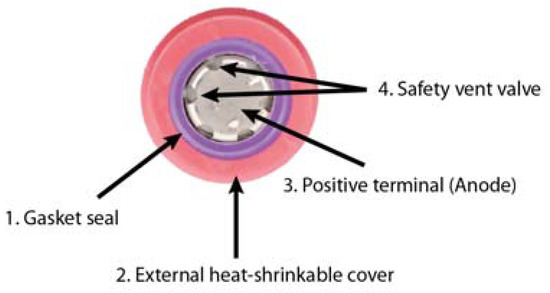
Figure 18.
18,650 lithium cylindrical cell anode elements: (1) gasket seal: (2) external heat-shrinkable cover; (3) positive terminal or anode; (4) safety vent valve.
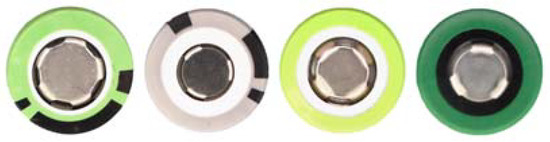
Figure 19.
Different morphologies and colors of 4-cell anodes from different manufacturers and models.
To identify, segment, and analyze the various components present within the cell anode, the Segment Anything Model (SAM) neural network architecture is employed [48]. This architecture has been designed with the specific objective of addressing image segmentation in an efficient and accurate manner. The SAM approach provides a unified methodology for segmenting any object of interest in an image, irrespective of its class, size, or position. This is accomplished through the integration of sophisticated machine learning methodologies, including convolutional neural networks and transforms, which collectively yield robust and generalizable segmentation outcomes. One of the distinguishing features of the SAM is its capacity to generalize to novel categories of objects that were not encountered during the training phase. This is made possible by its modular design and the use of a vast training dataset that covers a wide variety of scenarios and objects. Furthermore, the SAM incorporates attention mechanisms that permit the network to concentrate on disparate components of the image, thereby enhancing segmentation precision in intricate and challenging scenarios. In terms of its architectural composition, the SAM comprises several key components. These include a CNN-based feature extractor, an attention module that refines the extracted features, and a segmentation head that produces the final segmentation masks. This modular design not only facilitates efficient training and inference but also enables the integration of the SAM with other computer vision architectures and systems. As demonstrated in Figure 20, the SAM enables the fast segmentation of the main anode elements of a cell, which can be used to identify safety slots or safety seal color.
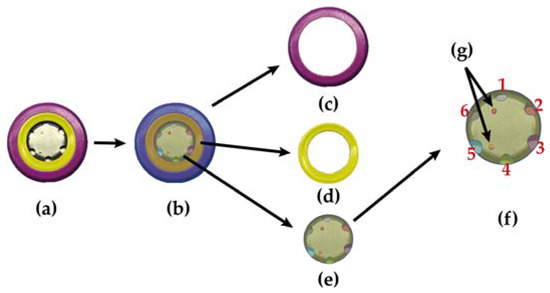
Figure 20.
Segmentation of the elements present in an 18,650 lithium cell anode using SAM architecture. (a) Image of the anode. (b) Segmentation carried out with SAM. (c) Mask corresponding to the outer heat-shrinkable coating of the cell. (d) Mask corresponding to the gasket seal ring. (e) Detail of the segmentation of the positive terminal where the holes for the safety ventilation are located. (f) Count of the different safety holes located. (g) Mask corresponding to other smaller elements detected in the anode such as the welding points of the cell.
The SAM’s training was performed using a diverse and extensive dataset, consisting of high-resolution images of 18,650 cell anodes. The training process included the following steps: For data collection and annotation, 9000 images of 18,650 cells were manually annotated by experts, creating precise masks for components such as the outer coating, the gasket seal ring, and the positive terminals with safety holes. The network architecture of the SAM is composed of a CNN-based feature extractor, an attention module to refine the features, and a segmentation head to generate the final masks. Using supervised learning techniques, the model was trained with the advanced optimization algorithm Adam, and regularization techniques based on Dropout were applied. Cross-validation was used to ensure the model’s generalization ability, with a data split of 80% for training and 20% for testing. Several hyperparameters were adjusted, and the model was evaluated using precision and accuracy metrics, demonstrating high precision in segmenting cell components. This methodology ensures that the SAM can efficiently segment components of 18,650 cells, even when faced with new categories of objects not seen during training.
Once the various components have been divided into distinct segments, they are identified. It should be noted that the initial mask (Figure 20c), which is larger in size, corresponds to the outer portion (heat-shrinkable coating) of the cell. The second mask (Figure 20d), which is smaller than the first, corresponds to the gasket seal ring. Depending on the manufacturer and model, this component may be manufactured in different colors. In most cells, this component is white. However, there are instances where it is colored. The chromatic identification method described above enables the color of this cell element to be identified and stored data to be retrieved.
The third mask (Figure 20e) represents the positive terminal (anode) of the cell, including the safety holes. From this third mask, the different holes present are segmented. Mask elements with a radius smaller than the established threshold value will not be considered as voids but rather as welding points or cell defects. Once these masks are obtained, it is possible to establish the number of holes in the anode, thereby providing a new comparison parameter in the cell identification task. It should be noted that all data corresponding to the shape and color of the anode of each stored cell are available in the database.
4. Experimental Results
To validate the proposed system, a series of identification tests were conducted on 18,650 cylindrical cells. A total of 5000 used cells from various models and manufacturers were obtained, all of which were of the 18,650 types. These cells were subjected to testing to validate the system proposed in this work. Of the cells analyzed, more than half (approximately 3400) had an identification code printed on them, indicating the cell manufacturer and model. An additional 1350 cells were identified solely by their color and shape, which corresponded to the anode. All these identifications were made by human experts to establish a basis of confidence in the tests performed. A total of 248 cells could not be identified by any method. The unidentified cells were predominantly of low quality, manufactured in Asian countries, and whose manufacturers did not share their specifications or have a unique and recognizable identification code, or had completely lost their outer coating. The unidentified cells that did not have an entry in our database were subjected to further analysis and subsequently included in the database.
Twelve counterfeit or manipulated cells were also identified through the implementation of various controls on the printed codes of the cells, the external color, and the appearance of the anode. One illustrative example is presented in Figure 21, where a counterfeit Samsung cell model INR18650-25R was identified.
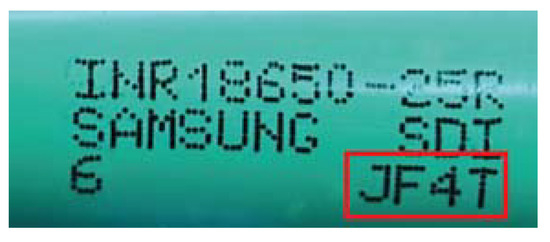
Figure 21.
Counterfeit 18,650 Samsung SDI cell.
Two factors enabled the identification of the item as a fake: firstly, the code printed on the bottom of the cell, and secondly, the internal code for the date of manufacture. On the SDI model Samsung cells, the bottom four characters of the third line correspond to the following internal code for the date of manufacture:
- The first digit = version of the cell
- The second digit = year (A = 2010, B = 2011, C = 2012, D = 2013, E = 2014, F = 2015, …)
- The third digit = month (1, 2, 3, …, 9, A = 10, B = 11, C = 12)
- The fourth digit = week
In the example of Figure 21, the code “JF4T” is not consistent with the original manufacturer’s code. As illustrated in the case of the cell in Figure 4, the manufacturing code is “1B14”, which corresponds to week 4 of January 2011. Additionally, the code “JF4T” has been identified in various databases as a code used in counterfeit cells. This same code, but with other formats, is utilized by prominent 18,650 cell manufacturers and serves as a means of detecting counterfeit cells. The alternative method by which the cell in Figure 20 was identified was through the analysis of its anode structure. While the original cell exhibited a total of six holes, the counterfeit cell displayed only three.
Following the identification of most recovered cells and the rejection of those deemed fraudulent, a series of tests were conducted to assess the efficacy of the system proposed in this work. The tests focused on evaluating the performance of the textual identification system of the cells containing a printed external code. In contrast, tests were conducted on all cells that did not contain an external printed code, analyzing the cell color and the shape of the anode. During the experiments, comparisons were made with alternative methods that have been described in the current literature. The experiments were performed on a computer with a 32GB Core i7-11700F CPU and an NVIDIA RTX Titan GPU with 24 GB of memory. On this hardware, the software used was Windows 10 Pro and Python version 3.12.
4.1. Character Reading Comparison Experiment
To conduct a comparative analysis of the proposed model for text identification and recognition with other models present in the literature, the 3400 cells with manually labeled printed characters have been utilized. Initially, it is essential to introduce the metrics employed in the tests.
- Accuracy: accuracy is the proportion of correct predictions (both positive and negative) out of the total number of predictions made in character reading recognitions. The mathematical equation is expressed as follows:
True Positive (TP): positive cases correctly predicted by the system. True Negative (TN): negative cases correctly predicted by the system. False Positive (FP): negative cases incorrectly predicted as positive (type I errors). False Negative (FN): positive cases incorrectly predicted as negative (type II errors).
- Precision and Recall: precision measures the proportion of instances correctly classified as positive against all instances classified as positive (both correct and incorrect), while recall measures the proportion of instances correctly classified as positive versus all instances that are positive. The mathematic equations are expressed as follows:
- F1 Score: This is the harmonic mean of precision and recall. It is used when a balance between precision and recall is needed, especially in unbalanced datasets. The F1 score is defined as
- Word Error Rate (WER): A metric commonly used to evaluate the performance of automatic speech recognition and other natural language processing systems. This metric measures the accuracy of the generated transcripts by comparing them to a reference transcript. The WER is calculated as the sum of the operations required to transform the generated transcript into the reference transcript, divided by the total number of words in the reference transcript as follows:
- Character Error Rate (CER): This is a metric like the WER, but instead of measuring word-level errors, it measures character-level errors. This metric is especially useful for evaluating text recognition systems where character-level errors are important, as in the case of lithium cell recognition where a single character changes the characteristics of the cell. CER is calculated analogously to WER, but instead of counting word substitutions, insertions, and deletions, it counts these operations at the character level:
The recognition engines selected for the comparative analysis were Tesseract 4.0, Tesseract 3.05, Keras OCR, Paddle OCR, and Microsoft Azure Computer Vision. Three distinct comparisons were conducted. The first involved only cells with printed characters, excluding dot matrix characters (12% of the total cells). The second comparison focused on cells with only printed dot matrix characters (88% of the total). Finally, all cells were analyzed simultaneously. Table 1 presents the results. As can be observed, in the case of cells printed with normal characters, most engines demonstrate an accuracy of over 80% in recognizing the information contained. This is to be expected, given that, following preprocessing of the image obtained from the outside of the cell, the resulting text is readily recognizable. However, the issue arises when identifying the characters printed with dot matrixes, which represent most cells on the market. As illustrated, the proposed system exhibits a reliability approaching 90%, with the second-best method being that proposed by Microsoft Azure Computer Vision, which achieves an accuracy of 62%. When considering the entirety of the cells, it is evident that the proposed system is capable of correctly analyzing 9 out of 10 cells with characters printed on them, a performance that is significantly superior to the rest of the methods.

Table 1.
Performance metrics of different experiments with text recognition engines on the set of analyzed cells.
4.2. Color Comparison Experiment
In validating the results obtained in the color cell identification system, it is of paramount importance to ascertain the predominant colors of an image. The accurate identification of the dominant colors in an image represents a challenging endeavor due to the absence of a universally accepted standard for the outcome. For this reason, the K-means clustering algorithm is a widely used tool in this field of computer vision. To assess the resilience of the proposed system, which is based on the K-means algorithm, the 1350 cells were analyzed with a variety of algorithms for the detection of predominant colors. Subsequently, the images were classified using the distance calculation function described in Figure 12. The metrics employed were identical to those utilized in the preceding section: accuracy, precision, recall, and F1 score. The alternative algorithms selected for analysis were as follows: MPEG-7 DCD described by the authors of [49], the convex hull-based approach proposed in [50], and the palette-based photo recoloring method described in [51]. Figure 22 illustrates the diverse color outcomes of the tested methodologies. The outcomes are relatively minor, suggesting that any of the methods would be sufficient for the specific context of this study. However, this may not be the case for other studies where the chromatic range is considerably larger, resulting in greater distances between image colors.
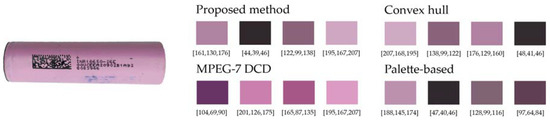
Figure 22.
Example of obtaining the dominant colors in RGB of the image of an 18,650 cell using different calculation methods.
Table 2 shows the results obtained. All the methods for obtaining the predominant colors have generated an accuracy in the correct identification of more than 80%, with the proposed method (based on K-means) being the one that has obtained the best results, correctly identifying more than 9 out of 10 cells by their color.
Table 2.
Performance metrics using different techniques for obtaining the predominant colors of a cell image.
5. Conclusions
This study addresses the importance and challenges of accurately and automatically identifying the model and manufacturer of lithium-ion cylindrical battery cells to optimize their reuse in energy storage systems and other applications. The combination of optical character recognition techniques with dot matrix printed character recognition techniques, in addition to anode color and morphology analysis, has proven to be an effective approach for the accurate identification of cylindrical cells. These methods permit the accurate and rapid classification of cells, which is crucial for the reliable determination of the SoH of batteries. The accurate identification of cells is a prerequisite for the assessment of their SoH and subsequent reuse. This not only reduces the need for new batteries, thus reducing the demand for material extraction, but also contributes significantly to the circular economy and environmental sustainability.
Although automatic identification of cylindrical cells presents technical challenges, this study demonstrates that it is possible to overcome them with advanced machine vision technologies. The implementation of this combination of techniques can become standard practice in the industry, thereby enhancing the efficiency and sustainability of the battery life cycle. Further research is necessary to enhance the precision and efficacy of cell identification methodologies. Additionally, the investigation of novel SoH assessment methodologies and the optimization of recycling and reuse processes can facilitate substantial advancements in the domain of second-life batteries. As evidenced by the experimental outcomes, the integration of character recognition techniques and chromatic identification techniques, in conjunction with other image segmentation techniques, facilitates the automation of the identification of lithium cylindrical cells with a high degree of accuracy.
Author Contributions
Conceptualization, A.H.d.l.I. and D.H.d.l.I.; Methodology, F.L.A., D.H.d.l.I., C.C.C. and A.J.L.R.; Software, F.L.A.; Validation, F.L.A., D.H.d.l.I. and A.J.L.R.; Investigation, A.H.d.l.I. and F.L.A.; Data curation, C.C.C.; Writing—original draft, A.H.d.l.I., F.L.A. and D.H.d.l.I.; Writing—review & editing, C.C.C.; Supervision, C.C.C. and A.J.L.R. All authors have read and agreed to the published version of the manuscript.
Funding
This work is part of the CERBEA project “Intelligent recycling of lithium batteries for the manufacture of domestic energy accumulators based on circular economy”. Grant TED2021-131981A-I00 funded by MCIN/ AEI/10.13039/501100011033 and by the “European Union NextGenerationEU/PRTR”.
Data Availability Statement
The raw data supporting the conclusions of this article will be made available by the authors on request.
Conflicts of Interest
The authors declare no conflicts of interest.
Abbreviations
| AI | Artificial intelligence |
| ESS | Energy storage systems |
| CER | Character Error Rate |
| CNN | Convolutional neural networks |
| DB | Differentiable Binarization |
| EV | Electric vehicle |
| FN | False Negative |
| FP | False Positive |
| FPN | Feature Pyramid Network |
| OCR | Optical character recognition |
| RGB | Red, Green, and Blue |
| SAM | Segment Anything Model |
| SLB | Second-life batteries |
| SoH | State of Health |
| TN | True Negative |
| TP | True Positive |
| WER | Word Error Rate |
References
- Mohammadi, F.; Saif, M. A Comprehensive Overview of Electric Vehicle Batteries Market. e-Prime-Adv. Electr. Eng. Electron. Energy 2023, 3, 100127. [Google Scholar] [CrossRef]
- Global EV Sales for 2022-EV Volumes. Available online: https://ev-volumes.com/news/ev/global-ev-sales-for-2022/ (accessed on 26 June 2024).
- Norwegian, E.V. Market Surges to 91.5% Market Share, Setting a Sustainable Example|European Alternative Fuels Observatory. Available online: https://alternative-fuels-observatory.ec.europa.eu/general-information/news/norwegian-ev-market-surges-915-market-share-setting-sustainable-example (accessed on 26 June 2024).
- Yang, Z.; Huang, H.; Lin, F.; Yang, Z.; Lin, F.; Huang, H. Sustainable Electric Vehicle Batteries for a Sustainable World: Perspectives on Battery Cathodes, Environment, Supply Chain, Manufacturing, Life Cycle, and Policy. Adv. Energy Mater. 2022, 12, 2200383. [Google Scholar] [CrossRef]
- Rajaeifar, M.A.; Ghadimi, P.; Raugei, M.; Wu, Y.; Heidrich, O. Challenges and Recent Developments in Supply and Value Chains of Electric Vehicle Batteries: A Sustainability Perspective. Resour. Conserv. Recycl. 2022, 180, 106144. [Google Scholar] [CrossRef]
- Rahman, T.; Alharbi, T. Exploring Lithium-Ion Battery Degradation: A Concise Review of Critical Factors, Impacts, Data-Driven Degradation Estimation Techniques, and Sustainable Directions for Energy Storage Systems. Batteries 2024, 10, 220. [Google Scholar] [CrossRef]
- Zhang, Y.; Li, Y.; Tao, Y.; Ye, J.; Pan, A.; Li, X.; Liao, Q.; Wang, Z. Performance Assessment of Retired EV Battery Modules for Echelon Use. Energy 2020, 193, 116555. [Google Scholar] [CrossRef]
- Abdelbaky, M.; Peeters, J.R.; Dewulf, W. On the Influence of Second Use, Future Battery Technologies, and Battery Lifetime on the Maximum Recycled Content of Future Electric Vehicle Batteries in Europe. Waste Manag. 2021, 125, 1–9. [Google Scholar] [CrossRef]
- Hoang, A.T.; Pham, V.V.; Nguyen, X.P. Integrating Renewable Sources into Energy System for Smart City as a Sagacious Strategy towards Clean and Sustainable Process. J. Clean. Prod. 2021, 305, 127161. [Google Scholar] [CrossRef]
- Hosseinzadeh, N.; Aziz, A.; Mahmud, A.; Gargoom, A.; Rabbani, M. Voltage Stability of Power Systems with Renewable-Energy Inverter-Based Generators: A Review. Electronics 2021, 10, 115. [Google Scholar] [CrossRef]
- Al-Shetwi, A.Q.; Hannan, M.A.; Jern, K.P.; Mansur, M.; Mahlia, T.M.I. Grid-Connected Renewable Energy Sources: Review of the Recent Integration Requirements and Control Methods. J. Clean. Prod. 2020, 253, 119831. [Google Scholar] [CrossRef]
- Behabtu, H.A.; Messagie, M.; Coosemans, T.; Berecibar, M.; Fante, K.A.; Kebede, A.A.; Van Mierlo, J. A Review of Energy Storage Technologies’ Application Potentials in Renewable Energy Sources Grid Integration. Sustainability 2020, 12, 10511. [Google Scholar] [CrossRef]
- Shahjalal, M.; Roy, P.K.; Shams, T.; Fly, A.; Chowdhury, J.I.; Ahmed, M.R.; Liu, K. A Review on Second-Life of Li-Ion Batteries: Prospects, Challenges, and Issues. Energy 2022, 241, 122881. [Google Scholar] [CrossRef]
- Melin, H.E. The Lithium-Ion Battery End-of-Life Market–A Baseline Study. 2018. Available online: https://www3.weforum.org/docs/GBA_EOL_baseline_Circular_Energy_Storage.pdf (accessed on 28 June 2024).
- Gu, X.; Bai, H.; Cui, X.; Zhu, J.; Zhuang, W.; Li, Z.; Hu, X.; Song, Z. Challenges and Opportunities for Second-Life Batteries: Key Technologies and Economy. Renew. Sustain. Energy Rev. 2024, 192, 114191. [Google Scholar] [CrossRef]
- Löbberding, H.; Wessel, S.; Offermanns, C.; Kehrer, M.; Rother, J.; Heimes, H.; Kampker, A. From Cell to Battery System in BEVs: Analysis of System Packing Efficiency and Cell Types. World Electr. Veh. J. 2020, 11, 77. [Google Scholar] [CrossRef]
- Belingardi, G.; Scattina, A. Battery Pack and Underbody: Integration in the Structure Design for Battery Electric Vehicles—Challenges and Solutions. Vehicles 2023, 5, 498–514. [Google Scholar] [CrossRef]
- Ank, M.; Sommer, A.; Gamra, K.A.; Schöberl, J.; Leeb, M.; Schachtl, J.; Streidel, N.; Stock, S.; Schreiber, M.; Bilfinger, P.; et al. Lithium-Ion Cells in Automotive Applications: Tesla 4680 Cylindrical Cell Teardown and Characterization. J. Electrochem. Soc. 2023, 170, 120536. [Google Scholar] [CrossRef]
- Waldmann, T.; Scurtu, R.G.; Richter, K.; Wohlfahrt-Mehrens, M. 18650 vs. 21700 Li-Ion Cells—A Direct Comparison of Electrochemical, Thermal, and Geometrical Properties. J. Power Sources 2020, 472, 228614. [Google Scholar] [CrossRef]
- Baazouzi, S.; Feistel, N.; Wanner, J.; Landwehr, I.; Fill, A.; Birke, K.P. Design, Properties, and Manufacturing of Cylindrical Li-Ion Battery Cells—A Generic Overview. Batterie 2023, 9, 309. [Google Scholar] [CrossRef]
- Nuroldayeva, G.; Serik, Y.; Adair, D.; Uzakbaiuly, B.; Bakenov, Z. State of Health Estimation Methods for Lithium-Ion Batteries. Int. J. Energy Res. 2023, 2023, 4297545. [Google Scholar] [CrossRef]
- Miniguano, H.; Barrado, A.; Lazaro, A.; Zumel, P.; Fernandez, C. General Parameter Identification Procedure and Comparative Study of Li-Ion Battery Models. IEEE Trans. Veh. Technol. 2020, 69, 235–245. [Google Scholar] [CrossRef]
- Ma, L.; Xu, Y.; Zhang, H.; Yang, F.; Wang, X.; Li, C. Co-Estimation of State of Charge and State of Health for Lithium-Ion Batteries Based on Fractional-Order Model with Multi-Innovations Unscented Kalman Filter Method. J. Energy Storage 2022, 52, 104904. [Google Scholar] [CrossRef]
- Choi, J.; Lim, B.; Yoo, Y. Advancing Plastic Waste Classification and Recycling Efficiency: Integrating Image Sensors and Deep Learning Algorithms. Appl. Sci. 2023, 13, 10224. [Google Scholar] [CrossRef]
- Ueda, T.; Koyanaka, S.; Oki, T. In-Line Sorting System with Battery Detection Capabilities in e-Waste Using Combination of X-Ray Transmission Scanning and Deep Learning. Resour. Conserv. Recycl. 2024, 201, 107345. [Google Scholar] [CrossRef]
- Sterkens, W.; Peeters, J.R. Selection for Reuse in WEEE Reverse Logistics with Text-Based Model Identification. Procedia CIRP 2024, 122, 813–818. [Google Scholar] [CrossRef]
- Zorn, M.; Ionescu, C.; Klohs, D.; Zähl, K.; Kisseler, N.; Daldrup, A.; Hams, S.; Zheng, Y.; Offermanns, C.; Flamme, S.; et al. An Approach for Automated Disassembly of Lithium-Ion Battery Packs and High-Quality Recycling Using Computer Vision, Labeling, and Material Characterization. Recycling 2022, 7, 48. [Google Scholar] [CrossRef]
- Li, W.; Peng, Y.; Zhu, Y.; Pham, D.T.; Nee, A.Y.C.; Ong, S.K. End-of-Life Electric Vehicle Battery Disassembly Enabled by Intelligent and Human-Robot Collaboration Technologies: A Review. Robot. Comput. Integr. Manuf. 2024, 89, 102758. [Google Scholar] [CrossRef]
- Lu, Y.; Maftouni, M.; Yang, T.; Zheng, P.; Young, D.; Kong, Z.J.; Li, Z. A Novel Disassembly Process of End-of-Life Lithium-Ion Batteries Enhanced by Online Sensing and Machine Learning Techniques. J. Intell. Manuf. 2023, 34, 2463–2475. [Google Scholar] [CrossRef] [PubMed]
- Sterkens, W.; Diaz-Romero, D.J.; Xiao, B.; Wu, B.; Goedemé, T.; Dewulf, W.; Peeters, J. Computer Vision and Optical Character Recognition for the Classification of Batteries from WEEE. Procedia CIRP 2022, 105, 110–115. [Google Scholar] [CrossRef]
- Cell Database|Second Life Storage & Solar. Available online: https://secondlifestorage.com/index.php?pages/cell-database/ (accessed on 26 June 2024).
- Mendoza, F.; Dejmek, P.; Aguilera, J.M. Calibrated Color Measurements of Agricultural Foods Using Image Analysis. Postharvest Biol. Technol. 2006, 41, 285–295. [Google Scholar] [CrossRef]
- Jackman, P.; Sun, D.W.; ElMasry, G. Robust Colour Calibration of an Imaging System Using a Colour Space Transform and Advanced Regression Modelling. Meat Sci. 2012, 91, 402–407. [Google Scholar] [CrossRef]
- Schanda, J. Colorimetry: Understanding the CIE System; John Wiley & Sons: Hoboken, NJ, USA, 2007; pp. 1–459. [Google Scholar] [CrossRef]
- Liao, M.; Zou, Z.; Wan, Z.; Yao, C.; Bai, X. Real-Time Scene Text Detection with Differentiable Binarization and Adaptive Scale Fusion. IEEE Trans. Pattern Anal. Mach. Intell. 2022, 45, 919–931. [Google Scholar] [CrossRef]
- Smith, R. An Overview of the Tesseract OCR Engine. In Proceedings of the Ninth International Conference on Document Analysis and Recognition, Curitiba, Brazil, 23–26 September 2007; Volume 2, pp. 629–633. [Google Scholar] [CrossRef]
- Holley, R. How Good Can It Get? Analysing and Improving OCR Accuracy in Large Scale Historic Newspaper Digitisation Programs. D-Lib Mag. 2009, 15, 3–4. [Google Scholar]
- Neudecker, C.; Baierer, K.; Gerber, M.; Christian, C.; Apostolos, A.; Stefan, P. A Survey of OCR Evaluation Tools and Metrics. In Proceedings of the 6th International Workshop on Historical Document Imaging and Processing, Lausanne, Switzerland, 6 September 2021; pp. 13–18. [Google Scholar] [CrossRef]
- Levenshtein, V. Binary Codes Capable of Correcting Deletions, Insertions, and Reversals. Sov. Phys. Dokl. 1966, 10, 707–710. [Google Scholar]
- Wagner, R.A.; Fischer, M.J. The String-to-String Correction Problem. J. ACM 1974, 21, 168–173. [Google Scholar] [CrossRef]
- Endo, K.; Ohyama, W.; Wakabayashi, T.; Kimura, F. Performance Improvement of Dot-Matrix Character Recognition by Variation Model Based Learning. Lect. Notes Comput. Sci. (Incl. Subser. Lect. Notes Artif. Intell. Lect. Notes Bioinform.) 2015, 9009, 147–156. [Google Scholar] [CrossRef]
- Lloyd, S.P. Least Squares Quantization in PCM. IEEE Trans. Inf. Theory 1982, 28, 129–137. [Google Scholar] [CrossRef]
- Ryšavý, P.; Hamerly, G. Geometric Methods to Accelerate κ-Means Algorithms. In Proceedings of the 2016 SIAM International Conference on Data Mining, Miami, FL, USA, 5–7 May 2016; pp. 324–332. [Google Scholar] [CrossRef]
- MacKay, D.J.C. An Example Inference Task: Clustering. In Information Theory, Inference and Learning Algorithms; Cambridge University Press: Cambridge, UK, 2003; pp. 284–292. [Google Scholar]
- Colour Metric. Available online: https://www.compuphase.com/cmetric.htm#POYNTON1 (accessed on 26 June 2024).
- Lobato Alejano, F. Sistema Multi-Agente Para La Comunicación de Recursos Hardware Heterogéneos a Través Del Protocolo Industrial Modbus En El Ámbito de La Industria 4.0, Universidad Pontificia de Salamanca: Salamanca. 2022. Available online: https://dialnet.unirioja.es/servlet/tesis?codigo=307276 (accessed on 28 June 2024).
- Kuehni, R.G. How Many Object Colors Can We Distinguish? Color Res. Appl. 2016, 41, 439–444. [Google Scholar] [CrossRef]
- Kirillov, A.; Mintun, E.; Ravi, N.; Mao, H.; Rolland, C.; Gustafson, L.; Xiao, T.; Whitehead, S.; Berg, A.C.; Lo, W.Y.; et al. Segment Anything. In Proceedings of the IEEE/CVF International Conference on Computer Vision, Paris, France, 2–6 October 2023. [Google Scholar] [CrossRef]
- Baştan, M.; Çam, H.; Güdükbay, U.; Ulusoy, Ö. Bilvideo-7: An MPEG-7- Compatible Video Indexing and Retrieval System. IEEE Multimed. 2010, 17, 62–73. [Google Scholar] [CrossRef]
- Tan, J.; Lien, J.M.; Gingold, Y. Decomposing Images into Layers via RGB-Space Geometry. ACM Trans. Graph. 2016, 36, 1–14. [Google Scholar] [CrossRef]
- Chang, H.; Fried, O.; Liu, Y.; DiVerdi, S.; Finkelstein, A. Palette-Based Photo Recoloring. ACM Trans. Graph. 2015, 34, 139. [Google Scholar] [CrossRef]


Disclaimer/Publisher’s Note: The statements, opinions and data contained in all publications are solely those of the individual author(s) and contributor(s) and not of MDPI and/or the editor(s). MDPI and/or the editor(s) disclaim responsibility for any injury to people or property resulting from any ideas, methods, instructions or products referred to in the content. |
© 2024 by the authors. Licensee MDPI, Basel, Switzerland. This article is an open access article distributed under the terms and conditions of the Creative Commons Attribution (CC BY) license (https://creativecommons.org/licenses/by/4.0/).