Article

Quantifying the Aging of Lithium-Ion Pouch Cells Using Pressure Sensors

by
Yousof Nayfeh
1,
Jon C. Vittitoe
2 and
Xianglin Li
1,*
1
Department of Mechanical Engineering and Materials Science, Washington University in St. Louis, St. Louis, MO 63130, USA
2
Department of Mechanical Engineering, University of Texas Rio Grande Valley, Edinburg, TX 78539, USA
*
Author to whom correspondence should be addressed.
Batteries 2024, 10(9), 333; https://doi.org/10.3390/batteries10090333
Submission received: 11 August 2024 / Revised: 11 September 2024 / Accepted: 14 September 2024 / Published: 21 September 2024
(This article belongs to the Section Battery Performance, Ageing, Reliability and Safety)

Abstract

:
Understanding the behavior of pressure increases in lithium-ion (Li-ion) cells is essential for prolonging the lifespan of Li-ion battery cells and minimizing the safety risks associated with cell aging. This work investigates the effects of C-rates and temperature on pressure behavior in commercial lithium cobalt oxide (LCO)/graphite pouch cells. The battery is volumetrically constrained, and the mechanical pressure response is measured using a force gauge as the battery is cycled. The effect of the C-rate (1C, 2C, and 3C) and ambient temperature (10 °C, 25 °C, and 40 °C) on the increase in battery pressure is investigated. By analyzing the change in the minimum, maximum, and pressure difference per cycle, we identify and discuss the effects of different factors (i.e., SEI layer damage, electrolyte decomposition, lithium plating) on the pressure behavior. Operating at high C-rates or low temperatures rapidly increases the residual pressure as the battery is cycled. The results suggest that lithium plating is predominantly responsible for battery expansion and pressure increase during the cycle aging of Li-ion cells rather than electrolyte decomposition. Electrochemical impedance spectroscopy (EIS) measurements can support our conclusions. Postmortem analysis of the aged cells was performed using scanning electron microscopy (SEM) and energy-dispersive X-ray spectroscopy (EDS) to confirm the occurrence of lithium plating and film growth on the anodes of the aged cells. This study demonstrates that pressure measurements can provide insights into the aging mechanisms of Li-ion batteries and can be used as a reliable predictor of battery degradation.

1. Introduction

Li-ion batteries are becoming increasingly ubiquitous in the fields of electric vehicles and portable electronic devices, such as cell phones and laptops, because of their high specific energy relative to other electrical energy storage systems. It is necessary to develop Li-ion batteries with a long cycle life because replacing the batteries is financially and environmentally costly [1]. A better understanding of battery degradation factors is key to reducing these costs. There have been many studies on the cycle aging of battery cells and the various mechanisms attributed to it. As the battery is repeatedly charged and discharged, the graphite particles of the anode experience repeated changes in size. These stresses can damage the solid electrolyte interphase (SEI) on the anode. Cracks in the SEI layer expose the active material to the electrolyte, leading to new SEI layer formation. The rebuilding of the SEI consumes lithium ions during its formation [2,3]. Another effect is lithium plating. In this process, lithium ions are deposited as lithium metal on the graphite anode surface and can no longer participate in charge transfer. Lithium plating leads to irreversible capacity loss as the deposited lithium metal can no longer participate in charge transfer [4,5]. Lithium plating is not only one of the most damaging aging mechanisms but also has a serious impact on the safety of Li-ion batteries [6]. Degradation of the battery is usually measured by capacity or power fade. It can also manifest itself as a change in the internal resistance or impedance of the battery [7,8], or as a physical expansion of the battery cell [9].
Understanding and predicting battery expansion is crucial for enhancing the lifetime of Li-ion battery cells and reducing the risk of safety hazards associated with cell degradation. For example, in electric vehicles, hundreds of battery cells are closely packed together. Battery expansion and pressure increase can lead to major safety hazards such as the detachment of electric connectors, poor thermal management, or cell bursting in extreme cases [10]. Battery expansion can also have similarly dangerous effects on portable electronic devices [11]. Li-ion battery cells are usually placed under rigid constraints to maintain battery pack dimensions in the devices they power (e.g., EVs, laptops, mobile phones). Therefore, the volumetric expansion is restricted, and the cell pressure increases instead.
Various mechanisms are responsible for the increase in a battery cell’s pressure. First, there are two distinct types of battery expansion behaviors: reversible and irreversible [12,13]. The reversible portion of the expansion mainly corresponds to the lithiation of the anode. The lithium ions are stored in the lattice of the electrodes. During charging, the lithium ions diffuse from the cathode to the anode. As lithium ions are inserted into the graphite lattice structure of the anode, it can swell by up to 10% in volume [14,15]. In contrast, the volume change in a lithium-cobalt-oxide (LCO) cathode is around 1.8% [16]. The volume change can be up to 2% [17] and 4.5% [18] for nickel-manganese-cobalt (NMC) and nickel-manganese-aluminum (NCA) cathodes, respectively. Therefore, the overall volume of the battery expands while being charged and contracts during discharge. Temperature variation can also cause changes in the volume of the battery due to thermal expansion [19]. Heat is generated within the battery via joule heating due to the internal ohmic resistance of the battery components [20].
On the other hand, irreversible expansion is when the battery does not return to its initial size. This type of expansion is associated with battery degradation and material change. Cell degradation mechanisms such as the SEI layer formation and reparation, gas formation, and lithium plating can all lead to irreversible expansion [9]. As mentioned earlier, after repeated battery cycling, the mechanical stress on the anode damages the SEI layer. When breaks and cracks occur, the electrolyte reacts with the newly exposed surfaces and repairs the SEI layer. As new layers are formed and the SEI grows, the thickness of the film increases and thus expands the battery and creates mechanical stresses [21]. Moreover, the SEI formation reaction at the anode’s surface is usually accompanied by the release of gaseous electrolyte decomposition products [4]. Gases can also be generated when the battery is overcharged/overdischarged or exposed to very high temperatures [22]. These gases can also build up in the cell and cause irreversible swelling. Finally, the formation of metallic lithium on the anode, referred to as lithium plating, leads to the expansion of the battery. Plating of lithium metal on the anode occurs when the number of lithium ions moving to the anode over from the cathode is higher than the maximum number of ions that can intercalate into the graphite within a certain amount of time [23]. It follows that at high charging rates, the rate of Li-ion diffusion to the anode’s surface is high, and the battery is more susceptible to lithium plating. Moreover, when operating at low temperatures, the diffusivity of lithium ions in the electrode is reduced significantly, which reduces the threshold for lithium plating to occur [24]. Also, operating at a high state of charge (SOC) increases the possibility of overcharging and leads to lithium plating because the anode can become oversaturated with lithium ions [25]. Cell expansion due to lithium plating consists of reversible and irreversible portions. Some of the metallic lithium accumulating on the anode’s surface can intercalate back as lithium ions into the graphite lattice during the relaxation time after charging or during battery discharging [1,9].
Each of these mechanisms is governed by various factors and can have different effects on the expansion of the battery as it is cycled. On this front, several papers have been published by previous researchers. Wang et al. [26] were among the first to study the volume change in Li-ion cells during charging and discharging cycles and how the mechanical stress causes degradation of the electrodes. They used a load cell along with in situ X-ray imaging to measure the cell volume change. A second paper by the same group studied the volume change in a battery stack consisting of five batteries. They studied how the current rate and cut-off voltage during charging can affect the degradation of the electrodes due to mechanical strain. They concluded that a maximum voltage cut-off of 4.0 V should be used instead of 4.2 V to maintain the structure of the LiCoO2 particles of the cathode [27]. Peabody and Arnold [28] showed that the repeated expansion and contraction of the anode during the operation of a Li-ion battery cell can directly affect the electrochemical performance of the battery by damaging the polymer separator, leading to separator pores closing. In turn, this causes the capacity to fade and increases internal resistance. They found that a pressure of as low as 1 MPa can influence the capacity of the system. Later, Cannarella and Arnold [29] modeled and measured the increase in internal resistance associated with separator deformation.
The same group also studied the effect of the externally applied pressure on battery aging, measured by capacity fade. They showed that applying a small amount of pressure (0.05 MPa) to the battery results in slower aging compared to no pressure at all, but applying medium (0.5 MPa) or high (5 MPa) pressure accelerates aging [30]. It was later shown that applying mechanical pressure on Li-ion cells can reduce the tendency for lithium deposition and plating on the anode [31]. Liu and Arnold [32] studied how the range of SOC in which the battery is cycled affects the mechanical response of the battery, and how the capacity fade is related to that mechanical response. They attribute the battery’s gradual stress increase to film growth as the battery is cycled. Bauer et al. [33] studied battery expansion and how lithium plating can be detected by observing the stress relaxation of the battery after the charging current is stopped.
There are a few studies that have focused on short-term observations of pressure increase or the mechanical response and relaxation during a single cycle [26,33,34,35]. The studies exploring the pressure evolution in batteries under cycle aging are relatively rare [30,32,36,37,38,39,40,41]. The investigations are often focused on trying to correlate the state of health (SOH) and state of charge (SOC) with the external mechanical pressure of the battery. Most studies limit the analysis to the peak pressure of the battery, rather than the components of the pressure increase curve. There is a lack of studies investigating how the pressure of the battery evolves under harsh operating conditions, and which aging factors contribute most significantly to pressure build-up.
In this work, we investigate the mechanical pressure response of a commercial lithium cobalt oxide (LCO)/graphite pouch battery cell during cycling under the harsh operating conditions of high C-rate and low temperatures. The battery is volumetrically constrained, and the mechanical pressure response is measured using a force gauge as the battery is cycled. The effect of the C-rate (1C, 2C, and 3C) and ambient temperature (10 °C, 25 °C, and 40 °C) on the increase in battery pressure is investigated. This allows us to study how the different aging mechanisms contribute to the pressure build-up within the battery. An in-depth analysis is presented by studying the trends in the maximum, minimum, and pressure differences per cycle. Finally, electrochemical impedance spectroscopy (EIS) measurements and postmortem analysis of all the batteries cycled at different conditions are presented to support the conclusion.

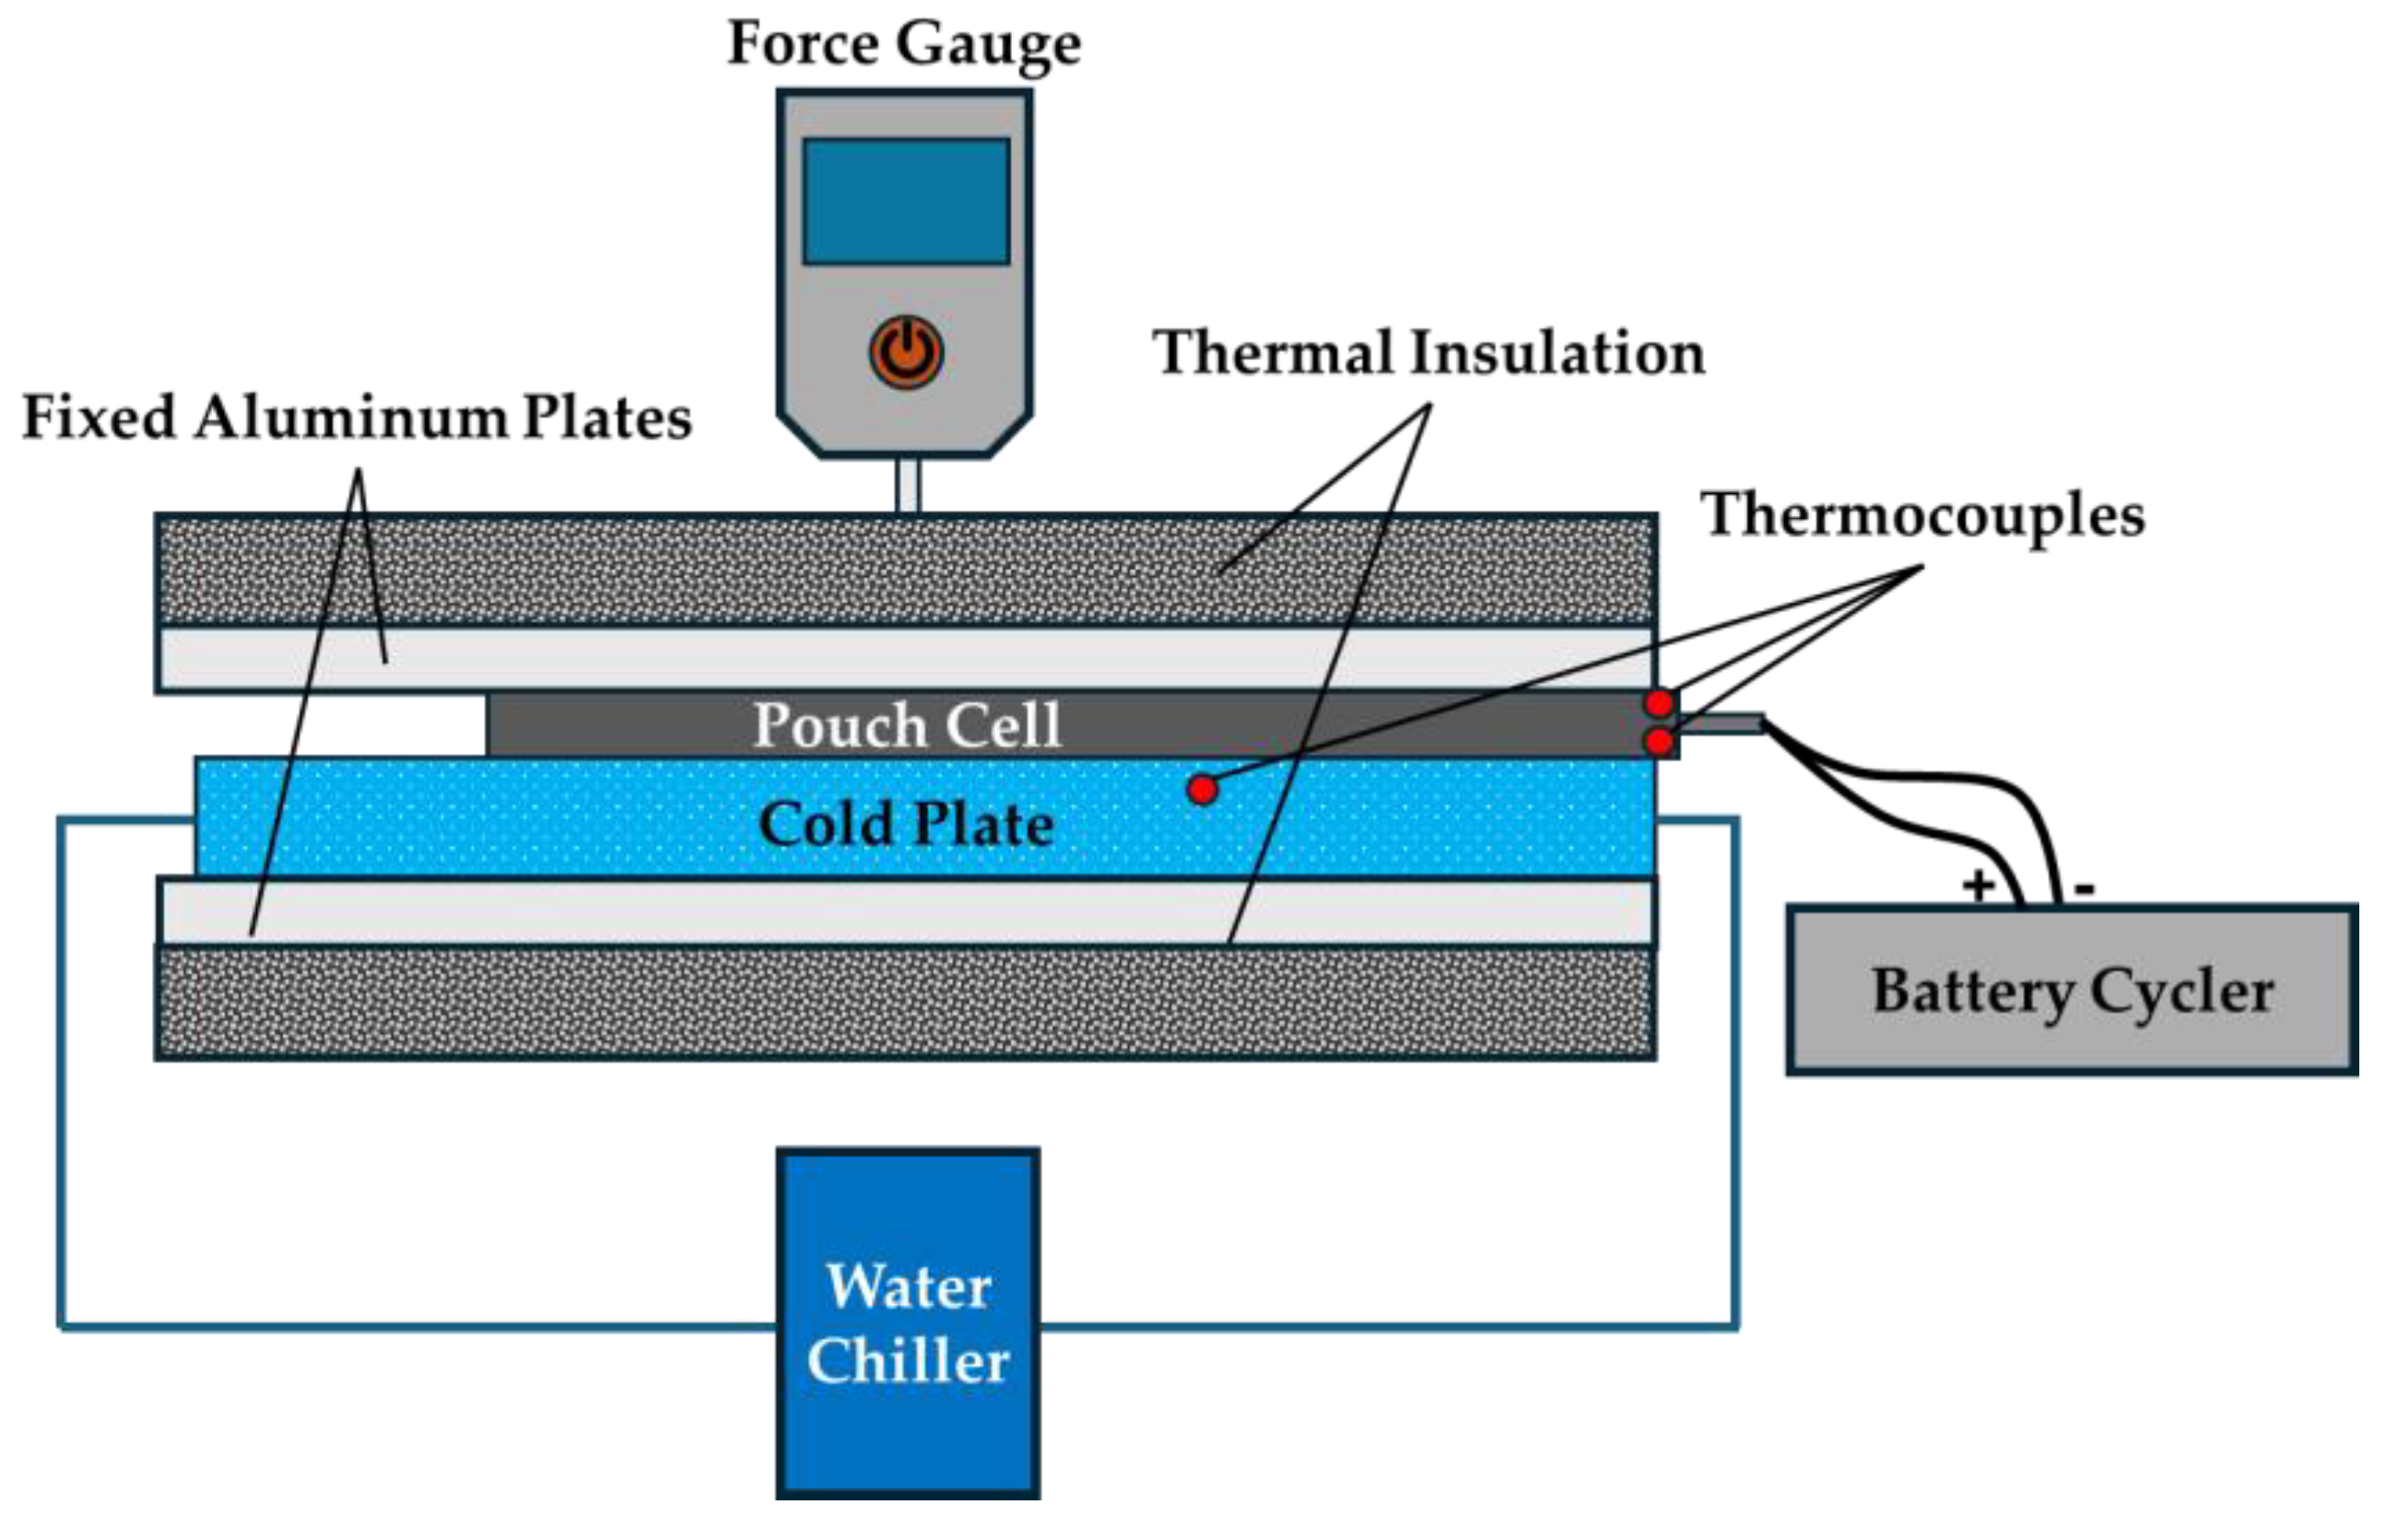
2. Materials and Methods

Commercial LCO/graphite batteries were purchased from Tenergy Power (Li-Polymer #6050100, 3.7 V, 3000 mAh, Fremont, CA, USA), 102.5 mm × 51.0 mm × 6.0 mm in size. We chose a pouch cell because their expansion is very noticeable due to the lack of hard casing. All batteries were fully charged using a constant–current–constant-voltage (CCCV) protocol with a cut-off voltage of 4.2 V and a cut-off current of C/20 (0.15 A) as specified by the manufacturer. The battery was placed between two aluminum plates with a force gauge with a resolution of 0.2 N attached to the top plate (Series 3 Force Gauge, Mark−10, Copiague, NY, USA). The plates were fixed within a test stand and could not move, thus volumetrically constraining the battery. An initial pressure of ~15 kPa was applied to the battery to ensure that it does not lose contact with the plates of the force gauge when it contracts. The force gauge was then tared at this point when the battery was fully charged (expanded). For the temperature-controlled experiments, a tubed cold plate was placed underneath the battery and connected to a recirculating water chiller/heater to control the temperature during battery cycling. Thermal insulation was added to reduce heat losses to the environment. Three thermocouples (K-type) were attached to the setup using thermal tape to measure the temperature of the battery and the cold plate. A battery cycler (BTS4000, Neware, Shenzhen, China) was used to control and record the current and voltage during the experiment. A schematic of the experimental setup is shown in Figure 1.
Two experiments were conducted. The first experiment investigated the effect of C-rate on the pressure increase within the battery. The water chiller was not used to control the temperature, and the cold plate was not attached. The battery was tested under ambient room temperature conditions (23 ± 0.4 °C). A CCCV protocol was used for charging and discharging with cut-off voltage values of 4.2 V and 2.7 V, and a cut-off current of C/20 (0.15 A). Three different C-rates were used: 1C, 2C and 3C. The battery was cycled within 0.5–1.0 SOC (1.5 Ah capacity). During the experiments, the discharging step took place completely in the constant current (CC) mode because the lower voltage limit was not reached.
The second experiment investigated the effect of the temperature on the behavior of the increase in pressure within the battery. Water was circulated in the cold plate with different controlled temperatures (10 °C, 25 °C, and 40 °C). All batteries were cycled for 100 cycles in both experiments.
EIS analysis was performed on all batteries before and after cycling. All batteries were fully recharged to 100% SOC before performing the EIS measurements because the impedance spectrum of a Li-ion battery depends heavily on its SOC. The analysis was conducted at room temperature and after the batteries were rested and taken out of the pressure testing apparatus, so that no pressure was applied to the battery during the EIS scan. The spectrum was measured using an AC excitation voltage of 10 mV, in the frequency range of 10 kHz to 0.01 Hz.
Finally, a postmortem analysis of all aged cells was performed. The batteries were fully discharged to 0% SOC. The batteries were then transferred to an argon-filled glovebox to be disassembled. The electrodes were separated from the separator, and the anode was examined visually for signs of lithium plating, and a sample from each anode was used for further material characterization. In addition, a new battery was fully charged then discharged to 0% SOC and disassembled for comparison as a reference. The anodes were imaged under a ThermoFisher Quattro S environmental scanning electron microscope (ESEM). Energy dispersive X-ray spectroscopy (EDS) was also employed to study the elemental composition of the anodes’ surfaces.

3. Results and Discussion

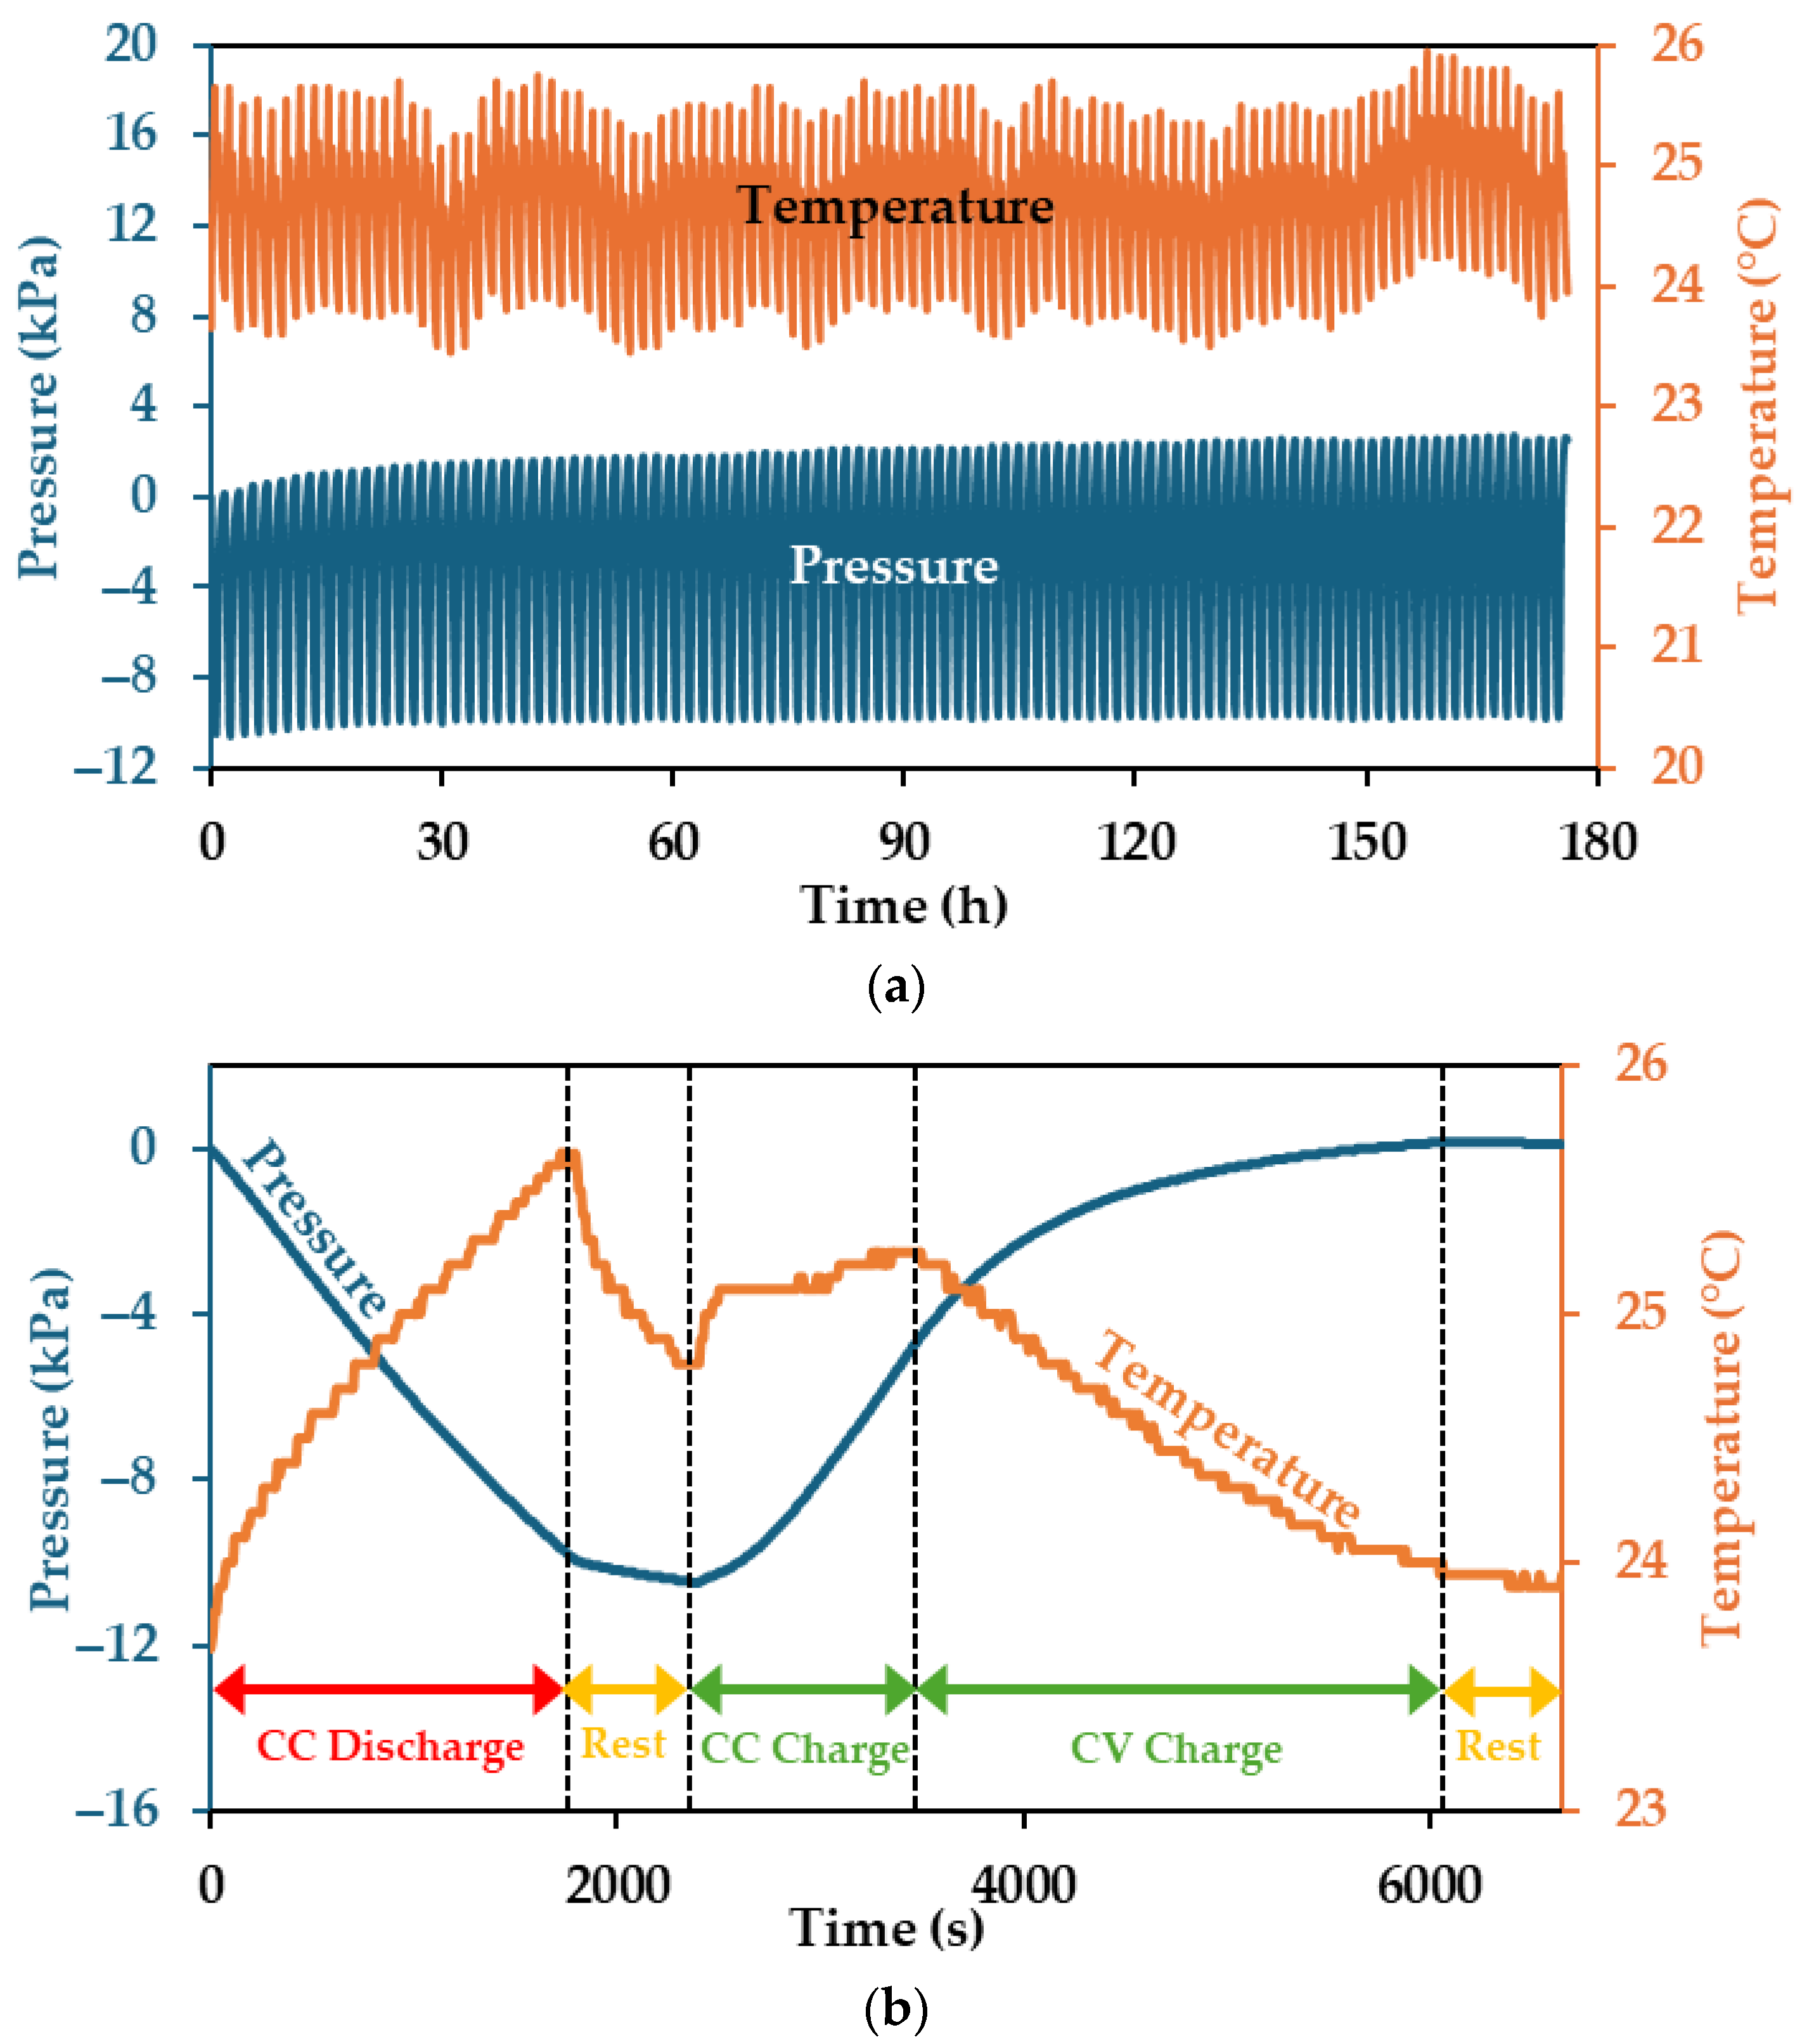
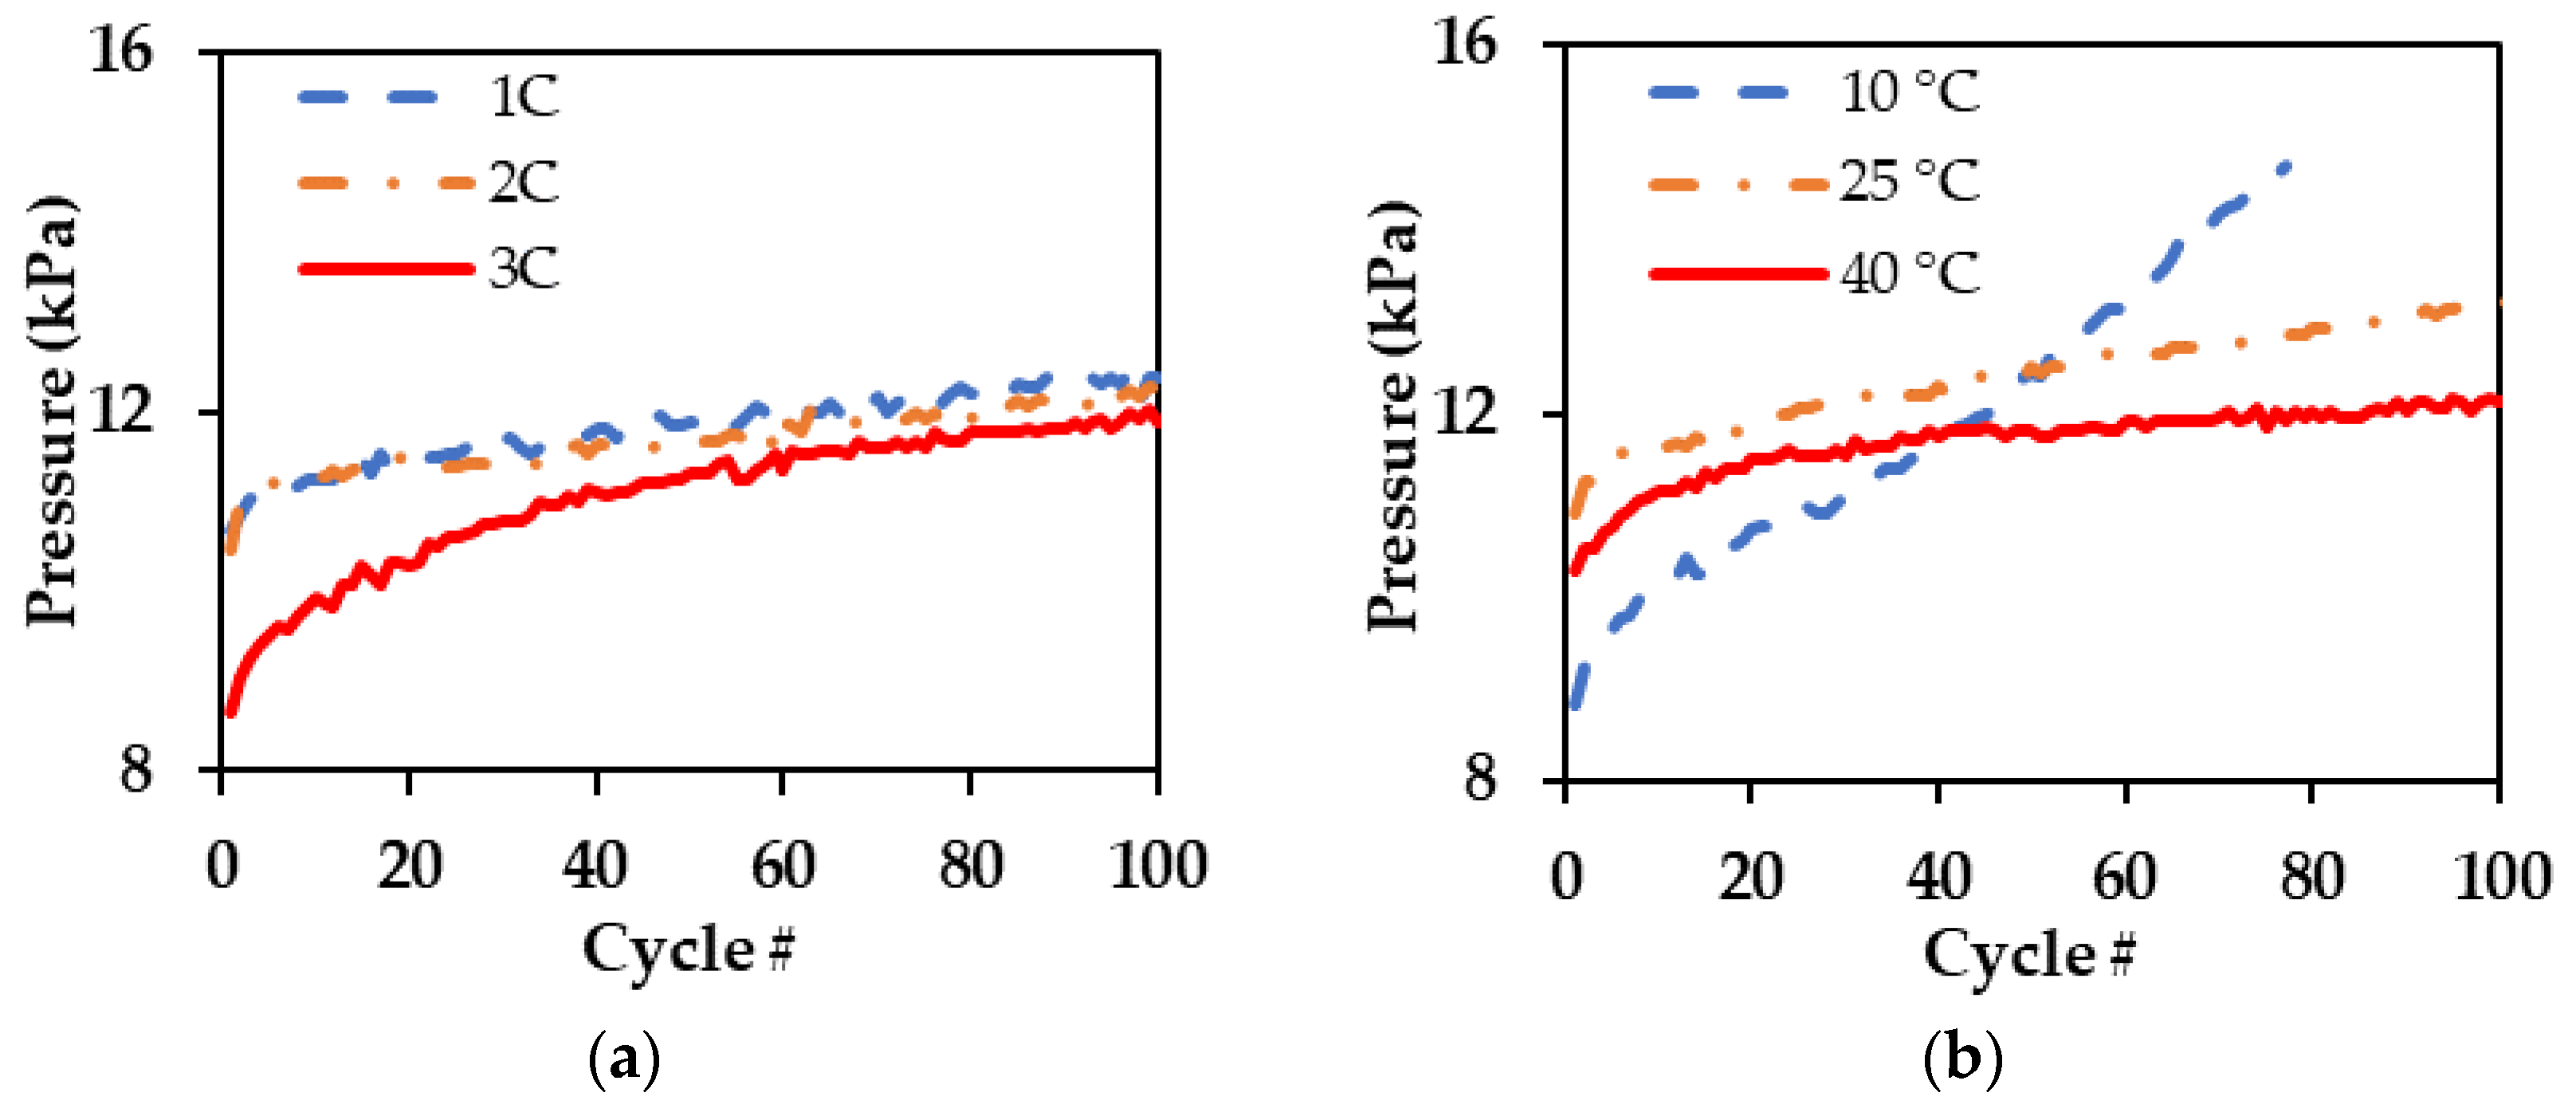
3.1. Pressure and Temperature Trends

The pressure and temperature measurements collected during cycling are shown in Figure 2. This battery is shown as an example; it was cycled at a rate of 1C and no temperature control. During discharging/charging cycles, the pressure inside the battery changes periodically. During the discharge step, the lithium ions deintercalate from the graphite anode and move towards the cathode. This delithiation of the anode results in a contraction of the anode material, leading to a decrease in pressure. Then, during the charging step, lithium ions flow back from the cathode into the anode, intercalating into the graphite structure of the anode. This lithiation process causes the anode to expand and increases the pressure. Moreover, as discussed earlier, the upward trend in pressure is caused by irreversible expansion within the battery. This pressure increase is associated with different battery degradation mechanisms like lithium plating, gas evolution in the battery, and the formation and growth of the SEI layer.
The temperature also varies periodically during battery cycling. During the discharge step, the temperature increases because of joule heating caused by the internal ohmic resistance of the battery. The discharge stage is followed by a 10 min rest stage, during which the temperature drops as the heat is dissipated to the environment. As charging begins in the constant current (CC) phase, the temperature rises again. When the voltage reaches the cut-off value of 4.2 V, the charging mode switches to constant voltage (CV). During this stage of charging, the current gradually decreases as the battery is charged to maintain the voltage at 4.2 V. The decreasing current leads to a reduction in resistive heating, and the temperature starts to decrease again. Figure 2 shows this process is reversible, and no cumulative temperature increase or decrease was observed. The small variations across cycles are due to slight changes in the ambient conditions of the room. The ambient temperature was monitored during the experiment; it varied between 21.3 °C and 24.4 °C and averaged at 23.0 °C.

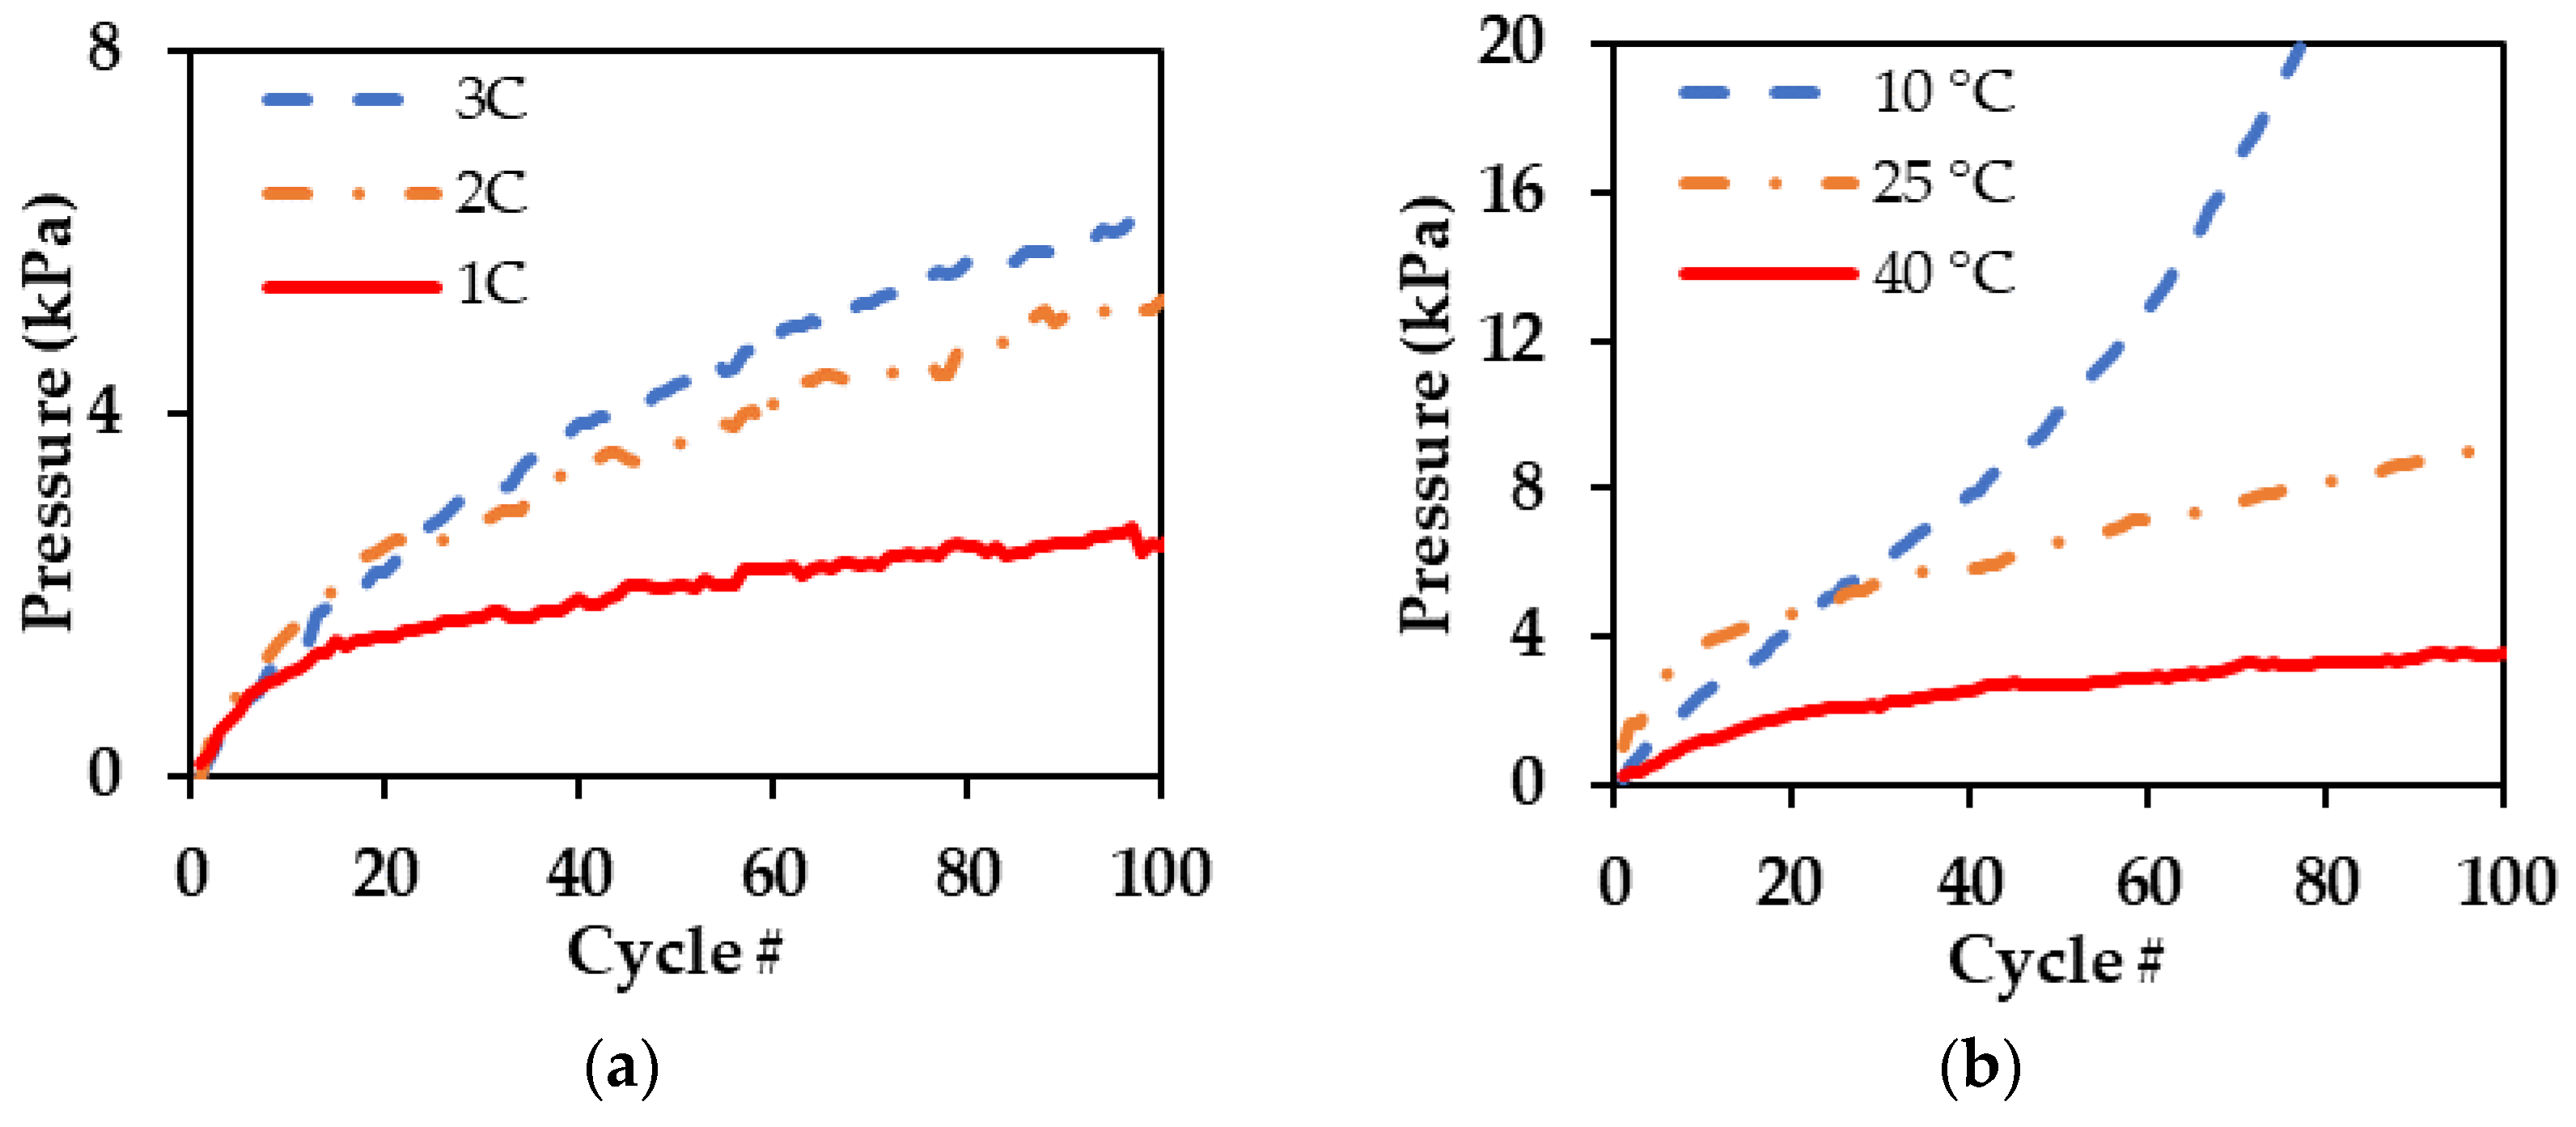
3.2. Pressure Components Analysis
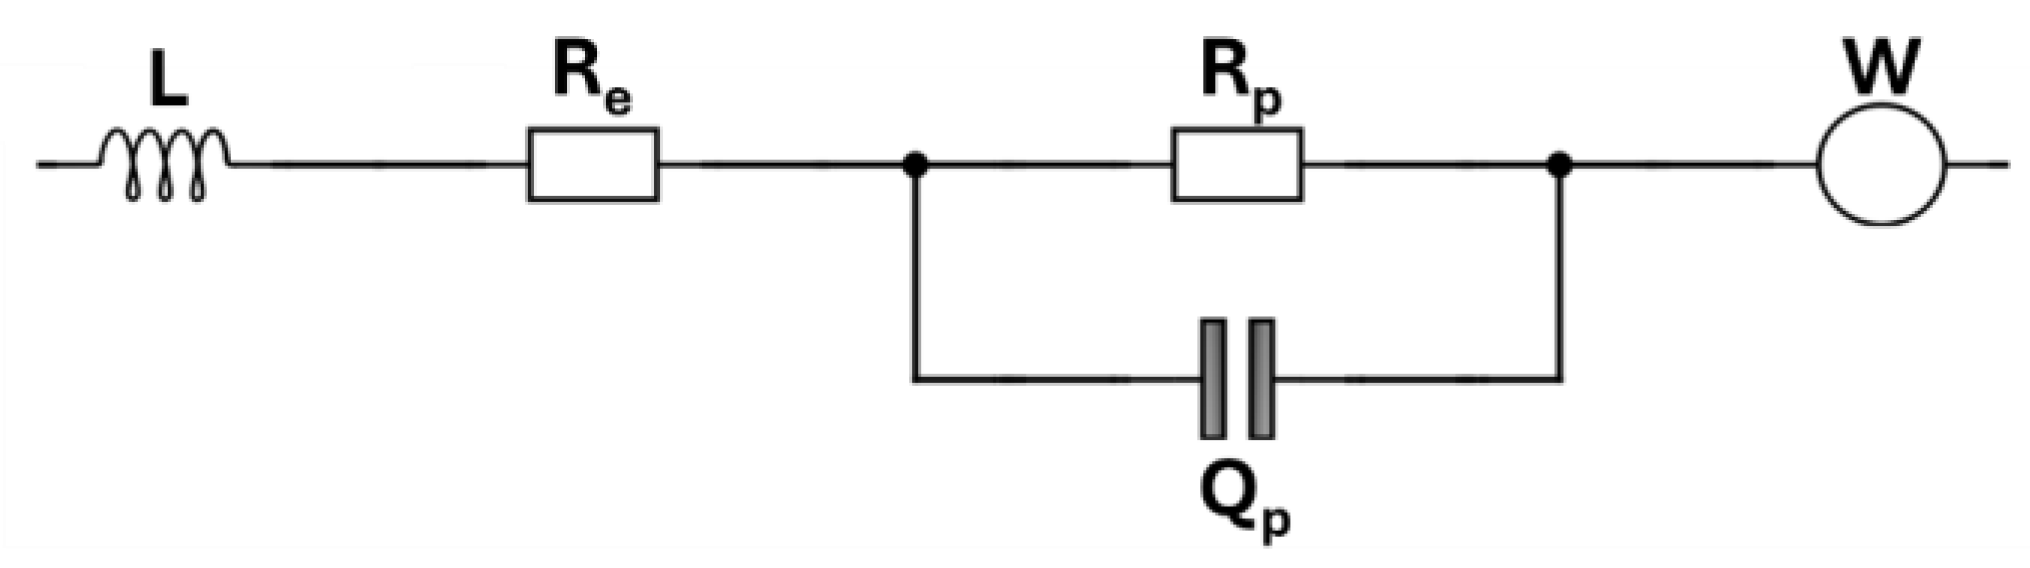
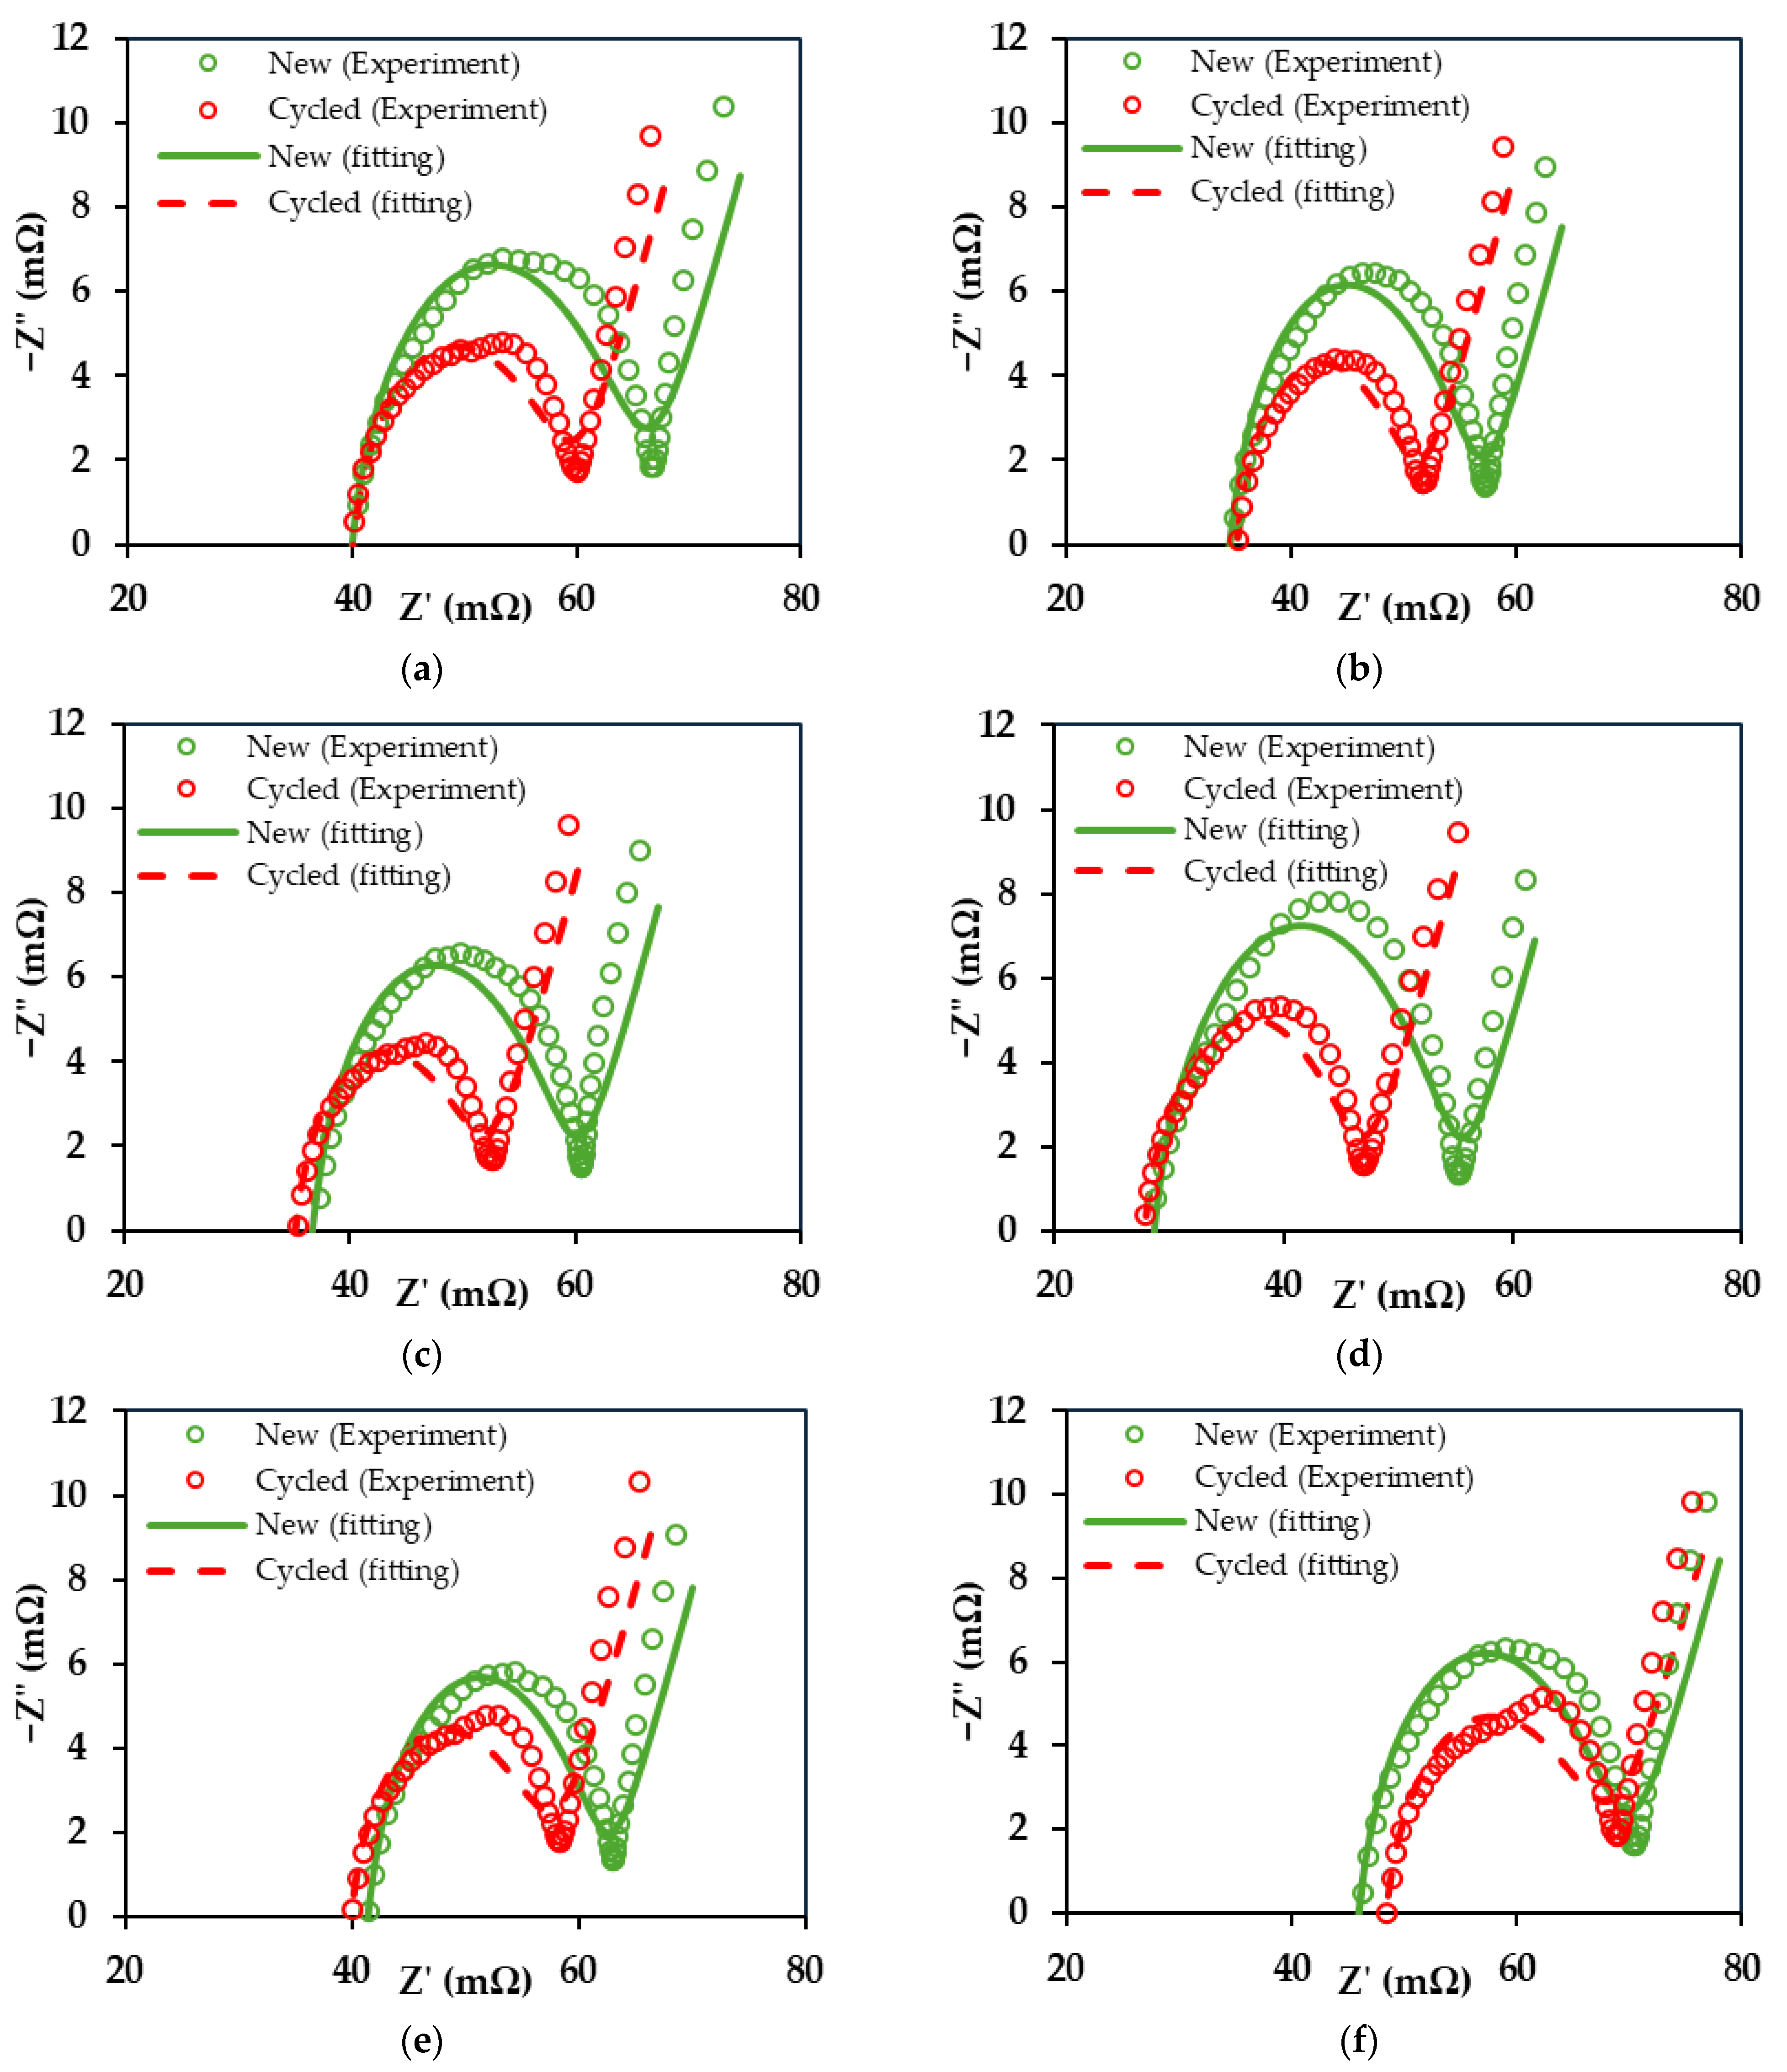
The average pressure of the battery trends upwards as the battery is cycled. However, studying the maximum and minimum pressures, which take place at the fully charged and fully discharged states of the battery’s cycle, respectively, can tell us important information about the different mechanisms contributing to the battery aging and the pressure increase. For instance, the residual minimum pressure from cycle to cycle represents the pressure build-up after the battery is discharged. This provides information about the irreversible portion of the pressure change (i.e., irreversible lithium plating, SEI layer growth, and gas evolution from electrolyte decomposition) [9]. On the other hand, the difference in pressure between the charged and discharged states during each cycle can tell us about the reversible portion of the pressure change (i.e., reversible lithium plating, anode lithiation, and thermal expansion). And the maximum pressure represents both the reversible and irreversible portions of the pressure combined.
Figure 3 shows the minimum pressure values from each cycle for different C-rates and temperatures. The pressure data for the battery cycled at a temperature of 10 °C are not available after the 77th cycle due to an issue with the force gauge. The average residual pressure after each cycle was calculated by applying a linear fit to the data, neglecting the first 20 cycles, where the pressure increases quickly due to SEI formation. The average residual pressures for all tested batteries are summarized in Table 1. Table 2 shows the maximum, minimum, and average battery temperatures measured during discharging and charging of the batteries cycled with no temperature control. The maximum battery temperature during discharge for the battery cycled at 3C is around 7 °C higher than that of the battery cycled at 1C. The maximum temperature during discharge occurs at the same point in time as the minimum pressure; this explains why the minimum pressure is higher for the 3C case (Figure 3a).
As shown in Table 1, the battery cycled at 3C exhibited the highest increase in residual pressure across cycles. This may be attributed to the increase in irreversible lithium plating, which is well-known to be exacerbated by charging at high currents and voltages [5,42,43,44,45,46] or operating at low temperatures [5,42,44,45,46,47,48,49,50,51,52]. The SEI layer growth rate also increases under high C-rate operation. Also, the SEI layer can be damaged due to lithium plating, causing it to fracture and crack, thus exposing new surfaces where the SEI layer can grow [53]. Over multiple cycles, this leads to an irreversible expansion in the anode [21]. Moreover, as the electrolyte is consumed in the SEI layer growth reaction, gases are generated as byproducts and can build up in the cell.
The effect of battery temperature during cycling on the build-up of pressure in the battery is shown in Figure 3b. As mentioned earlier in this work, high C-rate and low temperatures are known to increase the amount of plated lithium on the anode [5]. Generally, the performance of Li-ion batteries is unfavorable at low temperatures, showing accelerated capacity loss and low efficiency. Accelerated capacity loss is particularly apparent during the charging process [24]. This is mainly due to decreased ionic conductivity in the electrolyte, poor Li-ion diffusivity in the solid electrode, and a poor charge transfer rate [54,55]. Studies have shown that the poor diffusivity of lithium ions within the anode is potentially the main driver of lithium plating at low temperatures [5]. Lithium plating takes place when the concentration of lithium ions at the anode’s surface exceeds a maximum value. At low-temperature operation, lithium ions accumulate at the anode–electrolyte interface due to poor diffusivity, leading to plating [47]. Moreover, Purewal et al. [56] reported that at low temperatures, the surface of the anode is prone to crack formation and propagation. Crack propagation degrades the anode and exposes a larger surface area of the electrode to the electrolyte, which in turn reacts with exposed areas where it is consumed in the SEI formation reaction. At higher cycling temperatures, the decreased residual pressure build-up may be attributed to the enhanced mechanical properties of polymer materials in the SEI, making it less susceptible to crack propagation.
The rate of SEI layer growth generally follows the Arrhenius equation and is slow at low temperatures [23,56]. Nevertheless, the battery cycled at 10 °C showed a rate of residual pressure build-up to an order of magnitude higher than that of the battery cycled at 40 °C (Table 1). This observation suggests that irreversible lithium plating is a more dominant factor affecting pressure build-up compared to SEI growth and gas evolution. Other researchers have also suggested that gas evolution might not be the major factor in increasing the thickness of aging Li-ion batteries [41].
Figure 4 shows the pressure difference per cycle for all tested batteries. The pressure difference represents the reversible portion of the pressure increase per cycle. We observed that the pressure difference is higher for the batteries cycled at 1C and 2C compared to the battery cycled at 3C (Figure 4a). As discussed earlier, the battery cycled at a rate of 3C showed a higher irreversible pressure build-up from cycle to cycle, so it follows that the pressure difference would be lower. The pressure difference increases as the batteries are cycled. This can be attributed to two factors. First, most of the SEI layer formation takes place in the early cycles, leading to a significant amount of irreversibility in the first few cycles. Secondly, it is because the maximum pressure (Figure 5) is increasing faster than the minimum pressure (i.e., residual pressure) (Table 1). After all, the maximum pressure represents both the reversible and irreversible portions of the pressure. For instance, a portion of the accumulated lithium ions does not form an irreversible metallic solid lithium layer, but instead intercalates into the anode either during the resting stage after charging, or during the discharge step [9,57]. We can see this effect clearly in the trend in the pressure difference for the battery cycled with a rate of 3C at an ambient temperature of 10 °C, where the lithium plating is most apparent.

3.3. EIS Analysis

EIS analysis was performed on all batteries before and after cycling for 100 cycles. Zahner analysis software (version 3.2.4) was used to fit the data. An equivalent circuit adopted from Schmitt et al. [58] is used to model the electrochemical components of the battery (Figure 6). An inductor is added to account for the induction of the cell wiring and the connecting cable. The resistance (Re) is used to model the series resistance (electrolyte ohmic resistance). The second resistance (Rp) represents the polarization resistance and accounts for the SEI layer resistance as well as the charge transfer on anodes and cathodes. The parallel capacitance (Qp) represents the total polarization capacitance, including the double-layer capacitance. One loop is used for both the anode and the cathode sides because it is difficult to model each side accurately using an equivalent circuit since the frequency ranges of both electrodes overlap [4].
Figure 7 shows the fitted EIS spectra along with the experimental data points for each battery before and after cycling. The summary and comparison of fitted data are shown in Table 3. The error values for the data fitting with this model were less than 4% for all cases. First, we observed that (Re) did not change significantly. The resistance (Re) is a measure of the ohmic resistance in the cell, mainly due to the resistance of the electrolyte to lithium ion conduction. Thus, a change in (Re) would signify the decomposition of the electrolyte, resulting in gas formation and build-up in the battery. As discussed in the previous section, the evidence shows that lithium plating has a more prominent effect than electrolyte decomposition and gas formation when operating the battery at high C-rates and/or low temperatures. Secondly, we observed a decrease in the polarization resistance, which accounts for the charge-transfer resistance in the battery. The decrease in (Rp) after battery aging has been reported previously by Stiaszny et al. [59,60]. They attributed it to the increase in the surface area of the anode due to the breaking up of the anode surface’s graphene layers or cracked particles. This is supported by the fact that the total polarization capacitance (Qp) of the batteries increased (Table 3). Moreover, in a paper by Schweikert et al. [61] on Li/Li4Ti5O12 batteries, the authors showed that a decrease in the impedance value corresponds to an increase in the interfacial area between the electrolyte and lithium metal electrode and that the surface area increases due to lithium plaiting. We can see that the battery cycled at 1C showed the lowest change in (Rp) and (Qp) compared to the batteries cycled at 2C and 3C. The same pattern was observed for the battery cycled at the elevated temperature of 40 °C. It had the lowest change compared to the batteries cycled at 10 °C and 25 °C.

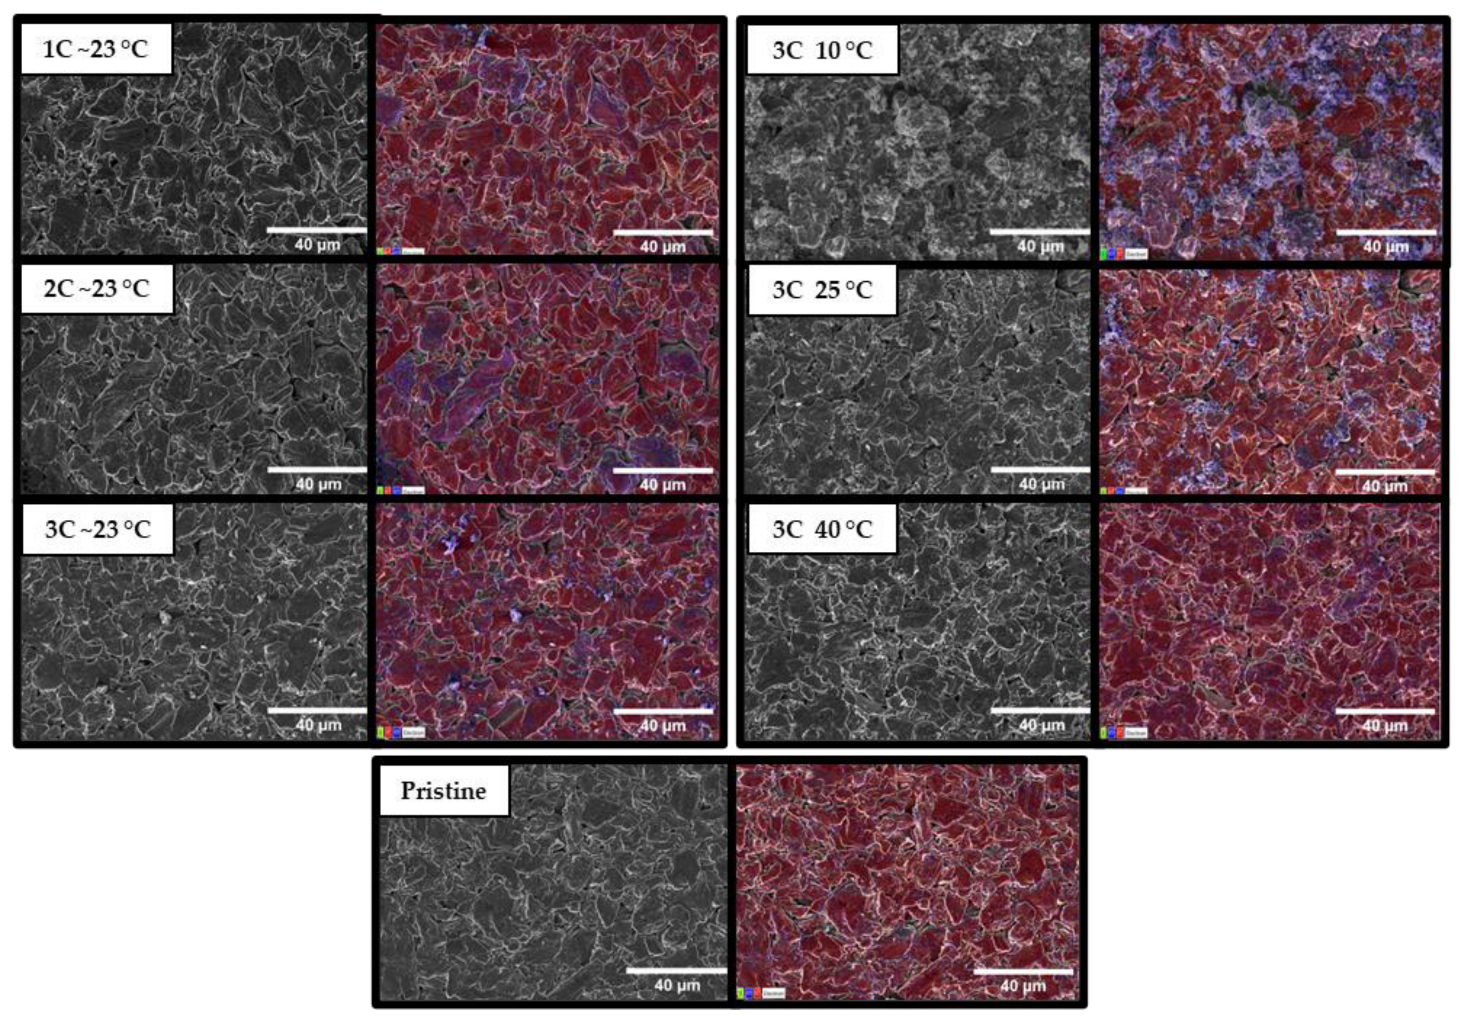
3.4. Postmortem Analysis

After disassembling the batteries in the argon-filled glove box and separating the components, the anodes were separated and examined as shown in Figure 8. The visual differences can be seen across the electrodes. The pristine anode has a uniform and black graphite color. A grey-colored deposit is observed on some areas of the aged anodes’ surfaces. These deposits are associated with lithium plating [35,62,63]. The battery cycled at 40 °C does not show any sign of plating. The anode of the battery cycled at 10 °C has a lot of silver-colored areas which corresponds to lithium plating. The lithium plating near the edges and folds of the anode is more apparent. This phenomenon has been observed by previous researchers and is often referred to as the overhang effect, where lithium plating in Li-ion batteries begins at the anode’s edges [15,64].
Further material characterization was performed on a sample from each anode. The samples were cut out of the areas with visible deposit build-up as shown in Figure 8. The SEM images (Figure 9) show changes in the morphology and film growth/deposition on the surface of the graphite. The anodes of the batteries aged at 1C and 2C do not show significant changes compared to the anode of the pristine battery. However, all the batteries anodes aged at 3C show clear signs of deposition or film growth on their surfaces, except for the battery cycled at an elevated temperature of 40 °C.
Moreover, EDS is used to map the atomic composition of the surface of the anodes. Since EDS cannot directly detect lithium because of its low X-ray energy, we focused on the presence of oxygen. The areas where lithium plating took place can be identified by observing the presence of oxygen on the surface of the anode. These are also sites of SEI layer growth. Also, the detected oxygen may result from lithium reacting with air during the transfer of the anode from the glovebox to the SEM chamber, forming products such as Li2CO3, LiOH, and LiO2. Therefore, the detection of oxygen on the surface of the anode can hint at the severity and distribution of lithium on the surface of the anode [62,65,66]. The anodes of the batteries cycled with a C-rate of 1C and 2C show uniform film growth, where oxygen is detected throughout the surface. On the other hand, the anodes from the batteries aged at 3C at room temperature, 25 °C, and 10 °C show very distinct areas where oxygen is concentrated, indicating lithium plating. In particular, the anode of the battery cycled at 10 °C shows a large amount of non-uniform film growth and deposition on the surface. This explains the rapid increase in residual pressure we observed. On the other hand, the anode of the battery cycled at 40 °C shows a very small amount of oxygen detected on the surface and a uniform film growth similar to that of the batteries cycled at 1C and 2C. The weight fractions of the carbon, oxygen, and fluorine obtained from the EDS scans for each anode are reported in Table 4. The fluorine detected on the anodes is from the lithium hexafluorophosphate (LiPF6) salt used in the electrolyte of the battery. As expected, the pristine anode has the lowest amount of oxygen (13.0%), from the formation of the initial SEI layer. All the cycled anodes had a higher fraction of oxygen. The battery cycled at an elevated temperature of 40 °C shows the lowest weight fraction of oxygen (16.9%). Meanwhile, the battery cycled at 10 °C shows the highest (36.8%).

4. Conclusions

In summary, we investigated the pressure build-up behavior in LCO/graphite Li-ion pouch cells under varying C-rates and temperatures. By analyzing the minimum, maximum, and pressure differences per cycle, we identified the key contributors to pressure changes, including SEI layer damage, electrolyte decomposition, and lithium plating. Our results show that higher C-rates (e.g., 3C) lead to faster residual pressure increases compared to lower C-rates, and that low-temperature (e.g., 10 °C) high-rate conditions amplify aging effects, while elevated temperatures may extend the battery′s life. Lithium plating, which occurs at high C-rates and low temperatures, was identified as the primary cause of pressure increase, rather than electrolyte decomposition. Nevertheless, it is worth noting that the SEI layer growth and electrolyte decomposition can be secondary effects of lithium plating. We also showed that studying the maximum pressure alone is insufficient; for example, if the peak pressure (maximum) is increasing, but the residual (minimum) pressure is not, it indicates that the pressure build-up is reversible and is not a sign of an alarming decline in battery health. Also, the EIS measurements supported these findings, showing little change in ohmic resistance but significant changes in polarization resistance and capacitance, both linked to lithium plating. The postmortem analysis confirmed lithium deposition and film growth on the anode’s surface, especially in cells cycled at 10 °C, while cells cycled at 40 °C showed minimal surface changes, which matches the observed increase in residual pressure. Finally, this study demonstrates that pressure measurements provide insights into the aging mechanisms of Li-ion batteries and can be used as a reliable predictor of battery degradation.

Author Contributions

Conceptualization, Y.N. and X.L.; methodology, Y.N. and X.L.; software, Y.N.; validation, Y.N., J.C.V. and X.L.; formal analysis, Y.N.; investigation, Y.N. and J.C.V.; resources, X.L.; data curation, Y.N. and J.C.V.; writing—original draft preparation, Y.N.; writing—review and editing, Y.N. and X.L.; visualization, Y.N.; supervision, X.L.; project administration, X.L.; funding acquisition, X.L. All authors have read and agreed to the published version of the manuscript.

Funding

The authors highly appreciate the support from the National Science Foundation (Award 1941083 and 2329821) and US ARMY DEVCOM GVSC (subcontract through Mission Technologies: contract # P000057226). DISTRIBUTION STATEMENT A. Approved for public release; distribution is unlimited. OPSEC9021.

Data Availability Statement

Dataset available on request from the authors.

Acknowledgments

X. L. gratefully acknowledges receipt of the startup fund from Washington University in St. Louis.

Conflicts of Interest

The authors declare no conflicts of interest.

References

  1. Arshad, F.; Lin, J.; Manurkar, N.; Fan, E.; Ahmad, A.; Tariq, M.-N.; Wu, F.; Chen, R.; Li, L. Life Cycle Assessment of Lithium-Ion Batteries: A Critical Review. Resour. Conserv. Recycl. 2022, 180, 106164. [Google Scholar] [CrossRef]
  2. Laresgoiti, I.; Käbitz, S.; Ecker, M.; Sauer, D.U. Modeling Mechanical Degradation in Lithium Ion Batteries during Cycling: Solid Electrolyte Interphase Fracture. J. Power Sources 2015, 300, 112–122. [Google Scholar] [CrossRef]
  3. Lu, M.; Cheng, H.; Yang, Y. A Comparison of Solid Electrolyte Interphase (SEI) on the Artificial Graphite Anode of the Aged and Cycled Commercial Lithium Ion Cells. Electrochim. Acta 2008, 53, 3539–3546. [Google Scholar] [CrossRef]
  4. Vetter, J.; Novák, P.; Wagner, M.R.; Veit, C.; Möller, K.-C.; Besenhard, J.O.; Winter, M.; Wohlfahrt-Mehrens, M.; Vogler, C.; Hammouche, A. Ageing Mechanisms in Lithium-Ion Batteries. J. Power Sources 2005, 147, 269–281. [Google Scholar] [CrossRef]
  5. Lin, X.; Khosravinia, K.; Hu, X.; Li, J.; Lu, W. Lithium Plating Mechanism, Detection, and Mitigation in Lithium-Ion Batteries. Prog. Energy Combust. Sci. 2021, 87, 100953. [Google Scholar] [CrossRef]
  6. Arora, P.; Doyle, M.; White, R.E. Mathematical Modeling of the Lithium Deposition Overcharge Reaction in Lithium-Ion Batteries Using Carbon-Based Negative Electrodes. J. Electrochem. Soc. 1999, 146, 3543. [Google Scholar] [CrossRef]
  7. Iurilli, P.; Brivio, C.; Wood, V. On the Use of Electrochemical Impedance Spectroscopy to Characterize and Model the Aging Phenomena of Lithium-Ion Batteries: A Critical Review. J. Power Sources 2021, 505, 229860. [Google Scholar] [CrossRef]
  8. Maheshwari, A.; Heck, M.; Santarelli, M. Cycle Aging Studies of Lithium Nickel Manganese Cobalt Oxide-Based Batteries Using Electrochemical Impedance Spectroscopy. Electrochim. Acta 2018, 273, 335–348. [Google Scholar] [CrossRef]
  9. Krause, T.; Nusko, D.; Pitta Bauermann, L.; Vetter, M.; Schäfer, M.; Holly, C. Methods for Quantifying Expansion in Lithium-Ion Battery Cells Resulting from Cycling: A Review. Energies 2024, 17, 1566. [Google Scholar] [CrossRef]
  10. Sun, Y.; Lu, H.; Jin, Y. Experimental and Numerical Study on Mechanical Deformation Characteristics of Lithium Iron Phosphate Pouch Battery Modules under Overcharge Conditions. Energy Fuels 2021, 35, 15172–15184. [Google Scholar] [CrossRef]
  11. Arora, A.; Lele, S.A.; Medora, N.; Souri, S. Lithium-Ion Battery Failures in Consumer Electronics; Artech House Power Engineering Library; Artech House: Boston, MA, USA, 2019; ISBN 978-1-63081-603-2. [Google Scholar]
  12. Siegel, J.B.; Stefanopoulou, A.G.; Hagans, P.; Ding, Y.; Gorsich, D. Expansion of Lithium Ion Pouch Cell Batteries: Observations from Neutron Imaging. J. Electrochem. Soc. 2013, 160, A1031. [Google Scholar] [CrossRef]
  13. Ren, D.; Xie, L.; Wang, L.; He, X. A Practical Approach to Predict Volume Deformation of Lithium-Ion Batteries from Crystal Structure Changes of Electrode Materials. Int. J. Energy Res. 2021, 45, 7732–7740. [Google Scholar] [CrossRef]
  14. Nitta, N.; Wu, F.; Lee, J.T.; Yushin, G. Li-Ion Battery Materials: Present and Future. Mater. Today 2015, 18, 252–264. [Google Scholar] [CrossRef]
  15. Birkenmaier, C.; Bitzer, B.; Harzheim, M.; Hintennach, A.; Schleid, T. Lithium Plating on Graphite Negative Electrodes: Innovative Qualitative and Quantitative Investigation Methods. J. Electrochem. Soc. 2015, 162, A2646–A2650. [Google Scholar] [CrossRef]
  16. Rieger, B.; Schlueter, S.; Erhard, S.V.; Jossen, A. Strain Propagation in Lithium-Ion Batteries from the Crystal Structure to the Electrode Level. J. Electrochem. Soc. 2016, 163, A1595. [Google Scholar] [CrossRef]
  17. Hemmerling, J.; Guhathakurta, J.; Dettinger, F.; Fill, A.; Birke, K.P. Non-Uniform Circumferential Expansion of Cylindrical Li-Ion Cells—The Potato Effect. Batteries 2021, 7, 61. [Google Scholar] [CrossRef]
  18. Zhang, X.; He, J.; Zhou, J.; Chen, H.; Song, W.; Fang, D. Thickness Evolution of Commercial Li-Ion Pouch Cells with Silicon-Based Composite Anodes and NCA Cathodes. Sci. China Technol. Sci. 2021, 64, 83–90. [Google Scholar] [CrossRef]
  19. Mei, W.; Duan, Q.; Lu, W.; Sun, J.; Wang, Q. An Investigation on Expansion Behavior of Lithium Ion Battery Based on the Thermal-Mechanical Coupling Model. J. Clean. Prod. 2020, 274, 122643. [Google Scholar] [CrossRef]
  20. Liu, G.; Ouyang, M.; Lu, L.; Li, J.; Han, X. Analysis of the Heat Generation of Lithium-Ion Battery during Charging and Discharging Considering Different Influencing Factors. J. Therm. Anal. Calorim. 2014, 116, 1001–1010. [Google Scholar] [CrossRef]
  21. Louli, A.J.; Ellis, L.D.; Dahn, J.R. Operando Pressure Measurements Reveal Solid Electrolyte Interphase Growth to Rank Li-Ion Cell Performance. Joule 2019, 3, 745–761. [Google Scholar] [CrossRef]
  22. Ciorba, S.; Marracci, M.; Antonetti, C.; Martinelli, M.; Caposciutti, G.; Tellini, B.; Raspolli Galletti, A.M. Experimental Analysis of Overcharged Li-Polymer Batteries. Case Stud. Chem. Environ. Eng. 2020, 2, 100012. [Google Scholar] [CrossRef]
  23. Grimsmann, F.; Brauchle, F.; Gerbert, T.; Gruhle, A.; Parisi, J.; Knipper, M. Impact of Different Aging Mechanisms on the Thickness Change and the Quick-Charge Capability of Lithium-Ion Cells. J. Energy Storage 2017, 14, 158–162. [Google Scholar] [CrossRef]
  24. Luo, H.; Wang, Y.; Feng, Y.-H.; Fan, X.-Y.; Han, X.; Wang, P.-F. Lithium-Ion Batteries under Low-Temperature Environment: Challenges and Prospects. Materials 2022, 15, 8166. [Google Scholar] [CrossRef]
  25. Juarez-Robles, D.; Vyas, A.A.; Fear, C.; Jeevarajan, J.A.; Mukherjee, P.P. Overcharge and Aging Analytics of Li-Ion Cells. J. Electrochem. Soc. 2020, 167, 090547. [Google Scholar] [CrossRef]
  26. Wang, X.; Sone, Y.; Kuwajima, S. In Situ Investigation of the Volume Change in Li-Ion Cell with Charging and Discharging. J. Electrochem. Soc. 2004, 151, A273. [Google Scholar] [CrossRef]
  27. Wang, X.; Sone, Y.; Segami, G.; Naito, H.; Yamada, C.; Kibe, K. Understanding Volume Change in Lithium-Ion Cells during Charging and Discharging Using In Situ Measurements. J. Electrochem. Soc. 2007, 154, A14. [Google Scholar] [CrossRef]
  28. Peabody, C.; Arnold, C.B. The Role of Mechanically Induced Separator Creep in Lithium-Ion Battery Capacity Fade. J. Power Sources 2011, 196, 8147–8153. [Google Scholar] [CrossRef]
  29. Cannarella, J.; Arnold, C.B. Ion Transport Restriction in Mechanically Strained Separator Membranes. J. Power Sources 2013, 226, 149–155. [Google Scholar] [CrossRef]
  30. Cannarella, J.; Arnold, C.B. Stress Evolution and Capacity Fade in Constrained Lithium-Ion Pouch Cells. J. Power Sources 2014, 245, 745–751. [Google Scholar] [CrossRef]
  31. Müller, V.; Scurtu, R.-G.; Memm, M.; Danzer, M.A.; Wohlfahrt-Mehrens, M. Study of the Influence of Mechanical Pressure on the Performance and Aging of Lithium-Ion Battery Cells. J. Power Sources 2019, 440, 227148. [Google Scholar] [CrossRef]
  32. Liu, X.M.; Arnold, C.B. Effects of Cycling Ranges on Stress and Capacity Fade in Lithium-Ion Pouch Cells. J. Electrochem. Soc. 2016, 163, A2501–A2507. [Google Scholar] [CrossRef]
  33. Bauer, M.; Wachtler, M.; Stöwe, H.; Persson, J.V.; Danzer, M.A. Understanding the Dilation and Dilation Relaxation Behavior of Graphite-Based Lithium-Ion Cells. J. Power Sources 2016, 317, 93–102. [Google Scholar] [CrossRef]
  34. Li, W.; Xia, Y.; Zhu, J.; Luo, H. State-of-Charge Dependence of Mechanical Response of Lithium-Ion Batteries: A Result of Internal Stress. J. Electrochem. Soc. 2018, 165, A1537–A1546. [Google Scholar] [CrossRef]
  35. Petzl, M.; Danzer, M.A. Nondestructive Detection, Characterization, and Quantification of Lithium Plating in Commercial Lithium-Ion Batteries. J. Power Sources 2014, 254, 80–87. [Google Scholar] [CrossRef]
  36. Cannarella, J.; Arnold, C.B. State of Health and Charge Measurements in Lithium-Ion Batteries Using Mechanical Stress. J. Power Sources 2014, 269, 7–14. [Google Scholar] [CrossRef]
  37. Barai, A.; Tangirala, R.; Uddin, K.; Chevalier, J.; Guo, Y.; McGordon, A.; Jennings, P. The Effect of External Compressive Loads on the Cycle Lifetime of Lithium-Ion Pouch Cells. J. Energy Storage 2017, 13, 211–219. [Google Scholar] [CrossRef]
  38. Louli, A.J.; Li, J.; Trussler, S.; Fell, C.R.; Dahn, J.R. Volume, Pressure and Thickness Evolution of Li-Ion Pouch Cells with Silicon-Composite Negative Electrodes. J. Electrochem. Soc. 2017, 164, A2689. [Google Scholar] [CrossRef]
  39. Dai, H.; Yu, C.; Wei, X.; Sun, Z. State of Charge Estimation for Lithium-Ion Pouch Batteries Based on Stress Measurement. Energy 2017, 129, 16–27. [Google Scholar] [CrossRef]
  40. Samad, N.A.; Kim, Y.; Siegel, J.B.; Stefanopoulou, A.G. Battery Capacity Fading Estimation Using a Force-Based Incremental Capacity Analysis. J. Electrochem. Soc. 2016, 163, A1584. [Google Scholar] [CrossRef]
  41. Bitzer, B.; Gruhle, A. A New Method for Detecting Lithium Plating by Measuring the Cell Thickness. J. Power Sources 2014, 262, 297–302. [Google Scholar] [CrossRef]
  42. Burns, J.C.; Stevens, D.A.; Dahn, J.R. In-Situ Detection of Lithium Plating Using High Precision Coulometry. J. Electrochem. Soc. 2015, 162, A959–A964. [Google Scholar] [CrossRef]
  43. Tippmann, S.; Walper, D.; Balboa, L.; Spier, B.; Bessler, W.G. Low-Temperature Charging of Lithium-Ion Cells Part I: Electrochemical Modeling and Experimental Investigation of Degradation Behavior. J. Power Sources 2014, 252, 305–316. [Google Scholar] [CrossRef]
  44. Waldmann, T.; Kasper, M.; Wohlfahrt-Mehrens, M. Optimization of Charging Strategy by Prevention of Lithium Deposition on Anodes in High-Energy Lithium-Ion Batteries—Electrochemical Experiments. Electrochim. Acta 2015, 178, 525–532. [Google Scholar] [CrossRef]
  45. Smart, M.C.; Ratnakumar, B.V. Effects of Electrolyte Composition on Lithium Plating in Lithium-Ion Cells. J. Electrochem. Soc. 2011, 158, A379. [Google Scholar] [CrossRef]
  46. Agubra, V.; Fergus, J. Lithium Ion Battery Anode Aging Mechanisms. Materials 2013, 6, 1310–1325. [Google Scholar] [CrossRef]
  47. Zhao, X.; Yin, Y.; Hu, Y.; Choe, S.-Y. Electrochemical-Thermal Modeling of Lithium Plating/Stripping of Li(Ni0.6Mn0.2Co0.2)O2/Carbon Lithium-Ion Batteries at Subzero Ambient Temperatures. J. Power Sources 2019, 418, 61–73. [Google Scholar] [CrossRef]
  48. Waldmann, T.; Hogg, B.-I.; Kasper, M.; Grolleau, S.; Couceiro, C.G.; Trad, K.; Matadi, B.P.; Wohlfahrt-Mehrens, M. Interplay of Operational Parameters on Lithium Deposition in Lithium-Ion Cells: Systematic Measurements with Reconstructed 3-Electrode Pouch Full Cells. J. Electrochem. Soc. 2016, 163, A1232–A1238. [Google Scholar] [CrossRef]
  49. Ren, D.; Smith, K.; Guo, D.; Han, X.; Feng, X.; Lu, L.; Ouyang, M.; Li, J. Investigation of Lithium Plating-Stripping Process in Li-Ion Batteries at Low Temperature Using an Electrochemical Model. J. Electrochem. Soc. 2018, 165, A2167–A2178. [Google Scholar] [CrossRef]
  50. Petzl, M.; Kasper, M.; Danzer, M.A. Lithium Plating in a Commercial Lithium-Ion Battery—A Low-Temperature Aging Study. J. Power Sources 2015, 275, 799–807. [Google Scholar] [CrossRef]
  51. Zinth, V.; Von Lüders, C.; Hofmann, M.; Hattendorff, J.; Buchberger, I.; Erhard, S.; Rebelo-Kornmeier, J.; Jossen, A.; Gilles, R. Lithium Plating in Lithium-Ion Batteries at Sub-Ambient Temperatures Investigated by in Situ Neutron Diffraction. J. Power Sources 2014, 271, 152–159. [Google Scholar] [CrossRef]
  52. Waldmann, T.; Wilka, M.; Kasper, M.; Fleischhammer, M.; Wohlfahrt-Mehrens, M. Temperature Dependent Ageing Mechanisms in Lithium-Ion Batteries—A Post-Mortem Study. J. Power Sources 2014, 262, 129–135. [Google Scholar] [CrossRef]
  53. Gargh, P.; Sarkar, A.; Lui, Y.H.; Shen, S.; Hu, C.; Hu, S.; Nlebedim, I.C.; Shrotriya, P. Correlating Capacity Fade with Film Resistance Loss in Fast Charging of Lithium-Ion Battery. J. Power Sources 2021, 485, 229360. [Google Scholar] [CrossRef]
  54. Ma, S.; Jiang, M.; Tao, P.; Song, C.; Wu, J.; Wang, J.; Deng, T.; Shang, W. Temperature Effect and Thermal Impact in Lithium-Ion Batteries: A Review. Prog. Nat. Sci. Mater. Int. 2018, 28, 653–666. [Google Scholar] [CrossRef]
  55. Ouyang, D.; He, Y.; Weng, J.; Liu, J.; Chen, M.; Wang, J. Influence of Low Temperature Conditions on Lithium-Ion Batteries and the Application of an Insulation Material. RSC Adv. 2019, 9, 9053–9066. [Google Scholar] [CrossRef]
  56. Purewal, J.; Wang, J.; Graetz, J.; Soukiazian, S.; Tataria, H.; Verbrugge, M.W. Degradation of Lithium Ion Batteries Employing Graphite Negatives and Nickel–Cobalt–Manganese Oxide + Spinel Manganese Oxide Positives: Part 2, Chemical–Mechanical Degradation Model. J. Power Sources 2014, 272, 1154–1161. [Google Scholar] [CrossRef]
  57. Chen, Y.; Torres-Castro, L.; Chen, K.-H.; Penley, D.; Lamb, J.; Karulkar, M.; Dasgupta, N.P. Operando Detection of Li Plating during Fast Charging of Li-Ion Batteries Using Incremental Capacity Analysis. J. Power Sources 2022, 539, 231601. [Google Scholar] [CrossRef]
  58. Schmitt, J.; Maheshwari, A.; Heck, M.; Lux, S.; Vetter, M. Impedance Change and Capacity Fade of Lithium Nickel Manganese Cobalt Oxide-Based Batteries during Calendar Aging. J. Power Sources 2017, 353, 183–194. [Google Scholar] [CrossRef]
  59. Stiaszny, B.; Ziegler, J.C.; Krauß, E.E.; Schmidt, J.P.; Ivers-Tiffée, E. Electrochemical Characterization and Post-Mortem Analysis of Aged LiMn2O4–Li(Ni0.5Mn0.3Co0.2)O2/Graphite Lithium Ion Batteries. Part I: Cycle Aging. J. Power Sources 2014, 251, 439–450. [Google Scholar] [CrossRef]
  60. Stiaszny, B.; Ziegler, J.C.; Krauß, E.E.; Zhang, M.; Schmidt, J.P.; Ivers-Tiffée, E. Electrochemical Characterization and Post-Mortem Analysis of Aged LiMn2O4–NMC/Graphite Lithium Ion Batteries Part II: Calendar Aging. J. Power Sources 2014, 258, 61–75. [Google Scholar] [CrossRef]
  61. Schweikert, N.; Hahn, H.; Indris, S. Cycling Behaviour of Li/Li4Ti5O12 Cells Studied by Electrochemical Impedance Spectroscopy. Phys. Chem. Chem. Phys. 2011, 13, 6234. [Google Scholar] [CrossRef]
  62. Waldmann, T.; Hogrefe, C.; Flügel, M.; Pivarníková, I.; Weisenberger, C.; Delz, E.; Bolsinger, M.; Boveleth, L.; Paul, N.; Kasper, M.; et al. Efficient Workflows for Detecting Li Depositions in Lithium-Ion Batteries. J. Electrochem. Soc. 2024, 171, 070526. [Google Scholar] [CrossRef]
  63. Hogrefe, C.; Waldmann, T.; Hölzle, M.; Wohlfahrt-Mehrens, M. Direct Observation of Internal Short Circuits by Lithium Dendrites in Cross-Sectional Lithium-Ion in Situ Full Cells. J. Power Sources 2023, 556, 232391. [Google Scholar] [CrossRef]
  64. Grimsmann, F.; Gerbert, T.; Brauchle, F.; Gruhle, A.; Parisi, J.; Knipper, M. Hysteresis and Current Dependence of the Graphite Anode Color in a Lithium-Ion Cell and Analysis of Lithium Plating at the Cell Edge. J. Energy Storage 2018, 15, 17–22. [Google Scholar] [CrossRef]
  65. Ghanbari, N.; Waldmann, T.; Kasper, M.; Axmann, P.; Wohlfahrt-Mehrens, M. Inhomogeneous Degradation of Graphite Anodes in Li-Ion Cells: A Postmortem Study Using Glow Discharge Optical Emission Spectroscopy (GD-OES). J. Phys. Chem. C 2016, 120, 22225–22234. [Google Scholar] [CrossRef]
  66. Pivarníková, I.; Flügel, M.; Paul, N.; Cannavo, A.; Ceccio, G.; Vacík, J.; Müller-Buschbaum, P.; Wohlfahrt-Mehrens, M.; Gilles, R.; Waldmann, T. Observation of Preferential Sputtering of Si/Graphite Anodes from Li-Ion Cells by GD-OES and Its Validation by Neutron Depth Profiling. J. Power Sources 2024, 594, 233972. [Google Scholar] [CrossRef]
Figure 1. Schematic of the experimental setup used in this work.
Batteries 10 00333 g001
Figure 2. Pressure and temperature of battery during cycling with a rate of 1C at ambient temperature. (a) All 100 cycles. (b) First cycle with detailed steps.
Batteries 10 00333 g002
Figure 3. Minimum pressure measured for each cycle for different operating conditions. (a) Batteries cycled with different C-rates at room temperature (~23 °C). (b) Batteries cycled at different temperatures with a rate of 3C.
Batteries 10 00333 g003
Figure 4. Pressure difference between maximum and minimum for each cycle at different operating conditions. (a) Batteries cycled with different C-rates at room temperature (~23 °C). (b) Batteries cycled at different temperatures with a rate of 3C.
Batteries 10 00333 g004
Figure 5. Maximum pressure measured for each cycle for different operating conditions. (a) Batteries cycled with different C-rates at room temperature (~23 °C). (b) Batteries cycled at different temperatures with a rate of 3C.
Batteries 10 00333 g005
Figure 6. The equivalent circuit model used for fitting of EIS spectra.
Batteries 10 00333 g006
Figure 7. Experimental EIS data with fitted spectra. (ac) Batteries tested at different C-rates at room temperature (23 °C). (a) at 1C; (b) at 2C; and (c) at 3C. (df) Batteries tested at different temperatures cycled at a rate of 3C. (d) at 10 °C; (e) at 25 °C; and (f) at 40 °C.
Batteries 10 00333 g007
Figure 8. Photos of all anodes used in this study after disassembly. Red circles denote areas chosen for further material characterization.
Batteries 10 00333 g008
Figure 9. SEM images with corresponding EDS analysis elemental maps for all anodes.
Batteries 10 00333 g009
Table 1. Summary of calculated average residual pressure per cycle for all tested batteries.
C-RateCirculating Water TemperatureAverage Residual Pressure (Pa/Cycle)Average Increase in Maximum Pressure (Pa/Cycle)
1C-2.313.6
2C-24.835.0
3C-28.646.1
3C10 °C191.6264.6
3C25 °C40.155.6
3C40 °C13.120.0
Table 2. Maximum, minimum, and average battery temperature during discharging and charging for batteries cycled with no temperature control.
C-RateDischarging Temperature (°C)Charging Temperature (°C)
MinMaxAvgMinMaxAvg
1C23.725.624.823.825.124.4
2C24.528.626.924.927.426.2
3C24.232.229.124.628.926.3
Table 3. Summary of EIS data fitting resulting resistance values.
C-RateCirculating Water TemperatureBattery StateRe (mΩ)Rp (mΩ)Qp (mF)
1C-New37.528.629.4
Cycled37.522.132.1
2C-New31.824.931.5
Cycled33.018.241.3
3C-New33.826.129.7
Cycled32.819.240.8
3C10 °CNew27.128.135.2
Cycled26.620.148.3
3C25 °CNew39.023.428.4
Cycled37.320.338.3
3C40 °CNew43.526.329.8
Cycled45.722.633.9
Table 4. The weight fraction of carbon, oxygen, and fluorine from EDS scans for each anode.
Battery Cycling ConditionCOF
Pristine82.8%13.0%4.2%
1C~23 °C74.9%19.6%5.5%
2C~23 °C67.0%25.5%7.1%
3C~23 °C72.4%21.8%5.8%
3C 10 °C59.8%36.8%3.4%
3C 25 °C72.9%21.8%5.3%
3C 40 °C78.7%16.9%4.4%
Disclaimer/Publisher’s Note: The statements, opinions and data contained in all publications are solely those of the individual author(s) and contributor(s) and not of MDPI and/or the editor(s). MDPI and/or the editor(s) disclaim responsibility for any injury to people or property resulting from any ideas, methods, instructions or products referred to in the content.

