Article

Heat Pipe Embedded Battery Cooling System for Future Electric Vehicle

School of Mechanical Engineering, College of Engineering, Chungbuk National University, 1 Chungdae-ro, Cheongju 28644, Chungbuk, Republic of Korea
*
Author to whom correspondence should be addressed.
These authors contributed equally to this work.
Batteries 2025, 11(4), 164; https://doi.org/10.3390/batteries11040164
Submission received: 19 February 2025 / Revised: 9 April 2025 / Accepted: 18 April 2025 / Published: 20 April 2025
(This article belongs to the Special Issue Advances in Thermal Management for Batteries: 2nd Edition)

Abstract

:
The purpose of this study is to examine the performance of a new cooling system whose mechanism is integrated with an immersion cooling system and a heat pipe mechanism. The study comprises an experimental test and a numerical analysis using the 1-D model. In the experiment, a metal heating block that simulated the pouch-type cell was used. It was composed of multiple heaters and thermal sensors, working as a heating model of the battery while observing the thermal behavior of the cell at the same time. The temperature of the heating block was influenced by the types of working fluid and wick structure, which are the key points of this system. Their role is to promote the heat exchange process by facilitating the evaporation and condensation processes. Their performance was evaluated based on different types of shapes and materials of wicks. The simulation model was designed and its feasibility verified with the experiment results. Furthermore, different types of dielectric working fluids and variations in porosities were examined through the simulation model, which are crucial to determining the characteristics of the wick structure.

1. Introduction

The automotive industry is transitioning to electrification as electric vehicles (EVs) become a mainstream alternative to internal combustion engine (ICE) vehicles. The growth rate of EV adoption is expected to rise steeply until 2040, offering considerable opportunities for advantages from investing in EV-related industries [1]. Given this trend, major car manufacturers are expected to accelerate the electrification of their current vehicle lineups by investing in technological development and mass production to enhance product competitiveness. Today, the marketing strategy for EV sales often presents intelligent features such as autonomous driving and customized entertainment cabin systems [2]. However, the development of EV platforms faces several obstacles, particularly in improving battery systems. New smart features require more electricity, and the charging infrastructure is still lacking. Additionally, there are challenges in expanding the driving range per charge, preventing battery thermal runaway, and ensuring overall system reliability [3]. One significant issue is the lack of public charging infrastructure. While most EV users charge at private stations like homes, the absence of public charging infrastructure remains a major barrier to further growth in the automobile market [4].
To increase the driving range per charge, improving battery performance is crucial. This can be achieved by optimizing the energy density of battery cells. One method to increase energy density is to rearrange the battery pack assembly by reducing unnecessary space between cells. For example, BYD’s “Blade Battery” uses cell-to-pack (CTP) technology, which integrates the battery management system (BMS) and many cells, using multiple stacked cells as structural reinforcement without modularizing the cells. This approach helps optimize the space between cells [5]. Another method to increase energy density is to use materials with higher energy potential, such as nickel manganese cobalt (NMC) and lithium iron phosphate (LFP) batteries [6]. The trend in battery capacity is expected to expand, with capacities around 80–100 kWh in the past decade and over 100 kWh for high-performance premium models [7]. However, higher battery capacities with increased energy density generate increased heat per unit area. This trait poses a potential threat of thermal propagation and thermal runaway, which requires advanced thermal management systems and a BMS for effective cooling [8].
Indirect liquid cooling systems, where a cooling plate circulates coolant underneath or over the battery pack for heat exchange, have been predominantly developed so far [9]. Recent advancements in various battery thermal management systems (BTMSs) for electric vehicles demonstrate significant progress in hybrid cooling techniques and AI-driven optimization. Hybrid systems combining phase change materials (PCMs) with liquid cooling have shown improved thermal uniformity under high-load conditions, while machine-learning-based approaches can extend battery lifespan by 40% [10]. Innovative air cooling designs featuring trapezoidal channels [11] and liquid cooling systems incorporating silica gel plates [12] have achieved 20% energy consumption reductions. Recent studies by Mousavi et al. [13] further enhanced hybrid BTMSs through mini-channel and PCM integration, while Zhang et al. [14] optimized dual-evaporator loop heat pipes for improved thermal control.
The economic benefits of advanced BTMSs are substantial, with reported 27% reductions in lifecycle costs and 25% lower carbon footprints compared to conventional systems [15]. Oscillating heat pipe (OHP) technology has emerged as a promising passive cooling solution, with Chi et al. [16,17] demonstrating effective thermal management through direct-contact bottom cooling configurations. Future research directions emphasize ultra-fast charging thermal management [18], highlighting the BTMS’s critical role in advancing EV technology while addressing cost and environmental challenges.
However, as battery energy density and heat generation per unit continue to rise rapidly with advancements in battery performance, the limitations of this cooling method are becoming apparent. Therefore, two promising technologies have gained attention: one is immersion cooling through direct liquid cooling (DLC), where dielectric coolant directly contacts the battery, eliminating thermal and contact resistance between the cooling system and the battery. This incorporated system improves the efficiency of transferring and dissipating heat [19]. For example, Tan et al. [20] conducted a numerical analysis of cylindrical-type battery cells under extreme operating conditions. Under fast charging/discharging situations, the DLC method, with the optimal height and velocity of the fluid flowing through the channel, showed a significant advantage compared to the conventional air cooling method. However, they also pointed out that the challenge for manufacturers would be to prevent coolant leakage, which requires sealing of the circulation system [20].
In another study, a numerical experiment by Sun et al. [21] investigated the effect of channel width for multiple prismatic battery cells to examine the thermal gradient and maximum temperature based on different model types. The results presented that the wider the channel width, the better the performance in retaining the highest temperature while minimizing temperature gaps between cells. Additionally, there were differences in performance based on the position of the cooling channel. The one attached to the side of the model exceeded the performance of the one attached under the module when other input values (contact surface, fluid properties, and velocity of the fluids) were identically configured [21].
The other method is utilizing a heat pipe. The concept of the heat pipe offers a strong edge against thermal failures while managing the temperature of batteries with greater stability. The heat pipe is considered one of the most remarkable ways to transfer heat, with many advantages, such as the straightforwardness of construction, reliability to move heat over distances, and flexibility in its form and manufacture.
Figure 1 depicts the fundamental heat flow of the heat pipe. The evaporator part is where external heat is applied provides a heat load to the evaporator area. When sufficient energy is supplied to the working fluid, it vaporizes and rises to the condenser area, passing through the adiabatic section of the pipe. The vapor clusters together and condenses into a liquid while dissipating the heat it previously gained, and the saturated liquid flows back through the wick by the capillary effect of the wick [22]. The structure of the wick and circulation of the working fluid facilitate the phase change of the fluid, which plays a key role in transferring heat in the heat pipe. The wick structure provides a return path for condensed liquid, facilitating capillary pumping pressure through its surface pores and enabling delivery of heat between the inner wall and the vapor–liquid mixture. The porous structure of the wick enables efficient capillary action, allowing the liquid to gather back easily in the evaporator area and ensuring smooth fluid circulation [23].
With distinctive characteristics, many researchers have conducted studies on thermal management systems for EVs using heat pipes, taking advantage of their high and rapid heat transfer rate per unit area as key benefits of the system. For instance, Smith et al. [24] devised a heat-pipe-integrated cooling system, which transfers heat from a stack of pouch battery cells through heat transfer pipes to cold plates. The results indicated that the system could maintain the temperature of the cell below 55 °C while diffusing 400 W of heat, with a high temperature uniformity of ±5 °C in modules and an overall thermal resistance of 0.075 °C/W. The system addressed the leakage problem within the battery enclosure and simplified the structural design, making it adaptable to various EV platforms [24]. A similar study by Rao et al. [25] examined the capability of using a heat pipe as a primary cooling method for pouch-type LIBs. The results showed that the maximum temperature did not exceed 50 °C under 50 W of heat generation, and the difference in temperature remained under 5 °C under a heat generation rate of 30 W, which meant that the heat pipe system successfully maintained the battery within an operational temperature range [25]. The study by Burkitbayev et al. [26] investigated a heat-pipe–gravitational-force-based battery cooling system for cylindrical LIBs. The BMS, incorporated with copper sheets, heat pipes, and heater cartridges, employed a staggered heat pipe alignment to optimize heat transfer efficiency. The temperature was maintained under 64 °C at a 8C discharge ratewith a temperature difference among batteries under 5 °C [26]. However, these types of thermal management systems using heat pipe technologies are based on the indirect cooling method, whose structure presents obstacles such as contact resistance and thermal resistance within the enclosure of each device component.
To address the limitation of the conventional system with a heat pipe, this study proposes a novel system that incorporates the DLC method and the heat pipe mechanism, as illustrated in Figure 2. In Figure 2b, the battery module is encapsulated within a vacuum-sealed container filled with dielectric working fluid that functions as a sole heat pipe. A key feature of this system is that the battery serves as an internal heat source, located below a cooling plate.
To elaborate on the concept of the system, the top part of the module is the cooling plate, which is operated by the external circulator to establish the condensing area. In Figure 2c, the working fluid vapors flow through the entire sidewall and then saturate at the top part of the case, allowing the liquid to flow back. The thermal network of the system is illustrated in Figure 2c as well, where the system is simpler and faster in transferring heat as the working fluid is directly in contact with the heat source. The battery cell is covered with a wick structure while submerged in working fluid. This type of structure provides several advantages for preventing thermal runaway. The wick layer, combined with the working fluid, creates a gap between cells that absorb external damage and vibration. Additionally, the gap relieves the pressure and load caused by the swelling of nearby cells. Lastly, the dielectric working fluid can cut off short circuits and extinguish fires, thereby preventing thermal propagation.
This study suggests the heat source innate cooling system as an innovative cooling solution and conducts fundamental experiments for its practical adaptation. The experiments were conducted at the cell level, placing a cell prototype inside a vacuum-sealed enclosure and examining the thermal characteristics under various working fluids, levels of heat input, and wick structures. In addition, numerical analysis using 1-D modeling was performed to verify the simulation and experimental results. The 1-D modeling is a continuation of a preliminary study conducted by Oh et al. [27], incorporating more detailed variables and accurate adaptation to experimental conditions. It is hoped that this study contributes to the advancement of EV battery thermal management technologies [27].

2. Experiments

2.1. System Description

In advance of expanding the concept to the scale of the module level, the experiment was conducted at the cell scale to assess its feasibility. A single pouch battery cell was replaced with a stainless-steel heater block. The heater block is installed inside a stainless-steel case with a 3 mm margin between the case wall and the heater block surface. The space between the wall and the heater block should be filled with working fluid and a wick structure while sealing the case in a vacuum. The dimensions of the cell and case are depicted in Table 1.
Figure 3 illustrates the sectional view of the experimental setup, highlighting its key components and heat transfer mechanisms. The heat source consists of two cartridge heaters, each capable of generating up to 120 W at 12 V, sealed with silicone grease for insulation. To measure temperature, five thermocouples (TCs) were embedded in copper rods, with three sets of TC rods placed adjacent to the heater rods within the heater block. The heater block, along with the wick structures, was installed inside a vacuum chamber filled with working fluid, facilitating controlled heat transfer. This setup provides a versatile platform for studying the impact of wick design on thermal performance.
Four different types of wick structures were attached to both sides of the heater block to evaluate performance variations based on wick type and structural differences, while a wickless configuration (thermosyphon) was also tested for reference. The thickness of the wick material is 3 mm with 0.5 mm clearance, which fits perfectly in the gap between the stainless-steel enclosure and heater block. Wick 1 was designed to cover the entire heated surface of the heater block, while Wick 2 was designed to facilitate the flow of vapor inside the chamber by creating a vapor path within the wick material. The cross-section of the vapor path is 30 mm long and 3 mm wide. This covers three-fifths of the surface area of the heater block compared to Wick 1. The material used for Wick 3 is thinner compared to those used in Wicks 1, 2, and 4, which made it possible to form a combination structure of Wick 1 and Wick 2. The inner part of the layer consists of vapor paths like Wick 2, while the outer layer keeps the block surface wet, covering the entire surface of the heater block. The vapor path cross-section is 30 mm long and 1.5 mm wide. In Wick 4, the bottom part was inspired by the shape of Wick 1 to ensure that the surface of the heater block was properly covered with working fluid. To allow the vaporized working fluid to flow easily, promoting the circulation of the condensation and evaporation mechanism, half of the upper part consists of narrower wick channels than Wick 2, as illustrated in Figure 3. The cross-section of each vapor path is 10 mm long and 3 mm wide. To elaborate on the characteristics of the wicks, Figure 4 depicts the SEM images of the wicks used for the experiment. Figure 4a shows a cellulose-based hydrophilic material, which is used for Wicks 1, 2, and 4. Figure 4b illustrates a flame-retardant non-woven fabric, which was used for Wick 3.
The cooling plate was attached to the top of the device for heat dissipation from the heater imitation block, creating the condenser area while simultaneously acting as a heat pipe working mechanism.

2.2. Material Properties of Experimental Components

Table 2 lists the material properties that were used in the experiments. The material of the heater block and case enclosure was made out of stainless steel (SUS 304, Solyeontech, Daejeon-si, Republic of Korea) and the material of Wicks 1, 2, and 4 is cellulose-based high-porosity fabric. The base material of the flame retardant non-woven fabric is pre-carbonized polyacrylonitrile which is used for Wick 3 [22,28,29,30,31].

2.3. Experimental Setup

The experimental system comprises two main components: the heater block and the case. The heater block is designed to simulate the thermal behavior of a pouch-type battery cell for electric vehicles, while the case acts as a vacuum-sealed heat pipe chamber capable of withstanding high temperatures and vacuum conditions simultaneously. Inside the heater block, two cylindrical cartridge heaters are installed, each capable of providing up to 100 W of heat at 12 V, powered by two DC power supplies (UP-3050, Unicorn-TMI Company, Incheon-si, Republic of Korea) with an error margin of ±0.05% for current and voltage. To monitor temperature, thermocouple (TC) sensors are strategically placed both inside the heater block to observe internal temperature variations and on the exterior of the case to measure the device’s external temperature. As shown in Figure 5, heaters and TC sensor rods are positioned at the same distance 22 mm (dashed lines). The arrow pointing to the circle indicates the exact position of the TC sensors.
The internal TCs are embedded in specially designed probing sensors, arranged in three rows of copper rods, as shown in Figure 3. Each copper rod houses five type-T TCs, making a total of 15 sensors, labeled sequentially from 1 to 15, as depicted in Figure 5. The coolant is circulated by a chiller (HB-205WL-2, Hanbaek Scientific Technology, Bucheon-si, Republic of Korea) that maintains a stable low temperature, with its flow rate monitored by a flow meter (FLM-3, Human Tech Store, Goyang-si, Republic of Korea) with an accuracy of ±10%. The coolant temperature difference is measured using type-R thermocouples installed at the inlet and outlet of the circulator, each with an error margin of ±0.05%. Data from all sensors are collected and monitored in real time using a Yokogawa MX-100 data acquisition system (Yokogawa Electric Corporation, Tokyo, Japan) with a monitoring interval of 500 ms and an accuracy of ±0.05% error. A vacuum pump (V-i2120, Zhejiang Value Mechanical & Electrical Products Co., Ltd., Wenling, China) was used to establish a vacuum of up to 140 Pa. The entire device is insulated using XPS insulation boards to minimize external heat interference and maintain adiabatic conditions.

2.4. Assessment of Thermal Characteristics on the Experiment

2.4.1. Filling Ratio of the Working Fluid

The filling ratio (FR) is one of the most important factors in assessing the heat pipe’s performance. In the experiment, pure distilled water was used as the working fluid for several reasons. First, since water has a high specific heat, it was expected to provide excellent cooling performance.
FR =   V f V t
Next, before using dielectric fluids for the experiment, checking the performance of the working fluid in relation to function of the wick structure was necessary. Additional experiments should be conducted after verifying the validity of the wick system. A study by Abdulshaheed et al. [32] pointed out that adequate FR affects the peak thermal performance of the heat pipe, as expressed in Equation (1). Vf represents the working fluid’s volume, while Vt represents the internal volume of the device [32]. The system aims to assess the performance of cooling efficiency with a wick structure installed. The volume of working fluid needs to be added based on the types of materials, which are closely related to the porosity, shape, and material properties of the wick.

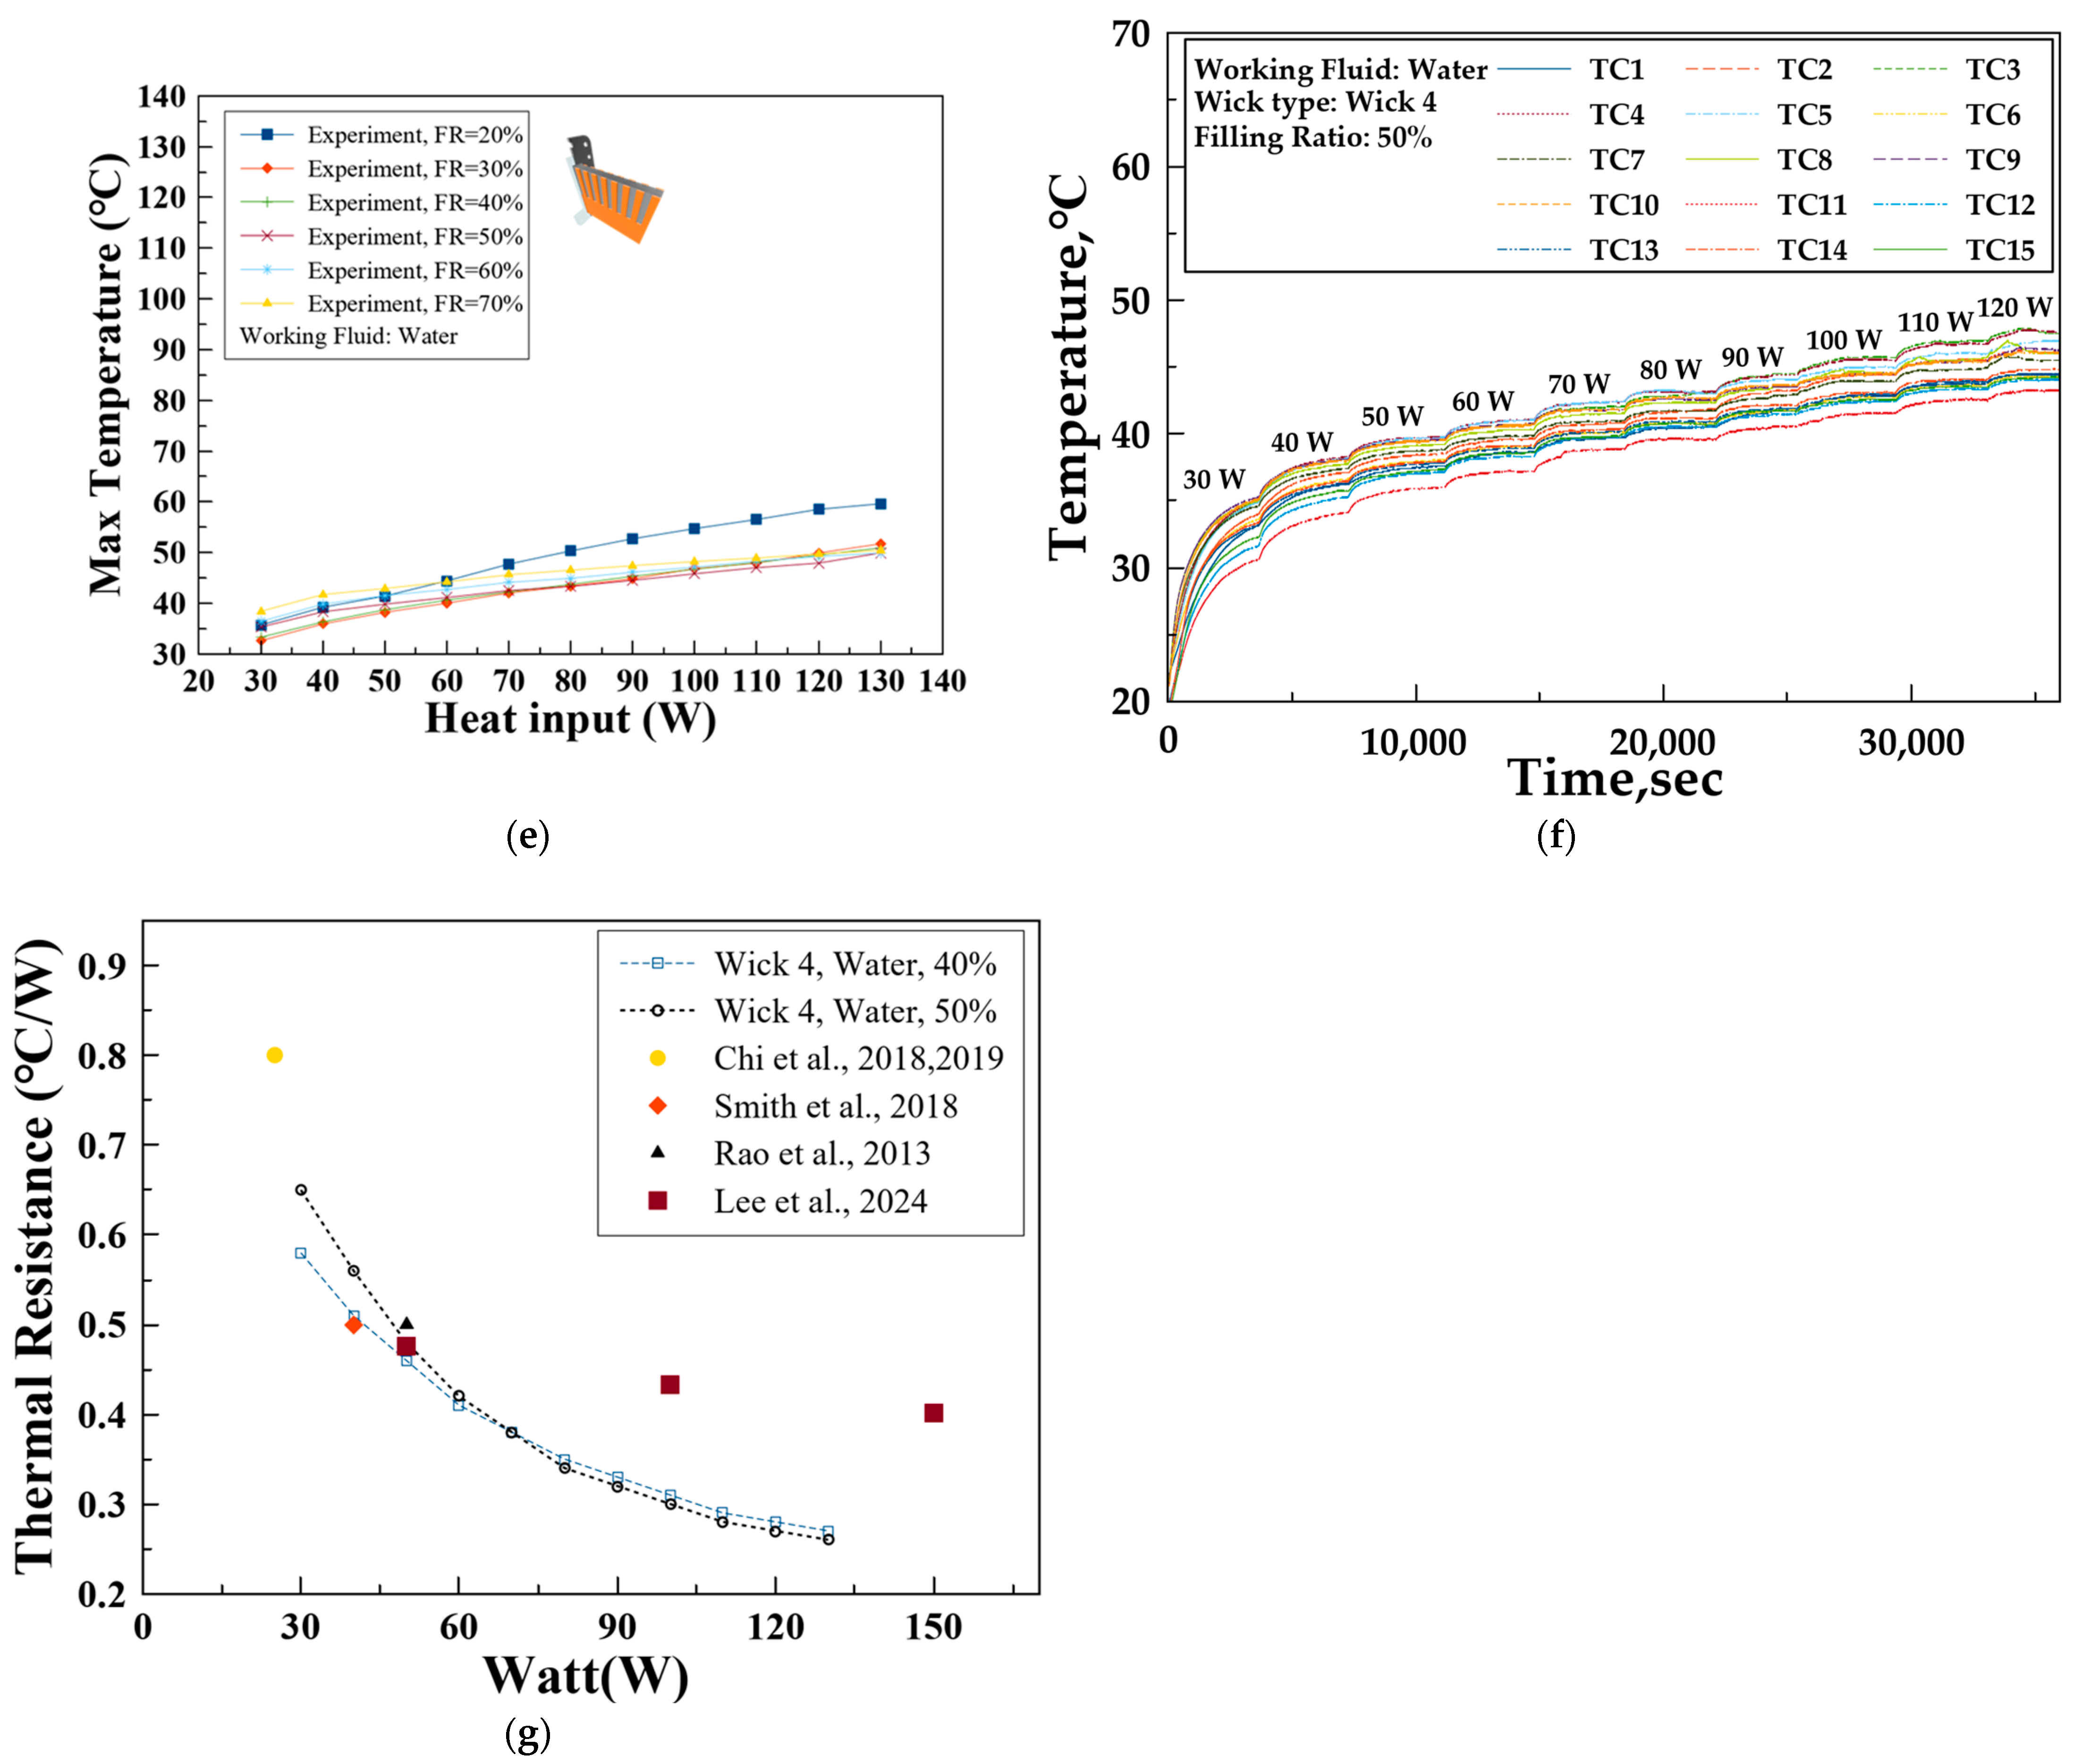
2.4.2. Thermal Resistance

Using the temperature data retrieved from the data logger, system thermal resistance (STR) was calculated using Equation (2). In Equation (2), Q represents a heat input which is calculated by Equation (3), TEvaporator refers to the temperature of the evaporator part of the system, and TCondenser is the temperature of condensing part of the system [33,34].
R th , HP   =   T Evaporator T Condenser Q [ ° C / W ]
Q = V I   [ W ]
In Equation (3) V refers to the voltage input and I is the current from the experiment device. The uncertainty analysis is important as it represents the accuracy of the measurement value to the true value such as voltage (V), current (I), and temperature from experiment devices. The uncertainty in thermal resistance (UR) is expressed by Equation (4), where UT represents uncertainty in the thermocouple and UQ is uncertainty in heat input. In the experiment, the highest uncertainty for thermal resistance was 0.0244 °C/W, with an error rate was 3.25%.
U R = ( R t h T U T ) 2 + ( R t h Q U Q ) 2 [ ° C / W ]

2.4.3. Wick Porosity Estimation

Among the various factors in the working mechanism of the heat pipe, one of the most critical variables of the wick system is capillary pressure. This pressure is induced by the microchannel structure and acts as a pump to circulate the working fluid within the heat pipe [22,33].
Complex and fine pore structures are often used to create powerful capillary pressure force, maintaining various types of formations to increase surface area and retain the fluid molecules, while adjusting the optimal pore size to achieve the best porosity [35]. Instead of measuring porosity through visual measurement, an alternative method was used to calculate the porosity based on material density. Antlauf et al. [36] conducted research assessing the thermal conductivity of cellulose fibers with respect to different sizes and densities, which were determined using Equation (5) [36]. The porosity of the wick, ε, can be expressed as the ratio of the density of the cellulose material ( ρ Cellulose) to the density of the wick ( ρ Wick). While the density of cellulose remains constant in the equation, the density of the wick varies based on the wick type due to differences in shape and material composition.
ε = 1 ρ Wick ρ Cellulose

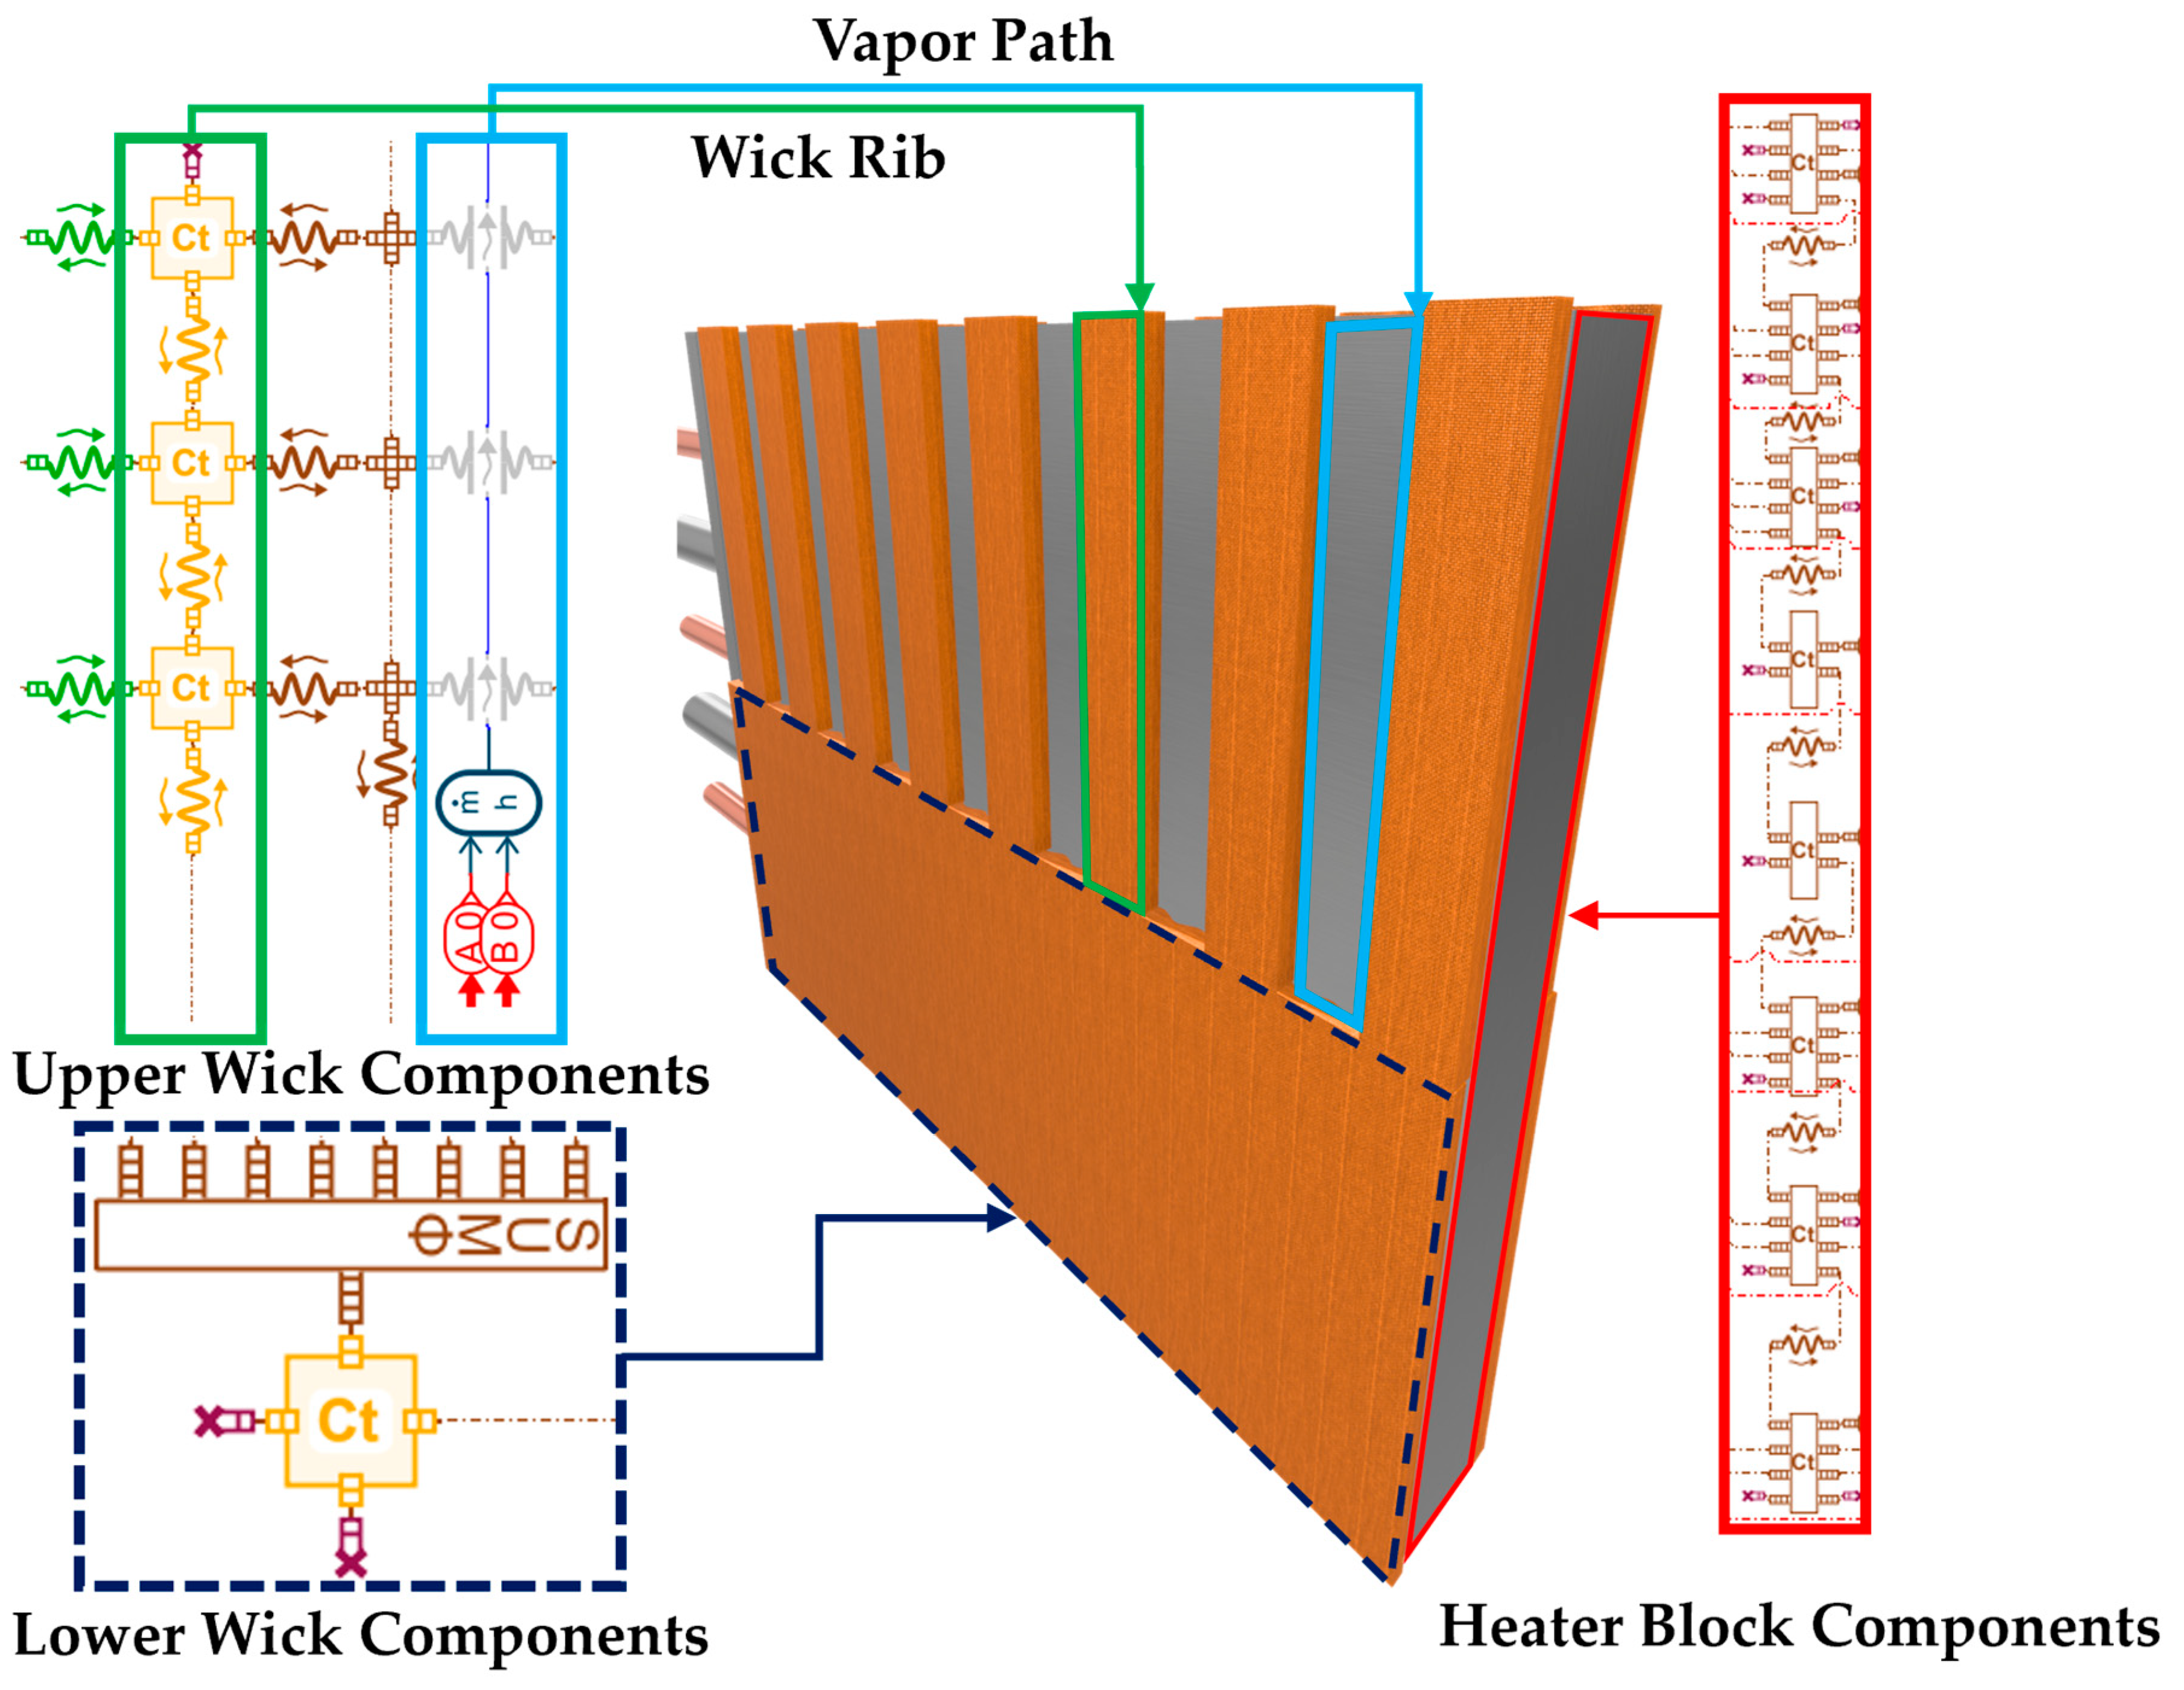
2.5. Numerical Analysis Strategy with 1-D Modeling Method

2.5.1. Saturation Level of the Wick

The simulation model is designed to assess the overall system of the experiment as a 1-D model, which makes it difficult to express the volume fraction of the working fluid inside the chamber. Instead, the concept of saturation level (SL) was adapted to express the filling ratio inside the chamber, including the wick structure. The SL ranges from 0 to 1, which indicates the level of a fully submerged condition of the wicks. In other words, if the wick is fully soaked in the working fluid, the value of the SL is 1, while if the wick is fully dry, then the SL is 0. As shown in Equation (6), the SL is determined by the volume of fluid injected (Vfluid) relative to the volume that the wick can absorb (VWick Saturated). The exact volume of fluid is obtained by dividing the difference between the mass of fluid used for compensation (mCompensation) for the connection part and the total fluid mass (mfluid) by the working fluid density ( ρ liquid). This value is then multiplied by the filling ratio (FR) set for the experiment [37].
S = V f l u i d V W i c k   S a turated = FR × m f l u i d m C o m p e n s a t i o n ρ l i q u i d V W i c k   S a t u r a t e d
Based on the equation, the FR was set in the 20% to 70% range, with values depicted in Table 3. For a filling ratio over 70%, SL was calculated as 1.08, which exceeds the range of SL from 0 to 1. Therefore, the value 1 was inevitably used for the last filling ratio assuming the wick was fully submerged when the fluid was used with a 70% volume fraction.

2.5.2. Effective Equations for the Wick Structure Saturated with Working Fluid

The material properties of the wick can be derived using the effective equations expressed with the proportional weighting of SL, which accounts for differences in the filling ratio. Among various effective thermal conductivity models, the internal structure of the wick was assumed to be a sphere-packed structure based on the SEM image (Figure 4), which follows Equation (7), and the other properties are listed in Table 4 [22,33]. In the equation, kl represents the thermal conductivity of the working fluid, ks refers to the thermal conductivity of the cellulose fiber, and keff is the effective thermal conductivity of wick.
k eff = k s ( S k l + 2 k s ) + 2 ε ( S k l - k s ) ( S k l + 2 k s )   - ε ( S k l - k s )
Next, the effective specific heat capacity (Cp,eff) and density equations ( ρ eff) were calculated based on the same concept as the thermal conductivity models which were expressed in Equations (8) and (9). ρ s refers to the density of the cellulose fiber, ρ l is the density of the working fluid, Cp,s means the specific heat capacity of cellulose fiber, and Cp,l is the specific heat capacity of the working fluid.
ρ eff   = ( l ε ) ρ s + ε S ρ l
Cp,eff = (1 − ε)Cp,s+ εSCp,l

2.5.3. The 1-D Simulation Model for the Experiment

As shown in Figure 6, the validation of the experimental results was conducted by processing a 1-D model simulation via AMESim software (Siemens Simcenter ver. 2310). First, the wick was assumed to be wet under the parameter of saturation level (SL), which determines the level of the submerged portion of the substance. Next, the wick was considered to be under the flow of Darcy’s law to apply the equation of effective properties to evaluate the material properties of the wick combined with the working fluid. Third, as there were no gaps between the wick and heater block, the liquid film effect was neglected. Lastly, except for the convective area of the experimental device, all the other contact faces were under adiabatic conditions [22,37,38,39].
Based on Figure 6, the simulation system closely replicates the experimental setup with the type 4 wick structure, incorporating three main sections: the heating block with wick modeling, the outer enclosure modeling, and the capillary systems. The yellow dotted box represents the case enclosure, which houses the heater block, wick module, and working fluid, providing structural integrity and a controlled environment. The blue boxes on either side depict the capillary systems, which play a key role in circulating the working fluid. In Figure 6, the signal modules are depicted as red dashed lines when connected. Thermal components are connected with brown dashed lines. Thermal hydraulic components are depicted with blue lines when connected. The arrow from the vapor line indicates the connection of the two-phase flow components, which are indicated as light blue lines when connected. The other arrow, indicating the green box, represents a thermal resistance sensor.
The mass flow rate was calculated by converting the mean pressures of the vapor and liquid lines in a thermodynamic state transformer component, which were then transformed into specific heat data representing fully vaporized (x = 1) or fully saturated (x = 0) states [38,39]. The red box highlights the heater block integrated with the wick module. Heat was applied to this block using a constant signal ranging from 30 W to 130 W via a thermal heat flow unit. The heater block is horizontally segmented into eight equal sections to monitor the temperature distribution across its height. This segmentation, consistent with the experimental heater block shown in Figure 3, includes two cartridge heaters and three temperature sensor rods that collect temperature data at various heights, providing insight into the heat transfer characteristics. In the wick composition module, the complex geometry of the wick required separation into two distinct parts for accurate simulation. Looking at Figure 7, the green box indicates the upper wick structure with thermal components, which are indicated as brown lines when connected. Blue box represents the vapor path of the upper wick structure, which is indicated as blue lines when two phase flow components are connected. The dashed box with navy colored represents the lower section of the wick structure. Lastly, the red box indicates heater block structure, which is indicated as brown lines when thermal components are connected. The upper wick structure is modeled with parallel thermal components and two-phase flow pipes, mimicking the spacing between the ribs of the wick. The lower wick structure, on the other hand, was designed as a single unit to minimize modeling complexity. This modular design ensures compatibility while maintaining the physical properties observed in the experimental setup. The wick’s symmetrical, double-sided configuration ensures uniform heat transfer on both sides of the heater block.
Additionally, the cooling plate, located at the top of the system, extracts heat from the working fluid via the chiller, maintaining a stable temperature. The vapor line facilitates the movement of vaporized fluid toward the cooling plate, where condensation occurs, supporting the heat transfer cycle. The thermal resistance sensors monitor the resistance across the battery block and wick module, while maximum temperature sensors ensure operational safety by preventing overheating. This detailed simulation effectively captures the complex thermal and fluid dynamics of the experimental system.
The advantage of using AMESim software is its ability to utilize 1-D models with diverse types of physics that can be modified in detail, such as thermal hydraulics, mechanics, electronics, and two-phase flows. Among these components, thermal, thermal hydraulics, two-phase flows, and signal libraries were used, as depicted in Appendix A.
Equation (10) explains that latent heat lv could be calculated by the difference between liquid state-specific enthalpy hl and vapor state-specific enthalpy hv. Looking at Equation (11), the mass flow rate m ˙ was calculated by dividing the heat input Q by the latent heat obtained above [33,38].
lv = hvhl
m ˙ = Q / l v
The heat was conveyed through thermal conduction components in AMESim simulation that follow conduction rules defined below [40]:
Q = 1 L 1 k 1 A 1 + L 2 k 2 A 2 ( T 2 T 1 )
The convective heat transfer is defined in Equation (13). The surface temperature is denoted as Tsurface, the outside temperature is represented as Tamb, h refers to the heat transfer coefficient, and A indicates surface area [38].
Q = h A ( T surface T amb )
In AMESim software, the calculation of the convective heat transfer is based on the Nusselt number which is a function of the Grashof number and Prandtl number that depends on the status of the convection type, free convection, or forced convection. The convective heat transfer coefficient hc is dependent on the number of the Nusselt number (Nu) which is based on the Reynolds number (Re), Grashof number (Gr), and Prandtl number (Pr) from Equations (14)–(17). Lc represents characteristic length, μ stands for the viscosity coefficient of the fluid, k means thermal conductivity, Cp indicates specific heat capacity, α represents thermal expansion, Vs is average flow velocity, ρ means the density of the fluids, and g stands for the gravitational acceleration [38].
Pr = μ · C p k
Re = ρ · V s · L c μ
Nu =   L c · h c k
Gr = g · α | T w a l l T f l u i d | · L c 3 k
In turbulent single-phase flow, the calculation of the Nusselt number uses Gnielinski correlation which is expressed in Equation (18) [38,39].
Nu =   f 8 ( Re 1000 ) Pr 1 + 12.7 f 8 × ( P r 2 3 1 )
Under two-phase flow conditions, the convective heat transfer coefficient follows Equation (17) in the condensation process [38,39].
H TP = H LO   { ( 1 x ) 0.8 + ( 3.8 · x 0.76 ( 1 x ) 0.04 ( p r e d ) 0.38 ) }
HLO stands for the convective heat transfer coefficient with liquid, which is addressed in Equation (20) [38,39].
H LO = 0.023 · R e L O 0.8 · P r l 0.4 · k l D h
During the boiling process, coefficient equations on the convective heat transfer c are defined as Equations (21) and (22) [38].
H C = H CV 3 + H NcB 3 3
H CV = H LO ·   F TP
For HNcB and FTP, both variables can be earned through Equations (23) and (24) [38].
F TP =   1 [ A 1 + A 2 ] 0.5
H NcB = H NcB 0   · F NcB
A1 and A2 from Equation (23) can be obtained by calculating Equations (25) and (26) [38].
A 1 = [ ( 1 x ) 1.5 + 1.9 x 0.6   ×   ( 1 x ) 0.01   ×   ( p l p g ) 0.35 ] 2.2
A 2 = [ ( H V O H L O )   ×   x 0.01   ×   [ 1 + 8 ( 1 x ) 0.7   ×   ( p l p g ) 0.67 ] 2.0
Also, FNcB can be earned by Equation (27) while FPF obtains its value from Equation (28) [38].
F NcB = F PF   ×   [ Φ Φ 0 ] nf [ D h D 0 ] 0.4   [ R p R 0 ] 0.133 F ( M )
F PF = 2.816 · ( P red ) 0.45 + ( 3.4 + 1.7 1 + ( P r e d ) 7 ( P r e d ) 3.7 ]
In Equation (27) M for the function of F(M) means the molecular mass of the working fluid while other constants FPF, Φ0, HNcB0, Rp0, and m ˙ 0 are determined by the characteristics of the working fluid that contribute the calculation of Φcr,PB in AMESim software.

3. Result and Discussion

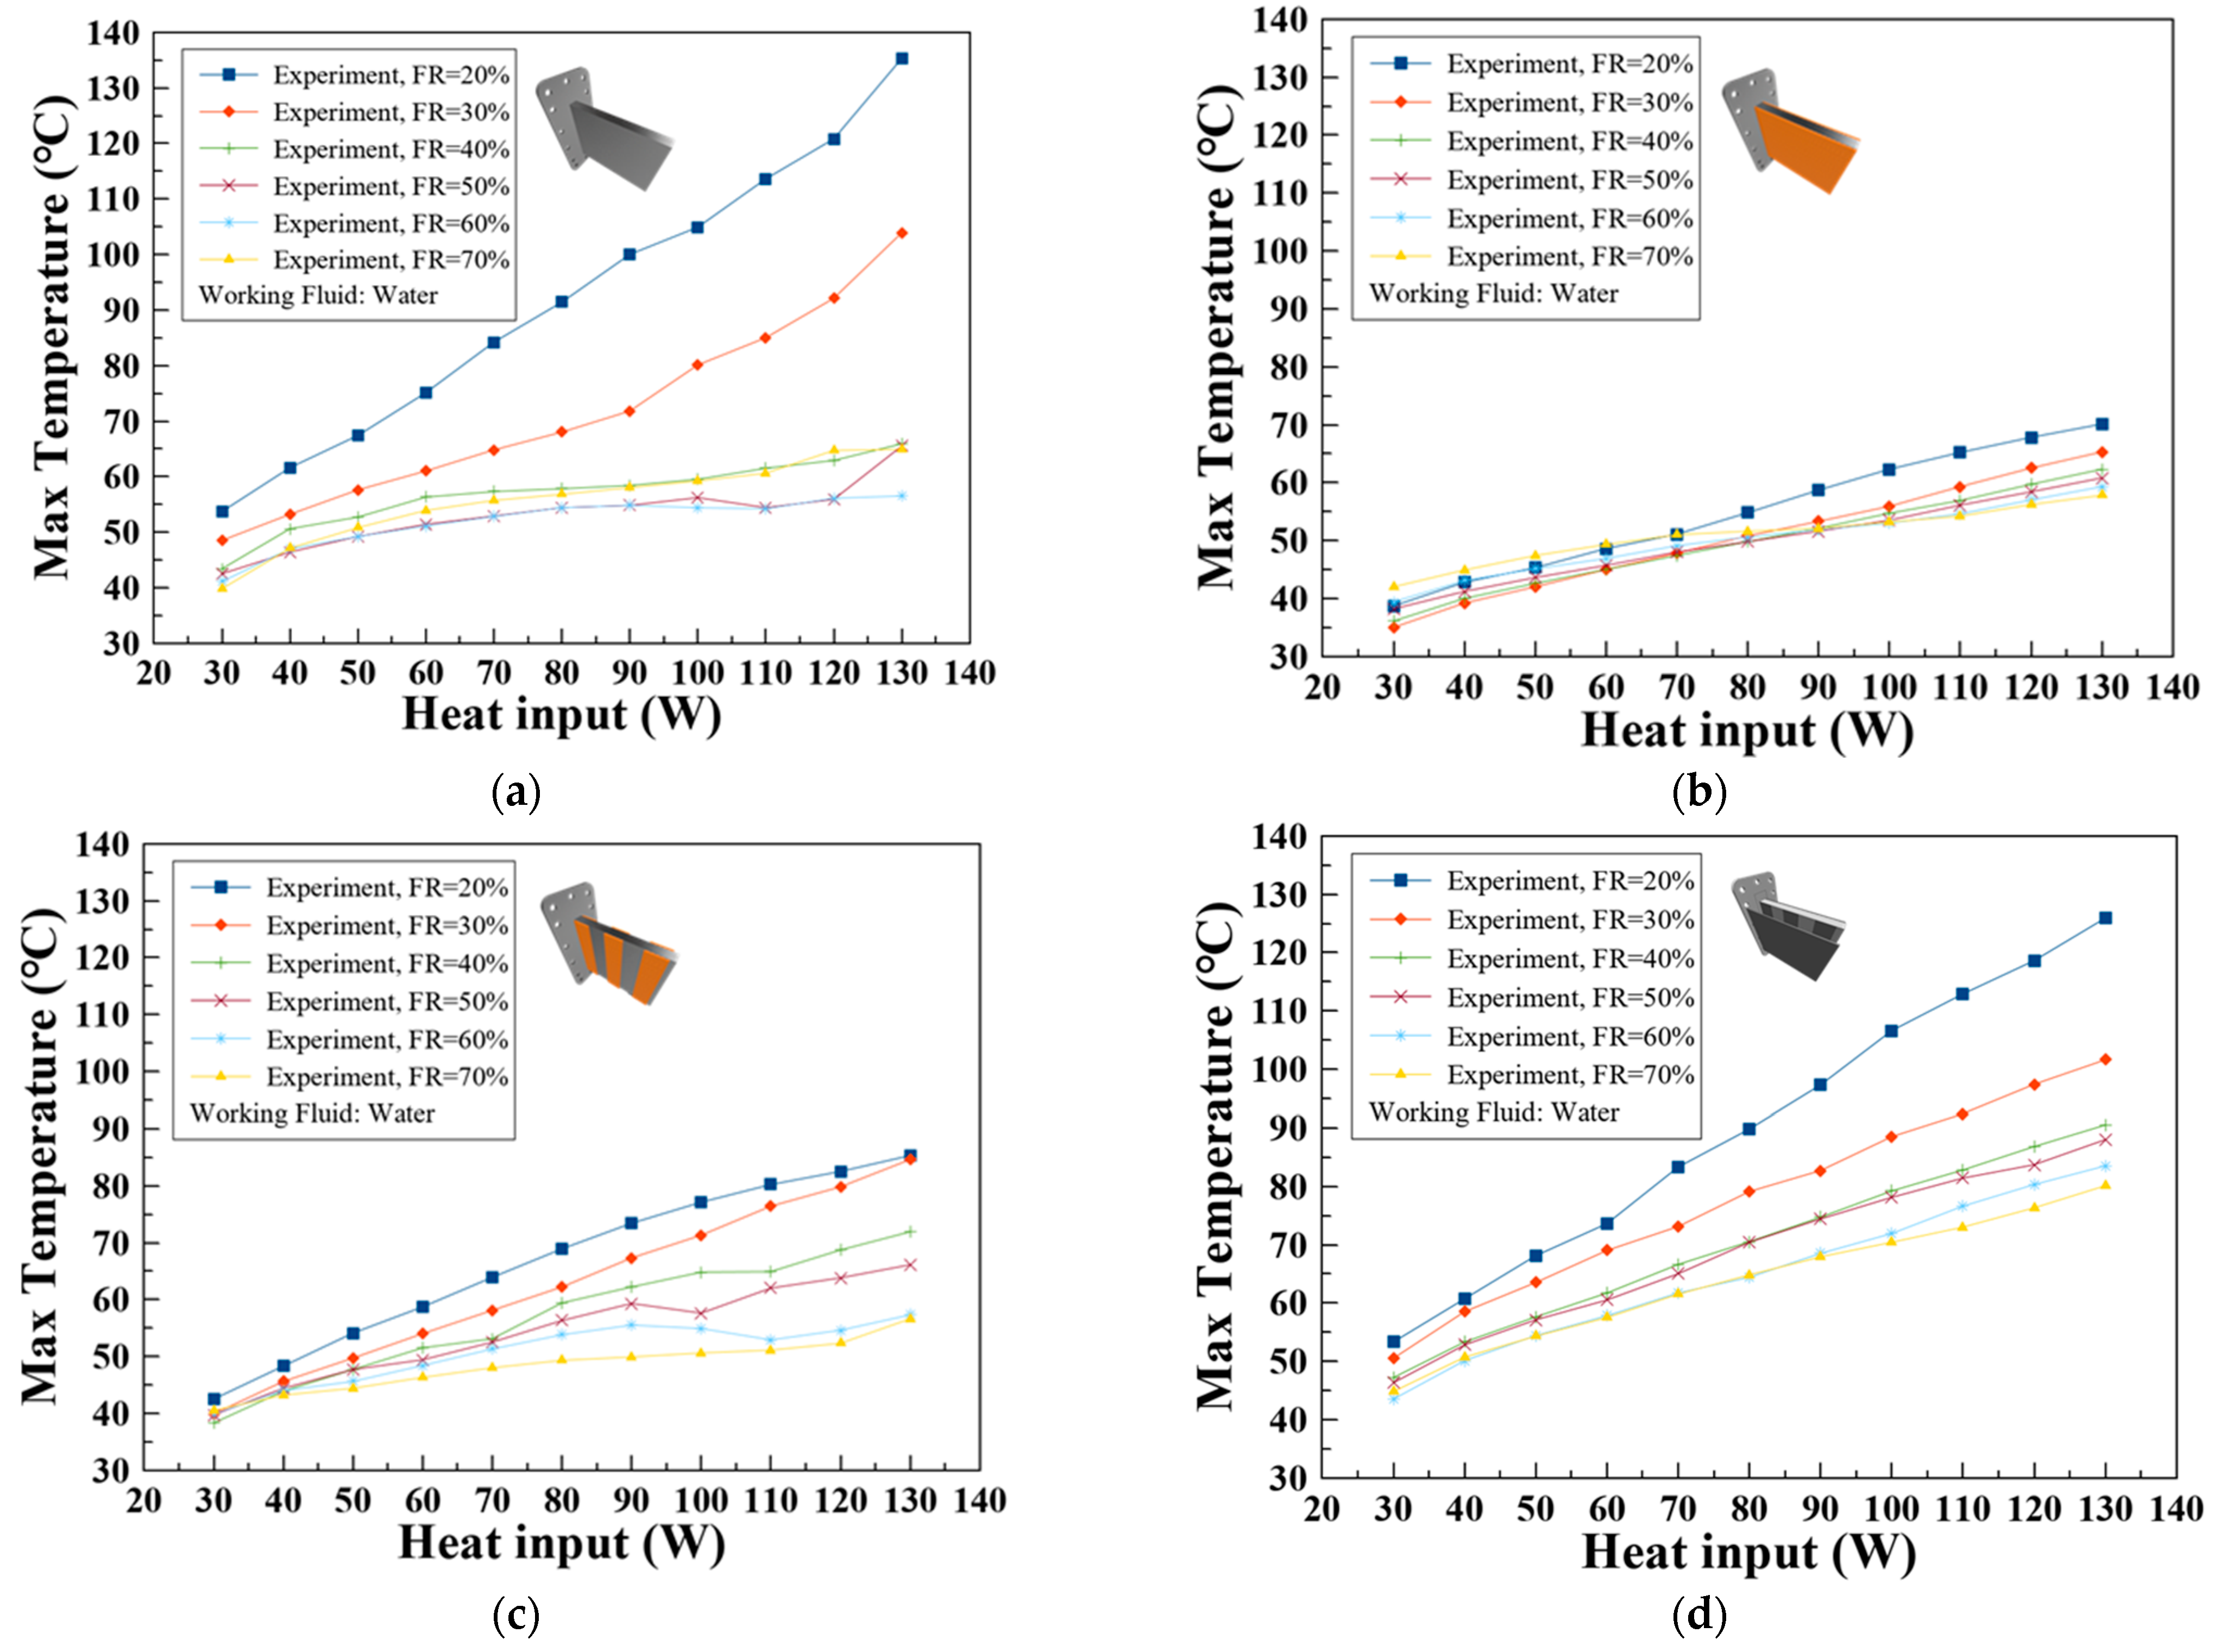
3.1. Effect of Various Wick Structures

A lithium-ion battery (LIB) generates voltage through a chemical reaction that is highly sensitive to the operating temperature of the cell and its surroundings. During charging and discharging, lithium ions are transported between the cathode and anode, and electrical resistance in this process generates heat. If the temperature rises beyond the tolerance levels of the cells, the risk of thermal failures, such as thermal runaway and fire, significantly increases [41,42]. A LIB operates between −20 °C and 50 °C, with an optimal performance range around 20 °C to 35 °C. Temperatures above 80 °C cause the solid electrolyte interphase layer to degrade, resulting in irreversible damage to the cell [43]. At temperatures exceeding 100 °C, the anode material reacts with the electrolytes, leading to separator breakdown. Once the temperature reaches 240 °C or higher, thermal runaway is triggered, releasing flammable gases that can ignite, causing fires and a rapid temperature increase [44]. Consequently, monitoring the maximum temperature of the system is critical to assess the performance and effectiveness of the thermal management system. The initial conditions of the experimental setup are provided in Table 5.
In Figure 8a, when 130 W of heat was applied without a wick, the highest temperature recorded was 135.4 °C at 20% FR. Figure 8b–e indicate the maximum for different types of wicks, and Figure 8a represents the result of a cooling system without a wick structure as a reference. Figure 8b shows the maximum temperature of Wick 1, reaching a maximum of 70.1 °C when 130 W of heat was applied, and the container was charged with a 20% filling ratio of the working fluid. The maximum temperature of Wick 2 is depicted in Figure 8c, which presented an adverse result compared to the expectations for designing the vapor path as intended. Under the same heat input, the maximum temperature reached 85.3 °C at a 20% filling ratio, which was higher than the result of Wick 1. Figure 8d illustrates the result of Wick 3, which was 125.9 °C, showing less effectiveness in cooling the device than the other two cases that used a wick structure.
The result of Wick 4 is illustrated in Figure 8e, which showed the best thermal management stability in the harshest circumstances, reaching 59.6 °C at 20% FR at 130 W heat input. Its optimal filling ratio appeared to be at 50% FR, reaching 49.9 °C at 130 W heat input, making the most desirable balance between evaporation–condensation process. The optimal filling ratio of the heat pipe is considered as one of the most important factors that influence the performance of the heat pipe [45,46]. Since the filling ratio varies according to the structural shape of the heat pipe, morphological differences of the wicks, porosity, operation temperature, and type of material of working fluids, finding the best charging rate of the working fluid should be performed via experimental research. In general, water as a working fluid shows the best performance at around 50% FR [47]. For Wick 4, 50% FR showed the best temperature stability from a low range of heat input with optimal cooling effects and even up to a higher range of heat input compared to other types of wick shape.
In the case of Wicks 1, 2, and 4, hydrophilic substances were used as the wick structures, which can absorb up to 10 times their weight in water. On the other hand, a hydrophobic material was used as a wick structure in the experiment with Wick 3, which only retains up to 5 times its weight.
Elaborating on the figures, several interesting points were observed from the results when comparing Wick 1 and Wick 2. In Figure 8b, the highest temperature of the device decreased as the filling ratio (FR) increased. However, this trend did not show consistency across all heat load ranges. For heat inputs below 90 W, devices with a lower FR, except for the 20% FR case, demonstrated better thermal management than those with a higher FR. Conversely, when the heat input exceeded 90 W, higher FRs contributed to more stable thermal management, reducing the rate of temperature increase. Figure 8c further illustrates that, up to a 50% FR, the maximum temperatures were higher with Wick 2 compared to Wick 1. However, when the heat input exceeded 100 W at a 60% FR, the maximum temperatures for Wick 1 surpassed those of Wick 2.
Figure 8f clearly illustrates the stable temperature variations achieved with Wick 4. As a result, it is observed that there are obvious differences in the result in managing the generated heat while Wicks 1, 2, and 4 share the same material. Discussing each structural performance of wick shapes, Wick 1 covered the entire surface of the heater block. This was effective in keeping the surface of the heater block wet until certain levels of heat input and FR. However, leaving no clear pathways hindered fluid vapor from condensing into the liquid phase easily. Therefore, the circulation process of evaporation and condensation did not work properly. To solve this structural disadvantage, Wick 2 was designed to provide more pathways for vapor to flow freely instead of covering all the surface of the heater block. However, this addressed the lack of capability of pumping up the working fluid at a low FR. As illustrated in Figure 8c, the consistency of managing heater block temperature was inferior from 40% FR to 60% FR in all heat input ranges compared to the result of Wick 1. In contrast, at a 70% FR, the difference became evident, as the maximum temperature of Wick 2 was lower than that of Wick 1 due to Wick 2’s allowance for sufficient space for vapor movement. The structural enhancement of Wick 4 was focused on dealing with previous problems. The hybrid form of wick was intended to acquire two fundamental mechanisms of heat pipe operation. The lower half of the heater block was fully covered with wick like the way Wick 1 was used to keep the surface of the heater block wet. On the other hand, reducing the space between the wicks and grooves was expected to facilitate the condensation process of the vapor [48]. Therefore, the upper part of the heater block was supported with multiple arrays of wick pillows, consisting of narrower grooves than the architecture of Wick 2. This structural advantage resulted in significant improvements in temperature control, as evidenced by the absence of dramatic fluctuations in the temperature curve. Additionally, the structural design of Wick 4 facilitated smooth vapor flow and uniform distribution of the working fluid. Compared to Wick 1, Wick 4’s design allowed for better maintenance of liquid on the heater block surface, contributing to more effective thermal regulation. Figure 8g clearly demonstrates the superior thermal performance of the Wick 4-based direct cooling system compared to conventional indirect cooling methods. The Wick 4 system with 40% filling ratio achieved an outstanding thermal resistance of just 0.46 °C/W at 50 W, outperforming all comparable studies: Smith et al.’s [24] indirect heat pipe system (0.5 °C/W at 40 W), Lee et al.’s [34] pulsating heat pipe (0.476 °C/W at 50 W), and Rao et al.’s [25] results which aligned with Chi et al.’s [16,17] higher resistance values (0.5 °C/W at 40 W). Most remarkably, at higher power loads exceeding 100 W, Wick 4’s thermal resistance dropped below 0.31 °C/W (40% FR) and 0.30 °C/W (50% FR), representing a 28–30% improvement over Lee et al.’s [34] 0.433 °C/W and a 38–40% improvement over Rao et al.’s [25] reported values at similar power levels. This performance advantage is particularly significant considering that Wick 4 maintains consistently low resistance across the entire operational range (30–150 W), while indirect methods like those from Chi et al. [16,17] and Rao et al. [25] show substantially higher resistance at lower loads (0.8 °C/W at 25 W). The Wick 4 system’s innovative combination of direct cooling with advanced wick structure optimization delivers unmatched thermal management efficiency, especially crucial for high-power battery applications where minimizing temperature rise and maximizing reliability are paramount. These comprehensive results conclusively establish Wick 4 as the superior thermal management solution, offering significantly better efficiency and scalability than all existing indirect cooling technologies, including those reported by Rao et al. [25] and other leading studies in the field [16,17,24,34].

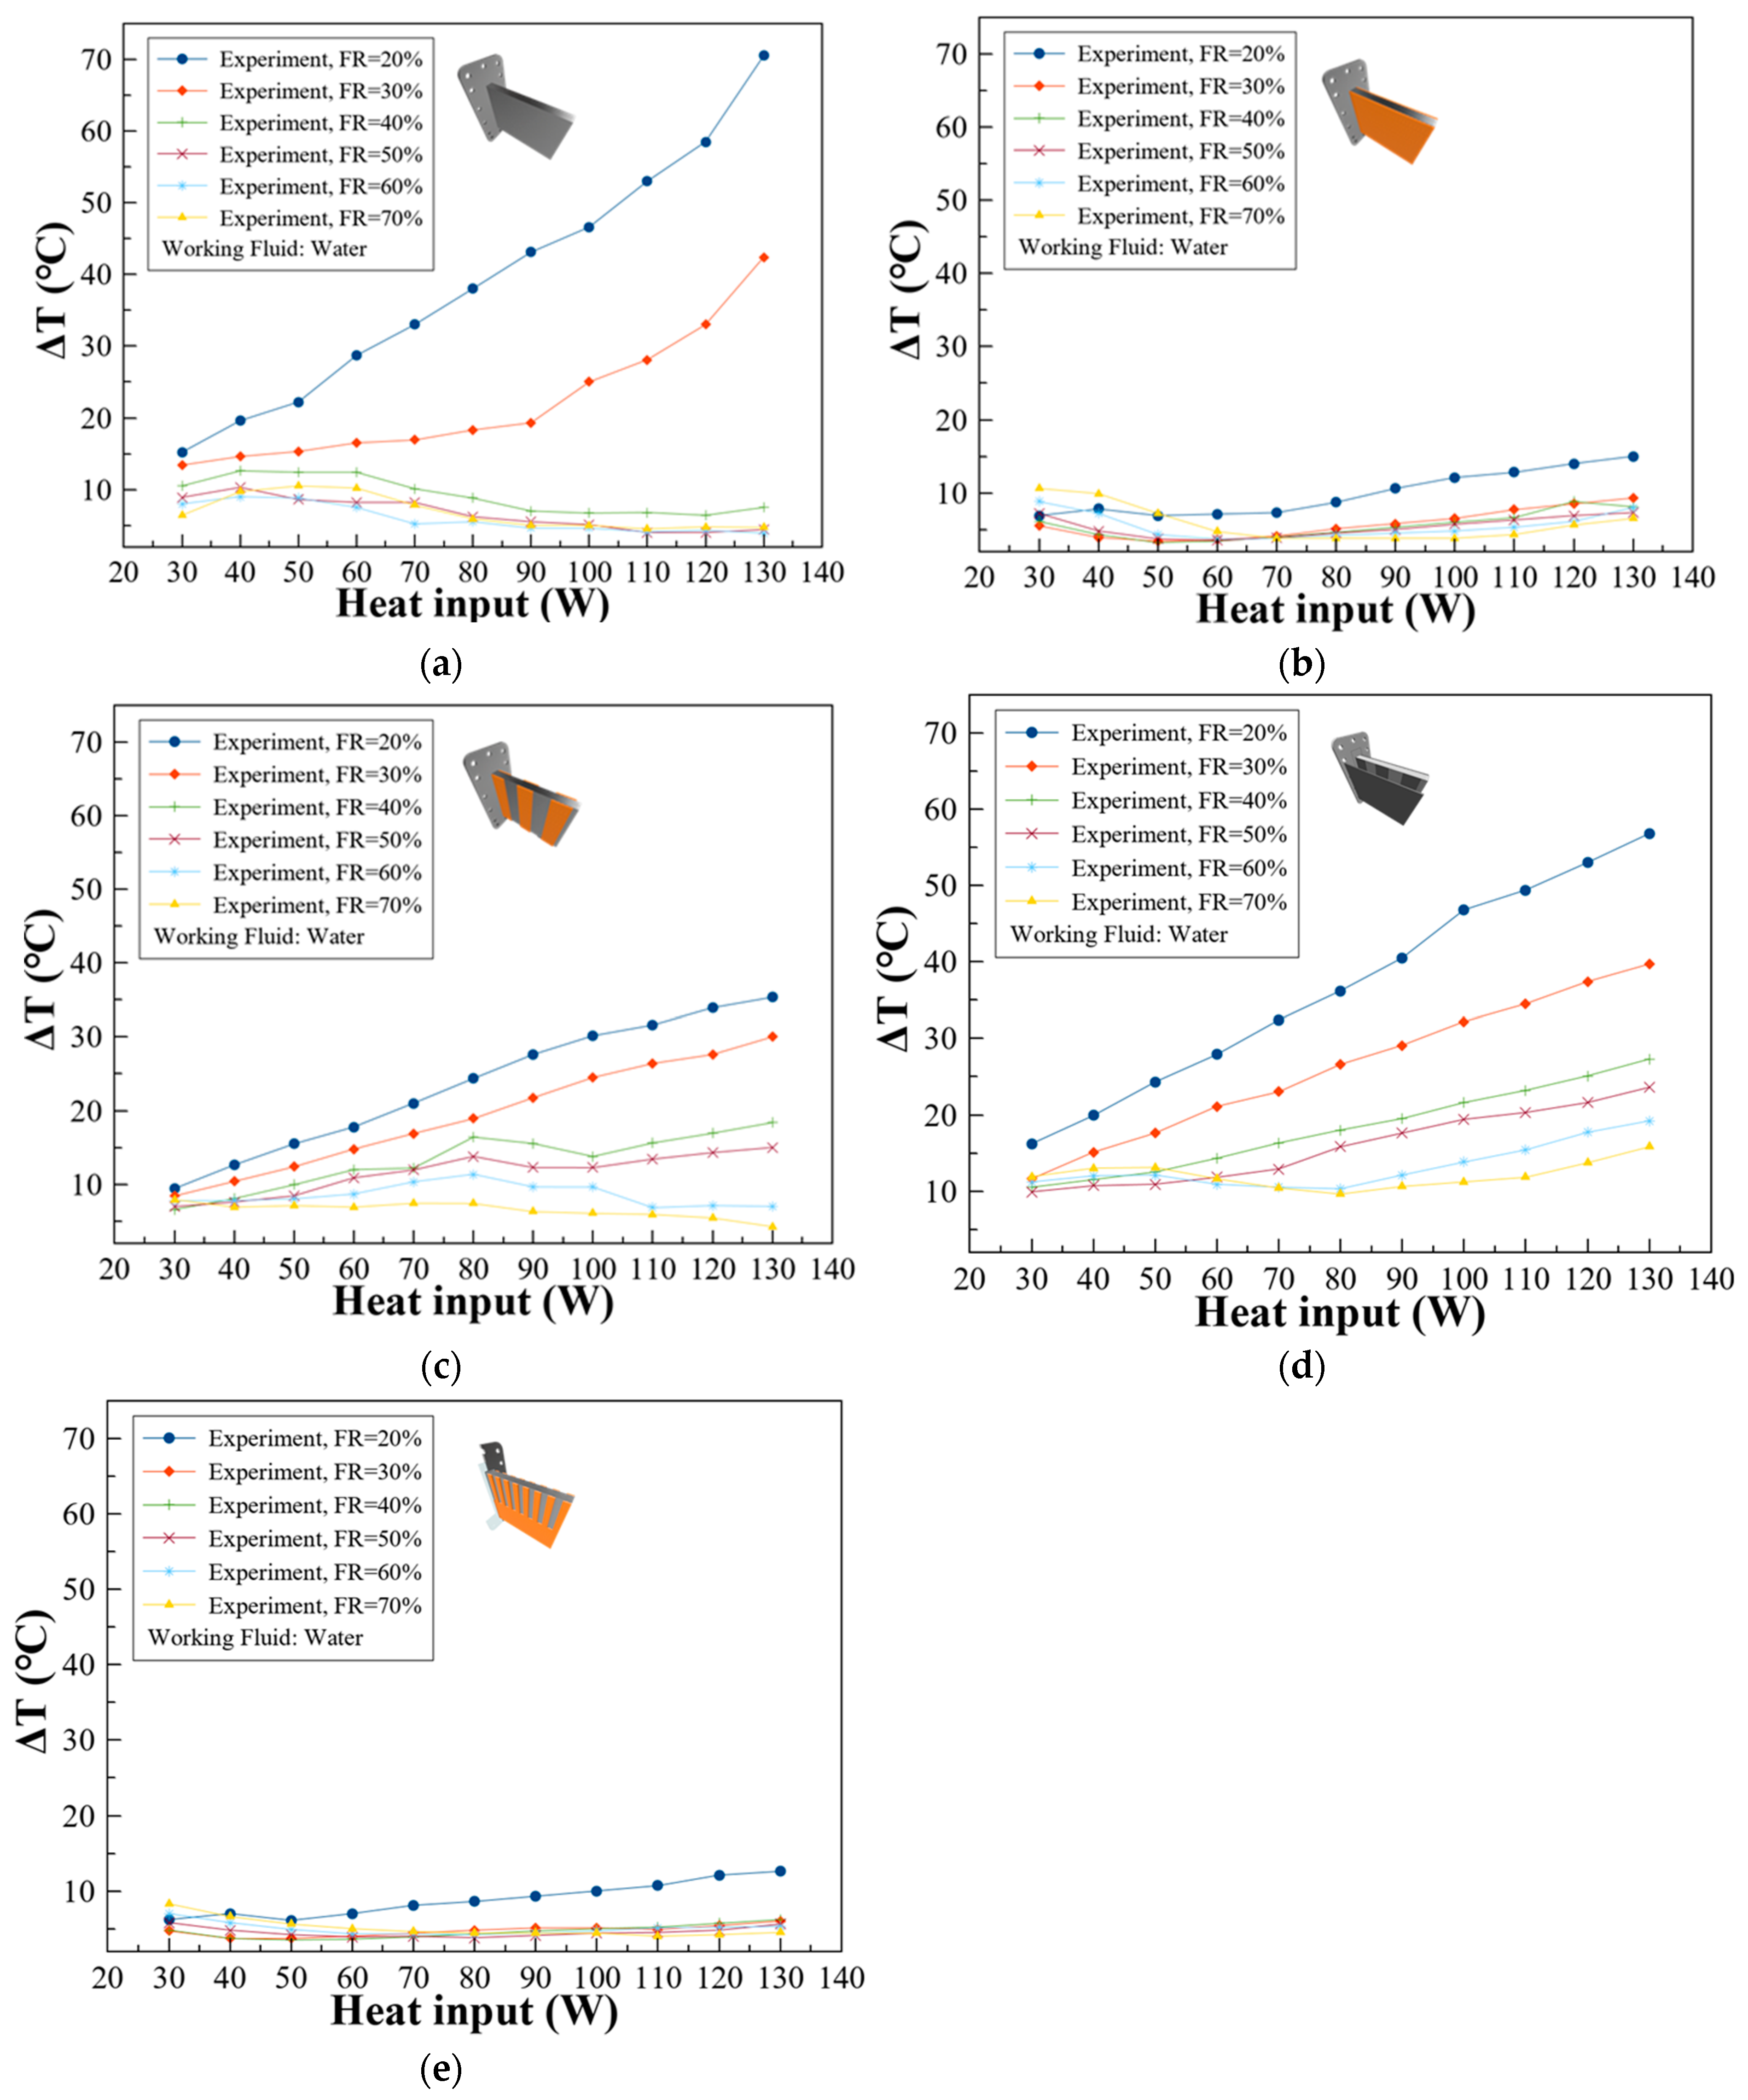
3.2. Temperature Difference of the Battery Surface with Various Types of Wicks

Various forms of battery cells generate different types of heat dissipation patterns. The uniformity of the temperature gradient in a battery cell is one of the crucial factors that affect the stability of voltage output and prevents battery capacity degradation, which is caused by the depletion or aging of the cell [42]. The purpose of the wick is to promote the return process of condensed liquid from the vaporized working fluid, making it easier to cool down the enclosure heated by the heat source [22,33].
Figure 9 provides a comprehensive comparison of the thermal performance of various wick configurations and a wickless system for managing temperature variations under different filling ratios (FRs) and heat input levels, emphasizing the critical role of wick material and structure in achieving uniform temperature distribution.
The wickless system (Figure 9a) exhibited significant temperature differences, with thermal performance heavily reliant on the working fluid’s filling ratio, leading to poor heat distribution and increased thermal stress on the battery cells. In contrast, Wick 1 (Figure 9b) demonstrated efficient heat distribution, particularly for a 30–50% FR, where a flat slope in temperature difference within the 50–90 W range minimized thermal stress, though performance diminished outside this optimal range. As the structural design of Wick 1 is tailored to fit perfectly into the space between the heater block and enclosure, there should be no remaining space for liquid vapor to condense easily, only having space in the porous structure of the wick. This structural characteristic could hinder the cooling performance by interrupting the return of the working fluid that results in degradation of performance in a higher range of filling ratio [22,33]. Wick 2 (Figure 9c) exhibited distinct behavior, with high temperature gaps persisting at a low FR (20–30%) but narrowing significantly at a higher FR (60–70%) under increased heat input, indicating its reliance on higher fluid filling for effective heat management. This result suggests that the vapor path between the wicks had a positive effect facilitating the return of the working fluid particularly at higher ranges of FR. Conversely, Wick 3 (Figure 9d) showed poor thermal performance, with large coverage of heater block surface and a hydrophobic material failing to dissipate heat effectively, resulting in temperature differences ranging from 10 °C to over 50 °C, highlighting its unsuitability for applications requiring uniform temperature control [33,40]. Wick 4 (Figure 9e) outperformed all configurations, achieving the lowest and most stable temperature differences across 30–70% FRs, with a maximum temperature difference of only 12.6 °C at a 20% FR under 130 W, demonstrating its superior material properties and structural design in minimizing temperature variations and enhancing thermal stability. The proposed design of Wick 4 showed promising results from the advantages of Wick 1 and Wick 2. The lower part of Wick 4, which covers half of the heater block surface, meant that the working fluid remained submerged in lower ranges of filling ratio. Meanwhile, the channeled structure of the upper part of Wick 4 assisted in the circulation of fluid vapor, even at higher filling ratios [22,33].
These results underscore the pivotal influence of wick design and material selection on thermal management performance, providing valuable insights into optimizing wick structures for improved heat dissipation and temperature uniformity, particularly for sensitive applications like battery systems.

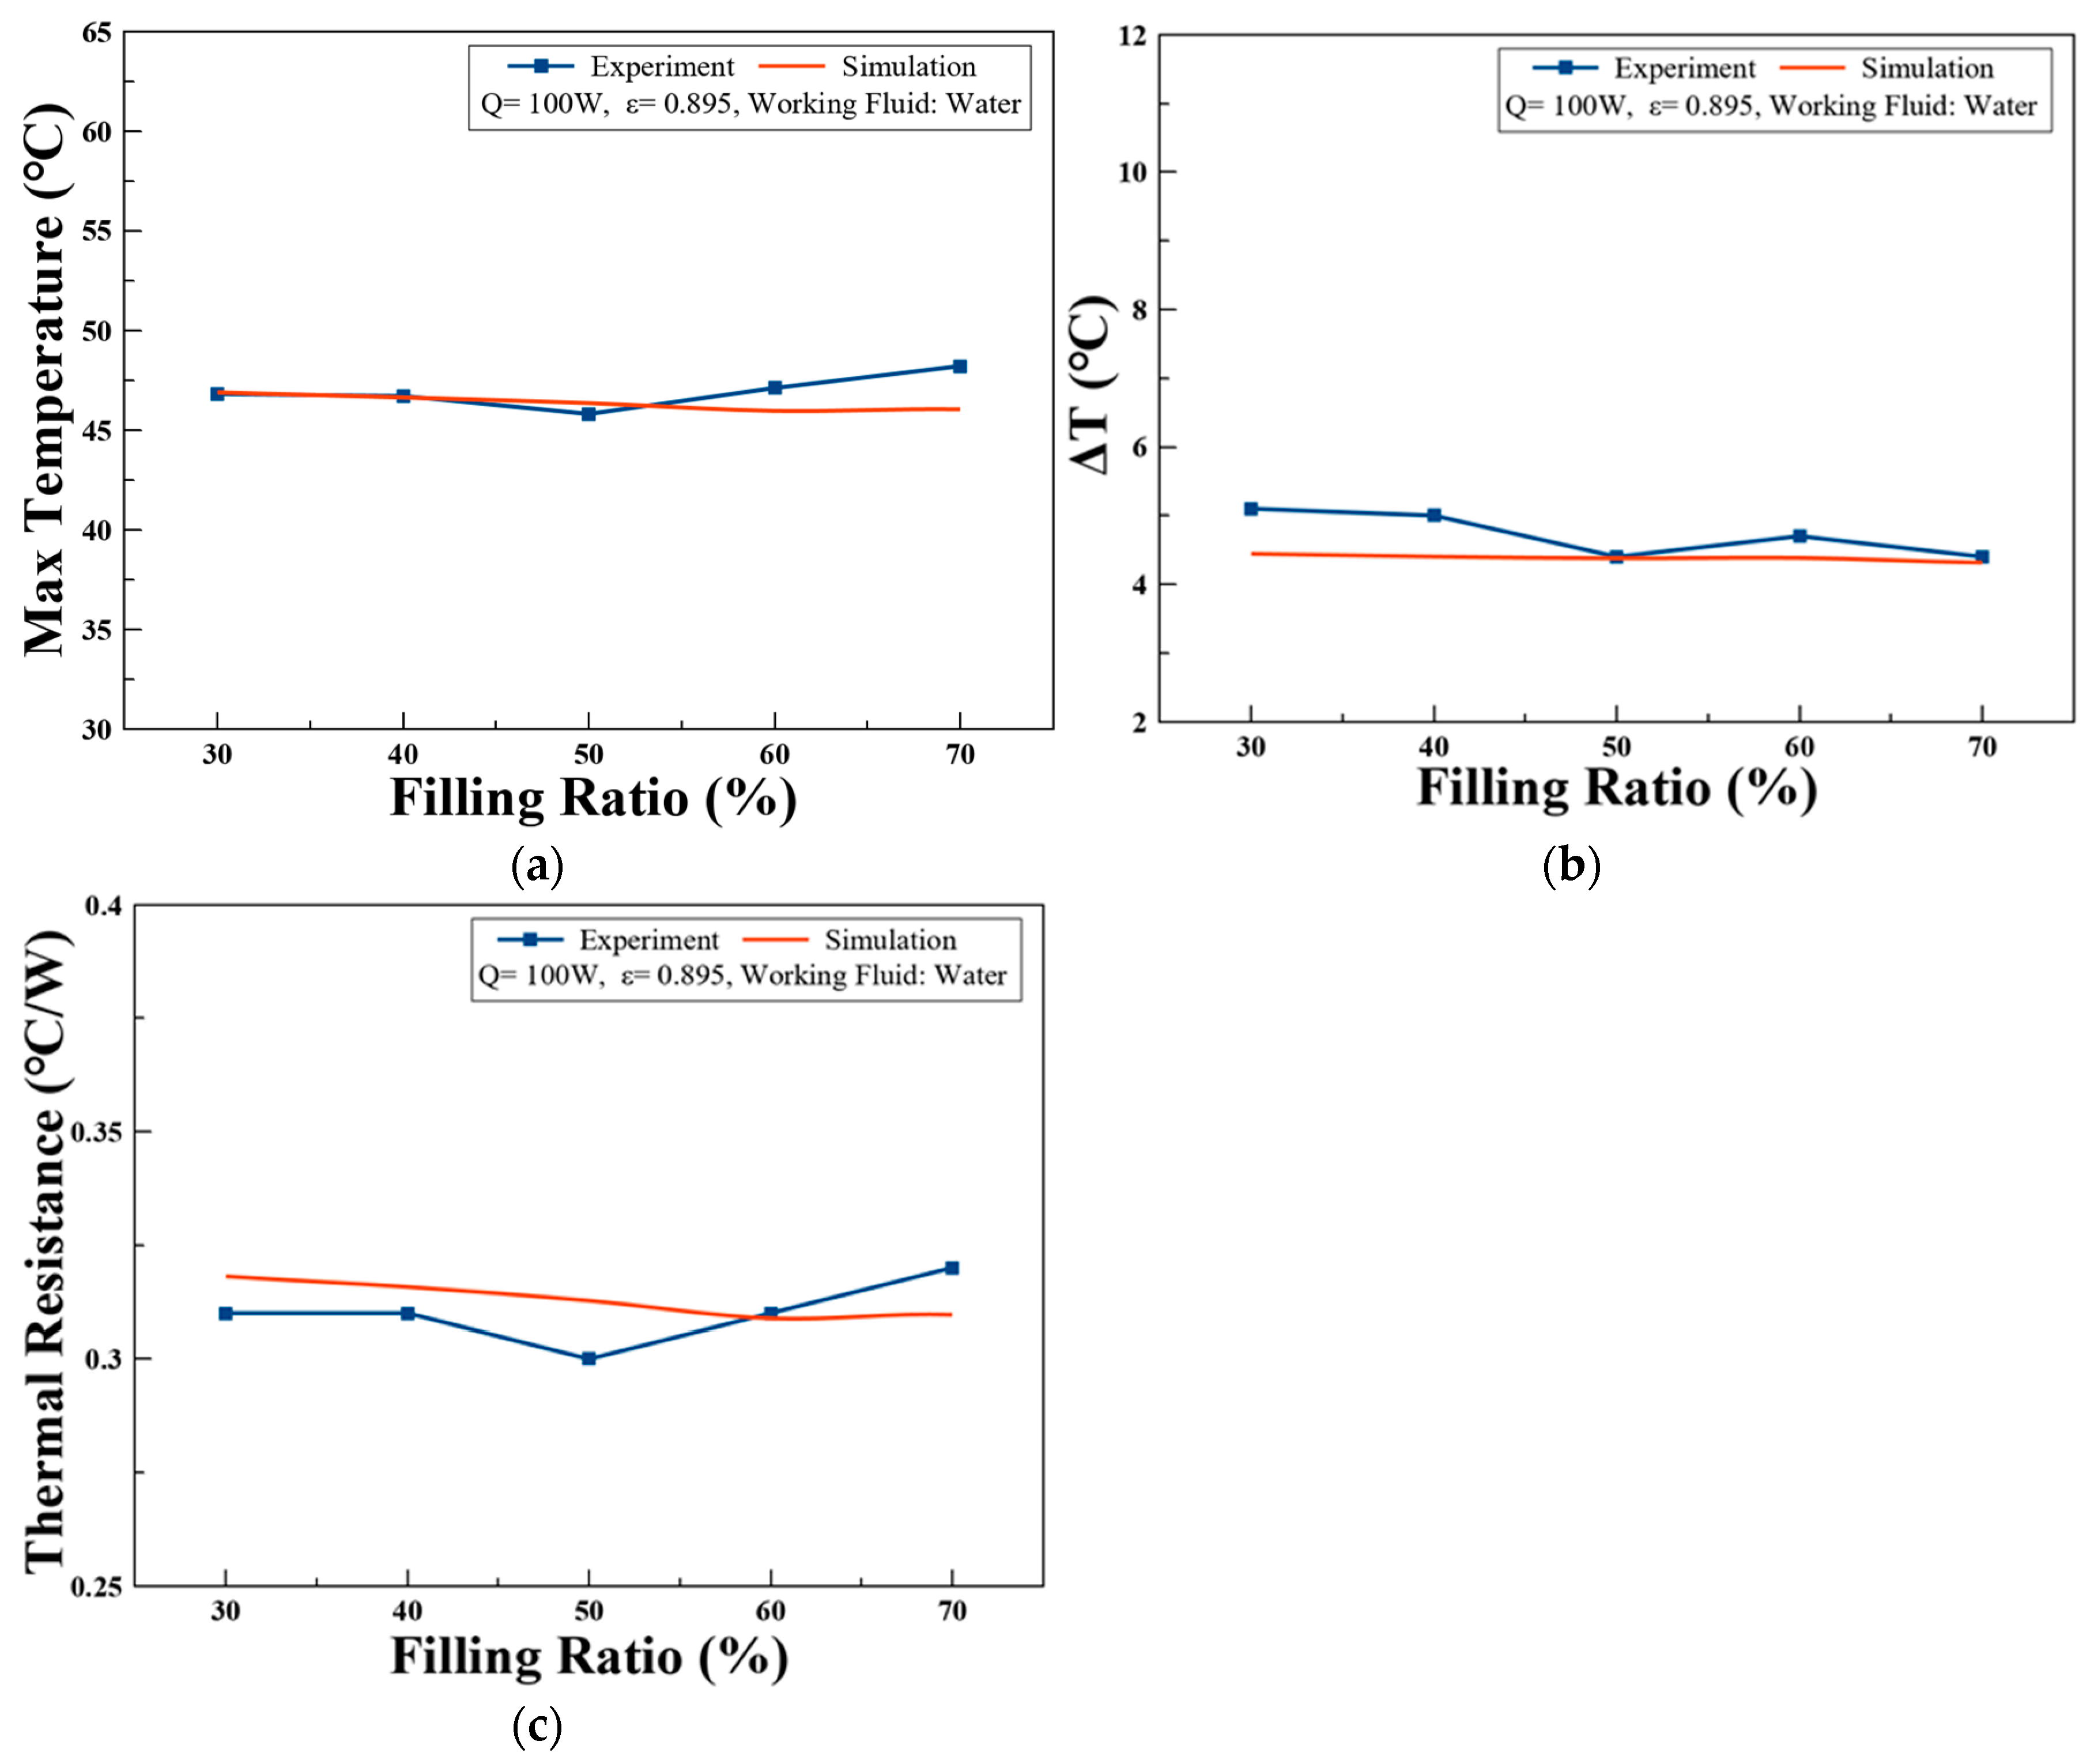
3.3. Simulation Model Validation

Among the experiments, the case with Wick 4 showed the best performance in controlling the maximum temperature and managing the temperature variance at the same time. For the validation of the experimental results, numerical analysis was conducted for Wick 4 to verify its performance.
Figure 10 illustrates the comparison between experimental results and simulation data, showcasing the effectiveness and limitations of numerical modeling for thermal performance analysis. In Figure 10a, the maximum temperature observed in the experiment was 46.8 °C for a 30% FR, 46.7 °C for a 40% FR, and 45.8 °C for a 50% FR, while the corresponding simulation results were 46.9 °C, 46.6 °C, and 46.3 °C, respectively. The differences between experimental and simulated results for the 30–50% FR range were less than 2%, indicating high accuracy and reliability of the simulation model under these conditions. However, at 20% FR, the maximum temperature in the experiment reached 54.7 °C, whereas the simulation predicted 47.1 °C. This discrepancy was attributed to improper wetting of the wick at a 20% FR, leading to biased temperature measurements in the experiment. For higher FR values of 60% and 70%, the divergence between experimental and simulation results became more pronounced, likely due to limitations in the calculation methodology of the AMESim software. Figure 10b,c compare the temperature difference and thermal resistance, respectively, between the experiment and simulation. While the results exhibit considerable alignment, the 20% FR case showed a sudden temperature increase in the experiment, likely caused by pre-absorbed working fluid in the wicks prior to device activation. The simulation results demonstrated a linear trend, consistent with the linear calculation methods employed, whereas experimental results reflected more complex real-world behaviors. Further simulations explored the effects of modifying variables, such as wick porosity and alternative working fluids, which were constrained in the experiments due to physical constraints. These simulations, conducted under ambient conditions (23 °C) and atmospheric pressure as outlined in Table 6, provide additional insights into optimizing wick design and operating conditions for enhanced thermal performance. This comparison highlights the strengths of simulation in capturing trends and testing variable adjustments, while underscoring the importance of accounting for physical and operational nuances in experimental setups.
The porosity was selected from 0.7 to 0.895 to see the tendency of the temperature differences with distilled water as a working fluid. To assess the performance of different types of working fluids, Novec 7100 fluid was assumed to be more appropriate for dielectric working fluid as its boiling temperature (61 °C) is higher than that of Novec 7000 (33.8 °C) and Novec 649 (48.7 °C). Also, it has better thermal conductivity (0.069 W/m·K) than the other two Novec fluids. However, there was no material property data stored in AMESim software for Novec 7100 (3M Novec 7100 Engineered Fluid, 3M, St.Paul, MN, USA). Therefore, dielectric fluids Novec 649 (3M Novec 649 Engineered Fluid, 3M, St.Paul, MN, USA) and Novec 7000 (3M Novec 7000 Engineered Fluid, 3M, St.Paul, MN, USA) were selected as comparable working fluids. The objective of using these fluids was to assess their performance and feasibility as effective coolants for the system as well as the additional function as an extinguisher for electrical fire accidents. Moreover, they were expected to work as insulators against thermal runaway in the battery cells.

3.4. Simulated Predictions with Different Wick Porosities

Figure 11 shows the comparison results by changing the porosity of the wick with distilled water as the working fluid. When 100 W of heat was applied to the heater block, the highest temperature was observed in the case with 0.895 porosity, reaching 47.1 °C at a 20% FR, followed by the next highest temperature with 0.8 porosity at 47.0 °C, while the lowest temperature was recorded in the case with 0.7 porosity, at 46.9 °C.
This trend was consistently maintained from a 20% FR to a 70% FR. However, a distinctive point was observed at a 70% FR, where the porosities of 0.7 and 0.8 produced nearly identical results, while the temperature for 0.895 porosity did not follow the expected slope trend. In Figure 11b,c, when comparing temperature difference and thermal resistance among these three variables, there were barely any differences, with the temperature range remaining below 5 °C and the thermal resistance below 0.325 in all results.

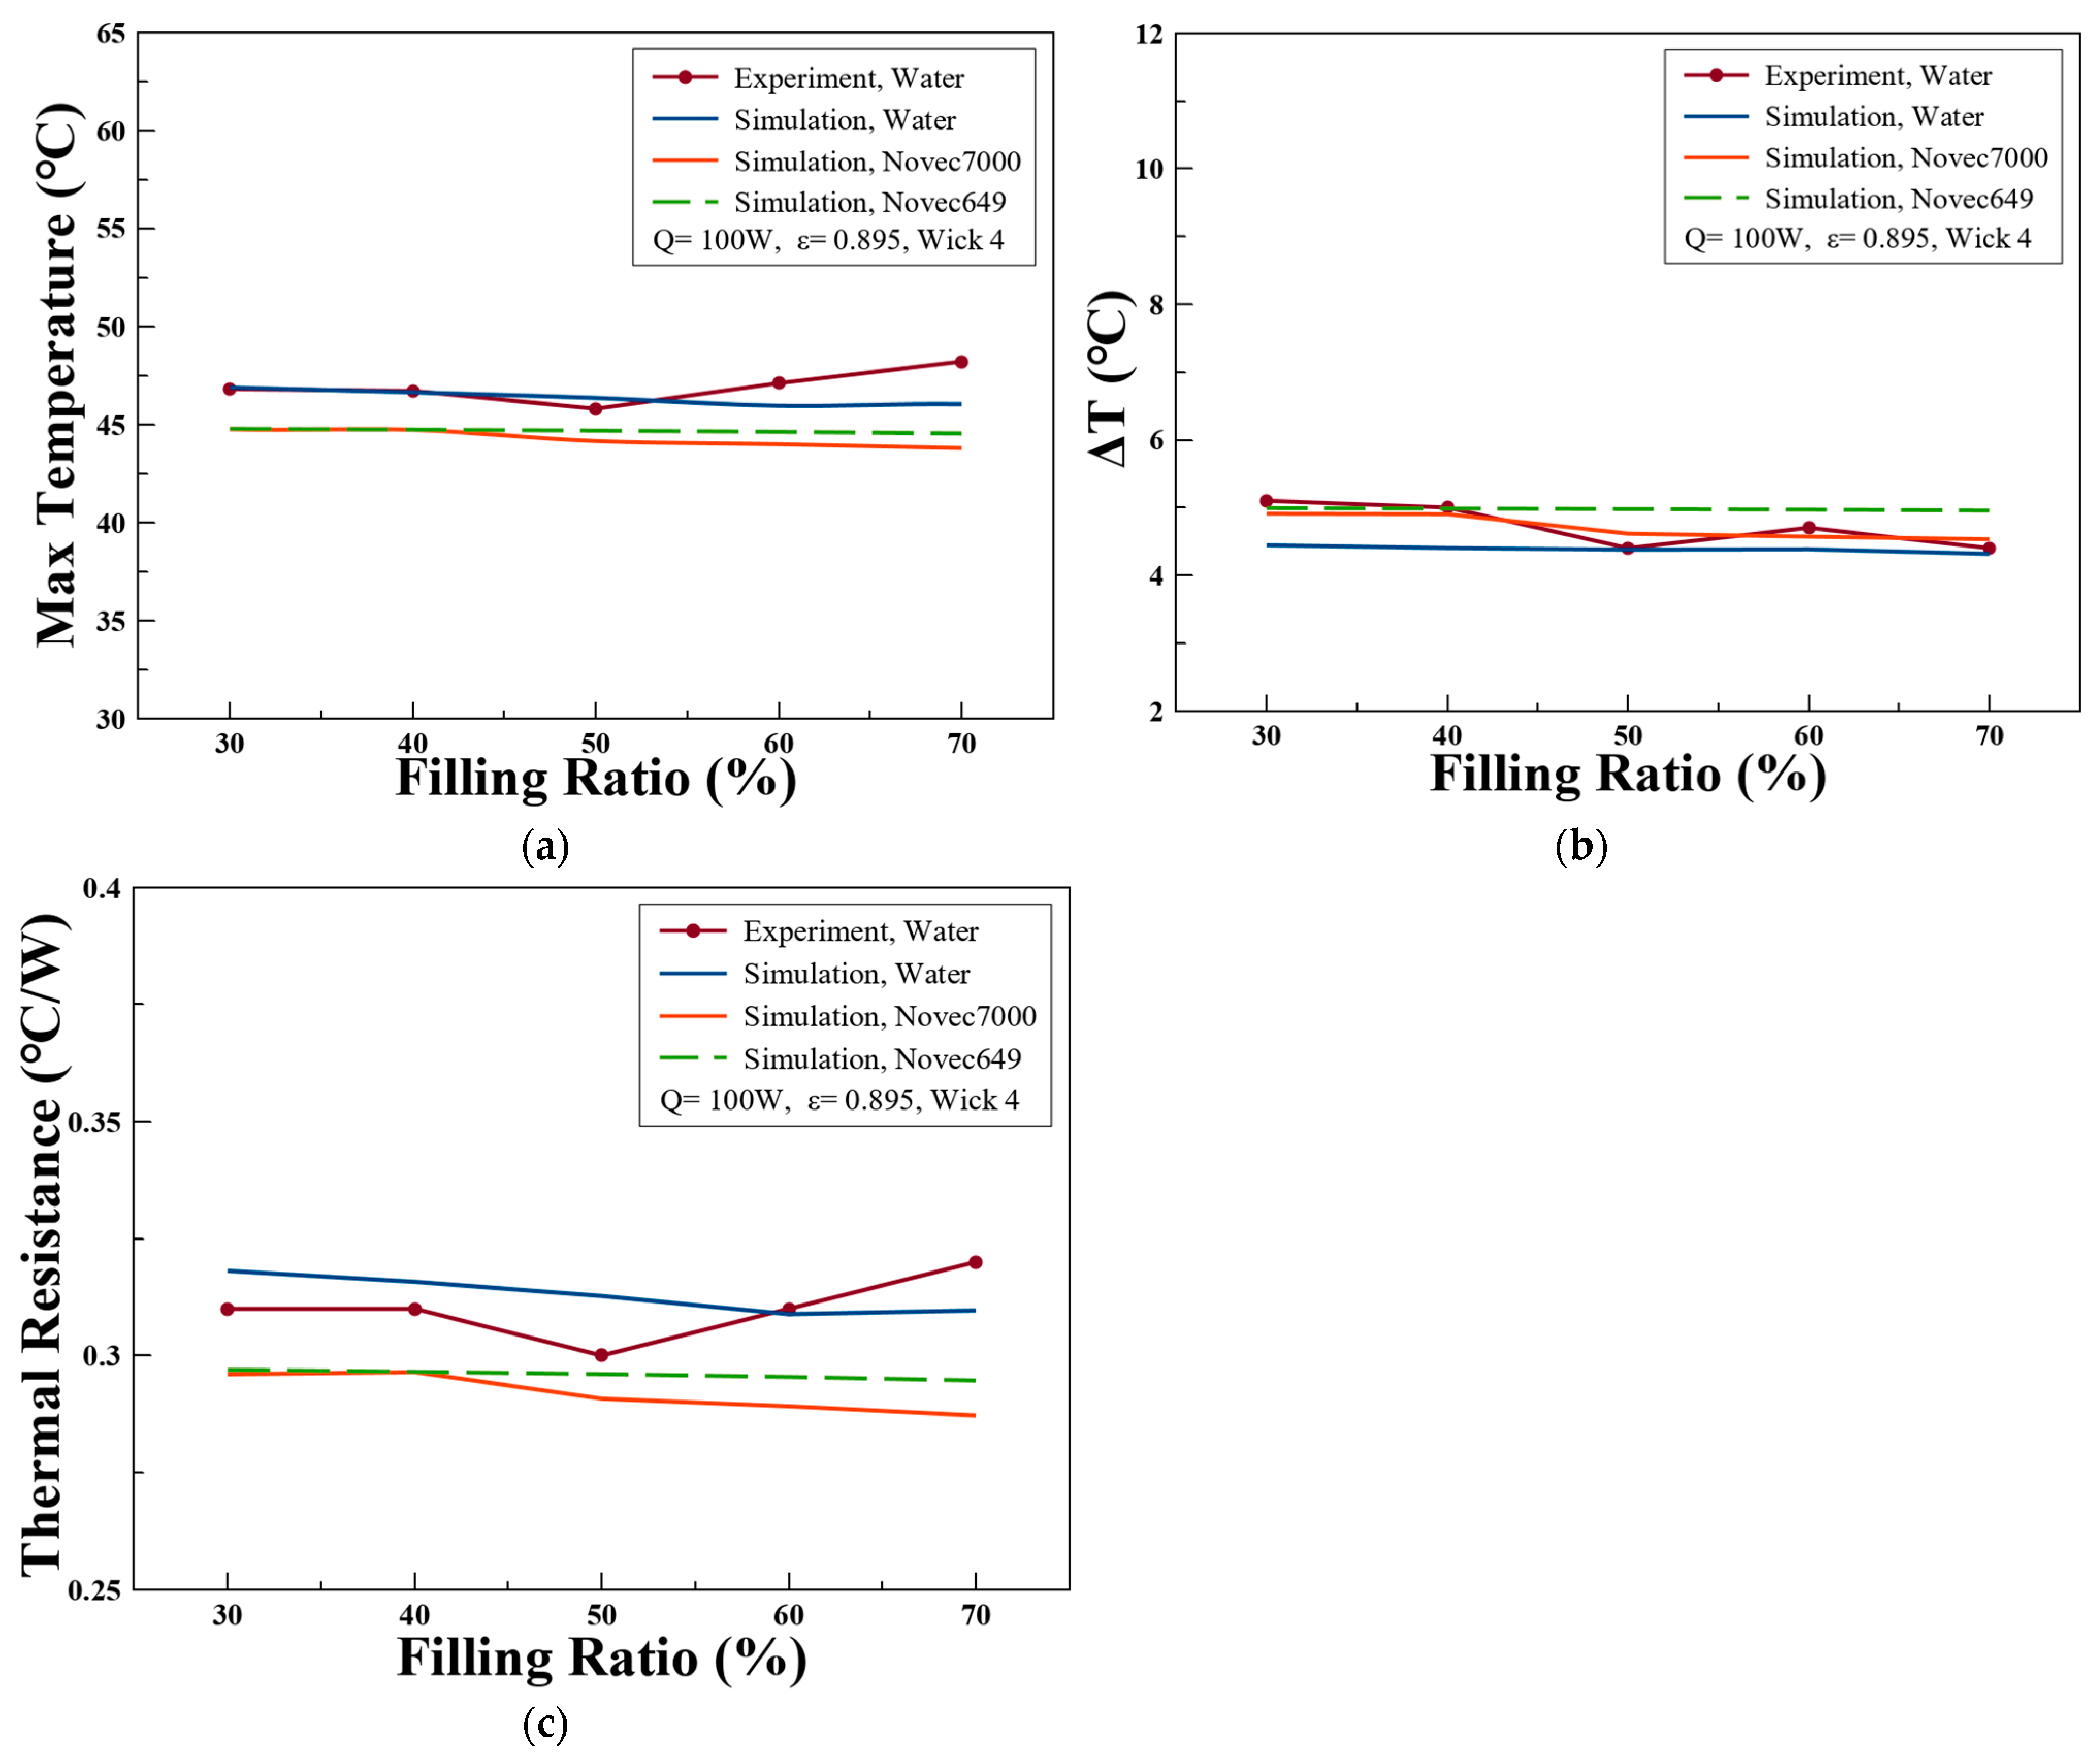
3.5. Simulated Predictions with Different Working Fluids

As depicted in Figure 12a, the highest temperature was observed in the case with distilled water across all ranges of FRs. The material properties of fluids give credibility to the results. The specific heat of water is 4195.0 J/kg·K, which is higher compared to Novec 649 and Novec 7000, which have values of 1121.3 J/kg·K and 1257.8 J/kg·K, respectively.
Figure 12 analyzes the performance differences of various working fluids for the Wick 4 model through simulations. First, as illustrated in Figure 12a, Novec 7000 starts to show a difference compared to Novec 649 from a 50% filling ratio (FR), recording a lower maximum temperature. This can be attributed to Novec 7000’s lower density (1380.104 kg/m3) and boiling point (33.8 °C), which facilitate a smoother evaporation–condensation process as the liquid transitions to vapor. In contrast, Novec 649, with its higher density (1528.2 kg/m3) and boiling point (48.7 °C), shows slightly less efficiency in the phase change process. These results suggest that the properties of Novec 7000 could maximize efficiency under specific heat load conditions. Figure 12b presents the temperature difference (ΔT), showing that the temperature gap of the heat block did not exceed 5 °C in any case. Particularly, Novec 649 and water exhibited stable temperature differences across all filling ratios, whereas Novec 7000 showed a decreasing trend in temperature difference as the filling ratio increased from 50% to 70%. This can be attributed to Novec 7000’s superior evaporation performance, which improves heat transfer efficiency with increasing filling ratios. However, excessive filling at higher ratios might affect fluid circulation, requiring further investigation. Lastly, Figure 12c compares the thermal resistance results. Water exhibited the highest thermal resistance, below 0.325 °C/W, while Novec 7000 recorded the lowest thermal resistance, below 0.3 °C/W. This indicates that Novec 7000 achieves the highest thermal efficiency among the three fluids. Despite water’s theoretical advantages, such as high specific heat, its higher thermal resistance in this experiment could be attributed to differences in evaporation dynamics or interactions with the wick structure. As shown in Figure 12, at filling ratios above 50%, Novec 7000 demonstrated the best thermal performance, while Novec 649 showed potential advantages in higher temperature stability. Also, in Figure 12, the validity of the one-dimensional simulation has already been sufficiently verified through the experimental results presented in Figure 10. The experimental and simulation results for the entire water system show good agreement. However, there is some discrepancy in thermal resistance between the experimental values and the simulation results due to the use of the average temperature of the evaporation section. Nevertheless, it is concluded that a reasonably accurate approximation has been achieved.

4. Conclusions

The present study investigated a novel structure in which battery cells are embedded inside a heat pipe, with the batteries serving as heat sources. Both experimental and simulation-based analyses were conducted to evaluate the thermal management performance of this innovative design. Conclusions are as follows:
-
At a 20% filling ratio with a heat input of 130 W, Wick 4 maintained a maximum temperature of 59.6 °C, demonstrating its capability to manage high thermal loads with minimal working fluid while keeping temperatures below the critical threshold of 60 °C.
-
The optimal thermal performance was observed at a 50% filling ratio, where the maximum temperature was 49.9 °C and the highest recorded temperature difference was 5.8 °C at a 130 W heat input, with all other temperature differences remaining below 5 °C, ensuring conditions favorable for LIB health.
-
As the best performance was observed at a 50% filling ratio, there is an advantage in the weight of the battery pack.
-
The effect of the wick in dissipating heat from the battery is demonstrated by the results, whose performance may vary with the types and shapes of the wicks. Wick 4 showed considerable effectiveness in promoting the heat exchange.
-
A 1-D multiphysics-based simulation model closely aligned with the experimental results for Wick 4, confirming the model’s reliability for further predictive studies.
-
This validation highlights the potential of the simulation model as a robust tool for investigating additional variables such as wick porosity and working fluid types.
-
Extended simulations provided valuable insights into the suitability of dielectric fluids as working fluids for the cooling system.
-
Recommendations for the selection of optimal material properties to enhance thermal performance were also derived from these analyses.
This research successfully demonstrated the feasibility of integrating battery cells into a heat pipe system for effective thermal management. The findings confirm the validity of the 1-D simulation model and its capability for accurate predictions, making it a valuable tool for future design optimizations. Additionally, the hybrid wick design of Wick 4 represents a key advancement in achieving efficient thermal management while minimizing the amount of working fluid required.
Future work could extend this approach by investigating the long-term stability of the system, exploring alternative dielectric fluids, and optimizing wick geometries to improve performance.

Author Contributions

Conceptualization, S.-J.K. and S.-H.R.; data curation, S.-J.K., S.-H.R., and J.-S.L.; formal analysis, S.-J.K.; funding acquisition, S.-H.R.; Investigation, J.-S.L. and S.-J.K.; methodology, J.-S.L. and S.-H.R.; project administration, S.-H.R.; supervision, S.-H.R.; writing, S.-J.K.; writing—review and editing, J.-S.L. and S.-H.R. All authors have read and agreed to the published version of the manuscript.

Funding

This research was supported by Basic Science Research Program through the National Research Foundation of Korea (NRF) funded by the Ministry of Education (Grant number: RS-2022-NR075636).

Data Availability Statement

Data are contained within the article.

Acknowledgments

This work was supported by funding for the academic research program of Chungbuk National University in 2024.

Conflicts of Interest

The authors declare no conflicts of interest.

Abbreviations

Abbreviations
EVElectric Vehicle
TRThermal Runaway
LIBLi-ion Battery
SOCState of Charge
DLCDirect Liquid Cooling
CPCMComposite Phase Change Material
TCThermocouple
FRFilling Ratio
SLSaturation Level
BMSBattery Management System
SEISolid Electrolyte Interphase
LFPLithium Iron Phosphate
NMCNickel Manganese Cobalt
XPSExtruded Polystyrene
STRSystem Thermal Resistance
AMESimAdvanced Modeling Environment for Simulation
Nomenclature
VtInternal total volume of device, m3
VfVolume of fluid, m3
R t h Thermal resistance, W/m2
TStatic temperature, °C
QTotal heat generation of the battery, W
VVoltage, V
ICurrent, A
URUncertainty in thermal resistance, °C/W
UTUncertainty in thermocouple, °C
UQUncertainty in heat input, W
SSaturation level
VfluidVolume of fluid injected, m3
VWick SaturatedVolume of fluid that wick can absorb, m3
mfluidMass of working fluid, kg
mcompensationMass of fluid compensation, kg
kThermal conductivity, W/m·K
CpSpecific heat capacity, J/kg·K
xQuality
hConvective heat transfer coefficient, W/m2·K
AArea, m2
fFriction coefficient
m ˙ Mass flow rate, kg/s
NuNusselt number, dimensionless
PrPrandtl number, dimensionless
RaRayleigh number, dimensionless
ReReynolds number, dimensionless
GrGrashof number, dimensionless
LcCharacteristic length, m
VsAverage flow velocity, m/s
hvSpecific enthalpy of vapor, J/kg
hlSpecific enthalpy of liquid, J/kg
gGravitational acceleration, m/s2
lvLatent heat of fluid, J/kg
PStatic pressure, N/m2
FCorrection factor, dimensionless
Greek
ε Porosity
ρ wick Density of wick, kg/m3
ρ cellulose Density of cellulose material, kg/m3
ρ liquid Density of working fluid, kg/m3
ρ l Density of liquid phase, kg/m3
ρ s Density of solid, kg/m3
α Thermal expansion
μ Dynamic viscosity, kg/m·s
lLiquid
vVapor
Subscripts
HPHeat pipe
eEvaporator
cCondenser
effEffective
sSolid
lLiquid
LOLiquid only
VOVapor only
NcBNucleate boiling
AmbAmbient
WallWall
SurfSurface
RedReduced
TPTwo-phase

Appendix A

Library Components Used in the Simulation Model

Batteries 11 00164 g0a1

References

  1. Dalkic-Melek, G.; Saltik, E.C.; Tuydes-Yaman, H. Electric Vehicle (EV) Market Penetration in Countries with Rising Motorization Rates. Int. J. Civ. Eng. 2025, 23, 461–480. [Google Scholar] [CrossRef]
  2. Ma, J.; Gong, Y.; Xu, W. Predicting User Preference for Innovative Features in Intelligent Connected Vehicles from a Cultural Perspective. World Electr. Veh. J. 2024, 15, 130. [Google Scholar] [CrossRef]
  3. Faizal, M.; Feng, S.Y.; Zureel, M.F.; Sinidol, B.E.; Wong, D.; Jian, G.K. A review on challenges and opportunities of electric vehicles (EVS). J. Mech. Eng. Res. Dev. 2019, 42, 130–137. [Google Scholar] [CrossRef]
  4. Funke, S.Á.; Sprei, F.; Gnann, T.; Plötz, P. How Much Charging Infrastructure Do Electric Vehicles Need? A Review of the Evidence and International Comparison. Transp. Res. Part Transp. Environ. 2019, 77, 224–242. [Google Scholar] [CrossRef]
  5. BYD Blade Battery|BYD Europe. Available online: https://www.byd.com/eu/technology/byd-blade-battery (accessed on 22 January 2025).
  6. Brand, M.; Gläser, S.; Geder, J.; Menacher, S.; Obpacher, S.; Jossen, A.; Quinger, D. Electrical Safety of Commercial Li-Ion Cells Based on NMC and NCA Technology Compared to LFP Technology. World Electr. Veh. J. 2013, 6, 572–580. [Google Scholar] [CrossRef]
  7. Sang, V.T.D.; Duong, Q.H.; Zhou, L.; Arranz, C.F.A. Electric Vehicle Battery Technologies and Capacity Prediction: A Comprehensive Literature Review of Trends and Influencing Factors. Batteries 2024, 10, 451. [Google Scholar] [CrossRef]
  8. Buidin, T.I.C.; Mariasiu, F. Battery Thermal Management Systems: Current Status and Design Approach of Cooling Technologies. Energies 2021, 14, 4879. [Google Scholar] [CrossRef]
  9. Wang, C.; Zhang, G.; Meng, L.; Li, X.; Situ, W.; Lv, Y.; Rao, M. Liquid Cooling Based on Thermal Silica Plate for Battery Thermal Management System. Int. J. Energy Res. 2017, 41, 2468–2479. [Google Scholar] [CrossRef]
  10. Li, A.; Weng, J.; Yuen, A.C.Y.; Wang, W.; Liu, H.; Lee, E.W.M.; Wang, J.; Kook, S.; Yeoh, G.H. Machine Learning Assisted Advanced Battery Thermal Management System: A State-of-the-Art Review. J. Energy Storage 2023, 60, 106688. [Google Scholar] [CrossRef]
  11. Shi, Y.; Ahmad, S.; Liu, H.; Lau, K.T.; Zhao, J. Optimization of Air-Cooling Technology for LiFePO4 Battery Pack Based on Deep Learning. J. Power Sources 2021, 497, 229894. [Google Scholar] [CrossRef]
  12. E, J.; Han, D.; Qiu, A.; Zhu, H.; Deng, Y.; Chen, J.; Zhao, X.; Zuo, W.; Wang, H.; Chen, J.; et al. Orthogonal Experimental Design of Liquid-Cooling Structure on the Cooling Effect of a Liquid-Cooled Battery Thermal Management System. Appl. Therm. Eng. 2018, 132, 508–520. [Google Scholar] [CrossRef]
  13. Mousavi, S.; Zadehkabir, A.; Siavashi, M.; Yang, X. An Improved Hybrid Thermal Management System for Prismatic Li-Ion Batteries Integrated with Mini-Channel and Phase Change Materials. Appl. Energy 2023, 334, 120643. [Google Scholar] [CrossRef]
  14. Zhang, Z.; Zhao, R.; Zhao, S.; Zou, H.; Liu, Z.; Luo, X.; Liu, W. Performance Characteristics of a Two-Phase Pump-Assisted Loop Heat Pipe with Dual-Evaporators in Parallel. Therm. Sci. Eng. Prog. 2023, 38, 101657. [Google Scholar] [CrossRef]
  15. Lander, L.; Kallitsis, E.; Hales, A.; Edge, J.S.; Korre, A.; Offer, G. Cost and Carbon Footprint Reduction of Electric Vehicle Lithium-Ion Batteries through Efficient Thermal Management. Appl. Energy 2021, 289, 116737. [Google Scholar] [CrossRef]
  16. Chi, R.-G.; Chung, W.-S.; Rhi, S.-H. Thermal Characteristics of an Oscillating Heat Pipe Cooling System for Electric Vehicle Li-Ion Batteries. Energies 2018, 11, 655. [Google Scholar] [CrossRef]
  17. Chi, R.-G.; Rhi, S.-H. Oscillating Heat Pipe Cooling System of Electric Vehicle’s Li-Ion Batteries with Direct Contact Bottom Cooling Mode. Energies 2019, 12, 1698. [Google Scholar] [CrossRef]
  18. Wu, X.; Du, J.; Guo, H.; Qi, M.; Hu, F.; Shchurov, N.I. Boundary Conditions for Onboard Thermal-Management System of a Battery Pack under Ultrafast Charging. Energy 2022, 243, 123075. [Google Scholar] [CrossRef]
  19. Giammichele, L.; D’Alessandro, V.; Ricci, R.; Falone, M. Experimental Study of a Direct Immersion Liquid Cooling of a Li-Ion Battery for Electric Vehicles Applications. Int. J. Heat Technol. 2022, 40, 1–8. [Google Scholar] [CrossRef]
  20. Tan, X.; Lyu, P.; Fan, Y.; Rao, J.; Ouyang, K. Numerical investigation of the direct liquid cooling of a fast-charging lithium-ion battery pack in hydrofluoroether. Appl. Therm. Eng. 2021, 196, 117279. [Google Scholar] [CrossRef]
  21. Sun, P.; Bisschop, R.; Niu, H.; Huang, X. A Review of Battery Fires in Electric Vehicles. Fire Technol. 2020, 56, 1361–1410. [Google Scholar] [CrossRef]
  22. Chi, S.W. Heat Pipe Theory and Practice: A Sourcebook; McGraw-Hill Inc.: New York, NY, USA, 1976. [Google Scholar]
  23. Nishikawara, M.; Nagano, H. Optimization of Wick Shape in a Loop Heat Pipe for High Heat Transfer. Int. J. Heat Mass Transf. 2017, 104, 1083–1089. [Google Scholar] [CrossRef]
  24. Smith, J.; Singh, R.; Hinterberger, M.; Mochizuki, M. Battery Thermal Management System for Electric Vehicle Using Heat Pipes. Int. J. Therm. Sci. 2018, 134, 517–529. [Google Scholar] [CrossRef]
  25. Rao, Z. Experimental Investigation on Thermal Management of Electric Vehicle Battery with Heat Pipe. Energy Convers. Manag. 2013, 65, 92–97. [Google Scholar] [CrossRef]
  26. Burkitbayev, A.; Weragoda, D.M.; Ciampa, F.; Lo, K.H.; Tian, G. A Numerical and Experimental Investigation on a Gravity-Assisted Heat-Pipe-Based Battery Thermal Management System for a Cylindrical Battery. Batteries 2023, 9, 456. [Google Scholar] [CrossRef]
  27. Oh, I.-T.; Lee, J.-S.; Han, J.-S.; Lee, S.-W.; Kim, S.-J.; Rhi, S.-H. Li-Ion Battery Immersed Heat Pipe Cooling Technology for Electric Vehicles. Electronics 2023, 12, 4931. [Google Scholar] [CrossRef]
  28. Uetani, K.; Hatori, K. Thermal Conductivity Analysis and Applications of Nanocellulose Materials. Sci. Technol. Adv. Mater. 2017, 18, 877–892. [Google Scholar] [CrossRef]
  29. Mun, S.Y.; Lim, H.M.; Lee, D.J. Preparation and Thermal Properties of Polyacrylonitrile-Based Carbon Fiber–Silicon Carbide Core–Shell Hybrid. Thermochim. Acta 2015, 600, 62–66. [Google Scholar] [CrossRef]
  30. Flame retardant non-woven fabric NT PREOX 200. Available online: https://texfire.net/en/flame-retardant-fabrics/flame-retardant-nonwoven-fabric/non-woven-flame-retardant-nt-preox-200.html (accessed on 4 February 2025).
  31. Qi, C.; Hou, S.; Lu, J.; Xue, W.; Sun, K. Thermal Characteristics of Birch and Its Cellulose and Hemicelluloses Isolated by Alkaline Solution. Holzforschung 2020, 74, 1099–1112. [Google Scholar] [CrossRef]
  32. Abdulshaheed, A.A.; Wang, P.; Huang, G.; Zhao, Y.; Li, C. Filling Ratio Optimization for High-Performance Nanoengineered Copper-Water Heat Pipes. J. Therm. Sci. Eng. Appl. 2021, 13, 1–28. [Google Scholar] [CrossRef]
  33. Reay, D.; Kew, P.; Mcglen, R. Heat Pipes: Theory, Design and Applications, 6th ed.; Butterworth-Heinemann: Oxford, UK, 2013; pp. 1–251. [Google Scholar]
  34. Lee, J.-S.; Kim, S.-J.; Han, W.-S.; Rhi, S.-H. Anti-Gravity 3D Pulsating Heat Pipe for Cooling Electric Vehicle Batteries. Energies 2024, 17, 2283. [Google Scholar] [CrossRef]
  35. Ha, J.; Kim, J.; Jung, Y.; Yun, G.; Kim, D.-N.; Kim, H.-Y. Poro-Elasto-Capillary Wicking of Cellulose Sponges. Sci. Adv. 2018, 4, eaao7051. [Google Scholar] [CrossRef] [PubMed]
  36. Antlauf, M.; Boulanger, N.; Berglund, L.; Oksman, K.; Andersson, O. Thermal Conductivity of Cellulose Fibers in Different Size Scales and Densities. Biomacromolecules 2021, 22, 3800–3809. [Google Scholar] [CrossRef]
  37. Kantzas, A.; Bryan, J.; Taheri, S. Fundamentals of Fluid Flow in Porous Media; Special Core Analysis (SCAL) & Enhanced Oil Recovery (EOR) Laboratory: Calgary, AB, Canada, 2012. [Google Scholar]
  38. Siemens. Simcenter AMESim User Manual, SIMATIC Motion Control Library; Siemens: Munich, Germany, 2023; Available online: https://www.hmkdirect.com/downloads/simatic_-_all_about_motion_control_-_guide.pdf (accessed on 31 January 2025).
  39. Kapekov, A. Development of an Innovative Cooling Concept for Turbofan Engines. Master’s Thesis, KTH School of Industrial Engineering and Management, Stockholm, Switzerland, 2018. [Google Scholar]
  40. Holman, J.P. Heat Transfer, 10th ed.; McGraw-Hill Education: New York, NY, USA, 2010; ISBN 978-0-07-352936-3. [Google Scholar]
  41. Bibin, C.; Vijayaram, M.; Suriya, V.; Sai Ganesh, R.; Soundarraj, S. A Review on Thermal Issues in Li-Ion Battery and Recent Advancements in Battery Thermal Management System. Mater. Today Proc. 2020, 33, 116–128. [Google Scholar] [CrossRef]
  42. Kong, L.; Li, Y.; Feng, W. Strategies to Solve Lithium Battery Thermal Runaway: From Mechanism to Modification. Electrochem. Energy Rev. 2021, 4, 633–679. [Google Scholar] [CrossRef]
  43. Troxler, Y.; Wu, B.; Marinescu, M.; Yufit, V.; Patel, Y.; Marquis, A.J.; Brandon, N.P.; Offer, G.J. The Effect of Thermal Gradients on the Performance of Lithium-Ion Batteries. J. Power Sources 2014, 247, 1018–1025. [Google Scholar] [CrossRef]
  44. Galatro, D.; Al-Zareer, M. Thermal behavior of lithium-ion batteries: Aging, heat generation, thermal management and failure. Front. Heat Mass Transf. 2020, 14, 1–18. [Google Scholar] [CrossRef]
  45. Chen, J.-S.; Chou, J.-H. Cooling Performance of Flat Plate Heat Pipes with Different Liquid Filling Ratios. Int. J. Heat Mass Transf. 2014, 77, 874–882. [Google Scholar] [CrossRef]
  46. Lips, S.; Lefèvre, F.; Bonjour, J. Combined Effects of the Filling Ratio and the Vapour Space Thickness on the Performance of a Flat Plate Heat Pipe. Int. J. Heat Mass Transf. 2010, 53, 694–702. [Google Scholar] [CrossRef]
  47. Borkar, R.S.; Pachghare, P.R. Effect of working fluid, filling ratio and number of turns on pulsating heat pipe thermal performance. Front. Heat Pipes 2015, 6, 1–4. [Google Scholar] [CrossRef]
  48. Hwang, G.S.; Kaviany, M.; Anderson, W.G.; Zuo, J. Modulated Wick Heat Pipe. Int. J. Heat Mass Transf. 2007, 50, 1420–1434. [Google Scholar] [CrossRef]
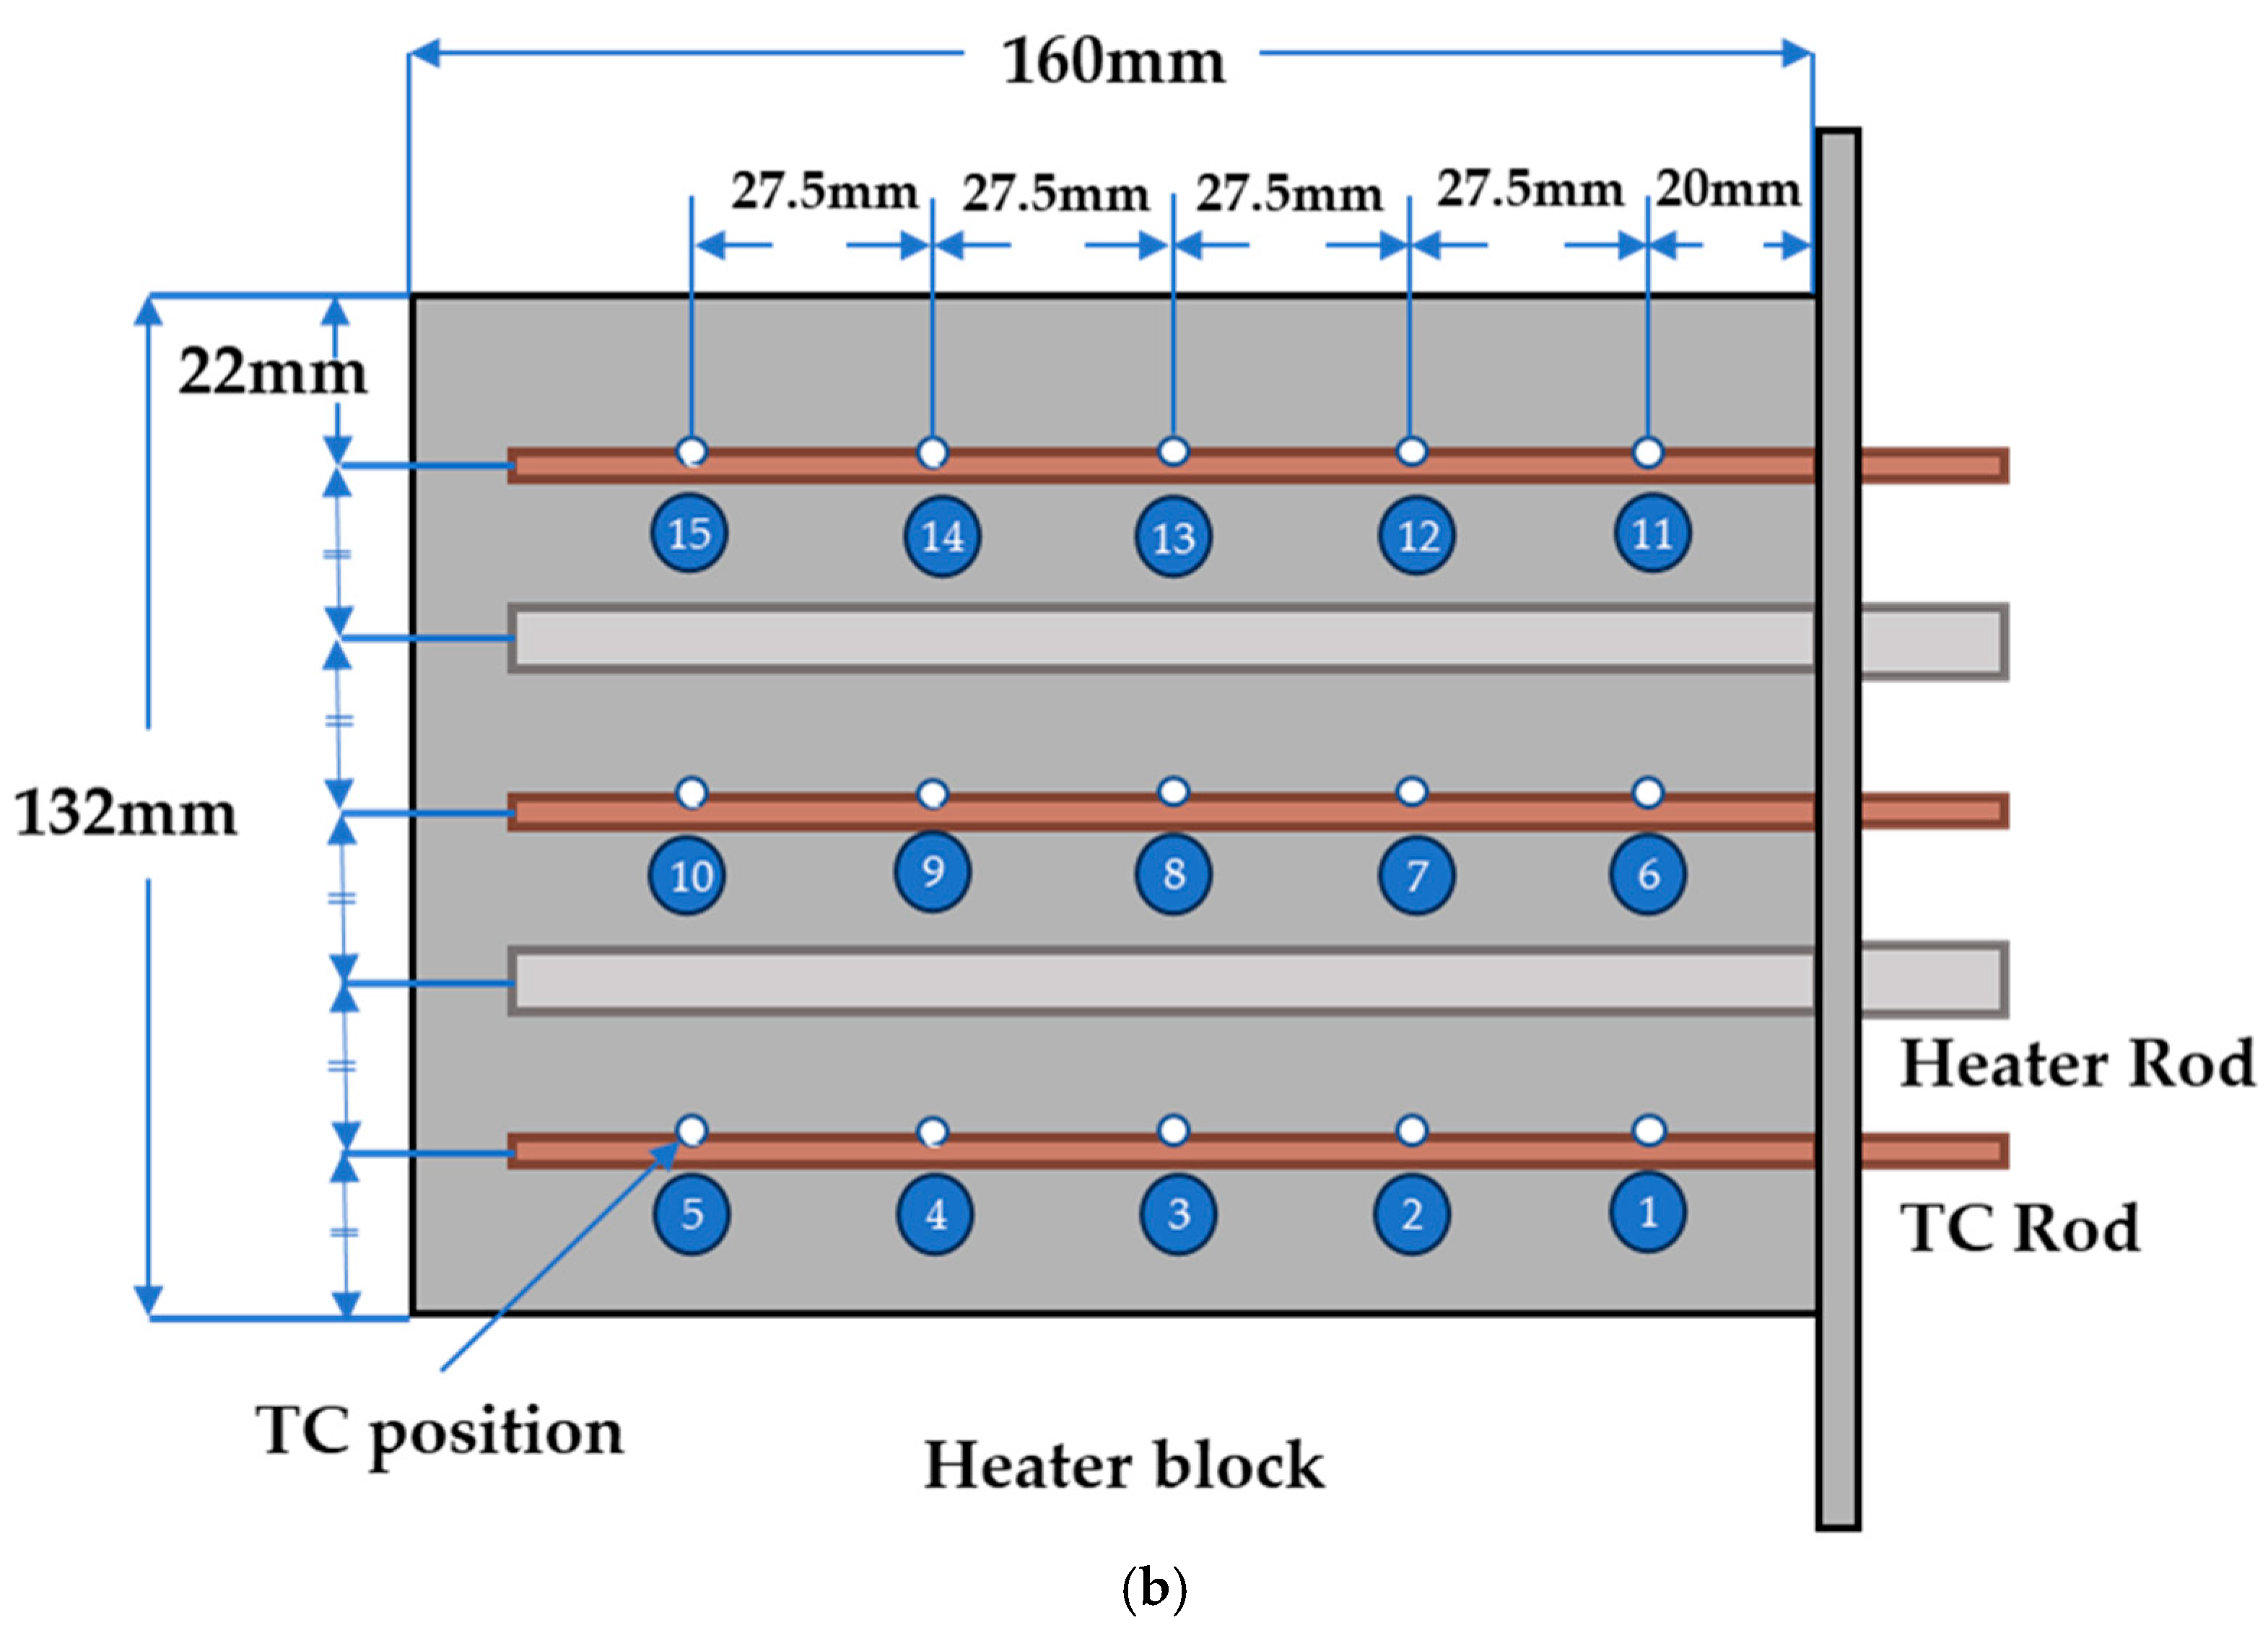
Figure 1. Working mechanism of Heat pipe.
Batteries 11 00164 g001
Figure 2. The working mechanism of the heat source integrated module (a) Application concept of the integrated system (b) Working mechanism explanation of concept module (c) Thermal network system of the concept module.
Batteries 11 00164 g002
Figure 3. Illustration of the experimental device.
Batteries 11 00164 g003
Figure 4. Scanning Electron Microscope (SEM) image (a) Cellulose wick material. (b) Flame Retardant Non-Woven Fabric.
Batteries 11 00164 g004
Figure 5. Overall System Setup. (a) Schematics of experiment setup, (b) Exact position of Thermocouples (TCs) in heater block.
Batteries 11 00164 g005aBatteries 11 00164 g005b
Figure 6. The overall system of 1-D simulation model.
Batteries 11 00164 g006
Figure 7. Specified model of heater block incorporated with wick structure.
Batteries 11 00164 g007
Figure 8. Max Temperature by types of wicks, (a) Max Temperature of Wickless, (b) Max Temperature of Wick 1, (c) Max Temperature of Wick 2, (d) Max Temperature of Wick 3, (e) Max Temperature of Wick 4, (f) Internal Temperature of Wick 4, 50% FR, (g) Thermal Resistance comparison of Wick 4 with other cooling method models [16,17,24,25,34].
Batteries 11 00164 g008aBatteries 11 00164 g008b
Figure 9. Temperature differences by the types of wicks. (a) Temperature difference of Wickless, (b) Result of Wick 1, (c) Result of Wick 2, (d) Result of Wick 3, (e) Result of Wick 4.
Batteries 11 00164 g009
Figure 10. Comparison between Experiment and Simulation for Wick 4. (a) Max Temperature Comparison, (b) Temperature difference Comparison, (c) Thermal Resistance Comparison.
Batteries 11 00164 g010
Figure 11. Simulation results with various wick porosities (Wick 4). (a) Max Temperature Comparison, (b) Temperature difference Comparison, (c) Thermal Resistance Comparison.
Batteries 11 00164 g011
Figure 12. Comparison between simulation and experiment with different working fluids, Wick 4. (a) Max Temperature Comparison, (b) Temperature difference Comparison, (c) Thermal Resistance Comparison.
Batteries 11 00164 g012
Table 1. Dimensions of the experimental device.
Unit (mm)CaseHeater Block
Length200160
Width2115
Height134132
Table 2. Material properties of experiment device.
MaterialDensity
[kg/m3]
Thermal Conductivity
[W/m·K]
Specific Heat
[J/kg·K]
SUS 304800016.3530
Cellulose Fiber15000.571209
Pre-carbonized Polyacrylonitrile
(PAN-CF)
11680.2161341
Table 3. Filling Ratio of the working fluid in the experiment device.
Filling Ratio [%]Mass of Working Fluid [kg]Saturation Level
[S]
200.0320.311
300.0490.467
400.0650.622
500.0820.778
600.0980.933
700.11491
Table 4. Variables of Effective Equations.
VariablesValues
ε0.895
ks0.57
kl0.6
ρ s [kg/m3]1500
ρ l [kg/m3]980.62
Cp,s [J/kg·K]1209
Cp,l [J/kg·K]4195.03
Table 5. Initial conditions of the experiment.
CategoryCondition
Material of heater blockSUS 304
Material of wickCellulose fiber
Working fluidDistilled water
Coolant fluidWater
Initial temperature of heater block (°C)22
Temperature of coolant (°C)15.4
Mass flow rate of coolant (L/min)0.9
Thickness of wick (mm)3
Porosity (%)0.895
Heat input (W)30–130 with interval in 10 W
Table 6. Operating conditions for the Numerical simulation.
VariablesDistilled WaterNovec 649Novec 7000
Porosity (ε)0.7, 0.8, 0.8950.8950.895
Thermal conductivity of cellulose
(ks) [W/m·K]
0.570.570.57
Thermal conductivity of working fluid (kl) [W/m·K]0.60.0540.063
Density   of   cellulose   ( ρ s) [kg/m3]150015001500
Density   of   working   fluid   ( ρ l) [kg/m3]980.61528.21380.1
Specific Heat of cellulose (Cp,s)
[J/kg·K]
120912091209
Specific Heat of working fluid
Cp,l [J/kg·K]
4195.01121.31257.8
Disclaimer/Publisher’s Note: The statements, opinions and data contained in all publications are solely those of the individual author(s) and contributor(s) and not of MDPI and/or the editor(s). MDPI and/or the editor(s) disclaim responsibility for any injury to people or property resulting from any ideas, methods, instructions or products referred to in the content.

