Article

A Pathway to Circular Economy-Converting Li-Ion Battery Recycling Waste into Graphite/rGO Composite Electrocatalysts for Zinc–Air Batteries

1
National Institute of Chemical Physics and Biophysics, Akadeemia tee 23, 12618 Tallinn, Estonia
2
Department of Applied Physics, School of Science, Aalto University, P.O. Box 15100, 00076 Aalto, Finland
3
Department of Chemistry and Materials Science (CMAT), School of Chemical Engineering, Aalto University, P.O. Box 16100, 00076 Aalto, Finland
4
Department of Chemical and Metallurgical Engineering (CMET), School of Chemical Engineering, Aalto University, P.O. Box 16200, 00076 Aalto, Finland
*
Author to whom correspondence should be addressed.
Batteries 2025, 11(4), 165; https://doi.org/10.3390/batteries11040165
Submission received: 26 March 2025 / Revised: 17 April 2025 / Accepted: 19 April 2025 / Published: 21 April 2025
(This article belongs to the Special Issue Two-Dimensional Materials for Battery Applications)

Abstract

:
Li-ion batteries (LIBs) are one of the most deployed energy storage technologies worldwide, providing power for a wide range of applications—from portable electronic devices to electric vehicles (EVs). The growing demand for LIBs, coupled with a shortage of critical battery materials, has prompted the scientific community to seek ways to improve material utilization through the recycling of end-of-life LIBs. While valuable battery metals are already being recycled on an industrial scale, graphite—a material classified as a critical resource—continues to be discarded. In this study, graphite waste recovered from the recycling of LIBs was successfully upcycled into an active graphite/rGO (reduced graphene oxide) composite oxygen electrocatalyst. The precursor graphite for rGO synthesis was also extracted from LIBs. Incorporating rGO into the graphite significantly enhanced the specific surface area and porosity of the resulting composite, facilitating effective doping with residual metals during subsequent nitrogen doping via pyrolysis. These composite catalysts enhanced both the oxygen reduction and oxygen evolution reactions, enabling their use as air electrode catalyst materials in zinc–air batteries (ZABs). The best-performing composite catalyst demonstrated an impressive power density of 100 mW cm−2 and exceptional cycling stability for 137 h. This research further demonstrates the utilization of waste fractions from LIB recycling to drive advancements in energy conversion technologies.

Graphical Abstract

1. Introduction

Geopolitical factors, including wars, supply chain disruptions, and policy shifts, have intensified global energy insecurity in the years following the COVID-19 pandemic. This has underscored the urgent need for sustainable energy solutions, drawing heightened attention from the scientific community. One significant advancement is the rapid increase in the production and use of lithium-ion batteries (LIBs), which serve as the primary power source for portable electronic devices and electric vehicles (EVs). Until recently, the LIB market has experienced exponential growth; however, the rate of increase has recently begun to slow [1]. LIBs are composed of various components, including graphite as the anode active material; layered transition metal oxides (e.g., LiCoO2, LiMn2O4, LiNiMnCoO2, LiNiCoAlO2) or LiFePO4 as cathode active materials; aluminium and copper as current collectors; a polymer-based separator; and a lithium salt dissolved in an organic solvent as the electrolyte [2,3,4]. Therefore, the production of LIBs relies on critical and strategic raw materials such as Co, Li, Ni, Mn, Cu, and graphite [5,6]. Nevertheless, the supply growth of these essential resources has not kept pace with the surge in demand for new batteries, leading to potential shortages of these critical raw materials (CRMs) [7]. To address the shortage of CRMs and mitigate the environmental impact of mining new resources, the recycling and reuse of materials from end-of-life LIBs is essential. In 2023, global material recovery from LIB recycling reached 2100 kt, with approximately 80% of this capacity concentrated in China, while Europe and the USA each accounted for only about 4%. Under the Announced Pledges Scenario, the projected volume of end-of-life LIBs is expected to rise dramatically to approximately 35,000 kt by 2040, representing a recycling demand about 16 times greater than current global recycling capacity, demonstrating the need to increase the recycling capacity [8].
Graphite, a key material in LIBs, is largely overlooked in recycling processes and is often discarded as waste, either sent to landfills or incinerated [8,9]. On the other hand, spent graphite is a valuable resource which can be upcycled by synthesizing oxygen electrocatalysts, either being directly doped with heteroatoms to enhance its catalytic properties [10] or serving as a precursor for producing other carbon materials like reduced graphene oxide (rGO) [11]. These electrocatalysts are used in energy conversion technologies like metal-air batteries, fuel cells or electrolysers [12]. Currently, the most effective oxygen electrocatalysts are noble metal-based materials, e.g., Pt/C for the oxygen reduction reaction (ORR) and IrO2 or RuO2 for the oxygen evolution reaction (OER) [13]. However, these catalysts rely on rare and expensive materials and exhibit insufficient stability for long-term, efficient use, particularly as bifunctional oxygen catalysts that simultaneously catalyze both the ORR and OER. [14]. Today, most of the research on bifunctional oxygen electrocatalysts focuses on the use of doped carbon nanomaterials incorporating non-precious metals such as Fe, Co, Mn, and Ni, as well as heteroatoms like N, S and O [15,16,17,18,19]. Among these are 2-dimensional carbon materials, such as rGO, which feature an optimal thickness-to-diameter ratio. This property enables short diffusion times and provides high surface areas capable of hosting active sites, thereby improving the activity of electrocatalysts [20]. Qin et al. developed a Co-N-C catalyst material for zinc–air batteries (ZAB) that demonstrated a notable power density of 155 mW cm−2 and a cycling stability of 63 h [21]. Similarly, Li et al. synthesized a bimetallic CoFe/SN-C catalyst, which served as an air electrode for ZAB, achieving an impressive power density of 169 mW cm−2 and a stability of 85 h at 10 mA cm−2 [22]. These examples highlight the potential of 2D carbon-based materials for active bifunctional catalyst synthesis. Still, a significant limitation of these approaches is the complex and costly synthesis process that relies on high purity chemical precursors.
An alternative and promising strategy involves using recycled materials as precursors for electrocatalyst synthesis. Graphite recovered from waste LIBs can serve as an excellent precursor for either rGO synthesis or can be directly utilized for electrocatalyst production [23,24]. Nonetheless, most research in this area relies on manually extracted materials from LIBs, a method that is not scalable; moreover, the produced electrocatalysts are usually only applicable for one reaction ORR or OER, as highlighted by earlier research [25,26,27,28,29]. A more scalable and efficient approach to utilizing waste materials involves repurposing hydrometallurgical LIB recycling leach residue. This primarily consists of graphite—but may also contain small amounts of other carbonaceous species to increase the conductivity, like carbon black—residual battery metals such as Co, Ni, Al, Cu, and Mn, along with additives from the binder and electrolyte (e.g., F) [30]. Such metals can be incorporated into the carbon framework for the formation of active catalytic centres as demonstrated by our previous research that showcases the potential of this approach for sustainable and effective resource utilization [23,31,32].
In this study, we use waste from the hydrometallurgical treatment of LIBs along with manually extracted graphite from mobile phone batteries as precursors for synthesizing an active bifunctional graphite/rGO composite electrocatalyst. Building on our earlier findings that N-rGO derived from leach residue exhibits good electrocatalytic activity, we selected a purer rGO precursor to provide a clearer demonstration of metal incorporation, particularly Co, directly from the leach residue. Repurposing this waste material aligns with the EU Battery Regulation goal of recycling at least 65% of LIBs by 2026, while also contributing to the development of sustainable green energy conversion technologies [33].

2. Materials and Methods

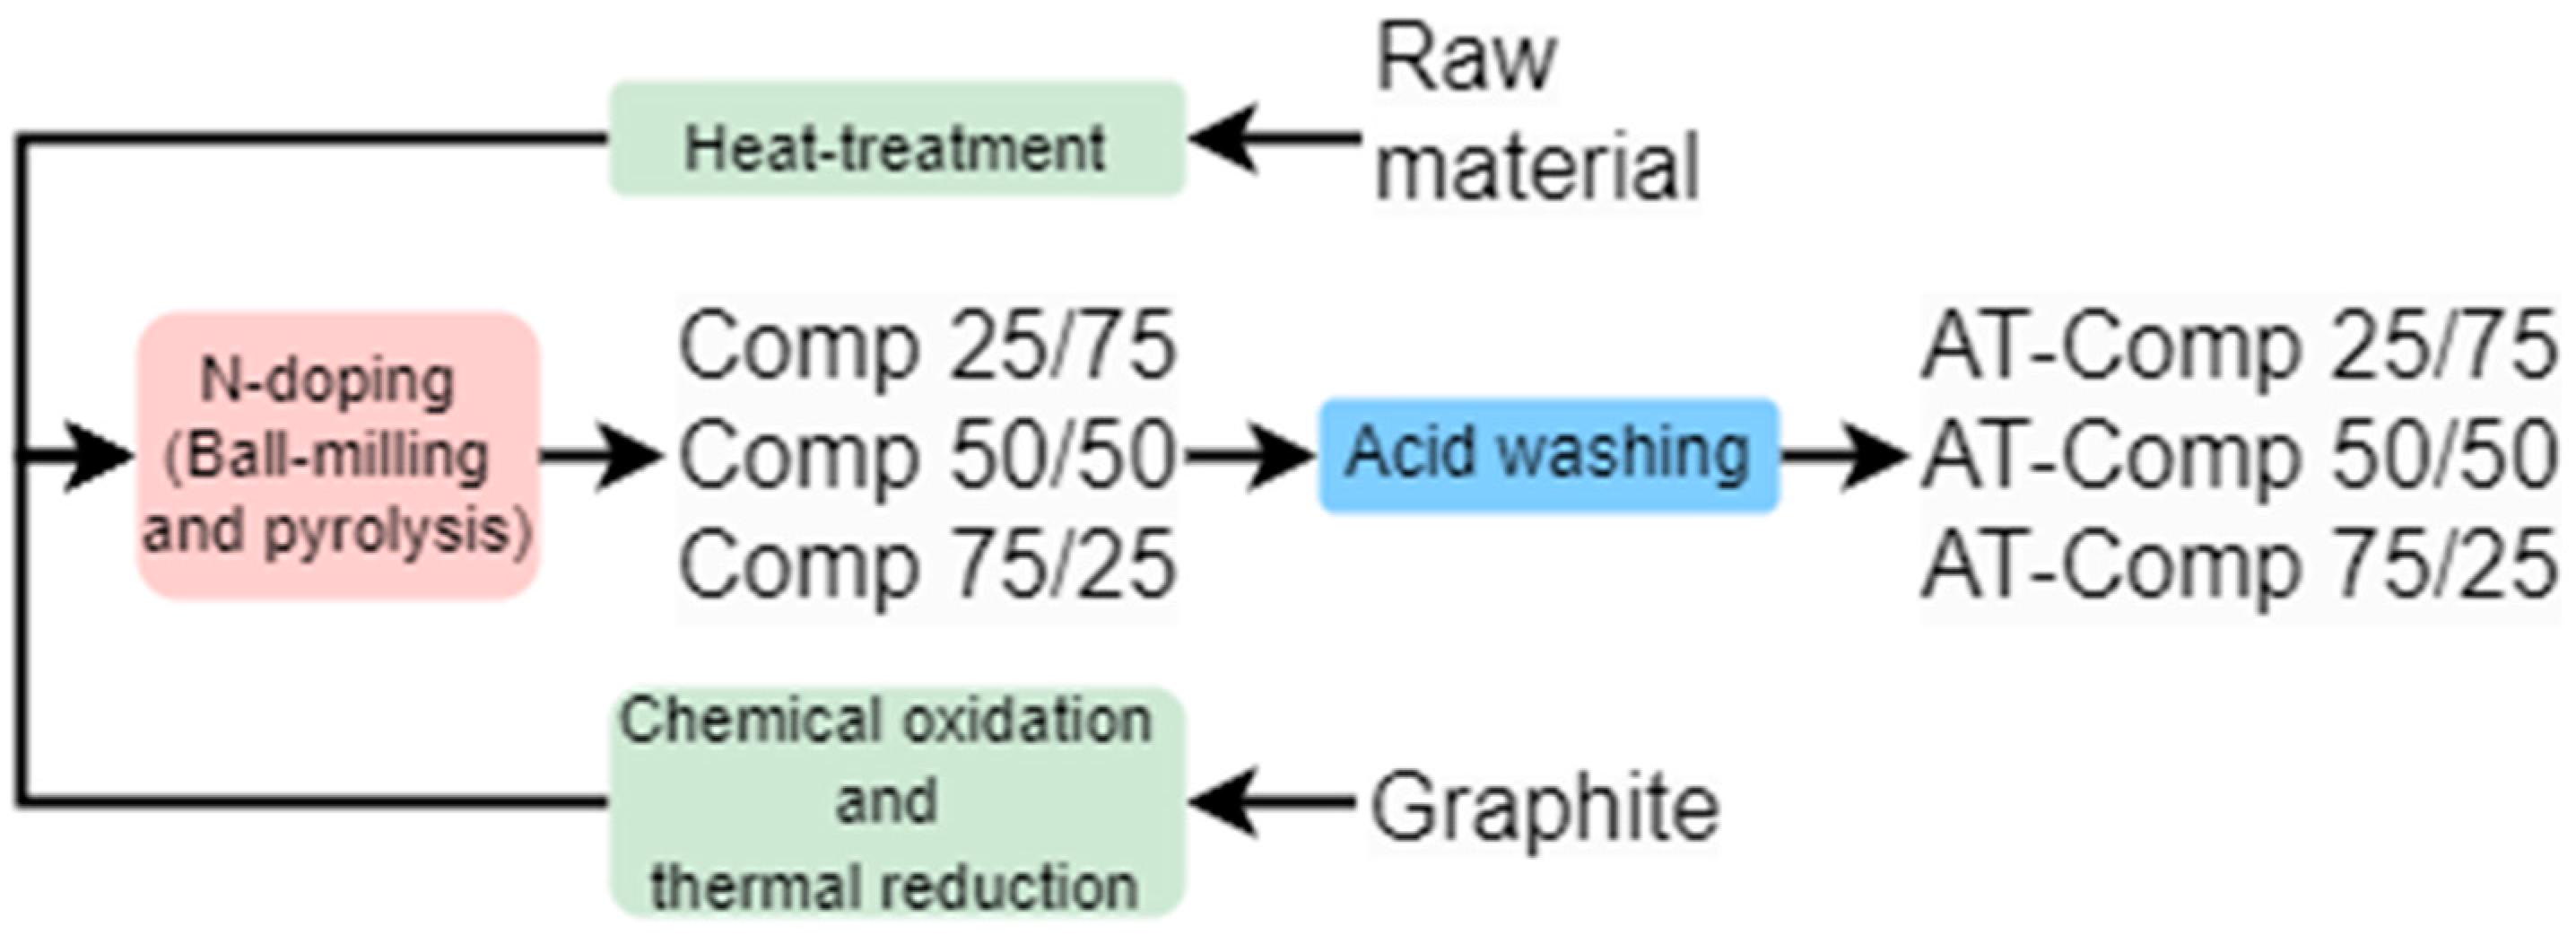
2.1. Synthesis of the Catalyst Materials

The two starting materials for the composite catalyst synthesis were derived from spent battery graphite. Firstly, iPhone batteries (APN: 616-00036), utilizing LiCoO2 as cathode active material, were collected from local repair shops, discharged, and manually dismantled. The anode, cathode, and separator were divided, and the anodes were submerged into water to remove the graphite from Cu-foil. This graphite was then filtered and dried prior to the GO synthesis by a classical Hummer’s method, which included a thermal reduction at 800 °C for 1 h under Ar atmosphere to produce the rGO [23]. Additionally, black mass leach residue—an industrially processed battery material previously subjected to hydrometallurgical recycling process—was obtained for use in this study [30]. This residual waste, herein defined as Raw Material, served as one of the starting materials alongside the synthesised rGO for this study. Raw Material predominantly consists of graphite, along with traces of metals from the cathode active materials and current collectors, as well as the binder and some organic compounds. The Raw Material underwent pyrolysis at 800 °C for 1 h under Ar atmosphere (99.999%, Elme Messer Gaas, Estonia) to remove the organic compounds and binder, and the resulting material was named as RM.
To synthesize the catalyst, a mixture comprising RM, dicyandiamide (DCDA, Sigma-Aldrich, Hamburg, Germany) as the nitrogen source, and polyvinylpyrrolidone (PVP, Sigma-Aldrich, Germany, Mw: 40,000) was prepared in a weight ratio of 1:20:0.1 using 3 mL of an ethanol/water solution (2:1). The resulting mixture was subjected to ball milling with 5 mm ZrO2 balls at 400 rpm for a total of one hour, carried out in two 30-min intervals with a 5-min pause in between. Afterward, a specific amount of rGO was added to the mixture, which was then placed in an ultrasonic bath for 2 h. The resulting homogeneous mixture was dried and pyrolyzed at 800 °C for 2 h under Ar atmosphere. The ratio of RM to rGO was varied, with compositions of 25 wt%/75 wt%, 50 wt%/50 wt%, and 75 wt%/25 wt%. The resulting catalysts were named Comp 25/75, Comp 50/50, and Comp 75/25, respectively. A similar synthesis method was used to prepare N-rGO, and N-RM materials for comparison. Additionally, Comp 25/75, Comp 50/50, and Comp 75/25 underwent acid treatment with a 1:1 solution of 0.5 M H2SO4 and 0.5 M HNO3, first at 50 °C for 2 h, then at 80 °C for 3 h. The resultant catalyst materials were subsequently washed with Milli-Q water until a neutral pH was reached and dried under vacuum. Finally, the materials were re-pyrolyzed at 800 °C for 1 h under Ar atmosphere to remove any excess oxygen groups that resulted from the acid treatment. The final catalysts were named AT-Comp 25/75, AT-Comp 50/50, and AT-Comp 75/25. This process was performed to remove excess metals and unstable species, thereby ensuring the catalysts’ stability under harsh electrochemical testing conditions. A similar acid treatment process has been used in other studies to achieve the same purpose [34]. The flowsheet of catalyst material synthesis is shown in Figure 1.

2.2. Physicochemical Characterisation

The crystallinity and phase composition of the materials were analyzed using powder X-ray diffraction (XRD) with a PANalytical X’Pert3 Powder XRD system (Malvern Panalytical, Malvern, UK). The measurements were conducted with Cu Kα radiation (λ = 1.54182 Å), applying a step size of 0.04° at 45 kV and 40 mA. Atomic Absorption Spectroscopy (AAS; iCE 3000, Thermo Fisher Scientific Inc., Dreieich, Germany) was used to determine the battery metal residue content (wt%) in the Raw Material. Prior to analysis, the Raw Material was leached using aqua regia to prepare the solutions for AAS measurement. Microstructural images were captured using a JSM-IT800HL scanning electron microscope (SEM, JEOL Ltd., Tokyo, Japan) with secondary electron (SE) detection at an acceleration voltage of 5 kV and beam current of 54 pA. Elemental mapping was performed using an Aztec Live Premium Ultim Max 100 energy-dispersive spectrometer (EDS, Oxford Instruments, UK) at an acceleration voltage of 15 kV and beam current of 1.4 nA. Beam measurement was conducted using pure copper cathode as a reference material. The quantified maps were acquired at 400× magnification with a resolution of 512 pixels, and the mapped area was scanned 8 times with 200 µs dwell time per pixel. Two maps were taken from each sample. HR-TEM micrographs were acquired using a double aberration-corrected microscope with a 200 kV field-emission gun and X-ray EDS detector (JEOL JEM-2200FS, JEOL Ltd., Tokyo, Japan).
Raman measurements were conducted using a Renishaw inVia™ Confocal Raman Microscope (Renishaw, Wotton-under-Edge, UK). A 532 nm excitation laser was focused on the sample through a 50× objective lens of a Leica microscope. The scattered light was collected at a backscattering angle of 180°, and a 2400 L mm−1 diffraction grating was used to disperse the wavelengths for detection by a Charge Coupled Device (CCD) detector. Spectral deconvolution was carried out using OriginPro 2021 software, applying the Voigt function for peak fitting and analysis. Nitrogen adsorption–desorption analysis (Anton Paar Novatouch LX4, Anton Paar QuantaTec Inc., Graz, Austria) was performed to determine the specific surface area and porosity of the samples at liquid nitrogen boiling temperature (77 K). The specific surface area was determined by applying the Brunauer–Emmett–Teller (BET) method to the linear portion of the adsorption isotherm at relative pressures (P/P0) between 0.05 and 0.3. Additionally, the density functional theory (DFT) surface area (SDFT) was calculated using the Quenched Solid Density Functional Theory (QSDFT) equilibrium model for slit/cylindrical/spherical pore types calculated by using Quantachrome Instruments Touchwin 1.24 software (Anton Paar QuantaTec Inc., Graz, Austria). The pore size distribution (PSD) was evaluated using the Non-Local Density Functional Theory (NLDFT) method implemented in SAIEUS 3.0 software (Micromeritics, Norcross, GA, USA). X-ray photoelectron spectroscopy (XPS) was carried out with a Kratos Axis Ultra spectrometer with monochromated Al Kα-radiation using a pass energy of 40 eV, X-ray power of 195 W, and an analysis area of approximately 700 µm × 300 µm. The sp2 carbon 1 s peak at 284.5 eV has been used as a binding energy reference. The elemental composition was determined from peak areas of high-resolution core level spectra after Shirley background subtraction using equipment specific sensitivity factors. Peak fitting was done using Gaussian–Lorentzian peaks (GL (30) line shape in CasaXPS 2.3.25 software) with the positions of the peaks fixed to within ±0.1 eV of given binding energies. For sp2 carbon, an asymmetric line shape was used in CasaXPS [1]. The full widths at half-maximum (FWHMs) of the peaks were restricted to be equal within a fit except for sp2 carbon and N-oxide peaks.

2.3. Electrochemical Characterisation

The ORR and OER were investigated by the rotating disc electrode (RDE) technique with a Gamry 1010E potentiostat/galvanostat, utilizing a three-electrode system. The reference electrode was Ag/AgCl (3 M KCl), while a graphite rod served as the counter electrode for ORR and a platinum wire for OER, respectively. A glassy carbon (GC, S = 0.2 cm2) electrode, coated with the catalyst material, was used as the working electrode. The RDE setup featured an Origalys speed control unit and rotator, with rotation speeds ranging from 400 to 3600 rpm. The catalyst ink was prepared with a concentration of 4 mg mL−1 in ethanol, with 4 μL of 5 wt% Nafion™ solution per mg of catalyst as an ionomer. Five 4 μL aliquots of the catalyst ink were applied to the cleaned GC electrodes, achieving a catalyst loading of 0.4 mg cm−2. All recorded potentials were converted to reversible hydrogen electrode (RHE) values using the Nernst equation for the ORR and OER potential:
E R H E = E A g / A g C l + 0.059   p H + E 0 A g / A g C l
ORR tests were conducted in an O2-saturated (Elme Messer Gaas, 5.0) 0.1 M KOH solution at room temperature, with a constant flow of O2 gas over the solution. All experiments were controlled using Gamry Instruments Framework 7.10.0 software (Warminster, PA, USA). OER measurements were performed in a N2-saturated (Elme Messer Gaas, 5.0) 1 M KOH solution at room temperature, with a constant gas flow similar to the ORR tests.
To account for the system’s ohmic resistance, iR-drop compensation was applied to the OER polarization curves. The resistance was determined from electrochemical impedance spectroscopy (EIS) data collected over a frequency range of 100 kHz to 1 Hz at open circuit potential. The real part of the impedance, derived from the Nyquist plot at the point where the imaginary component was zero, was used as the resistance value. The OER overpotential (in mV) was calculated using the following equation:
E e x p e r i m e n t a l ( v s   R H E ) 1.229   V ) × 1000
To assess electrocatalytic activity, at least three sets of RDE measurements were performed for each synthesized catalyst material, with each set using three electrodes.

2.4. Zinc-Air Battery Testing

ZAB experiments were conducted using a custom-designed test cell. The air electrode, with an active surface area of 1.038 cm2, consisted of a gas diffusion layer (GDL, Sigracet 28BC from SGLCarbon, Wiesbaden, Germany) and a catalyst layer loaded onto the GDL at 1 mg cm−2. A titanium mesh functioned as the current collector for the air electrode. As a benchmark, a commercial catalyst 20% PtRu (in a 1:1 ratio) on carbon support (FuelCellstore, Bryan, TX, USA) was used for the air electrode. The electrolyte in the ZAB cell was 6 M KOH mixed with 0.2 M Zn(Ac)2, while a polished Zn plate (1 mm thick, 99.9% purity) served as the counter electrode.
All ZAB tests were performed at room temperature using a PGSTAT30 potentiostat/galvanostat (Metrohm Autolab, Utrecht, The Netherlands) controlled by NOVA 2.1.5 software. Charge–discharge cycling was conducted at a current density of 5 mA cm−2, with alternating 30-min charge and discharge cycles. Specific energy density and capacity were measured through complete discharge tests at a current density of 5 mA cm−2, calculated based on the Zn mass consumed. To ensure reliability, at least three separate ZAB cells were tested for each catalyst material to determine the maximum discharge power density.

3. Results and Discussion

3.1. Analysis of Materials Physicochemical Properties

3.1.1. Physicochemical Analysis of Precursor Materials

Initial characterization of the precursor materials and N-RM and N-rGO were performed using XRD analysis (Figure S1a,b in Supplementary Material). The XRD pattern in Figure S1a revealed that the Raw Material was primarily composed of graphite, indicated by the prominent (002) peak at 26.5°. Additionally, traces of unreacted cathode active material (LiCoO2), metallic cobalt (Co(0)), and manganese oxide (MnO) were present, highlighting its heterogeneous nature. The presence of these metal components in the Raw Material, particularly cobalt, shows the significant potential for use as a precursor for electrocatalyst synthesis. The diffraction pattern for N-RM contained peaks at similar 2θ positions as the Raw Material, except that a majority of the LiCoO2 peaks were no longer present. This suggests that oxidic cobalt had mostly reduced to metallic Co during the pyrolysis treatment at 800 °C. The reduction was most likely carbothermic [35] due to the high concentration of carbon present (Tables S1 and S2), but some aluminothermic reduction may also have taken place due to the presence of Al current collector residues in the Raw Material (Table S1) [36]. In addition, the heterogeneous nature of the Raw Material was confirmed by the AAS results presented in Table 1. Among the analyzed metals, Co showed the highest concentration at 18.6 ± 1.13 wt%, followed by Mn at 1.3 ± 0.03 wt%. The concentrations of all other detected elements were below 1 wt%. These values represent the average of three independent aqua regia leaching experiments, each with 2.5 g of Raw Material. Although the Raw Material is inherently heterogeneous, the low standard error of the mean values indicates good reproducibility and compositional stability of the leach residue used in this study. Figure S1b presents the XRD diffractograms of precursor graphite, GO, rGO, and N-rGO materials. The diffraction pattern of graphite showed no detectable metal impurities, as it displays only characteristic graphite peaks. In the GO sample, the disappearance of the graphitic (002) peak and the appearance of the typical GO (001) peak around 10–12° were observed, along with a low-intensity broad peak between 20° and 30°, which is indicative of an increased interlayer spacing due to oxidation [37]. Similar peaks were present in the rGO sample, but with a more pronounced 20–30° peak, suggesting partial re-stacking of graphene oxide sheets. The N-rGO sample exhibited comparable peaks to GO and rGO, but additionally, a distinct peak at 26.5° corresponding to the graphitic (002) plane was observed, confirming the partial re-stacking of graphene sheets following nitrogen doping.

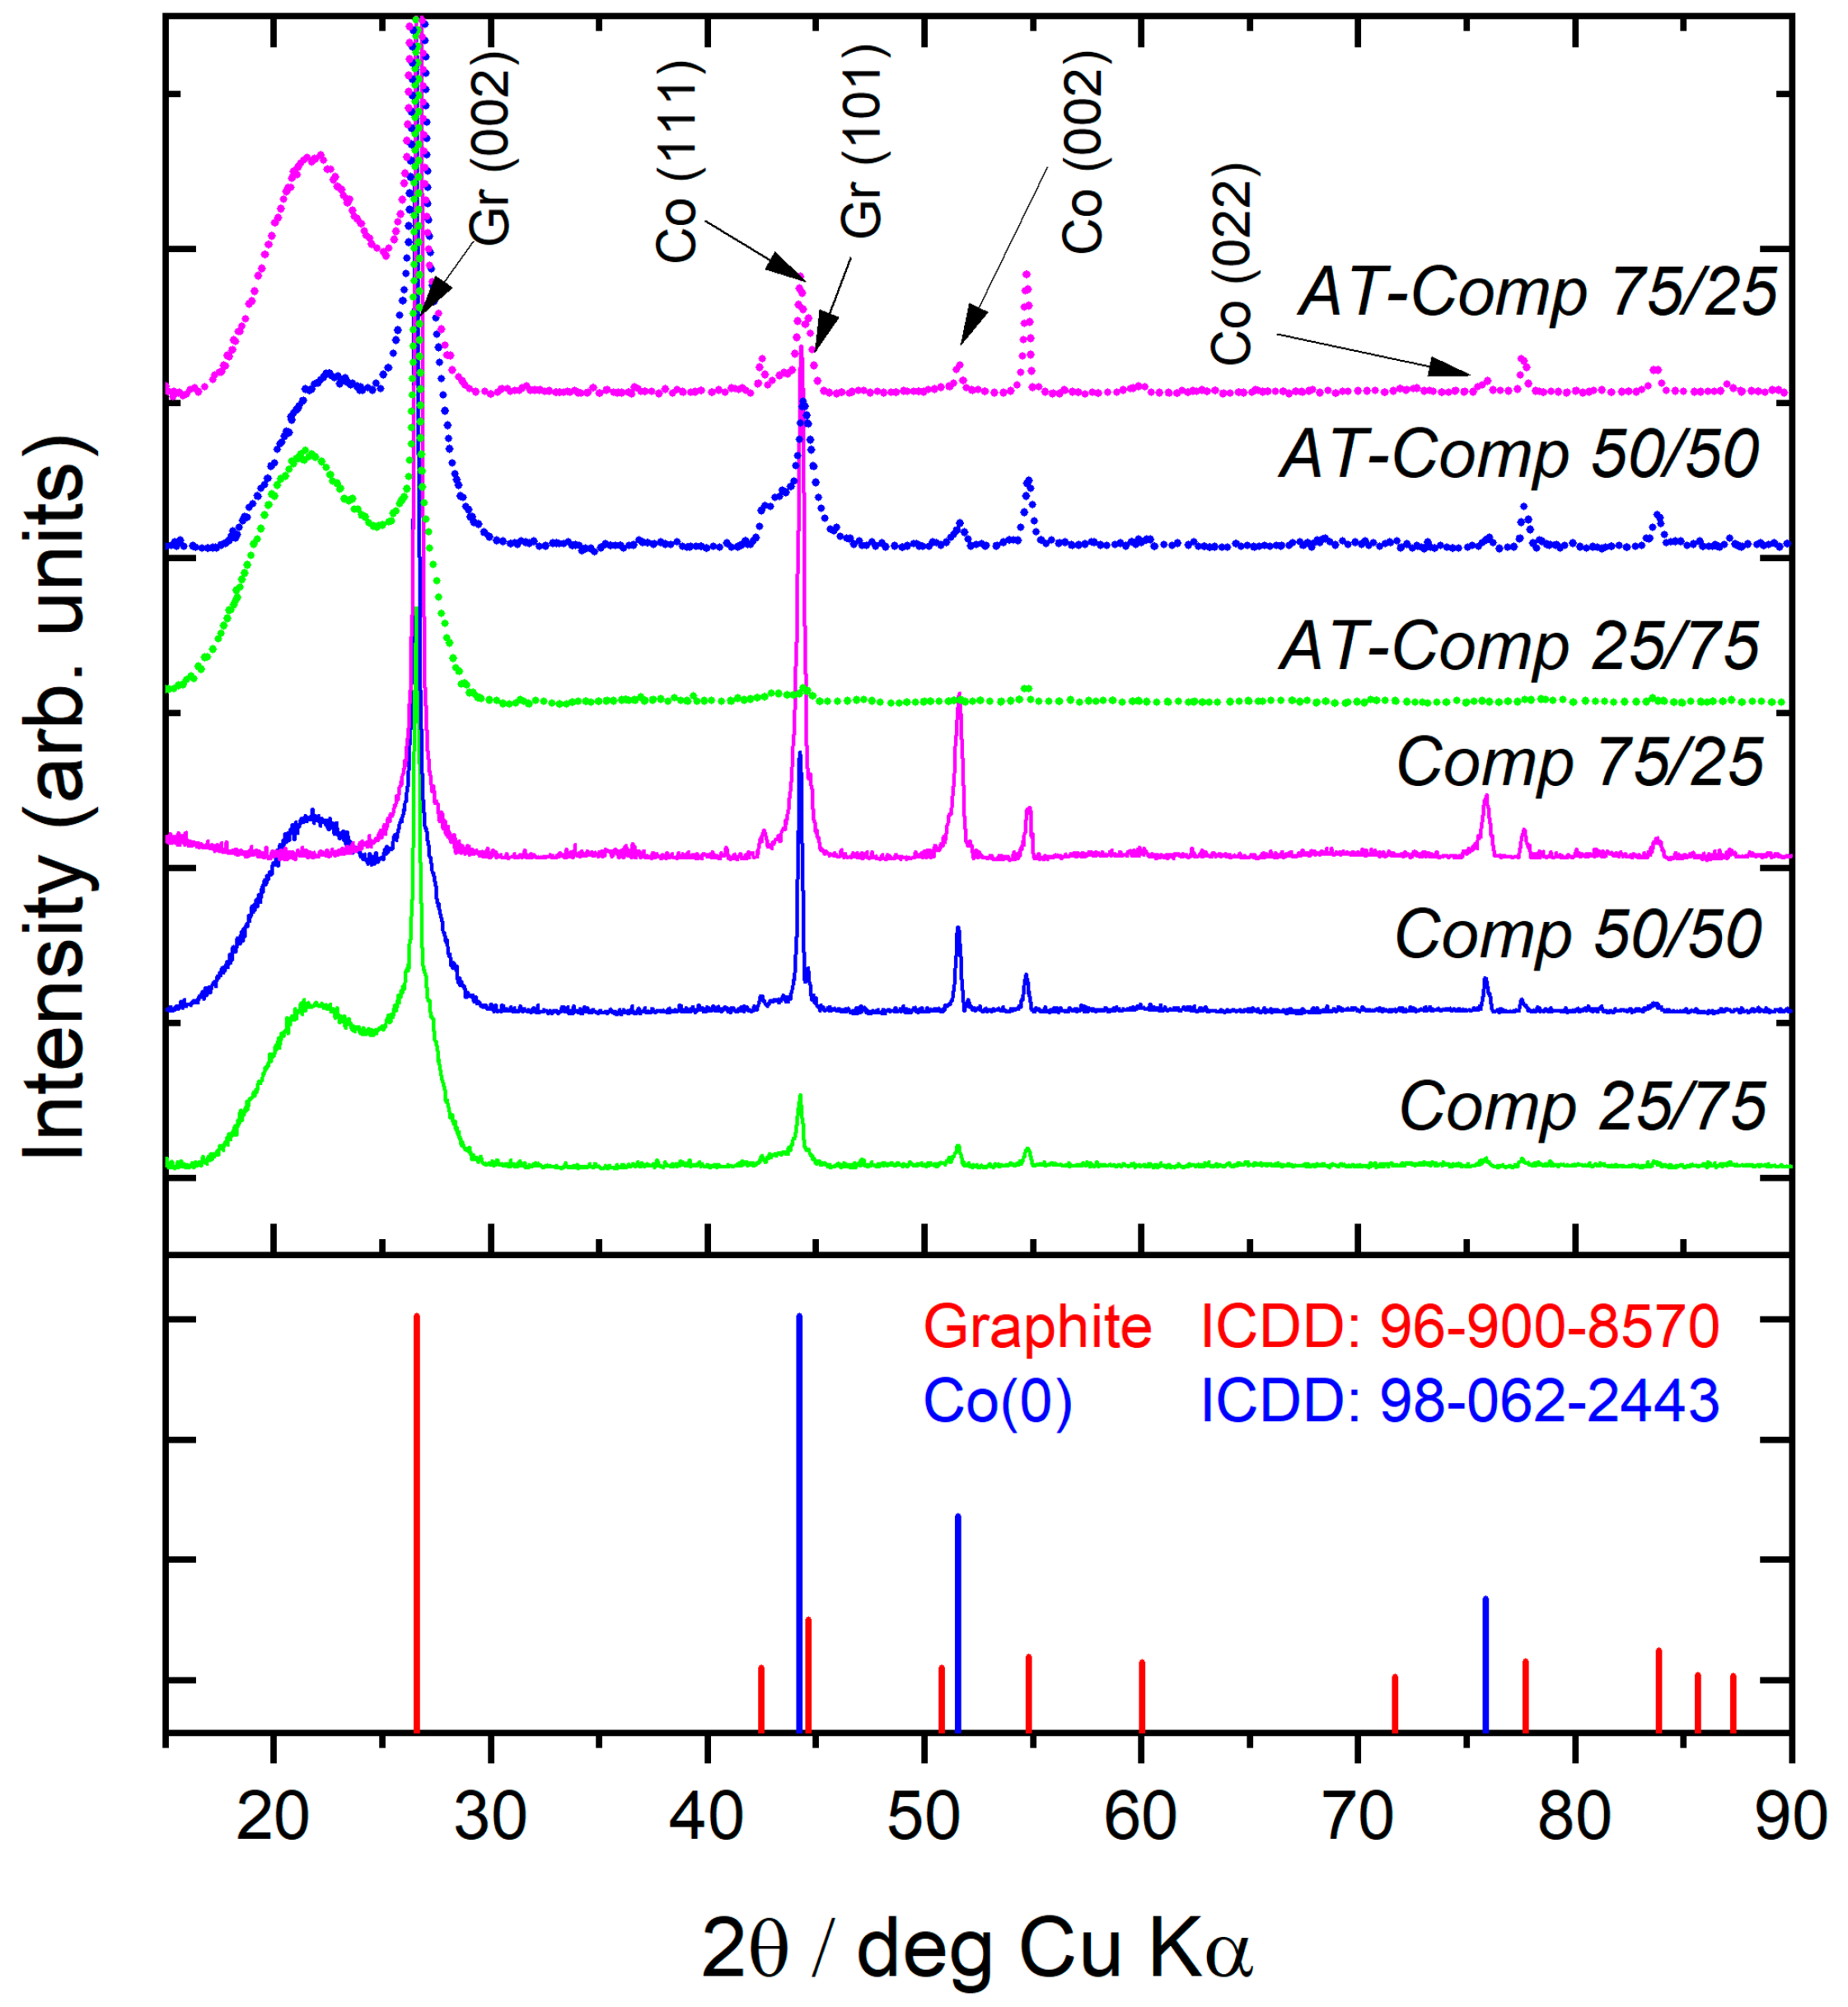
3.1.2. XRD, SEM-EDS, and TEM-EDS Analysis of Composites

The composite catalysts were also characterized by XRD (Figure 2). All composite samples exhibited a high intensity peak at 26.5°, characteristic of the (002) plane of graphitic carbon. This suggests that graphitic carbon contributes significantly to the carbon matrix within the composites. Moreover, the broad peak from 20 to 25° implies that also more amorphous phases of carbon are present, as a result of the rGO within the composite materials. Distinct peaks at 44.2°, 51.5°, and 75.8° corresponding to the (111), (002), and (022) planes of metallic Co(0), respectively, were evident in the XRD patterns for all studied samples, the presence of which confirms the successful incorporation of metallic Co within the composite materials.
Figure S2 displays the SEM micrographs of the studied materials. Figure S2a,d—corresponding to Comp 25/75 and AT-Comp 25/75, respectively—reveal the characteristic layered structure of rGO. The surface of Comp 25/75 exhibits greater roughness compared to its acid-treated counterpart, indicating the presence of nitrogen species on the surface of the material [32]. Figure S2b,c,e,f show more varying surface structures compared to the layered structure of rGO. Notably, Comp 50/50 and AT-Comp 50/50 show a significant presence of carbon nanotubes (CNTs), which are known to form in nitrogen doped carbon materials in the presence of Co or Ni nanoparticles during the pyrolysis process [23,32]. A similar structure is observed in Comp 75/25 and AT-Comp 75/25 (Figure S2c,f), but with a noticeably reduced CNT number. Quantified SEM-EDS mapping (Table S1) identified small amounts of various metals, including Co, Al, Si, Mn, and Ni, with Co being the most abundant on the surface of all composites. In the Comp-series catalysts, the Co content increased in relation to the proportion of RM within the material.
Nevertheless, for the AT-Comp series, the highest Co concentration was found in AT-Comp 50/50 (Figure S3 demonstrates the quantified SEM-EDS elemental maps), probably as a result of Co(0) encapsulation within the CNTs. In contrast, AT-Comp 75/25 material exhibited less distinct CNT formation, resulting in lower Co(0) encapsulation and a higher level of Co species leaching during acid treatment. This highlights the beneficial role of acid treatment in enhancing the structural stability of the catalyst materials.
To further highlight the structural and compositional distinctions between the composite samples, related HR-TEM micrographs are displayed in Figure 3a–f. Comp 25/75 (Figure 3a) and AT-Comp 25/75 (Figure 3d) show minimal incorporation of Co nanoparticles, suggesting a lower metal content on the surface of these composites. In contrast, Comp 50/50 (Figure 3b) and AT-Comp 50/50 (Figure 3e, along with EDS data in Figure S4) display Co-catalysed bamboo-like CNTs, where Co nanoparticles (≈ 30 nm) are encapsulated within the nanotubes [23,32]. A similar—though less pronounced—effect is observed for Comp 75/25 (Figure 3c) and AT-Comp 75/25 (Figure 3f), where CNT formation occurs at a lower concentration. Beyond bamboo-like CNTs, larger (>100 nm) onion-like spherical carbonaceous regions are also visible, which form protective shells around Co(0) nanoparticles [38,39]. Both encapsulation mechanisms—within CNTs and spherical carbon shells—enhance the stability of Co(0) nanoparticles, making them more resistant to leaching under harsh conditions. Figure S4 presents the TEM-EDS spectra for AT-Comp 50/50 (Figure 3e), confirming the composition of the composite catalysts. Specifically, EDS 1 identifies a Co nanoparticle located at the end of a bamboo-like CNT, while EDS 2 reveals a Co nanoparticle fully encapsulated within a CNT. Furthermore, EDS 3 and 4 highlight onion-like spherical carbonaceous regions that serve as protective shells for Co. These Co-enriched carbon structures are absent in Comp 25/75 and AT-Comp 25/75. Acid treatment effectively removed unstable particles from all composites, refining their surface composition. The most significant structural modification is observed for AT-Comp 75/25, where the removal of non-stable Co species is particularly evident, as confirmed by both HR-TEM micrographs and SEM-EDS analysis.

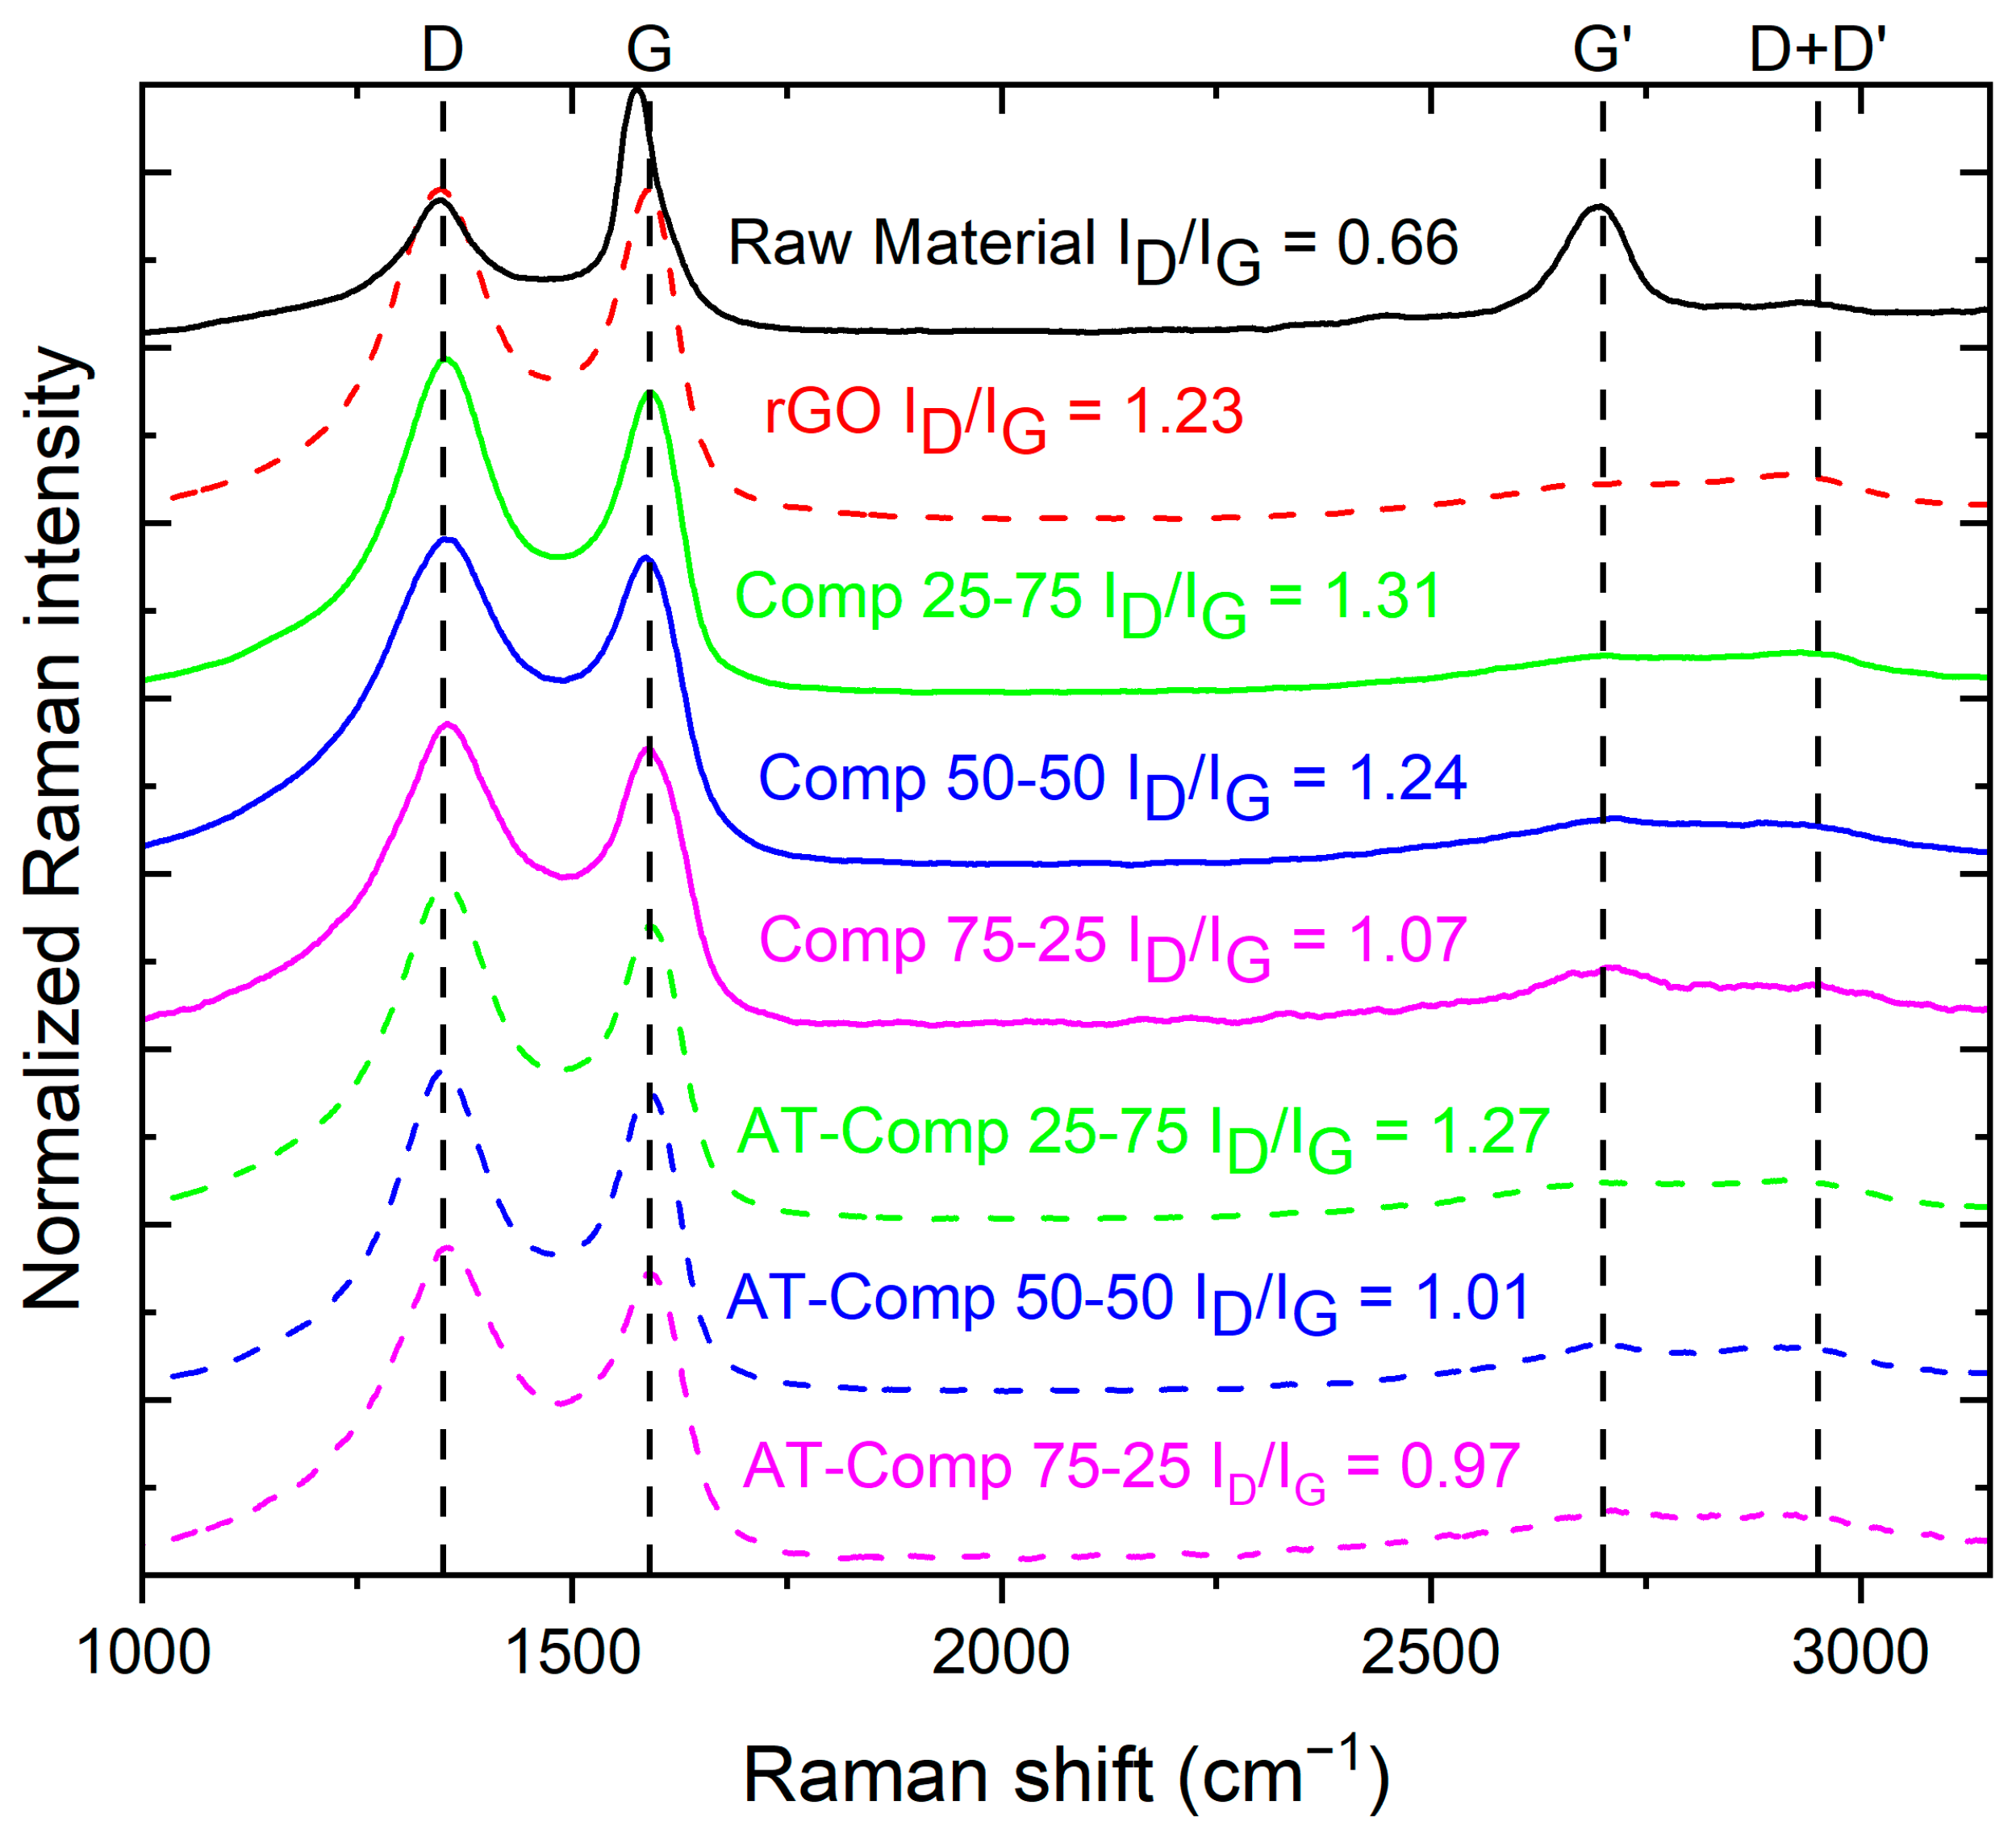
3.1.3. Raman and N2 Physisorption Analysis of Studied Materials

Raman analysis (Figure 4) provides more detail of the structural differences between the Raw Material, rGO, and the composite samples, highlighting the influence of rGO content and acid treatment on defect density and graphitic ordering. All composite materials exhibit two prominent peaks corresponding to the D-band at ~1350 cm−1 and the G-band at ~1580 cm−1, which are characteristic of carbon-based materials such as graphite and graphene oxide. The D-band is associated with structural defects and disordered carbon, while the G-band corresponds to the graphitic sp2-hybridized carbon network [40]. In rGO and the composite materials, the G-band is shifted to a slightly higher wavenumber, which can be attributed to the oxygenation of sp2 carbon atoms, leading to the formation of sp3 carbon bonds [41]. Additionally, the G’ (2D) band appears at ~2700 cm−1 in the Raw Material, and a broad signal indicative of a D + D’ combination is observed around 2950 cm−1, further reflecting the presence of structural irregularities. Analysis of the ID/IG ratio reveals critical differences between the base materials. The Raw Material exhibits a lower ID/IG ratio compared to rGO, indicating a higher degree of structural order in the Raw Material. This aligns with the hypothesis that Raw Material, primarily composed of graphite and has a more ordered graphitic structure, whereas rGO contains more defects, likely due to the presence of oxygen-containing functional groups introduced during the synthesis and reduction processes. The ID/IG ratio of the composite materials shows a clear trend, with higher rGO content which corresponds to an increase in the number of defects and suggests that rGO contributes to the overall defect density of the composite. Acid treatment followed by the heat treatment of the composite materials resulted in a slight reduction in the ID/IG ratio, implying a partial restoration of structural order, possibly due to the removal of oxygenated groups and non-stable forms of metals [42]. No additional Raman shifts were observed for the materials studied, indicating that no new functional groups or phases were introduced during synthesis or heat treatment.
The specific surface area (SSA) and pore size distribution (PSD) of the materials were determined using N2 adsorption–desorption isotherms, as illustrated in Figure S5 and Table 2. These isotherms exhibit a combination of type IV(a) and type II characteristics with H3-type hysteresis loops that reveal the presence of meso- and macroporous structures composed of slit-like pores and finer mesopores typically formed by plate-like particles or layered structures [43,44]. N-RM and Comp 75/25 display type II behaviour, which indicates a higher prevalence of macroporosity compared to mesoporosity. The SSA of the materials increased with a higher rGO content and further improved following acid treatment due to leaching of unbonded metal species [45]. Among the composite materials studied, AT-Comp 25/75 exhibited the highest BET surface area (183.3 m2 g−1). The observed differences between the BET and DFT surface areas suggest that adsorption predominantly occurs in meso/macropores rather than micropores [44]. The PSD data presented in Figure S5b and its inset reveal a diverse range of mesopores in the composite materials. While the volume of larger mesopores remains unchanged when the Comp-series are compared to their AT-Comp counterparts, the volume of smaller mesopores increases after acid treatment followed by pyrolysis. This observation suggests that the additional processing step enhances the structural refinement of the catalysts by removing unstable metal species. Furthermore, the increase in smaller mesopores and increase in the SSA indicates pore opening without significant degradation or collapse of the pore walls, thereby preserving the overall structural integrity of the material [46].

3.1.4. Surface Composition and Chemical State Characterization of Materials via XPS

Chemical composition of the samples was studied by using the XPS (Table S2). In addition to carbon, oxygen, and nitrogen, various metals (Co, Mn, Ni, Si, Al, Cu, and Na) were detected in the samples, and the metal contents based on XPS were similar compared to the concentrations determined by SEM-EDS mapping (Table S1). Figure 5 presents the C 1 s, N 1 s, and Co 2p XPS spectra of the synthesized samples. The C 1 s spectrum displays a dominant asymmetric peak at 284.5 eV, corresponding to sp2-hybridized carbon. Additional signals observed in the 285–289 eV binding energy range are attributed to various carbon bonding environments, including C–C, C–O, and C–N interactions [47,48,49]. The C 1 s spectra, which do not show large differences between the studied samples, have been fitted to include contributions from all these species (for fitting details see [49]). The N 1 s spectra shown in Figure 5b were deconvoluted based on the presence of four nitrogen species: pyridinic-N, pyrrolic-N, graphitic-N, and N-oxides (see fitting parameters in [50,51]). The fitting results indicate that pyridinic-N is the dominant nitrogen configuration across all samples. Moreover, the relative distribution of the nitrogen species is consistent among the samples. While the pyridinic-N peak may include some contribution from N–Co bonding, the significantly higher nitrogen content compared to Co suggests that the signal is primarily due to pyridinic-N. Even though the nitrogen species have similar ratios between the studied materials, the doping levels show much more variation. In Comp-series materials, the at-% of N were 7.2%, 6.4%, and 6.2% for Comp 25/75, Comp 50/50, and Comp 75/25, respectively. For the AT-comp materials, the doping level decreased for all composite materials, showing the removal of less stable nitrogen species. Notably, the smallest decrease was observed in AT-Comp 50/50, suggesting a higher proportion of structurally stable nitrogen species. This stability is likely attributed to the formation of Co-catalyzed protective carbon structures, which provide an environment that also mitigates against nitrogen removal [34,38,52]. The Co 2p spectra (Figure 5c) were fitted using two main components: one corresponding to metallic Co and another representing Co–N coordination, which may also include contributions from cobalt oxides and/or hydroxides [53,54,55]. Nonetheless, supporting evidence from the XRD diffractogram confirms the presence of metallic Co. Due to the spectral overlap, the Co–N and CoOx species are represented by a single peak, fitted using standard parameters for Co(II) as referenced in [51]). Variations in the chemical state of cobalt are observed across the samples, with the proportion of metallic Co ranging from 28% to 44%. The atomic concentrations, peak fitting results, and additional spectra can be found in the Supplementary Information (Figure S6 and Table S2).

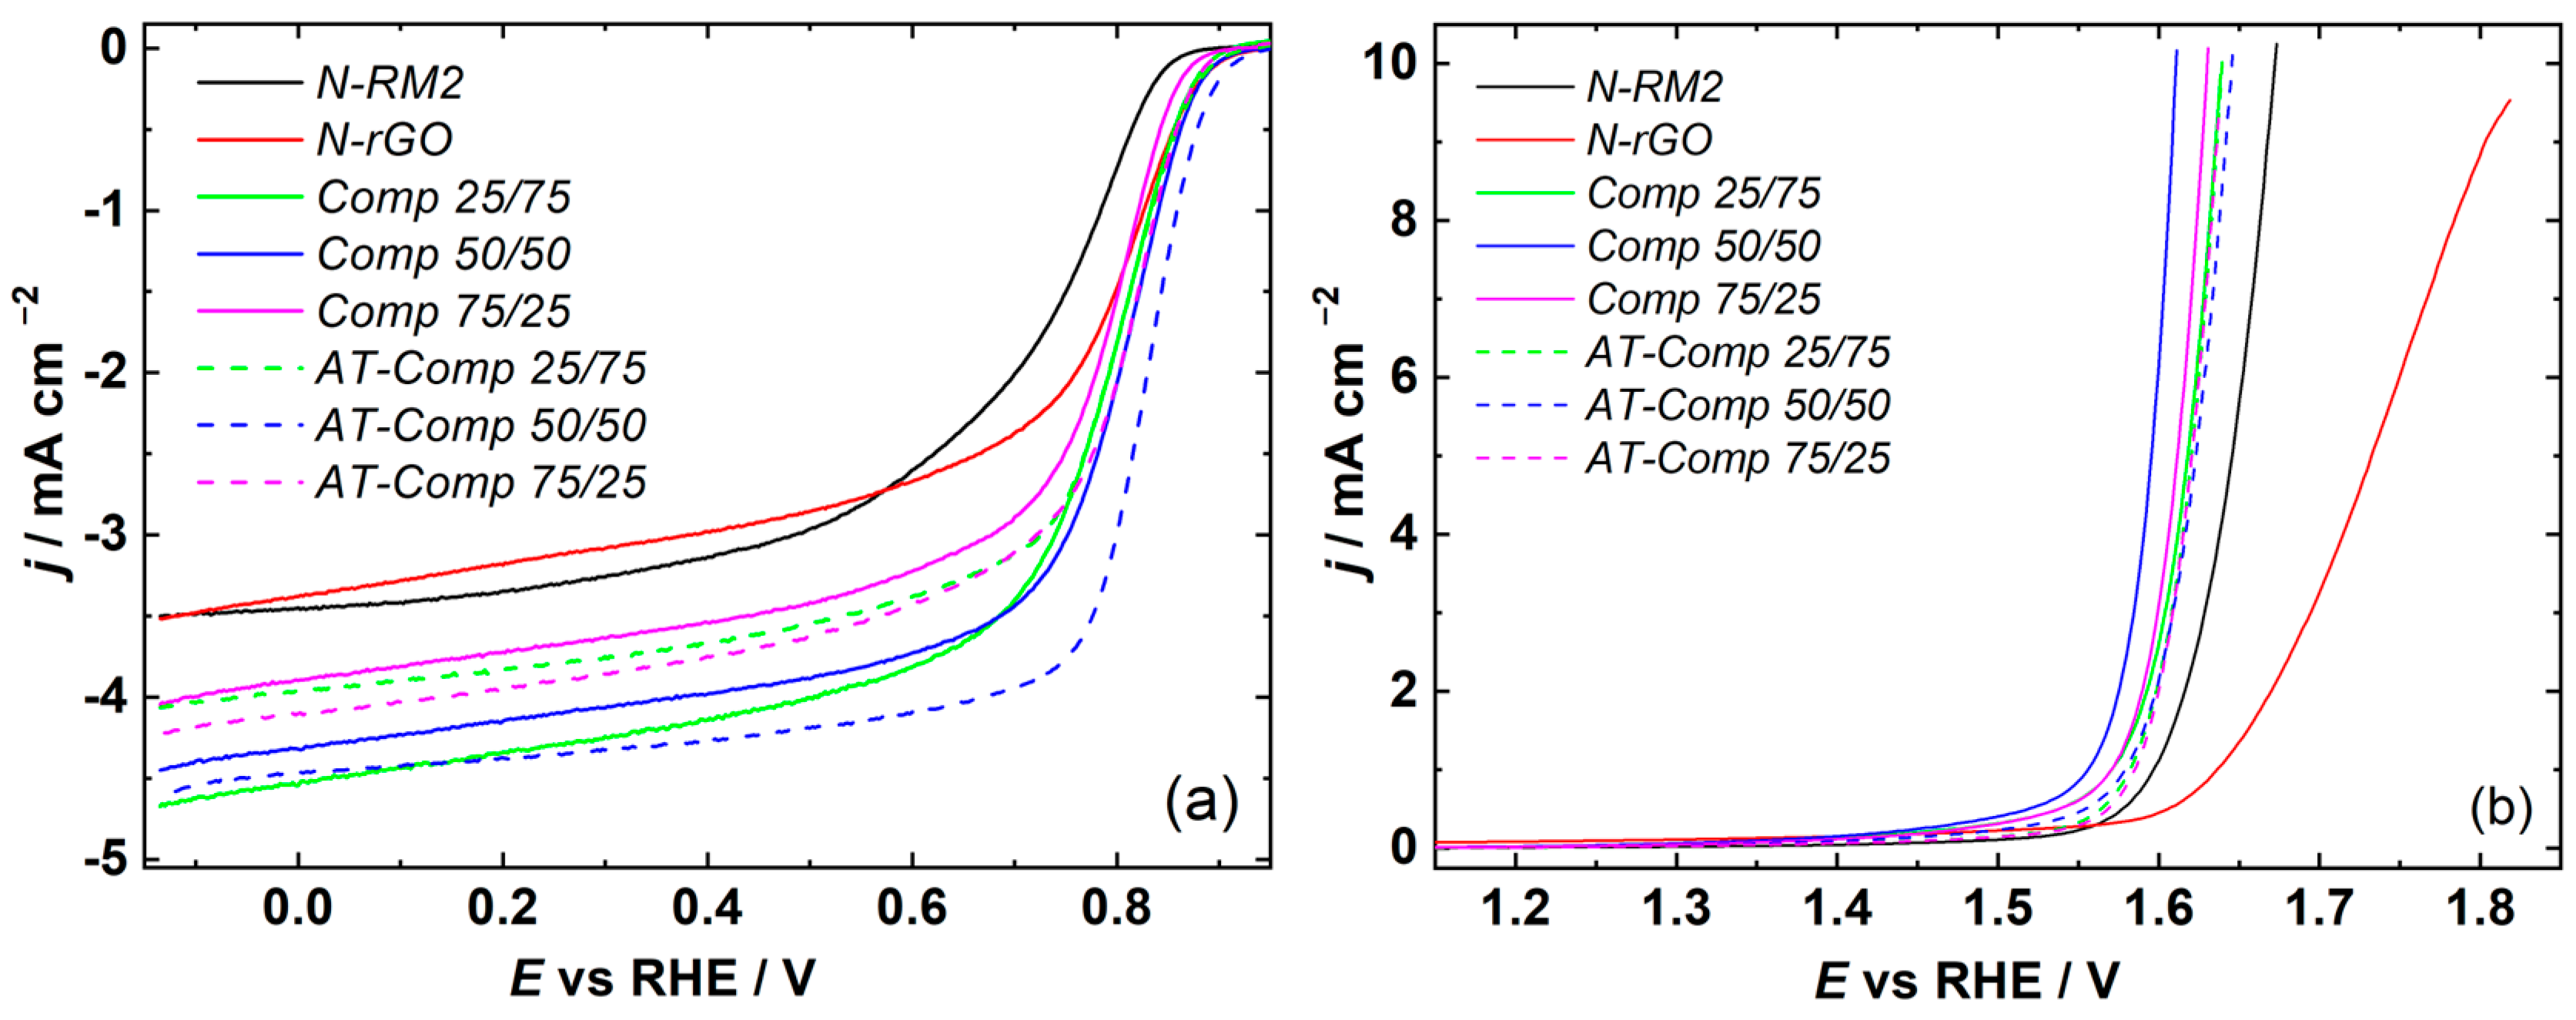
3.2. Evaluation of Bifunctional Oxygen Electrocatalysis

The electrocatalytic performance of the synthesized catalyst materials was initially evaluated for the ORR in an O2-saturated 0.1 M KOH solution, as shown in Figure 6a. For a better comparison of the composite materials, both starting materials doped with nitrogen were also investigated. Among the tested materials, AT-Comp 50/50 demonstrated the best performance with an Eonset (j = 0.1 mA cm−2) of 0.912 V vs. RHE and an E1/2 of 0.820 V vs. RHE, accompanied by a limiting current density of 4.63 mA cm−2. In comparison, the non-acid treated counterpart Comp 50/50 showed slightly lower ORR activity, with an Eonset of 0.895 V vs. RHE and an E1/2 of 0.792 V vs. RHE, though it still achieved similar current density of 4.45 mA cm−2. N-RM had the lowest onset potential (Eonset = 0.852 V vs. RHE) and half-wave potential (E1/2 = 0.727 V vs. RHE), indicating lower ORR activity compared to the composite materials and N-rGO. This lower performance is attributed to its reduced SSA and porosity, which hinder effective mass transport within the catalyst. N-rGO, on the other hand, showed improved Eonset compared to N-RM, with an Eonset of 0.897 V vs. RHE and E1/2 of 0.780 V vs. RHE, demonstrating higher catalytic activity. This enhanced activity of N-rGO is attributed to its higher SSA, which facilitates better mass transport and a higher concentration of electrocatalytically active nitrogen species [37].
Figures S7 and S8 show the ORR polarization curves of studied composites on different rotating speeds as well as their Koutecky–Levich (K–L) analysis. The K–L plots for all studied materials are linear and parallel, indicating that the process is mass transport limited. Regarding the ORR activity of Co- and N-doped catalyst materials, pyridinic-N and Co-N species are recognized as the most effective active sites [56]. Notably, the ratio of pyridinic-N was similar in all studied catalysts, but the doping level varied. The highest ORR activity was observed for AT-Comp 50/50, which also retained the highest nitrogen concentration among the acid-treated materials while also containing the most Co and Co-N species on the surface of the catalyst. Additionally, TEM micrographs revealed the formation of Co-catalyzed bamboo-like carbon nanotubes and onion-like carbon species during the synthesis of Comp 50/50 and AT-Comp 50/50. These types of structures enhance the overall morphology of the composites by functioning as spacers between rGO sheets, thus promoting efficient electron transfer and improved catalytic activity [23,57]. In contrast, for Comp 25/75 and AT-Comp 25/75, the absence of a protective carbon layer around the catalytic centres was attributed to the lower metal content and lack of Co-catalysed carbon structures. As a result, some of the catalytic centres were leached out during acid treatment, leading to a reduction in ORR activity. In the case of Comp 75/25, some bamboo-CNTs and onion-like carbon shells were observed, which provided partial protection for the active centres during acid treatment. While some non-active metallic species were leached out, the retained structural stability contributed to an increase in catalytic activity after acid treatment observed for AT-Comp 75/25.
The OER performance was also studied, with the EOER(V) @ 10 mA cm−2 serving as the primary metric. For OER, the primary active centres in metal and N-doped carbon nanomaterials are M-N species and oxidized metal species [58]. The non-acid-treated composite catalysts exhibited superior OER activity compared to their acid-treated counterparts (Figure 6b), which can be attributed to the higher concentration of M-N sites and presence of oxidized Co and Mn species. These active species play a crucial role in enhancing OER performance, as they facilitate oxygen evolution due to the presence of efficient catalytic sites. Comp 50/50 achieved EOER = 1.621 V vs. RHE, slightly better than Comp 75/25 (EOER = 1.624 V vs. RHE) and Comp 25/75 (EOER = 1.631 V vs. RHE). Among the acid-treated catalysts, AT-Comp 75/25 had the lowest EOER = 1.632 V vs. RHE. AT-Comp 50/50 and AT-Comp 25/75 also performed well, with EOER = 1.639 V vs. RHE and EOER = 1.634 V vs. RHE, respectively. The superior OER activity of Comp 50/50 can be attributed to the presence of Co and Mn species, which were partially removed during acid treatment, as confirmed by SEM-EDS and XPS data (Tables S1 and S2). Nevertheless, both N-RM and N-rGO exhibited significantly higher EOER values, highlighting the enhanced activity of the composite catalysts over the single component materials due to the better incorporation of Co and formation of N-active species within the catalyst materials. The ∆E values (Table 3) for all the composite catalysts were determined using the following equation:
Δ E = E O E R ( @ 10   m A   c m 2 ) E O R R ( @ E 1 / 2 )
All the composite materials had smaller ∆E values than for the single component materials. Among the composite catalysts, AT-Comp 50/50 catalyst achieved the smallest ∆E value of 0.818 V, highlighting its exceptional bifunctional performance. This performance is comparable to that of the most efficient Co–N–C catalysts reported in the literature, which are typically produced from high-purity precursors through multi-step synthesis procedures [19]. In contrast, our approach employs upcycled waste materials that would otherwise be discarded, significantly enhancing the sustainability and cost-effectiveness of the synthesis method while maintaining competitive catalytic performance.

3.3. Performance of Composite Catalysts as Air Electrodes in Zinc–Air Batteries

To demonstrate the practical application of the synthesised catalyst materials, several different zinc–air batteries were assembled using the as-synthesised catalyst materials and commercial 20% PtRu/C as zinc–air battery air electrode catalyst materials. In Figure 7a the open circuit potential (OCP) measurements are displayed. The OCP values of acid treated samples, AT-Comp 50/50 and AT-Comp 25/75, exhibited not only slightly higher OCPs compared to their untreated counterparts, but also 40 to 50 mV higher values than measured for the commercial 20% PtRu/C catalyst material. The higher OCP values suggest improved catalytic activity, which probably results from enhanced surface area and better active-site exposure that facilitate oxygen adsorption and reduction. Figure 7b displays the charge and discharge polarization curves under different current densities, demonstrating both ORR and OER activity. The discharge polarization curves show that all the composite catalysts exhibit higher discharge potential than commercial 20% PtRu/C, suggesting better ORR activity in these conditions. The charge polarization curves highlight the lower potential recorded for the acid treated catalysts, although these values were similar to those of the commercial catalyst. Figure 7c illustrates the power density curves, where AT-Comp 50/50, AT-Comp 25/75, and Comp 25/75 exhibited peak power densities of 100 mW cm−2, outperforming the 20% PtRu/C based catalyst by 36%.
The stabilities of the best-performing catalysts were also explored using a charge-discharge cycling test (Figure 7d) with j = 5 mA cm−2. AT-Comp 50/50 catalyst demonstrated the longest stability of 137 h, which was of a noticeably extended duration when compared to the other catalysts. Moreover, 20% PtRu/C was outperformed by all the battery graphite derived catalysts tested during stability analysis, showing that the composite catalysts are significantly more stable in the harsh ZAB environment than the commercial catalyst. To evaluate the total energy storage capability, complete discharge tests were conducted, and the specific capacity (C) and specific energy density (Esp) were calculated, as shown in Figure 7e. The AT-Comp 50/50 catalyst achieved a higher specific energy density (Esp = 806 Wh kg−1) than the benchmark value for the commercial 20% PtRu/C catalyst (Esp = 759 Wh kg−1). Composite optimizations enable more efficient utilization of active materials, thereby enhancing the energy density.
The high specific energy density, coupled with consistent discharge behaviour, establishes AT-Comp 50/50 as a highly promising material for ZAB applications where high energy density and stable long-term operation are desired. A comparison of all the synthesized catalysts demonstrates that AT-Comp 50/50 is the most promising due to its balanced ORR and OER performance, high power density, excellent stability, and superior Esp. The combination of RM with its metals, rGO with higher porosity and surface area with nitrogen species included in the carbon framework not only enhances the electrochemical properties, but also provides robustness under prolonged cycling conditions, outperforming both untreated catalysts and the commercial 20% PtRu/C reference material.

4. Conclusions

This study highlights the successful valorization of black mass leach residue—a by-product of lithium-ion battery recycling—as a promising precursor for electrocatalyst synthesis. By strategically combining graphite and cobalt recovered from the leach residue with rGO derived from waste graphite, an efficient bifunctional oxygen electrocatalyst was developed and implemented as an air electrode in zinc–air batteries. The composite catalysts were synthesized using ball milling for better mixing and reducing the particle size, followed by nitrogen doping via pyrolysis, with subsequent acid treatment to remove excess metals. Among the six synthesized composite materials, AT-Comp 50/50 demonstrated the highest bifunctional activity and stability. The catalyst demonstrated outstanding performance as a zinc–air battery air electrode, reaching a power density of 100 mW cm−2 and maintaining excellent stability over 137 h of continuous charge–discharge cycling at a current density of 5 mA cm−2. The enhanced catalytic performance of AT-Comp 50/50 is primarily attributed to its increased specific surface area and optimized porosity, facilitating the effective incorporation and stabilization of active pyridinic-N and Co-Nx centers. Additionally, the formation of Co-catalyzed bamboo-like CNTs and onion-like spherical carbon species provided structural stability by encapsulating Co nanoparticles within the carbon shells, further promoting efficient electron transfer and enhancing catalyst stability. Notably, all tested composite catalysts outperformed the selected benchmark 20% PtRu/C catalyst. These findings underscore the viability of black mass leach residue as a sustainable feedstock for electrocatalyst development and demonstrate the effective use of waste graphite as a precursor for rGO synthesis. The study supports circular economy principles by promoting the smart reutilization of waste materials and contributes to the advancement of next-generation energy conversion technologies.

Supplementary Materials

The following supporting information can be downloaded at https://www.mdpi.com/article/10.3390/batteries11040165/s1, Figure S1: (a) XRD diffractogram of Raw Material and N-RM with standard cards; (b) XRD diffractograms of recovered graphite, GO, rGO and N-rGO with standard cards. Figure S2: SEM-SE micrographs of (a) Comp 25/75, (b) Comp 50/50, (c) Comp 75/25, (d) AT-Comp 25/75, (e) AT-Comp 50/50, and (f) AT-Comp 75/25 catalyst materials. Figure S3: Quantified SEM-EDS elemental maps of sample AT-Comp 50/50 and the map sum spectrum. Figure S4: TEM-EDS (a) micrograph with (b) EDS spectra of different locations. Figure S5: (a) N2 adsorption–desorption Isotherms and (b) pore size distribution data of studied materials. Figure S6: X-ray photoelectron spectra of the samples: a) O 1 s region and b) survey spectra. Figure S7: (a,c,e) ORR polarization curves of studied catalyst materials for Comp 25/75, Comp 50/50, and Comp 75/25, respectively. (b,d,f,h) Koutecky–Levich plots derived from ORR data from the RDE data (a,c,e) for Comp 25/75, Comp 50/50, and Comp 75/25, respectively. The insets of (b,d,f) show the dependence of n vs. potential. Figure S8: (a,c,e) ORR polarization curves of studied catalyst materials for AT-Comp 25/75, AT-Comp 50/50, and AT-Comp 75/25, respectively. (b,d,f) and (h) KouteckyLevich plots derived from ORR data from the RDE data (a,c,e) for Comp 25/75, Comp 50/50, and Comp 75/25, respectively. The insets of (b,d). and (f) show the dependence of n vs. potential. Table S1: Elemental compositions of the studied materials based on quantitative SEM-EDS mapping. Table S2.:The atomic percentages (at-%) of the elements for all samples measured with XPS, including peak fitting results. The error associated with each value is roughly ±10% of the value.

Author Contributions

R.P.: conceptualization, investigation, and writing—original and reviewed draft. J.S.: investigation (XPS) and writing—original and reviewed draft. M.V.: investigation (Raman) and writing—original and reviewed draft. L.K.: investigation (SEM-EDS) and writing—original and reviewed draft. B.P.W.: resources and writing—original and reviewed draft. M.L.: resources and writing—original and reviewed draft. I.K.: resources and supervision. K.L.: conceptualization, funding acquisition, investigation, project administration, and writing—original and reviewed draft. All authors have read and agreed to the published version of the manuscript.

Funding

This research was supported by the Estonian Research Council (PSG926, EAG248), and the Business Finland BATCircle3.0 project (Grant Number 1754/31/2024). In addition, this work was funded by the Ministry of Education and Research through the Centre of Excellence in Circular Economy for Strategic Mineral and Carbon Resources (01.01.2024–31.12.2030, TK228). The Research Council of Finland funded JUST Materials Research Infrastructure (RI) based at Aalto University and the OtaNano—Nanomicroscopy Center (Aalto-NMC) were utilized as part of this research.

Data Availability Statement

The raw data supporting the conclusions of this article will be made available by the authors on request.

Acknowledgments

Hua Jiang is acknowledged for their assistance with the HR-TEM measurements. ChatGPT-4o by OpenAI was used to edit text and improve the writing of this paper. The authors have reviewed and edited the output and take full responsibility for the content of this publication.

Conflicts of Interest

The authors declare no conflict of interest.

References

  1. IEA. Global EV Outlook 2024; IEA: Paris, France, 2024. [Google Scholar]
  2. Goodenough, J.B.; Park, K.S. The Li-ion rechargeable battery: A perspective. J. Am. Chem. Soc. 2013, 135, 1167–1176. [Google Scholar] [CrossRef] [PubMed]
  3. Padhi, A.K.; Nanjundaswamy, K.S.; Goodenough, J.B. Phospho-olivines as Positive-Electrode Materials for Rechargeable Lithium Batteries. J. Electrochem. Soc. 1997, 144, 1188–1194. [Google Scholar] [CrossRef]
  4. Yu, Y.X. Can all nitrogen-doped defects improve the performance of graphene anode materials for lithium-ion batteries? Phys. Chem. Chem. Phys. 2013, 15, 16819–16827. [Google Scholar] [CrossRef] [PubMed]
  5. Directorate-General for Internal Market, Industry, Entrepreneurship and SMEs (European Commission); Grohol, M.; Veeh, C. European Commission: Directorate-General for Internal Market Entrepreneurship and SMEs, I. In Study on the Critical Raw Materials for the EU 2023—Final Report; Grohol, M., Veeh, C., Eds.; Publications Office of the European Union: Luxembourg, 2023. [Google Scholar]
  6. IEA. Global Critical Minerals Outlook 2024; IEA: Paris, France, 2024. [Google Scholar]
  7. IEA. World Energy Outlook; IEA: Paris, France, 2024. [Google Scholar]
  8. IEA. Recycling of Critical Minerals; IEA: Paris, France, 2024. [Google Scholar]
  9. Natarajan, S.; Divya, M.L.; Aravindan, V. Should we recycle the graphite from spent lithium-ion batteries? The untold story of graphite with the importance of recycling. J. Energy Chem. 2022, 71, 351–369. [Google Scholar] [CrossRef]
  10. He, S.; Wu, M.; Li, S.; Jiang, Z.; Hong, H.; Cloutier, S.G.; Yang, H.; Omanovic, S.; Sun, S.; Zhang, G. Research Progress on Graphite-Derived Materials for Electrocatalysis in Energy Conversion and Storage. Molecules 2022, 27, 8644. [Google Scholar] [CrossRef] [PubMed]
  11. Morales-Torres, S.; Jiříčková, A.; Jankovský, O.; Sofer, Z.; Sedmidubský, D. Synthesis and Applications of Graphene Oxide. Materials 2022, 15, 920. [Google Scholar] [CrossRef]
  12. Larminie, J.; Dicks, A.; McDonald, M. Fuel Cell Systems Explained; John Wiley & Sons Ltd.: Chichester, UK, 2003. [Google Scholar]
  13. Yang, D.; Zhang, L.; Yan, X.; Yao, X. Recent Progress in Oxygen Electrocatalysts for Zinc–Air Batteries. Small Methods 2017, 1, 1700209. [Google Scholar] [CrossRef]
  14. Sun, J.; Wang, N.; Qiu, Z.; Xing, L.; Du, L. Recent Progress of Non-Noble Metal Catalysts for Oxygen Electrode in Zn-Air Batteries: A Mini Review. Catalysts 2022, 12, 843. [Google Scholar] [CrossRef]
  15. Liu, T.; Cai, S.; Gao, Z.; Liu, S.; Li, H.; Chen, L.; Li, M.; Guo, H. Facile synthesis of the porous FeCo@nitrogen-doped carbon nanosheets as bifunctional oxygen electrocatalysts. Electrochim. Acta 2020, 335, 135647. [Google Scholar] [CrossRef]
  16. Meng, Z.; Chen, N.; Cai, S.; Wang, R.; Guo, W.; Tang, H. Co-N-doped hierarchically ordered macro/mesoporous carbon as bifunctional electrocatalyst toward oxygen reduction/evolution reactions. Int. J. Energy Res. 2021, 45, 6250–6261. [Google Scholar] [CrossRef]
  17. Yang, L.; Wang, D.; Lv, Y.; Cao, D. Nitrogen-doped graphitic carbons with encapsulated CoNi bimetallic nanoparticles as bifunctional electrocatalysts for rechargeable Zn–Air batteries. Carbon 2019, 144, 8–14. [Google Scholar] [CrossRef]
  18. Ganesan, P.; Ishihara, A.; Staykov, A.; Nakashima, N. Recent Advances in Nanocarbon-Based Nonprecious Metal Catalysts for Oxygen/Hydrogen Reduction/Evolution Reactions and Zn-Air Battery. Bull. Chem. Soc. Jpn. 2023, 96, 429–443. [Google Scholar] [CrossRef]
  19. Xu, H.M.; Zhu, H.R.; Huang, C.J.; Zhang, Z.J.; Shuai, T.Y.; Zhan, Q.N.; Li, G.R. Recent advances in Fe-N-C- and Co-N-C-based materials as bifunctional electrocatalysts for oxygen reduction and oxygen evolution. Sci. China Chem. 2023, 67, 1137–1160. [Google Scholar] [CrossRef]
  20. Zou, X.; Tang, M.; Lu, Q.; Wang, Y.; Shao, Z.; An, L. Carbon-based electrocatalysts for rechargeable Zn–air batteries: Design concepts, recent progress and future perspectives. Energy Environ. Sci. 2024, 17, 386–424. [Google Scholar] [CrossRef]
  21. Qin, J.; Liu, Z.; Wu, D.; Yang, J. Optimizing the electronic structure of cobalt via synergized oxygen vacancy and Co-N-C to boost reversible oxygen electrocatalysis for rechargeable Zn-air batteries. Appl. Catal. B 2020, 278, 119300. [Google Scholar] [CrossRef]
  22. Li, C.; Zhou, E.; Yu, Z.; Liu, H.; Xiong, M. Tailor-made open porous 2D CoFe/SN-carbon with slightly weakened adsorption strength of ORR/OER intermediates as remarkable electrocatalysts toward zinc-air batteries. Appl. Catal. B 2020, 269, 118771. [Google Scholar] [CrossRef]
  23. Liivand, K.; Sainio, J.; Wilson, B.P.; Kruusenberg, I.; Lundström, M. Overlooked residue of Li-ion battery recycling waste as high-value bifunctional oxygen electrocatalyst for Zn-air batteries. Appl. Catal. B Environ. 2023, 332, 122767. [Google Scholar] [CrossRef]
  24. Liivand, K.; Kazemi, M.; Walke, P.; Mikli, V.; Uibu, M.; Macdonald, D.D.; Kruusenberg, I. Spent Li-Ion Battery Graphite Turned Into Valuable and Active Catalyst for Electrochemical Oxygen Reduction. ChemSusChem 2021, 14, 1103–1111. [Google Scholar] [CrossRef]
  25. Ruan, D.; Zou, K.; Du, K.; Wang, F.; Wu, L.; Zhang, Z.; Wu, X.; Hu, G. Recycling of Graphite Anode from Spent Lithium-ion Batteries for Preparing Fe-N-doped Carbon ORR Catalyst. ChemCatChem 2021, 13, 2025–2033. [Google Scholar] [CrossRef]
  26. Bian, H.; Wu, W.; Zhu, Y.; Tsang, C.H.; Cao, Y.; Xu, J.; Liao, X.; Lu, Z.; Lu, X.Y.; Liu, C.; et al. Waste to Treasure: Regeneration of Porous Co-Based Catalysts from Spent LiCoO2 Cathode Materials for an Efficient Oxygen Evolution Reaction. ACS Sustain. Chem. Eng. 2023, 11, 670–678. [Google Scholar] [CrossRef]
  27. Wang, Y.; Sheng, K.; Xu, R.; Chen, Z.; Shi, K.; Li, W.; Li, J. Efficient bifunctional 3D porous Co–N–C catalyst from spent Li–ion batteries and biomass for Zinc–Air batteries. Chem. Eng. Sci. 2023, 268, 118433. [Google Scholar] [CrossRef]
  28. Kotkar, A.; Dash, S.; Bhanja, P.; Sahu, S.; Verma, A.; Mukherjee, A.; Mohapatra, M.; Basu, S. Microwave assisted recycling of spent Li-ion battery electrode material into efficient oxygen evolution reaction catalyst. Electrochim. Acta 2023, 442, 141842. [Google Scholar] [CrossRef]
  29. Balqis, F.; Irmawati, Y.; Geng, D.; Nugroho, F.A.A.; Sumboja, A. Nanostructured Ball-Milled Ni-Co-Mn Oxides from Spent Li-Ion Batteries as Electrocatalysts for Oxygen Evolution Reaction. ACS Appl. Nano Mater. 2024, 7, 18138–18145. [Google Scholar] [CrossRef]
  30. Chernyaev, A.; Partinen, J.; Klemettinen, L.; Wilson, B.P.; Jokilaakso, A.; Lundström, M. The efficiency of scrap Cu and Al current collector materials as reductants in LIB waste leaching. Hydrometallurgy 2021, 203, 105608. [Google Scholar] [CrossRef]
  31. Praats, R.; Sainio, J.; Vikberg, M.; Klemettinen, L.; Wilson, B.P.; Lundström, M.; Kruusenberg, I.; Liivand, K. Utilizing waste lithium-ion batteries for the production of graphite-carbon nanotube composites as oxygen electrocatalysts in zinc–air batteries. RSC Sustain. 2025, 3, 546–556. [Google Scholar] [CrossRef]
  32. Praats, R.; Chernyaev, A.; Sainio, J.; Lundström, M.; Kruusenberg, I.; Liivand, K. Supporting critical raw material circularity—Upcycling graphite from waste LIBs to Zn–air batteries. Green Chem. 2024, 26, 2874–2883. [Google Scholar] [CrossRef]
  33. Regulation (EU) 2023/1542 of the European Parliament and of the Council of 12 July 2023 Concerning Batteries and Waste Batteries, Amending Directive 2008/98/EC and Regulation (EU) 2019/1020 and Repealing Directive 2006/66/EC (Text. with EEA Relevance); European Union: Brussels, Belgium, 2023. [Google Scholar]
  34. Kazemi, M.; Liivand, K.; Prato, M.; Vacek, P.; Walmsley, J.; Dante, S.; Divitini, G.; Kruusenberg, I. Graphite and Cobalt Recycled from Li-Ion Batteries: A Valuable Raw Material for Oxygen Reduction Reaction Electrocatalysts. Energy Fuels 2023, 38, 659–670. [Google Scholar] [CrossRef]
  35. Balachandran, S.; Forsberg, K.; Lemaître, T.; Vieceli, N.; Lombardo, G.; Petranikova, M. Comparative Study for Selective Lithium Recovery via Chemical Transformations during Incineration and Dynamic Pyrolysis of EV Li-Ion Batteries. Metals 2021, 11, 1240. [Google Scholar] [CrossRef]
  36. Wang, W.; Zhang, Y.; Liu, X.; Xu, S. A simplified process for recovery of Li and Co from spent LiCoO2 cathode using Al foil as the in situ reductant. ACS Sustain. Chem. Eng. 2019, 7, 12222–12230. [Google Scholar] [CrossRef]
  37. Zhai, L.F.; Kong, S.Y.; Zhang, H.; Tian, W.; Sun, M.; Sun, H.; Wang, S. Facile synthesis of Co-N-rGO composites as an excellent electrocatalyst for oxygen reduction reaction. Chem. Eng. Sci. 2019, 194, 45–53. [Google Scholar] [CrossRef]
  38. Kang, J.; Kim, Y.; Kim, H.M.; Hu, X.; Saito, N.; Choi, J.H.; Lee, M.H. In-situ one-step synthesis of carbon-encapsulated naked magnetic metal nanoparticles conducted without additional reductants and agents. Sci. Rep. 2016, 6, 38652. [Google Scholar] [CrossRef] [PubMed]
  39. Zhang, X.; Zhang, K.; Zhang, W.; Zhang, X.; Wang, L.; An, Y.; Sun, X.; Li, C.; Wang, K.; Ma, Y. Carbon Nano-Onion-Encapsulated Ni Nanoparticles for High-Performance Lithium-Ion Capacitors. Batteries 2023, 9, 102. [Google Scholar] [CrossRef]
  40. Ferrari, A.C.; Robertson, J. Interpretation of Raman spectra of disordered and amorphous carbon. Phys. Rev. B 1999, 61, 14095–14107. [Google Scholar] [CrossRef]
  41. Perumbilavil, S.; Sankar, P.; Priya Rose, T.; Philip, R. White light Z-scan measurements of ultrafast optical nonlinearity in reduced graphene oxide nanosheets in the 400–700 nm region. Appl. Phys. Lett. 2015, 107, 051104. [Google Scholar] [CrossRef]
  42. Gao, W.; Alemany, L.B.; Ci, L.; Ajayan, P.M. New insights into the structure and reduction of graphite oxide. Nat. Chem. 2009, 1, 403–408. [Google Scholar] [CrossRef]
  43. Sing, K.S.W.; Everett, D.H.; Haul, R.A.W.; Moscou, L.; Pierotti, R.A.; Rouquerol, J.; Siemieniewska, T. Reporting Physisorption Data for Gas/Solid Systems with Special Reference to the Determination of Surface Area and Porosity. Pure Appl. Chem. 1985, 57, 603–619. [Google Scholar] [CrossRef]
  44. Rouquerol, J.; Rouquerol, F.; Llewellyn, P.; Maurin, G.; Sing, K.S.W. Adsorption by Powders and Porous Solids: Principles, Methodology and Applications, 2nd ed.; Elsevier: Amsterdam, The Netherlands, 2013. [Google Scholar]
  45. Wu, B.; Mi, J.L.; Hu, H.; Zu, Z.Y.; Liu, L. Fe-, S-, and N-Doped Carbon Nanotube Networks as Electrocatalysts for the Oxygen Reduction Reaction. ACS Appl. Nano Mater. 2020, 3, 12297–12307. [Google Scholar] [CrossRef]
  46. Lu, A.H.; Li, W.C.; Salabas, E.L.; Spliethoff, B.; Schüth, F. Low temperature catalytic pyrolysis for the synthesis of high surface area, nanostructured graphitic carbon. Chem. Mater. 2006, 18, 2086–2094. [Google Scholar] [CrossRef]
  47. Okpalugo, T.I.T.; Papakonstantinou, P.; Murphy, H.; McLaughlin, J.; Brown, N.M.D. High resolution XPS characterization of chemical functionalised MWCNTs and SWCNTs. Carbon 2005, 43, 153–161. [Google Scholar] [CrossRef]
  48. NIST X-Ray Photoelectron Spectroscopy (XPS) Database Number 20; National Institute of Standards and Technology: Gaithersburg, MD, USA, 2000.
  49. Kousar, A.; Pande, I.; Pascual, L.F.; Peltola, E.; Sainio, J.; Laurila, T. Modulating the Geometry of the Carbon Nanofiber Electrodes Provides Control over Dopamine Sensor Performance. Anal. Chem. 2023, 95, 2983–2991. [Google Scholar] [CrossRef]
  50. Susi, T.; Pichler, T.; Ayala, P. X-ray photoelectron spectroscopy of graphitic carbon nanomaterials doped with heteroatoms. Beilstein J. Nanotechnol. 2015, 6, 177–192. [Google Scholar] [CrossRef] [PubMed]
  51. Chen, S.; Bi, J.; Zhao, Y.; Yang, L.; Zhang, C.; Ma, Y.; Wu, Q.; Wang, X.; Hu, Z. Nitrogen-doped carbon nanocages as efficient metal-free electrocatalysts for oxygen reduction reaction. Adv. Mater. 2012, 24, 5593–5597. [Google Scholar] [CrossRef] [PubMed]
  52. Cao, T.; Wang, D.; Zhang, J.; Cao, C.; Li, Y. Bamboo-Like Nitrogen-Doped Carbon Nanotubes with Co Nanoparticles Encapsulated at the Tips: Uniform and Large-Scale Synthesis and High-Performance Electrocatalysts for Oxygen Reduction. Chem.—Eur. J. 2015, 21, 14022–14029. [Google Scholar] [CrossRef] [PubMed]
  53. Biesinger, M.C.; Payne, B.P.; Grosvenor, A.P.; Lau, L.W.M.; Gerson, A.R.; Smart, R.S.C. Resolving surface chemical states in XPS analysis of first row transition metals, oxides and hydroxides: Cr, Mn, Fe, Co and Ni. Appl. Surf. Sci. 2011, 257, 2717–2730. [Google Scholar] [CrossRef]
  54. Wang, Y.; Nie, Y.; Ding, W.; Chen, S.G.; Xiong, K.; Qi, X.Q.; Zhang, Y.; Wang, J.; Wei, Z.D. Unification of catalytic oxygen reduction and hydrogen evolution reactions: Highly dispersive Co nanoparticles encapsulated inside Co and nitrogen co-doped carbon. Chem. Commun. 2015, 51, 8942–8945. [Google Scholar] [CrossRef]
  55. Yao, Y.; Chen, H.; Lian, C.; Wei, F.; Zhang, D.; Wu, G.; Chen, B.; Wang, S. Fe, Co, Ni nanocrystals encapsulated in nitrogen-doped carbon nanotubes as Fenton-like catalysts for organic pollutant removal. J. Hazard. Mater. 2016, 314, 129–139. [Google Scholar] [CrossRef]
  56. Xue, H.; Meng, A.; Lian, T.; Yang, T.; Gao, J.; Singh, C.V.; Geng, Z.; Chen, L.; Li, Z. Co-Pyridinic-N Bond Constructed at the Interface of CoxP and N-Doped Carbon to Effectively Facilitate Oxygen Reduction. ACS Sustain. Chem. Eng. 2023, 11, 5238–5249. [Google Scholar] [CrossRef]
  57. Kim, J.H.; Park, S.K.; Oh, Y.J.; Kang, Y.C. Hierarchical hollow microspheres grafted with Co nanoparticle-embedded bamboo-like N-doped carbon nanotube bundles as ultrahigh rate and long-life cathodes for rechargeable lithium-oxygen batteries. Chem. Eng. J. 2018, 334, 2500–2510. [Google Scholar] [CrossRef]
  58. Zhang, J.; Zhang, T.; Ma, J.; Wang, Z.; Liu, J.; Gong, X. ORR and OER of Co–N codoped carbon-based electrocatalysts enhanced by boundary layer oxygen molecules transfer. Carbon 2021, 172, 556–568. [Google Scholar] [CrossRef]
Figure 1. Flowsheet of catalyst material synthesis.
Batteries 11 00165 g001
Figure 2. XRD patterns of studied composite materials together with standard cards.
Batteries 11 00165 g002
Figure 3. HRTEM micrographs of (a) Comp 25/75, (b) Comp 50/50, (c) Comp 75/25, (d) AT-Comp 25/75, (e) AT-Comp 50/50, and (f) AT-Comp 75/25.
Batteries 11 00165 g003
Figure 4. Raman spectra of Raw material, rGO, Comp 25/75, Comp 50/50, Comp 75/25, AT-Comp 25/75, AT-Comp 50/50, and AT-Comp 75/25 materials.
Batteries 11 00165 g004
Figure 5. X-ray photoelectron spectra of the samples: (a) C 1 s region, (b) N 1 s region, and (c) Co 2p region.
Batteries 11 00165 g005
Figure 6. (a) ORR polarization curves at 1600 rpm in O2 saturated 0.1 M KOH solution, and (b) OER curves at 1600 rpm in N2 saturated 1 M KOH solution of the studied catalyst materials.
Batteries 11 00165 g006
Figure 7. ZAB results for studied catalysts: (a) Open-circuit potential; (b) Charge and discharge polarization curves; (c) Power density curves; (d) Galvanostatic charge/discharge cycling with 30 min discharge and charge time; (e) Complete discharge test.
Batteries 11 00165 g007
Table 1. Metal content of the Raw Material (wt%).
ElementLiCoMnNiCuFe
Concentration in Raw Material (wt%)0.918.61.30.80.20.1
Standard error of mean (+/− wt%)±0.02±1.13±0.03±0.02±0.01±0.01
Table 2. Specific surface areas of the materials studied, measured with BET and DFT methods.
Sample NameRaw MaterialN-RMrGON-rGOComp 25/75Comp 50/50Comp 75/25AT-Comp 25/75AT-Comp 50/50AT-Comp 75/25
SBET (m2/g)1.951.3280.5211.7149.077.763.5183.3124.690.1
SDFT (m2/g)2.737.9239.8188.5126.564.552.9156.0105.675.0
Table 3. Summary of electrochemical properties of the studied catalyst materials.
CatalystORROER
Eonset (V vs. RHE)E1/2 (V vs. RHE)j (mA cm−2)E (V) @ 10 mA cm−2ΔE
N-RM0.8520.7274.251.6740.885
N-rGO0.8970.7803.52--
Comp 25/750.8870.7774.671.6310.853
Comp 50/500.8950.7924.451.6210.828
Comp 75/250.8750.7774.051.6240.846
AT-Comp 25/750.8950.7904.061.6340.842
AT-Comp 50/500.9120.8204.631.6390.818
AT-Comp 75/250.8870.7974.221.6320.834
Disclaimer/Publisher’s Note: The statements, opinions and data contained in all publications are solely those of the individual author(s) and contributor(s) and not of MDPI and/or the editor(s). MDPI and/or the editor(s) disclaim responsibility for any injury to people or property resulting from any ideas, methods, instructions or products referred to in the content.

