Article

Exploring the Flow and Mass Transfer Characteristics of an All-Iron Semi-Solid Redox Flow Battery

1
School of Mechanical Electronic and Control Engineering, BeijingJiaotong University, Beijing 100044, China
2
Beijing Key Laboratory of Flow and Heat Transfer of Phase Changing in Micro and Small Scale, Beijing 100044, China
*
Author to whom correspondence should be addressed.
Batteries 2025, 11(4), 166; https://doi.org/10.3390/batteries11040166
Submission received: 1 March 2025 / Revised: 7 April 2025 / Accepted: 19 April 2025 / Published: 21 April 2025

Abstract

:
To improve the flow mass transfer inside the electrodes and the efficiency of an all-iron redox flow battery, a semi-solid all-iron redox flow battery is presented experimentally. A slurry electrode is designed to replace the traditional porous electrode. Moreover, the effects of an additional external magnetic field are further investigated in the semi-solid battery experiment. The results show that the mass transfer of the slurry in the battery flow channel and the prolonged discharge time are significantly affected by the additional external magnetic fields. In addition, a three-dimensional model of the semi-solid all-iron redox flow battery is presented in detail, and it is verified to be reliable by experimental data. The simulation results show that the ion concentration distributions in the battery become more uniform with the increase in the flow rate and the initial concentration. Furthermore, it is also found that the size of the flow channel influences the mass transfer efficiency of the slurry. After optimizing the flow channel, it is found that when the flow channel length of the slurry inlet and outlet section is 2 cm, the operating efficiency of the semi-solid battery shows an increasing trend. This work provides comprehensive insight into the improvement of the performances of flow batteries, which will be conducive to the practical application of flow batteries.

1. Introduction

Redox flow batteries (RFBs) have seen a renewed interest as one of the most promising candidates for large-scale energy storage applications in power grids due to their independent design of energy storage capacity and power, high security, and long-life cycles. The all-iron semi-solid RFB is based on a slurry electrode, which is also called a flow electrode or semi-solid electrode. It is made of solid conductive particles suspended in an electrolyte to replace a traditional solid electrode. The solid conductive particles are not involved in redox reactions in the electrolyte. Compared with the traditional all-vanadium RFBs, the all-iron semi-solid RFBs show significantly lower material costs. Meanwhile, all-vanadium RFBs need to strictly prevent cross-contamination of the positive and negative electrolyte (e.g., vanadium ion infiltration leading to capacity degradation), whereas iron-based systems are less affected by cross-contamination because the positive and negative active substances are in different valence states of iron [1]. At present, the slurry electrode has been used in a variety of electrochemical studies [2,3,4,5,6,7]. During the charging and discharging process of the battery, the slurry is pumped into the battery as it is in the operation of a traditional RFB. A continuous conductive network is formed in the slurry electrode when the volume fraction of solid particles is high enough. Then, the reaction will occur at the surfaces of the solid particles in the slurry. When the slurry flows through the cell and returns to the external reservoir, the reacting particles in the electrolyte are carried along.
Cho et al. [8] used the slurry electrode prepared by mixing functionalized carbon nanotubes and activated carbon particles so that more activated carbon particles could effectively participate in the desalination process, which greatly increased the conductivity of the slurry electrode. Campos et al. [7] pointed out that increasing the volume fraction of carbon particles can help the slurry electrode form a continuous conductive network, which improves the conductivity of the slurry electrode. They also found that medium-sized spherical carbon particles can achieve a higher capacitance. Dennison et al. [9] found that the resistance of the contact interface between a collector and a slurry electrode was relatively high, and it could be reduced by increasing the flow rate. It was also found that the ionic concentration of electrolytes has a strong effect on the conductivity of the slurry electrode. Lohaus et al. [10] proposed a method to establish a static model for a semi-solid all-vanadium RFB using a slurry electrode. The simulation results showed that there was a critical threshold for the volume fraction in the slurry electrode system. As the volume fraction of solid conductive particles increased, the formed conductive network had a greater impact on the charge transfer. Exceeding the critical threshold could cause the electrochemical cell to fail to operate. Brunini et al. [11] established a three-dimensional model of semi-solid lithium-ion RFBs based on hydrodynamic and electrochemical effects. They quantified the state of charge (SOC) gradient formed at low flow rates and its effect on the spatial inhomogeneity of the internal current density in the battery. Hoyt et al. [12] proposed a mathematical model of electrochemical flow capacitance based on a three-dimensional macroscopic balance. The model can accurately predict the steady-state current obtained by the flowing capacitor during the charging process. Subsequently, a three-dimensional macroscopic homogeneous equation model combining the Faraday current effect and the non-Faraday current effect was proposed. This model was used to study the performance of the slurry electrode in an asymmetric electrochemical cell. It could also predict the application of the slurry electrode. Moreover, the steady-state current that could be obtained helped to optimize the choice of solid particles and could better target the design of the capacitors or RFBs based on slurry electrodes. Chayambuka et al. [13] proposed a new pseudo-three-dimensional, multi-scale, multi-physics method for simulating a semi-solid battery based on slurry electrodes, which could simulate the semi-solid state in a non-flowing or flowing state. The established model was used to study the voltage distribution of the active particles in the slurry over time and the space-based state-of-charge distribution. This model is suitable for any other type of semi-solid battery. Petek et al. [14] found in an experimental study of a semi-solid all-iron RFB that the performance of the battery was improved by the slurry electrodes. Then, they [15] further studied different slurry electrode configurations. They discussed three-slurry electrode systems in different environments: in deionized water treatment, in a flow capacitor, and in an RFB. The research on the semi-solid RFBs based on the slurry electrode is still in its infancy. Yang et al. [16] proposed a three-dimensional coupled multi-physics field model of a semi-solid liquid-fluid battery, which includes the hydrodynamics of the slurry flow and the transport of solid lithium in the particles and the mass balance in the storage tank. Fang et al. [17] developed a three-dimensional numerical model of slurry redox flow batteries (SRFBs) and verified its accuracy by experiments. The multiphysics simulation demonstrates that the rectangular section is more suitable for SRFBs than the triangular and circular sections for the flow channels. Devi et al. [18] studied the effect of carbon black on the performance of slurry electrodes, and various surface modifications of carbon black were carried out to further improve the electrode performance.
Some related experiments and simulations have appeared, but the obtained research results, such as the energy efficiency, cannot meet the needs of practical applications. Further exploration and improvement are needed. In this paper, the first systematic study of the mechanism of the effect of an external magnetic field on the formation of the conductive network and the inhibition of iron deposition in semi-solid RFBs is done, and a new strategy of optimizing the flow channel geometry and synergizing the magnetic field to improve the mass transfer efficiency is proposed.

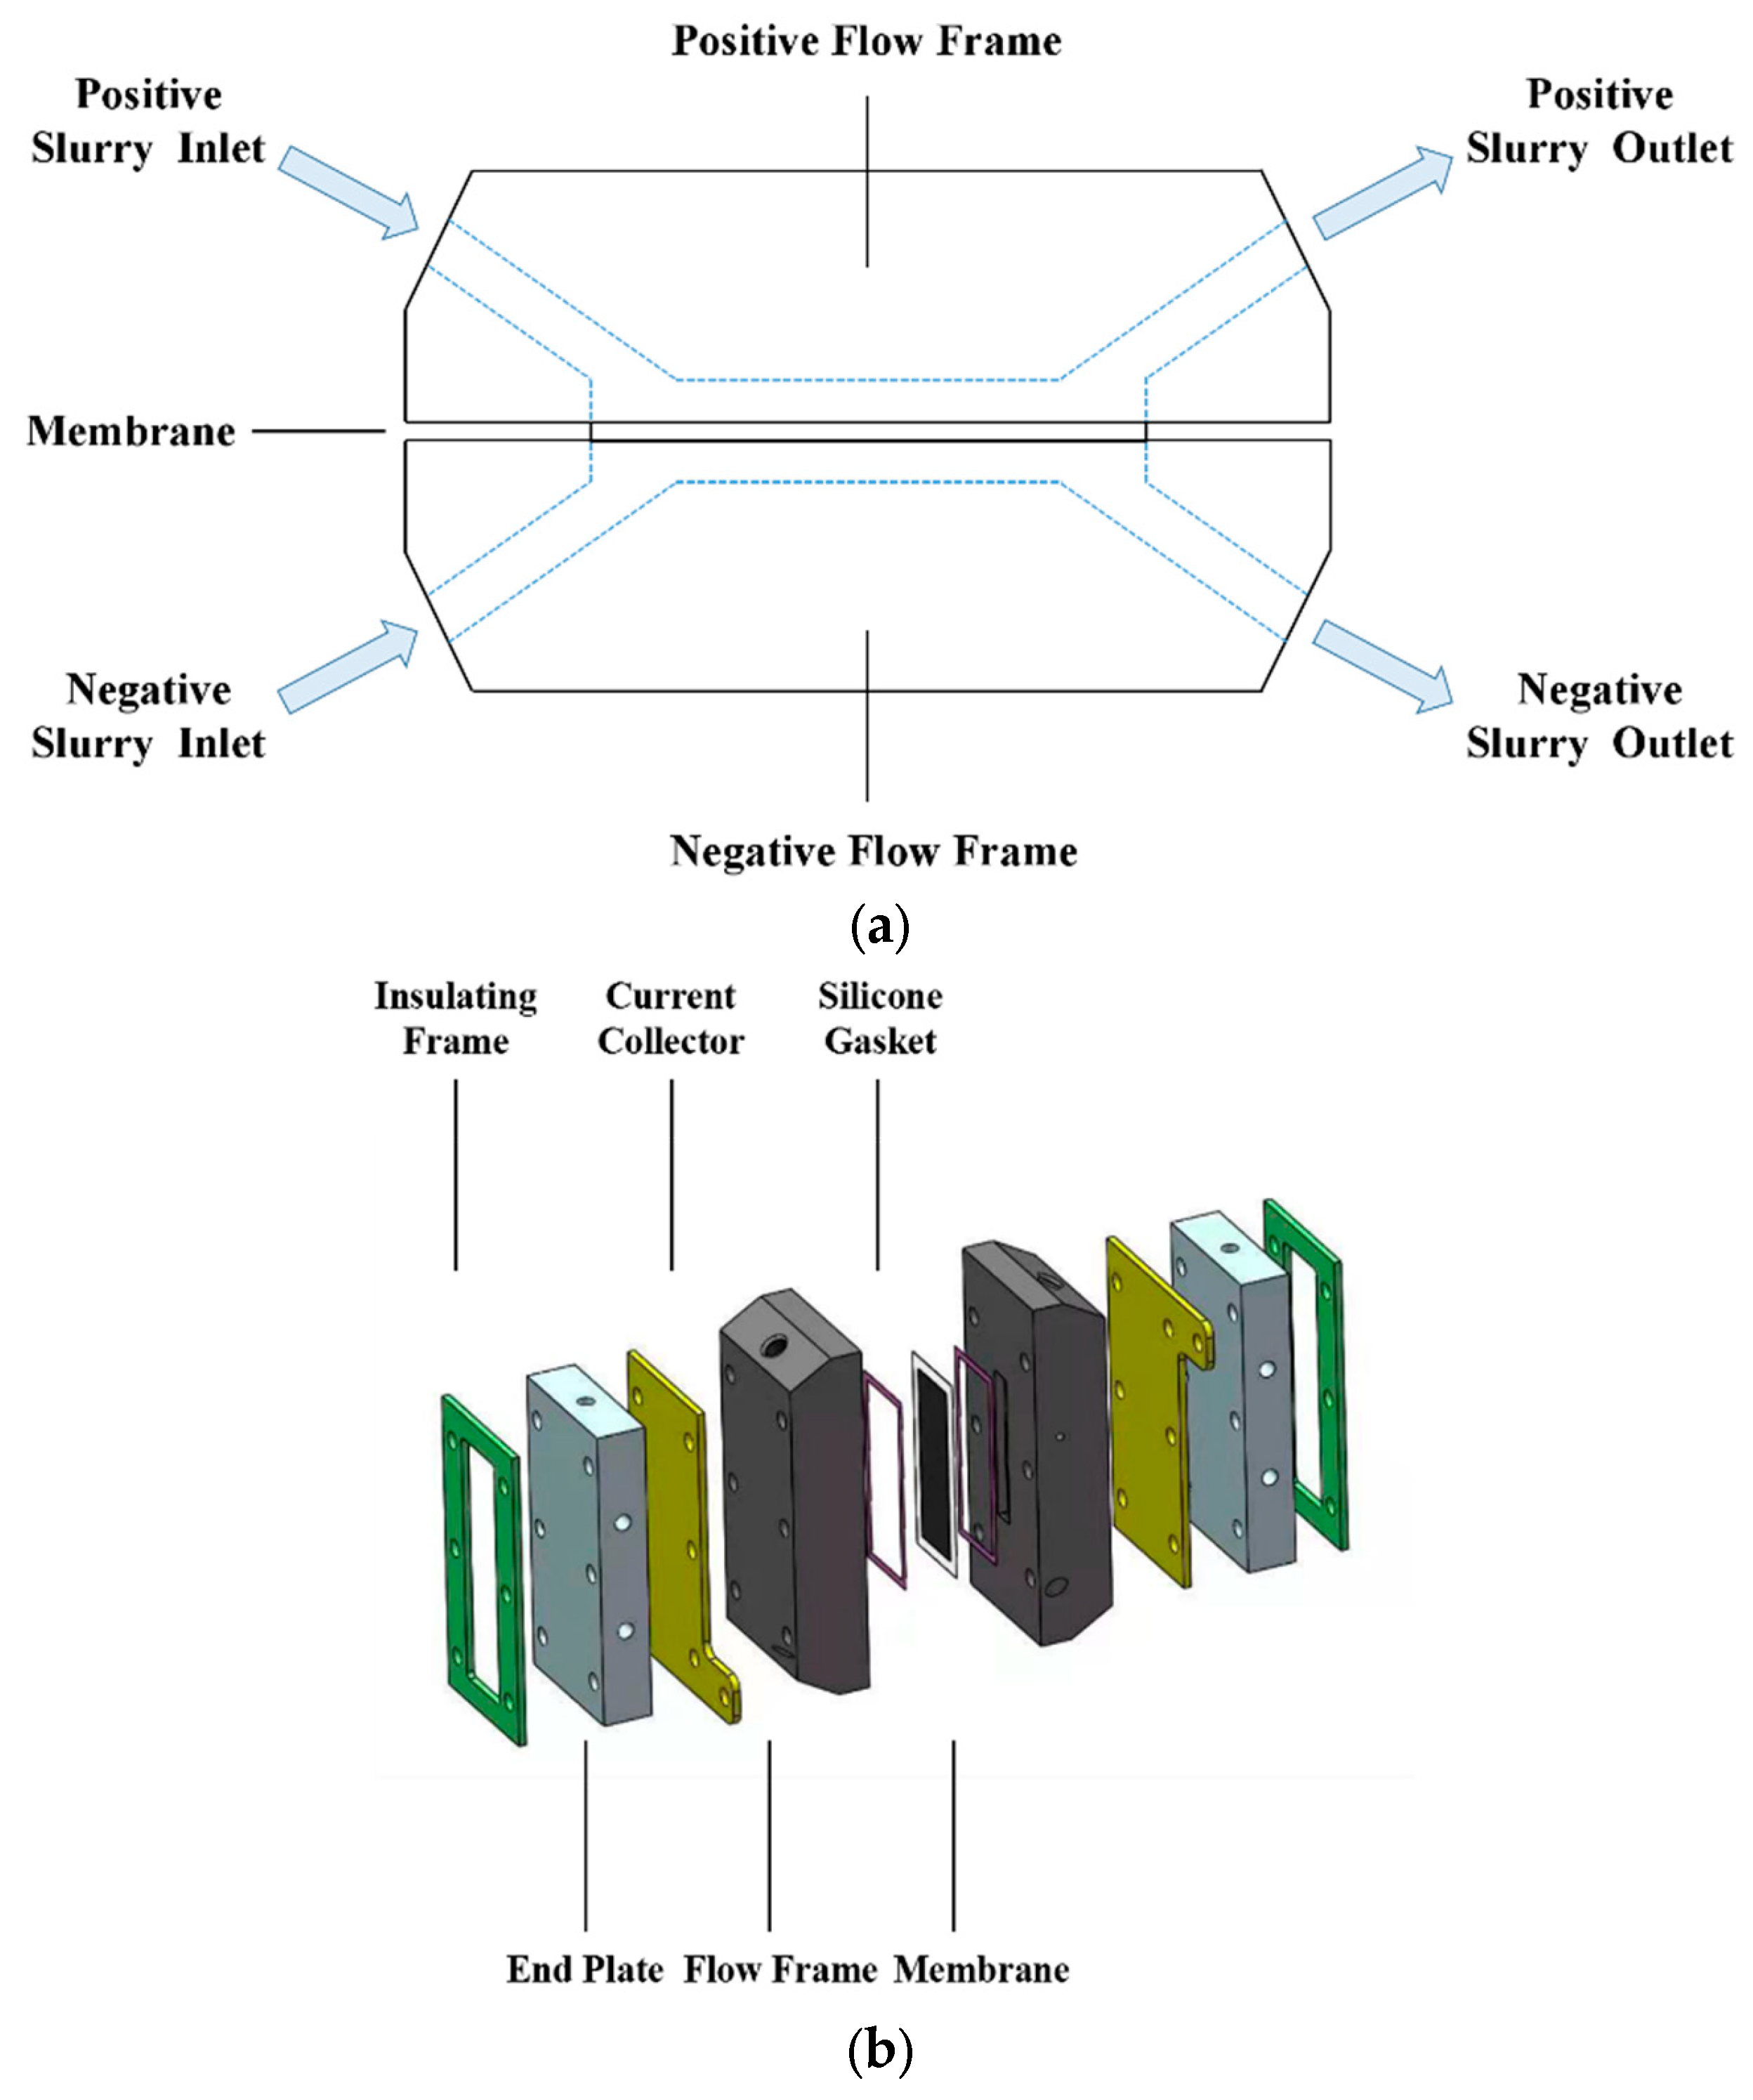
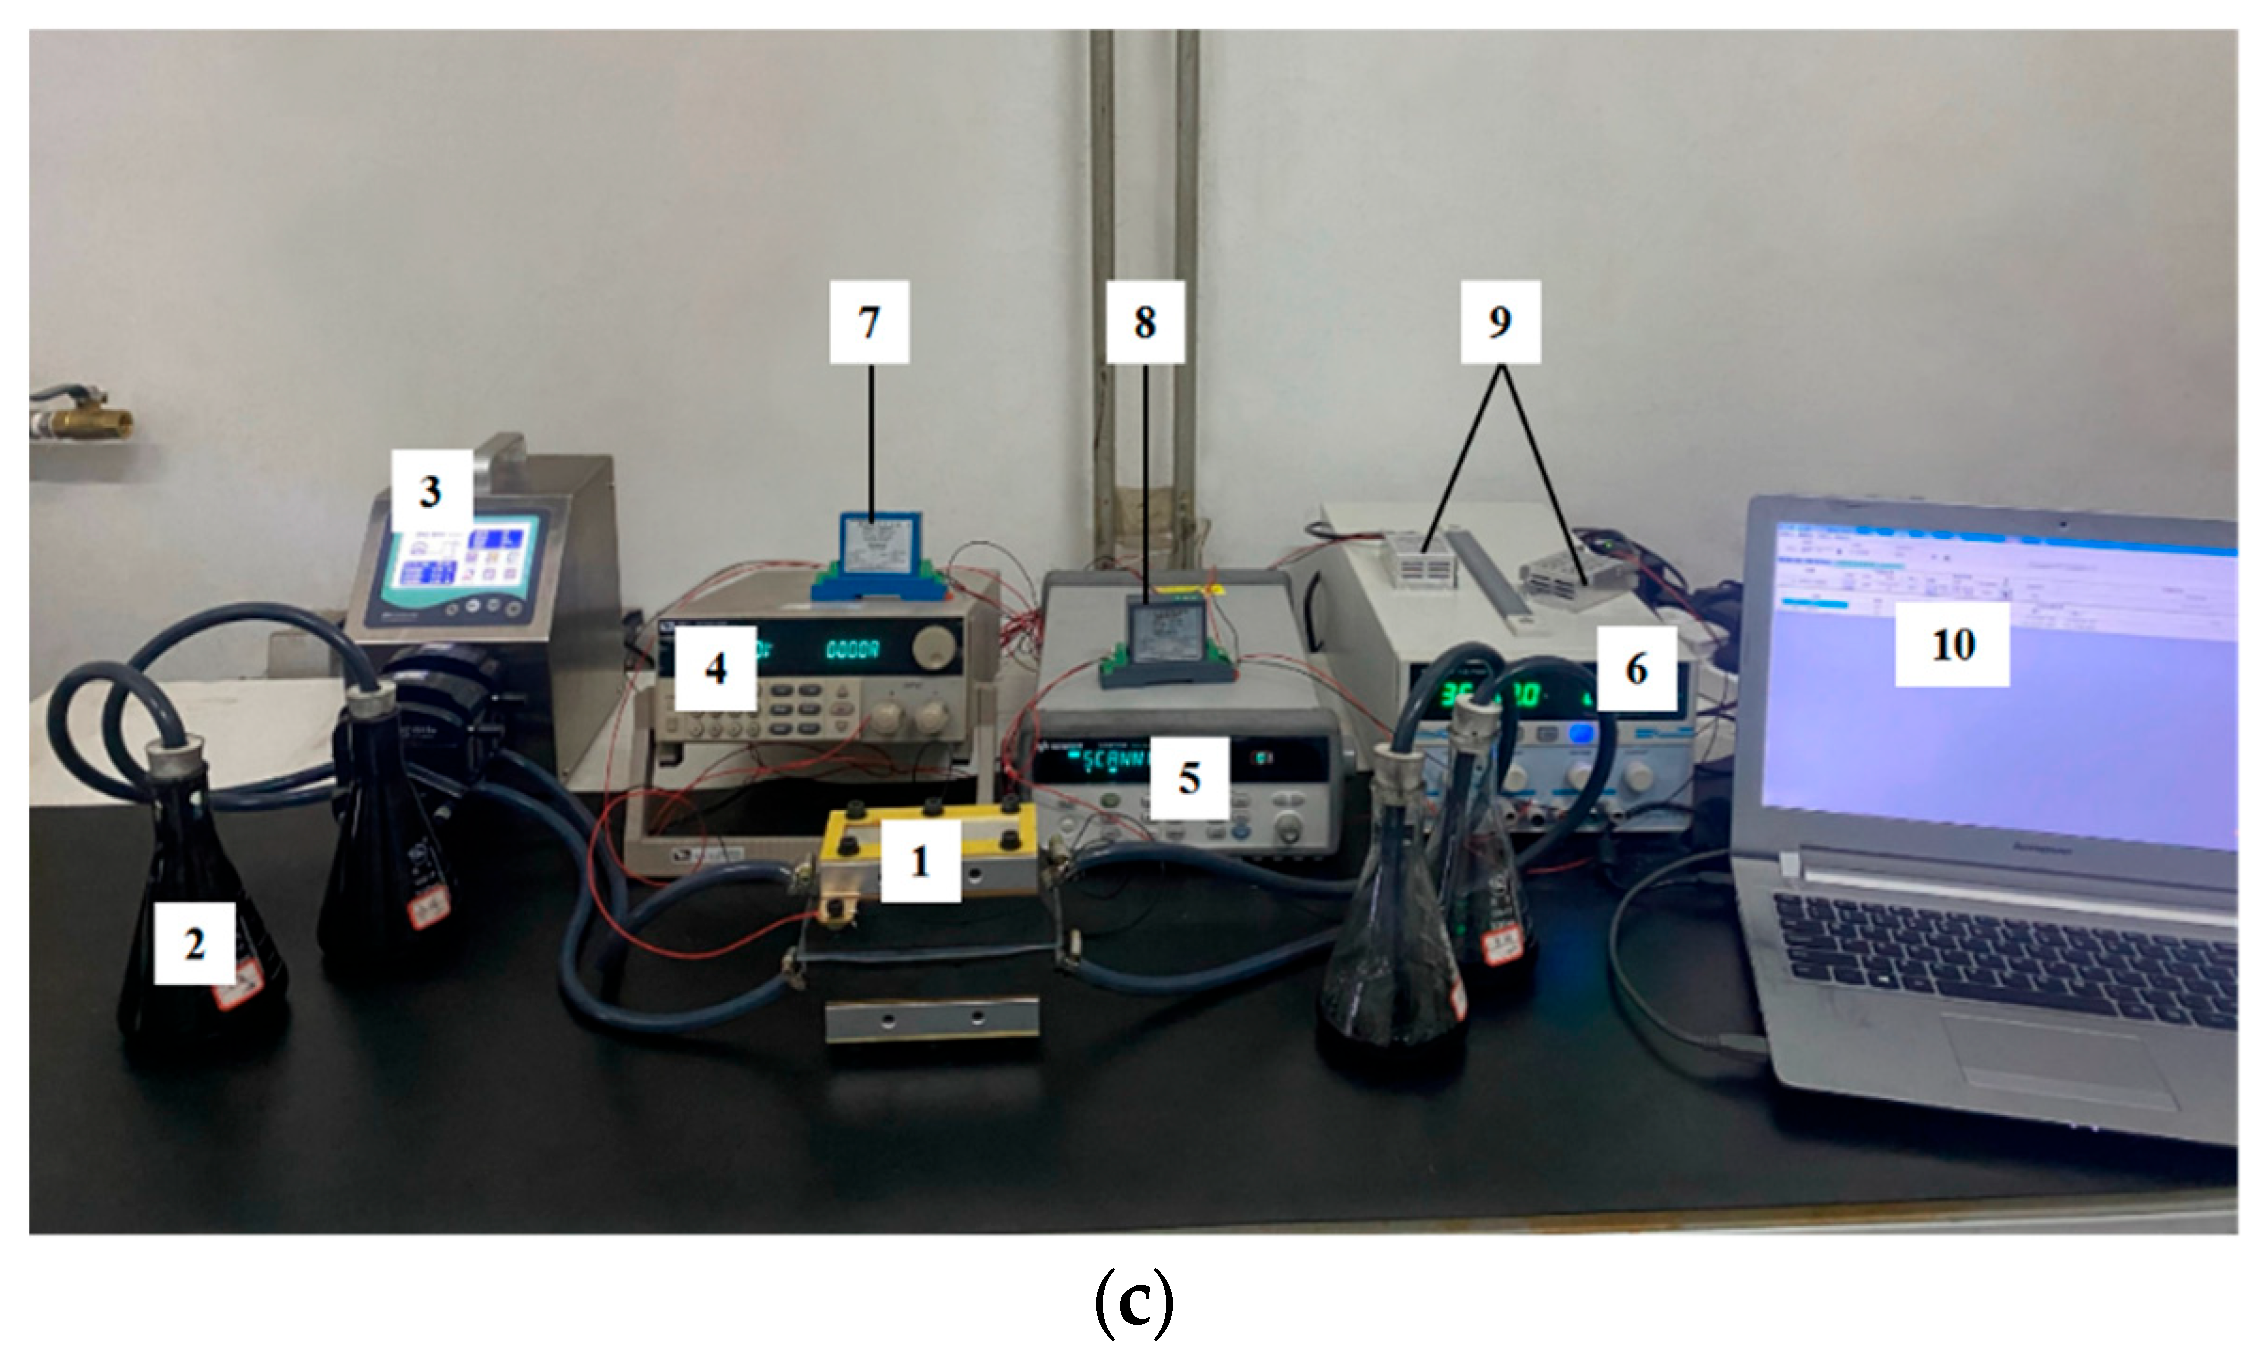
2. Experimental Set-Up

2.1. Preparation

In this paper, a semi-solid all-iron RFB was fabricated by referring to the design of the electrochemical flow cell proposed by Petek et al. [14]. As shown in Figure 1a, the inlet and outlet passage of the battery was set at an angle of about 30°. This design can effectively overcome the shortcoming of flow channel blockages. The lengths of the inlet and outlet sections of the semi-solid all-iron RFB were about 3 cm. The flow channel section was a circle with a diameter of 1 cm. The flow channel section on both sides of the membrane was about 6 cm long, 1 cm wide, and 0.4 cm deep. The area of the activation reaction zone on the side was 6 cm2.
The main components of the semi-solid all-iron RFB are shown in Figure 1b, and the physical diagram of the battery is shown in Figure 1c. In the current experiment, there is no refinement to account for the self-discharge phenomenon caused by the active metallic species through the membrane. The slurry electrode of the semi-solid all-iron RFB was made up of an electrolyte, multi-walled carbon nanotubes (MWCNTs), and deionized water. To dissolve the reagent in water better, an agate mortar was used to grind and refine the FeCl3·6H2O, FeCl2, and NH4Cl, and the mortar was weighed with an electronic balance. Electrolytes were added to the deionized water several times. During this process, a glass rod was used to manually stir until the electrolyte was fully dissolved. Then, 12-wt% MWCNTs and 1-wt% carbon nanotube dispersant were added to it. An electric stirrer was used to stir at 800 rpm for 30 min. Finally, the mixed solution was fully oscillated in an ultrasonic washer, and the power was set to 600 W. The room temperature was controlled to 30 °C. The ultrasonic process was conducted for 2 h to ensure the solid active particles were uniformly dispersed in the slurry electrode.
During the configuration of the slurry electrode, it should be noted that since Fe2+ was easily oxidized by air, nitrogen needed to be used for purging during the configuration to avoid oxidation reactions as much as possible. In addition, to prevent the solid active particles from clumping and settling, the slurry electrode needed to be prepared and used immediately. The conductivity of the configured slurry electrode was measured by a conductivity meter, as shown in Table 1.

2.2. Measurements

In the charging experiment, the configured slurry electrode was pumped into a single cell. The charging process was controlled by the DC power supply. The voltage value began to increase slowly from 0 V until it reached 1.0 V. Then, the voltage was limited at the current voltage state for every 0.1-V increase, which was maintained for 2 min to be stable. The cycling data were tested by a constant voltage until the voltage value gradually increased to close to 1.7 V to ensure a sufficient charge capacity.
Furthermore, a strong neodymium iron boron magnet was used to generate a magnetic field. The effects of the magnetic field on the semi-solid all-iron RFB were studied. The selected circular magnet had a diameter of 20 mm and a thickness of 5 mm. The magnetic field strength of a single magnet was about 2000 Gs. In this experiment, 10, 30, and 50 magnets were placed on both sides of the semi-solid all-iron RFB to conduct a comparative study.

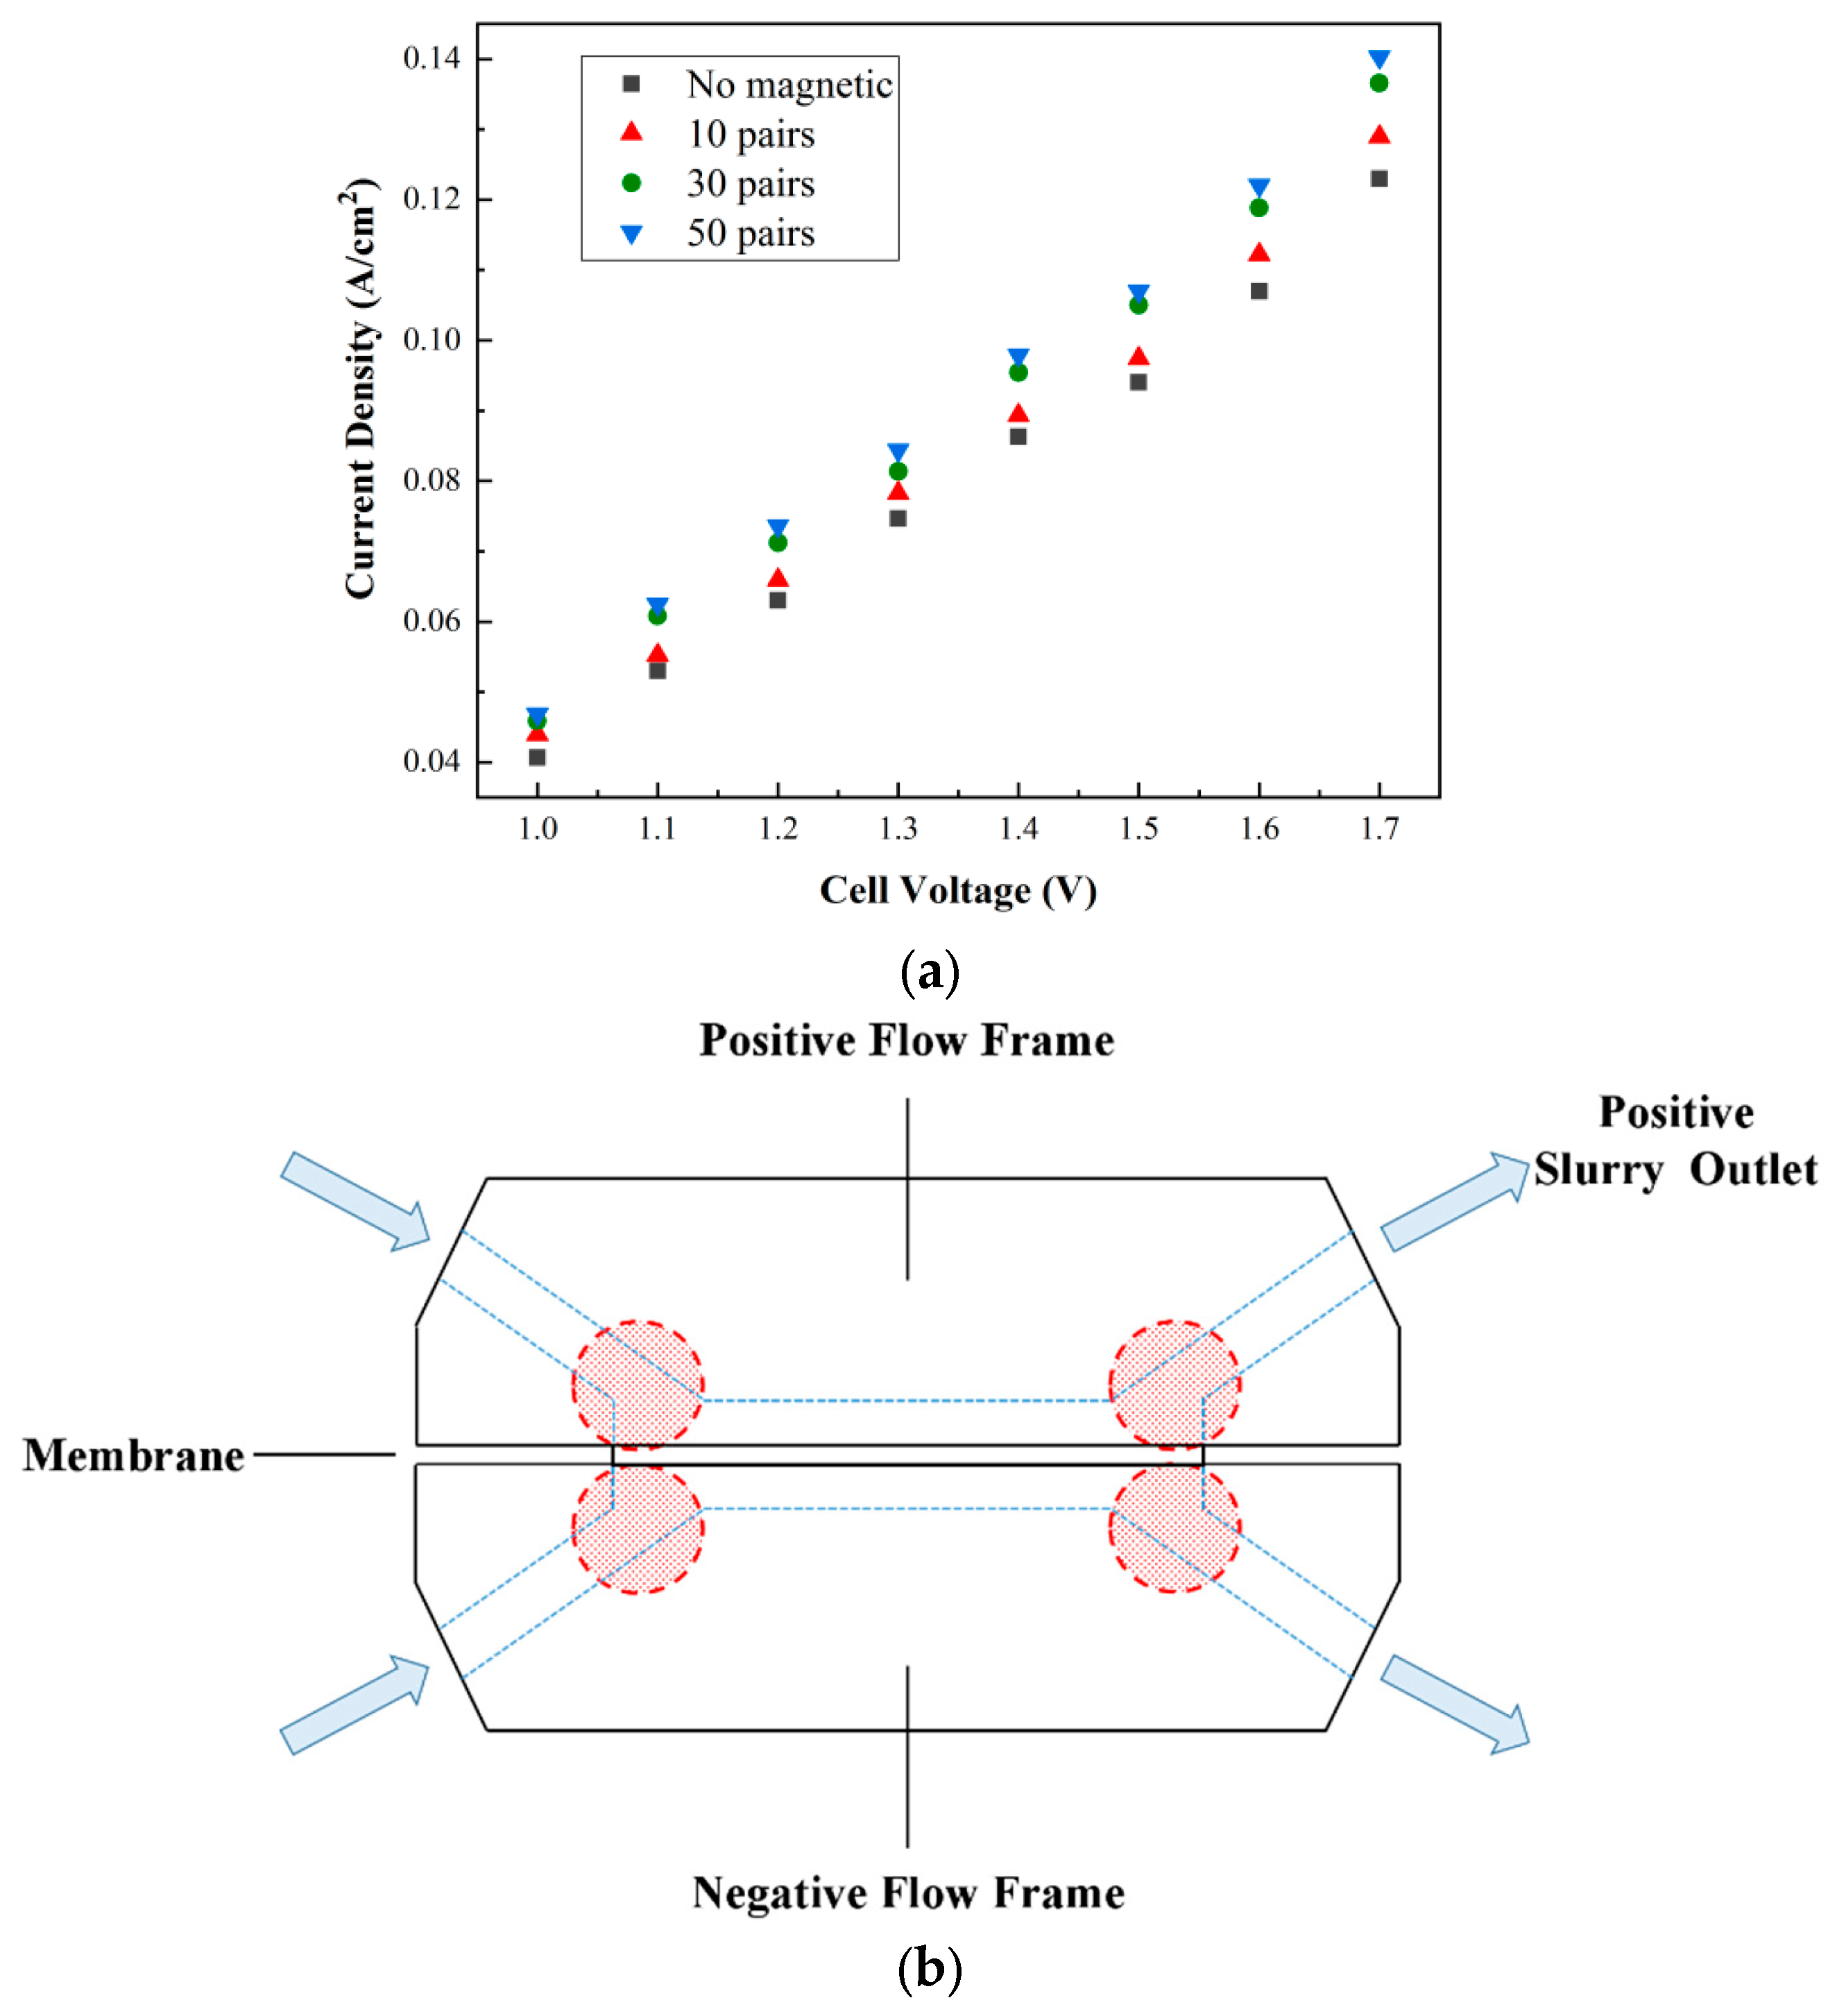
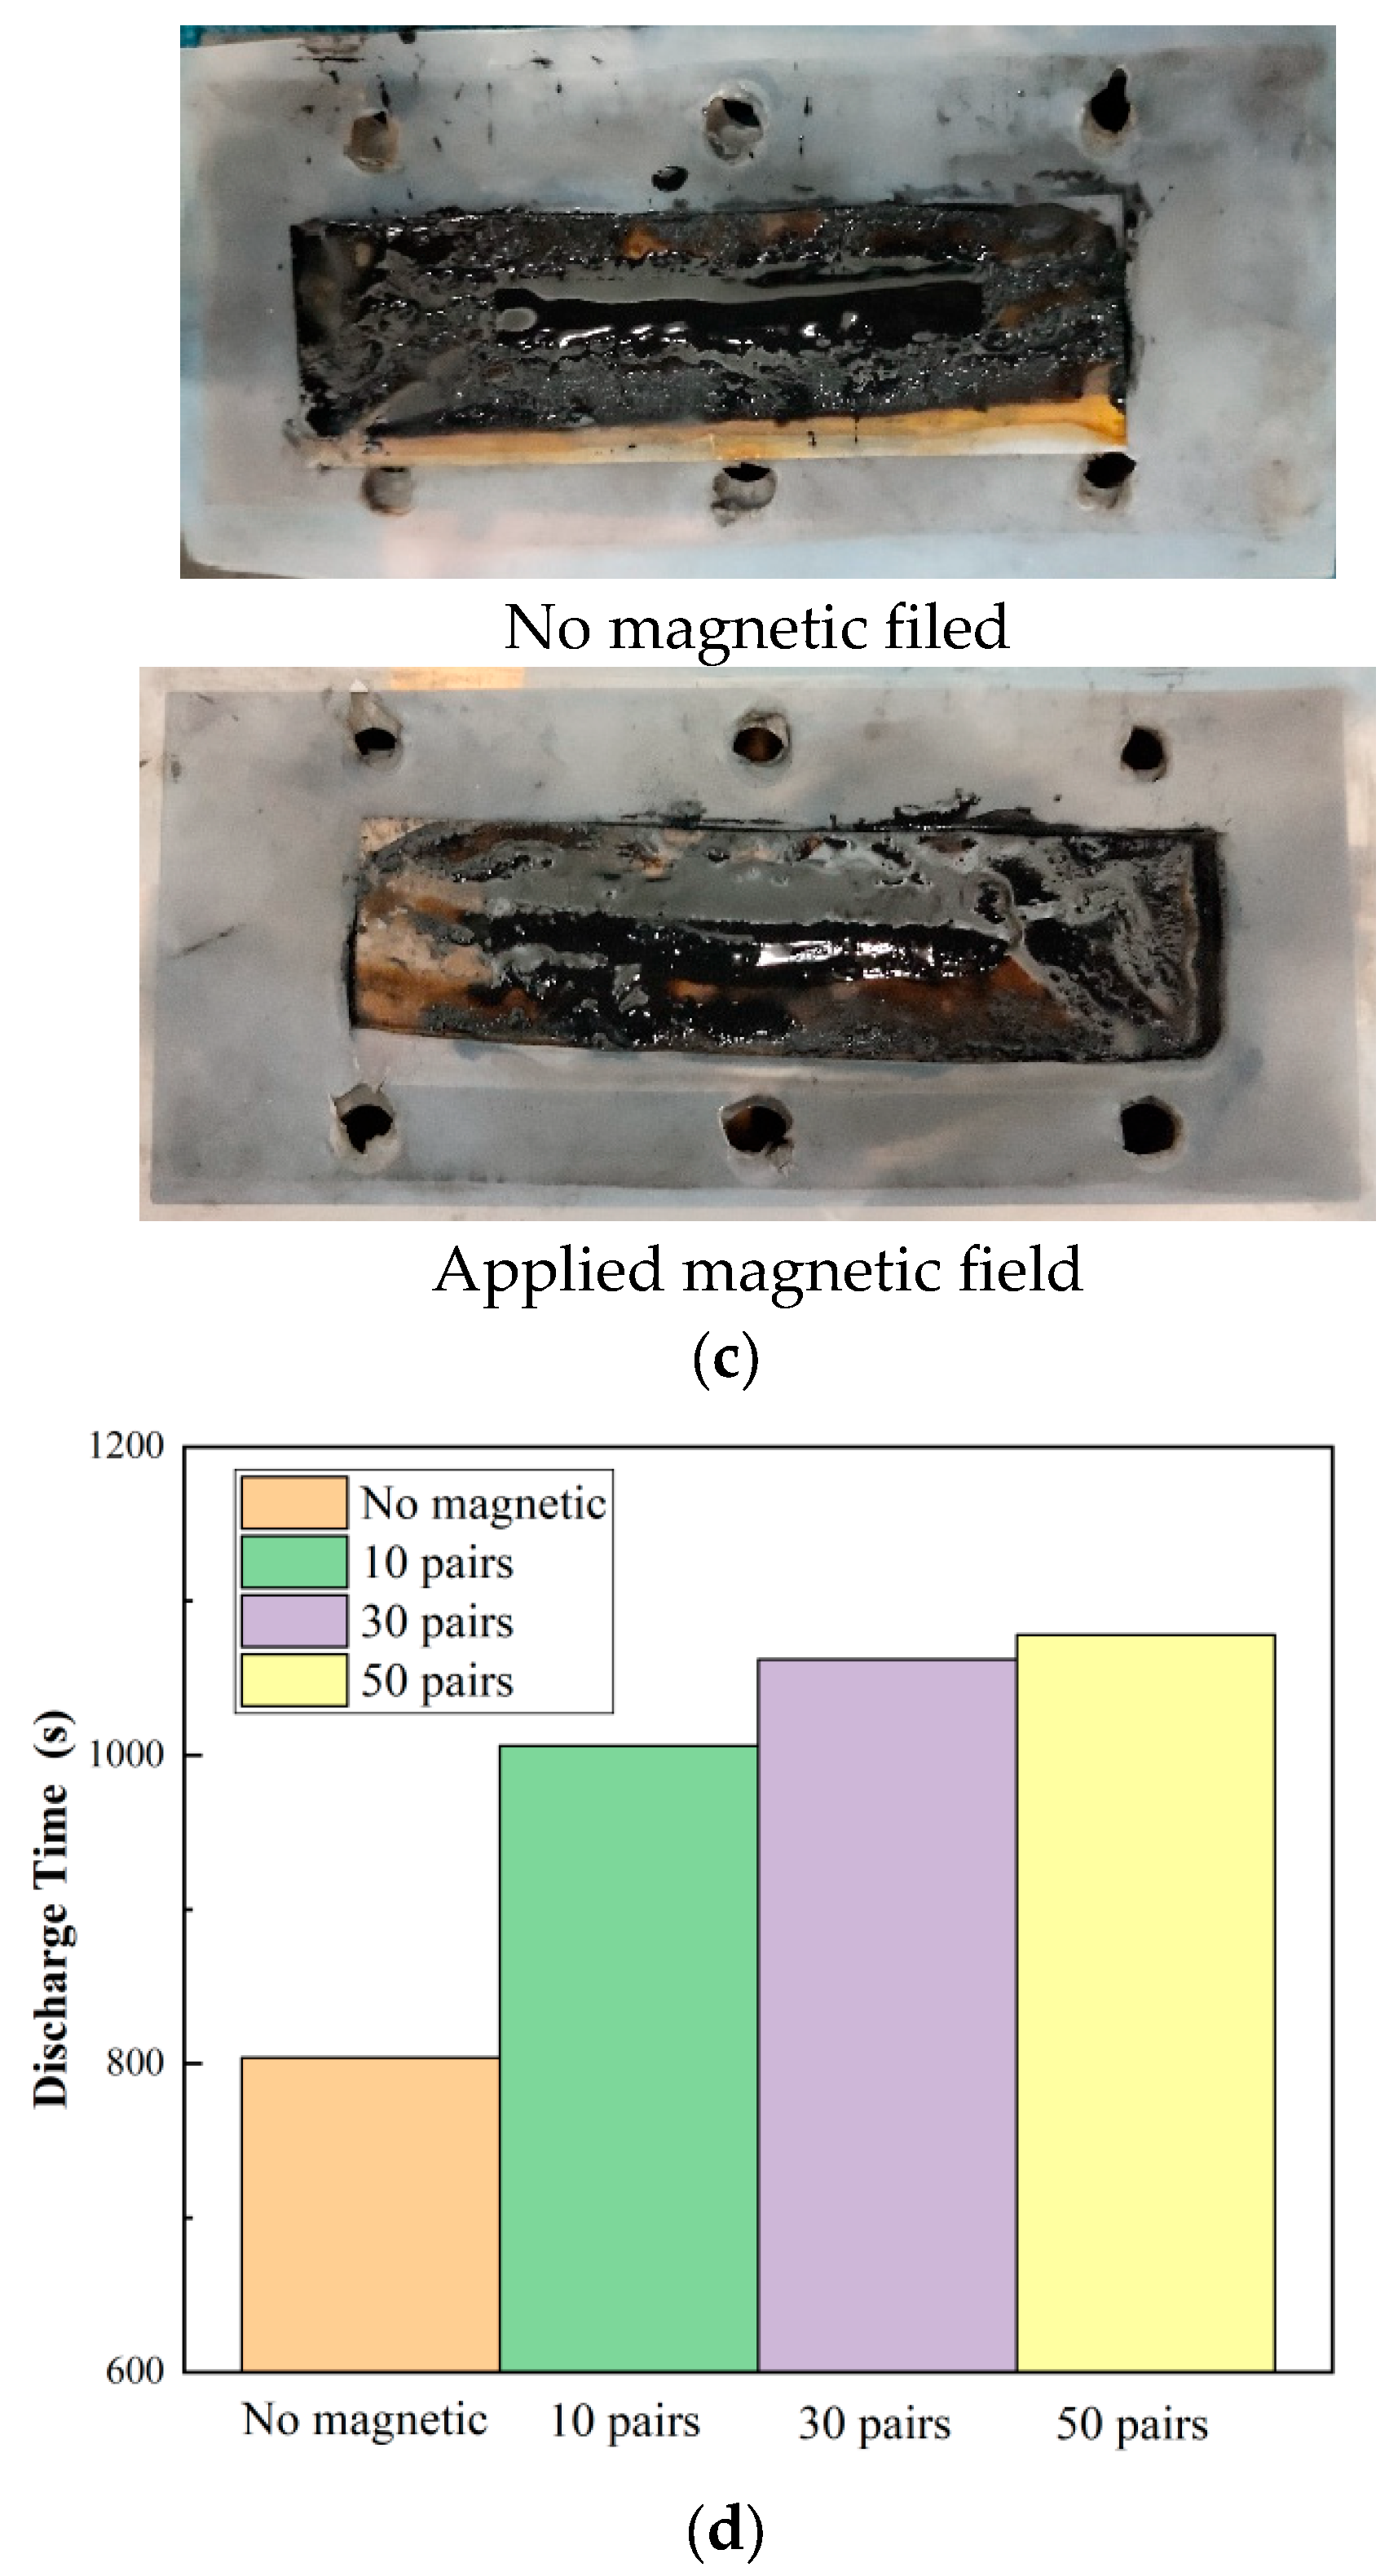
2.3. Results and Discussion
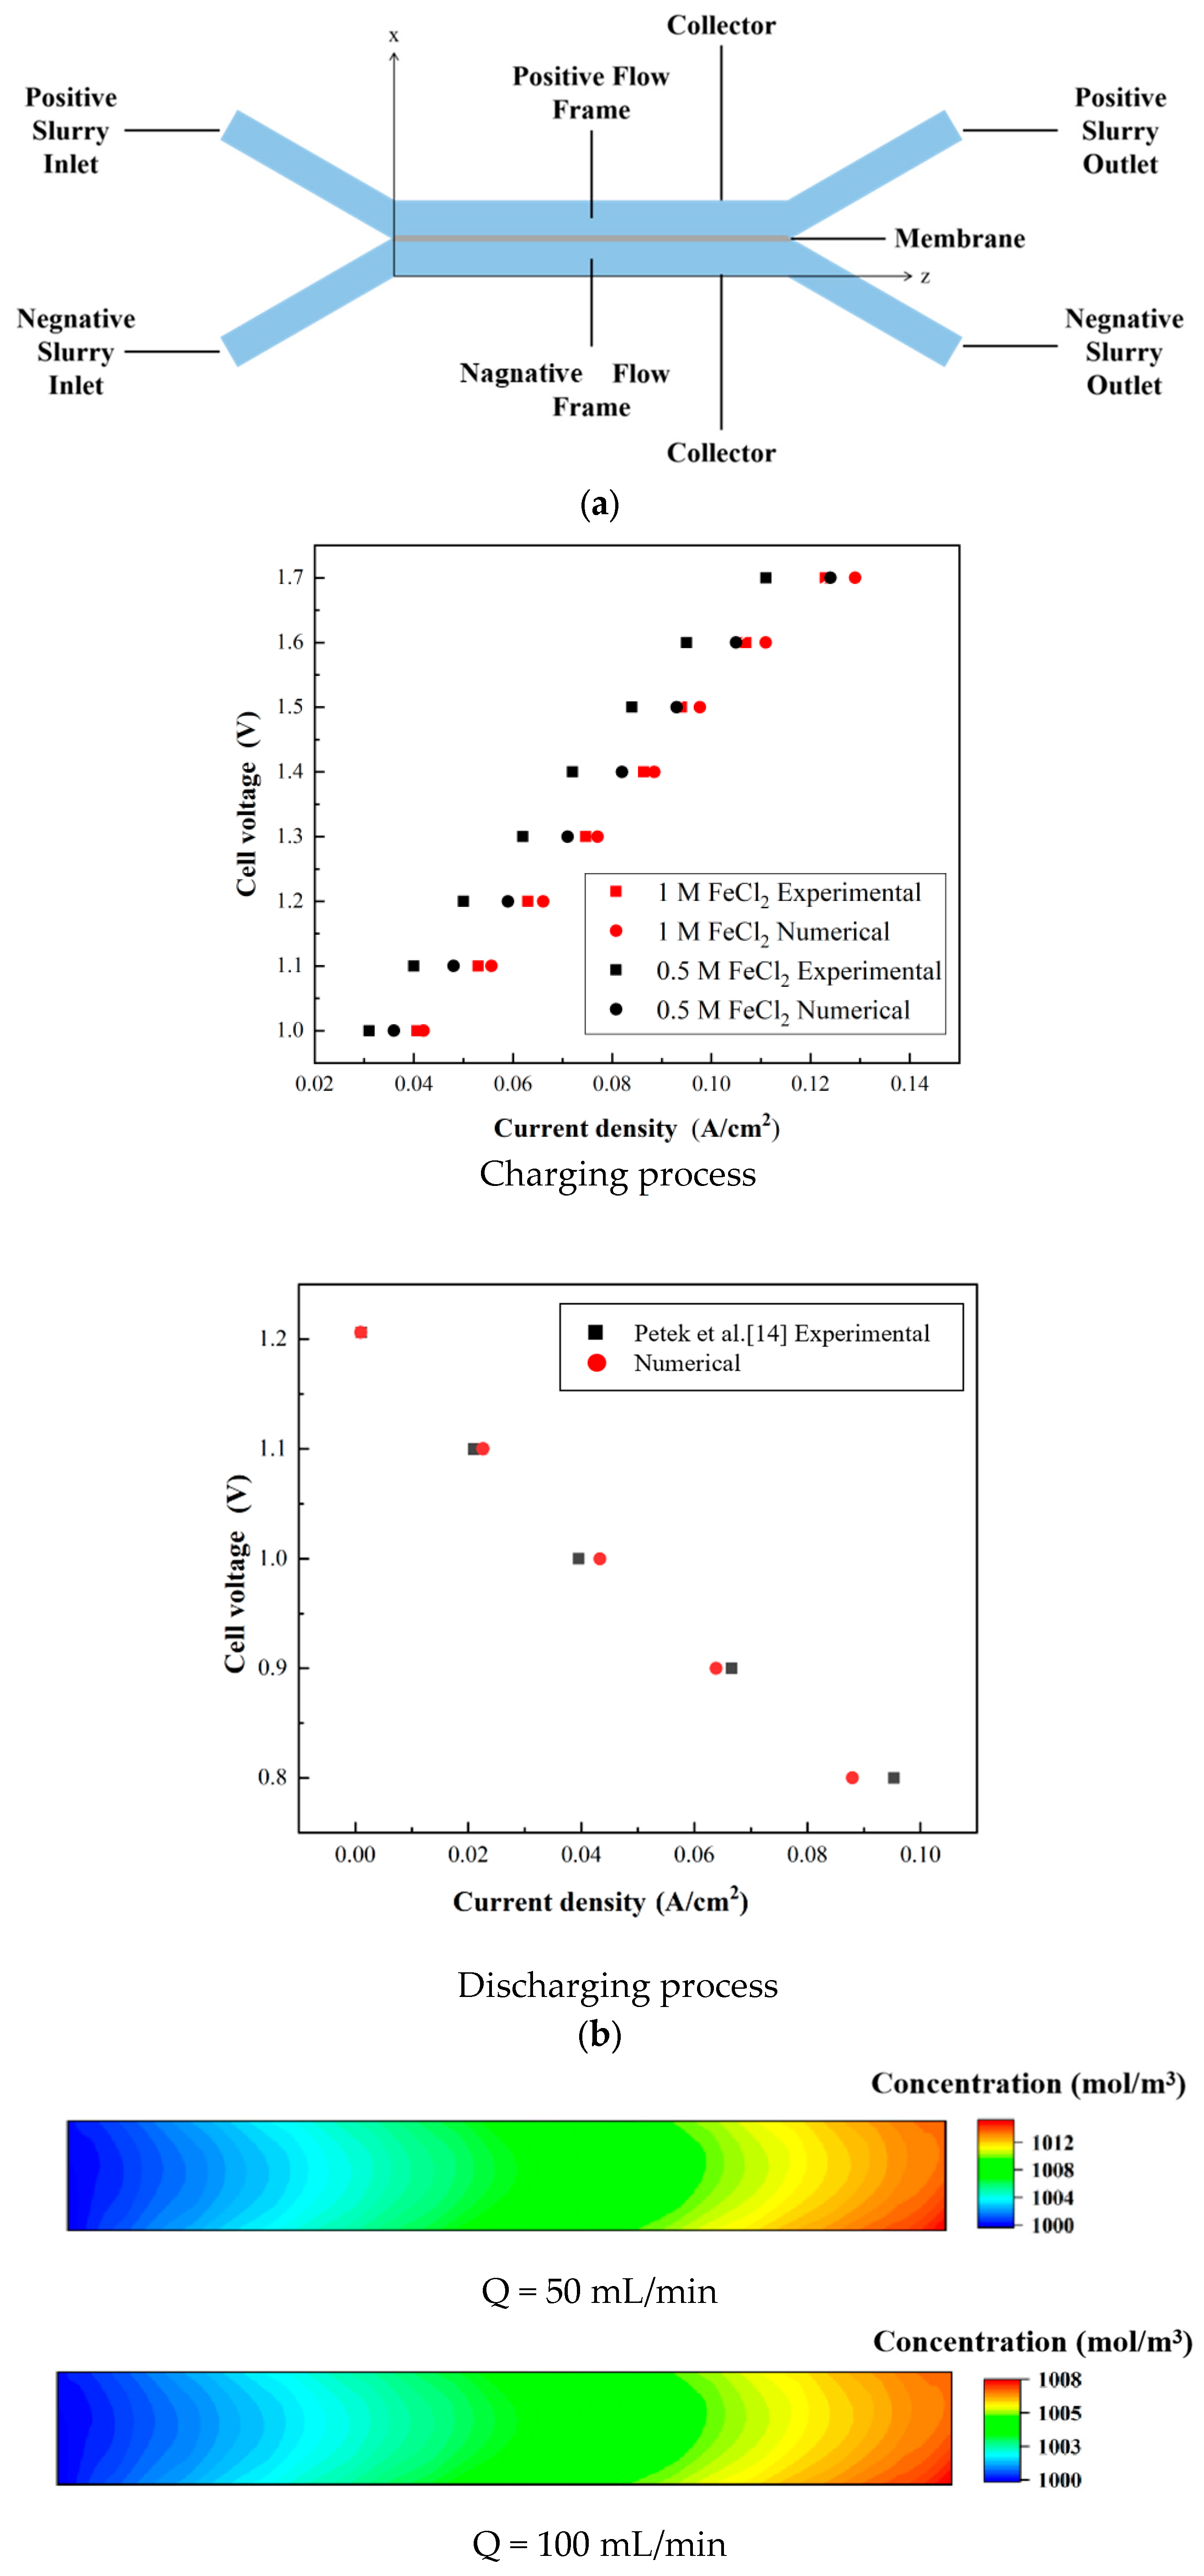
Figure 2a shows the influences of different external magnetic field strengths on the charging process of a single semi-solid all-iron RFB by placing different numbers of magnets on both sides of the single battery. From Figure 2a, it can be seen that regardless of whether there was an external magnetic field, the upward trend of the polarization curve during the charging process remained the same. It can also be seen that after the external magnetic field was added, a higher current density could be obtained at the same charging voltage, indicating that at this time, inside the electrode, the resistance was reduced and the conductivity was increased. This was mainly due to two factors: one factor is that under the action of the Lorentz force, the slurry electrode in the magnetic field accelerated the mass transfer. In particular, the charged iron ions in the flowing slurry were more likely to collide with each other or react, and the other factor is that the solid particles in the slurry electrode were also forced to move and connect to form a tighter conductive network. As a result, the conductivity of the slurry electrode increased accordingly, and the resistance decreased so that a larger loop current could be obtained at the same charging voltage.
Further observation of the deviation degree of the four polarization curves in Figure 2a shows that adding 10 pairs of magnets on each side of the battery could increase the average charging current density by 4.85%. For 30 and 50 pairs of magnets, the increases in the charging current density were 11.05% and 14.04%, respectively. The growth rate of the charging current density was the greatest when 30 pairs of magnets were set.
During the experiment, it was also found that if the external magnetic field was placed in the channel transition area marked in Figure 2b, the battery would be more sensitive to the induction of the magnetic field. When the external magnetic field was set in this area, the charging current would rise sharply in the charging process, far beyond the average level. According to the analysis, the main reason was that the blockage of the slurry electrode was more likely to occur in this transition zone, resulting in the deterioration of the mass transfer. Consequently, the external magnetic field was conducive to improving the mass transfer, promoting the continuous flow of particles inside the slurry and the occurrence of the reaction.
In addition, iron deposition occurred in the negative frame during the charging process of the semi-solid all-iron RFB, which was prone to block the flow channels during practical operation. The external magnetic field seemed to play a certain role in alleviating this problem. To verify this guesswork, the battery charging experiment was carried out under the conditions of no magnetic field and with 30 pairs of magnets. The results are shown in Figure 2c. Through the observation and comparison, it can be seen that the deposition in the negative flow channel was significantly reduced by applying a magnetic field. This showed that the magnetic fields contributed to improving the mass transfer inside the battery. It helped more of the iron generated in the reaction processes flow out of the channel with the slurry, effectively avoiding the problem of blockage in the internal flow channel.
In addition, the discharging process of the battery was also studied. The Coulombic efficiency, voltage efficiency, and energy efficiency are usually used to evaluate battery performance. The definitions of the three efficiencies are as follows:
Coulombic efficiency:
C E = t d i s / t c h 100 %
Voltage efficiency:
V E = V d i s ¯ / V c h ¯ 100 %
Energy efficiency [19] (Pstack,d represents the discharge energy; Pstack,c represents the charge energy; Ppump,d represents the pump energy of the discharge process; and Ppump,c represents the pump energy of the charge process):
E E = P s t a c k , d P p u m p , d d t P s t a c k , c P p u m p , c d t
These formulas show that to improve the efficiency of the battery, efforts can be made to lift the discharge time and discharge voltage of the battery. Therefore, the experiments were mainly focused on two parameters: the discharge time and the discharge voltage.
A discharge experiment was carried out on the charged battery after conducting comparative charging experiments with no magnetic field and with 10, 30, and 50 pairs of magnets. The experimental results showed that the discharge voltage of the battery could be improved by applying a magnetic field during the charging process. The experimental data are described as follows. The average discharge voltage of the semi-solid all-iron RFB under the condition with no magnetic field was 1.09 V. While the average discharge voltage of the battery under the external magnetic field increased, it barely increased with the increase in the number of magnets, and its value was 1.23 V. According to Equation (1), the flow mass transfer and electrochemical reaction inside the battery could be effectively improved through an external magnetic field. The discharge voltage and voltage efficiency of the semi-solid all-iron RFB could be improved.
To further study the influence of the external magnetic field on the discharging process of the semi-solid all-iron RFB, the battery was first charged under the external magnetic field of 30 pairs of magnets. Then, discharge experiments were carried out under the conditions with no magnetic field and with 10, 30, and 50 pairs of magnets. The discharge time of a semi-solid all-iron RFB under various conditions is shown in Figure 2d.
It can be seen from Figure 2d that the setting of the external magnetic fields could significantly increase the discharge time of the semi-solid all-iron RFB and greatly improve the coulombic efficiency of the battery. This was mainly because the setting of the magnetic fields made the solid particles of the slurry in the RFB form a denser conductive network, which greatly improved the conductivity of the slurry electrode and reduced the internal resistance of the battery. This not only prolonged the discharge time and improved the efficiency of the battery but also made the changes to the battery voltage and current more stable during the discharging process, which was more conducive to the stable operation of the semi-solid all-iron RFB.

3. Simulations

3.1. Model Description

Based on porous electrode theory and the reaction principle of the semi-solid all-iron RFB [13], a three-dimensional steady-state model of the semi-solid all-iron RFB was established to study the flow, mass transfer, and electrochemical performance. The calculation domain of the three-dimensional model of the semi-solid all-iron RFB is depicted in Figure 3a, which included a positive flow channel, a negative flow channel, and a membrane. In the original experiment, the inlet and outlet flow channels of the circular-cross-section flow channel were simplified to rectangular flow channels consistent with the flow channels on both sides of the membrane (hereinafter referred to as the middle section). The specific dimensions of the model are shown in Table 2. To simplify the complicated process, the following assumptions were made in the simulations performed with COMSOL Multiphysics 5.4a.
(a) When dealing with fluid flow problems, the electrolyte was considered to be an incompressible fluid and dilute solution with a constant flow rate because the volume change was small and the ion concentration was low enough.
(b) Electrode passivation and hydrogen evolution were ignored.
(c) Anion exchange membranes allowed only chlorine ions through, not water and iron ions.
(d) The battery always maintained a constant temperature.
The slurry electrode in the semi-solid all-iron RFB was a slurry-like suspension composed of an electrolyte phase and a solid active particle phase. According to the porous electrode concentrated solution theory, the following formula can be used to calculate the mass conservation of a single chemical substance i in the electrolyte in the slurry electrode:
ε c i / t = a V j i N i
where ε is the porosity of the slurry electrode of the semi-solid all-iron RFB, ji is the pore wall flux of the substance i caused by the Faraday reaction, N i is the flux of the substance i caused by migration, convection, and diffusion, and av refers to the ratio of the surface area to the volume of the electrode.
By establishing and integrating equations for each chemical substance, the flux equation of each ion can be obtained. The following formula is the expression of the anion and cation flux:
N ± = ε D e f f c ± t ± 0 / F i 1 + c ± u
where Deff is the effective diffusion coefficient in the electrolyte, D0 is the diffusion coefficient of the electrolyte salt outside any porous structure, t ± 0 is often represented as the number of cation or anion transfers, which is the percentage of the total ion current carried by the ion, il is the ionic current density in the electrolyte phase, F is the Faraday constant, and u is the average flow rate. Deff is corrected by the following equation:
D e f f = D 0 ε 0.5
Based on the stoichiometry of the intercalation reaction on the surface of the solid active particle, the interfacial flux of anions and cations between the solid active particles and the electrolyte solution is defined as follows:
j ± = ± i 1 / a v F
where F is the Faraday constant.
Substituting Equations (5) and (7) into Equation (4), we obtain
ε c / t = ε D e f f c t + 0 i 1 / F u c
The gradient of the electrochemical potential drives the mass transfer in the electrolyte of the slurry, which is expressed by the Stefan–Maxwell multi-component diffusion equation:
μ i / R T = j = 1 , j i n c i c j / c T 2 D i j v i v j
where i represents the substance of interest, j is any other substance in the electrolyte that participates in the reaction, n is the total number of chemical substances, vi and vj represent the ion velocities of substances i and j, respectively, ci and cj represent the molar concentrations of substances i and j in the electrolyte, respectively, cT is the total molar concentration in the electrolyte, μ i is the chemical potential of the substance, R is the ideal gas constant, T is the temperature, and Dij is the Stefan–Maxwell binary diffusion coefficient for multi-component diffusion.
The solid active particles in the slurry electrode can be regarded as monodisperse spherical particles. Due to diffusion transfer, the material balance for the intercalation of chemical substance i can be expressed as follows:
c s , i / t = D s , i / r 2 / r r 2 c s , i / r
where cs,i is the concentration of intercalation substance i in the solid active particle, Ds,i is the solid-state diffusion coefficient of substance i, and r is the radial coordinate. The boundary conditions of the particle surface and the particle center are as follows:
D s , i c s , i / r = i l / α v , e l e c t r o d e F , r = R p , t > 0
c s , i / r = 0 , r = 0 , t
where Rp is the radius of the solid active particle.
According to the porous electrode theory applicable to this model, is is defined as the current density due to electron conduction in the solid active particle phase, and il is defined as the current density due to ion migration in the electrolyte. The solid phase potential is ϕ s , and the electrolyte phase potential is ϕ l . Both is and il are related to Kirchhoff’s current law and the conservation of charge:
i t o t a l = i s + i l
According to Ohm’s law, is depends on the potential gradient in the solid phase ϕ s and the electronic conductivity of the slurry electrode σ s :
i s = σ s ϕ s
The current density il in the electrolyte phase is derived from the ion flux equation in concentrated solution theory:
i 1 = σ 1 ϕ 1 σ e f f R T / F t + 0 + c e / c 0 ln f ± c e
where f ± is the average molar activity of the electrolyte salt, and σ e f f is the effective conductivity. Because the microstructure of the porous electrode in the experiment follows the Bruggeman equation to a certain extent, in the absence of empirical data, it can be reasonably assumed that the Bruggeman equation is still valid for the semi-solid all-iron RFB. Therefore, σ e f f can be calculated from the Bruggeman equation based on the electrolyte conductivity σ 0 in the general state:
σ e f f = σ 0 ε 1.5
The reversible electrochemical reactions in the positive and negative electrodes can be described using the Butler–Volmer formula:
i t = A i t 0 exp 1 a t F η t / R T exp a t F η t / R T
where A is the specific surface area of the electrode, t takes values of 1 and 2, representing the positive electrode and the negative electrode, respectively, α t is the positive and negative ion exchange coefficient, η t is the positive and negative electrode overpotential, and i t 0 is the positive and negative electrode exchange current density.

3.2. Validation of Model

The simulation data are compared with the data obtained in the above experiment in Figure 3b. After comparison and calculation, the average error between the simulation and the experiment was 8.2%. The main reason for this was that there was inevitably some contact resistance in the assembled battery parts and connecting wires during the experiment, which was not taken into account in the simulations. Therefore, there were certain deviations between the simulated and experimental values, and the error between the two was still within an acceptable range, so the simulation result of the charging process is considered to be reliable and effective. In addition, the model-simulated values of the discharging process were compared with the experimental values from Petek [14], and the results are also shown in Figure 3b. The maximum error was 8.6%, and the average error was 6.9%. In addition to the contact resistance indicated above, the error between the two was also due to the different types of MWCNTs selected when the slurry electrode was configured and the configuration method. Based on these results, the model was determined to be reliable, and it has reference value for the numerical investigation of semi-solid all-iron RFBs.

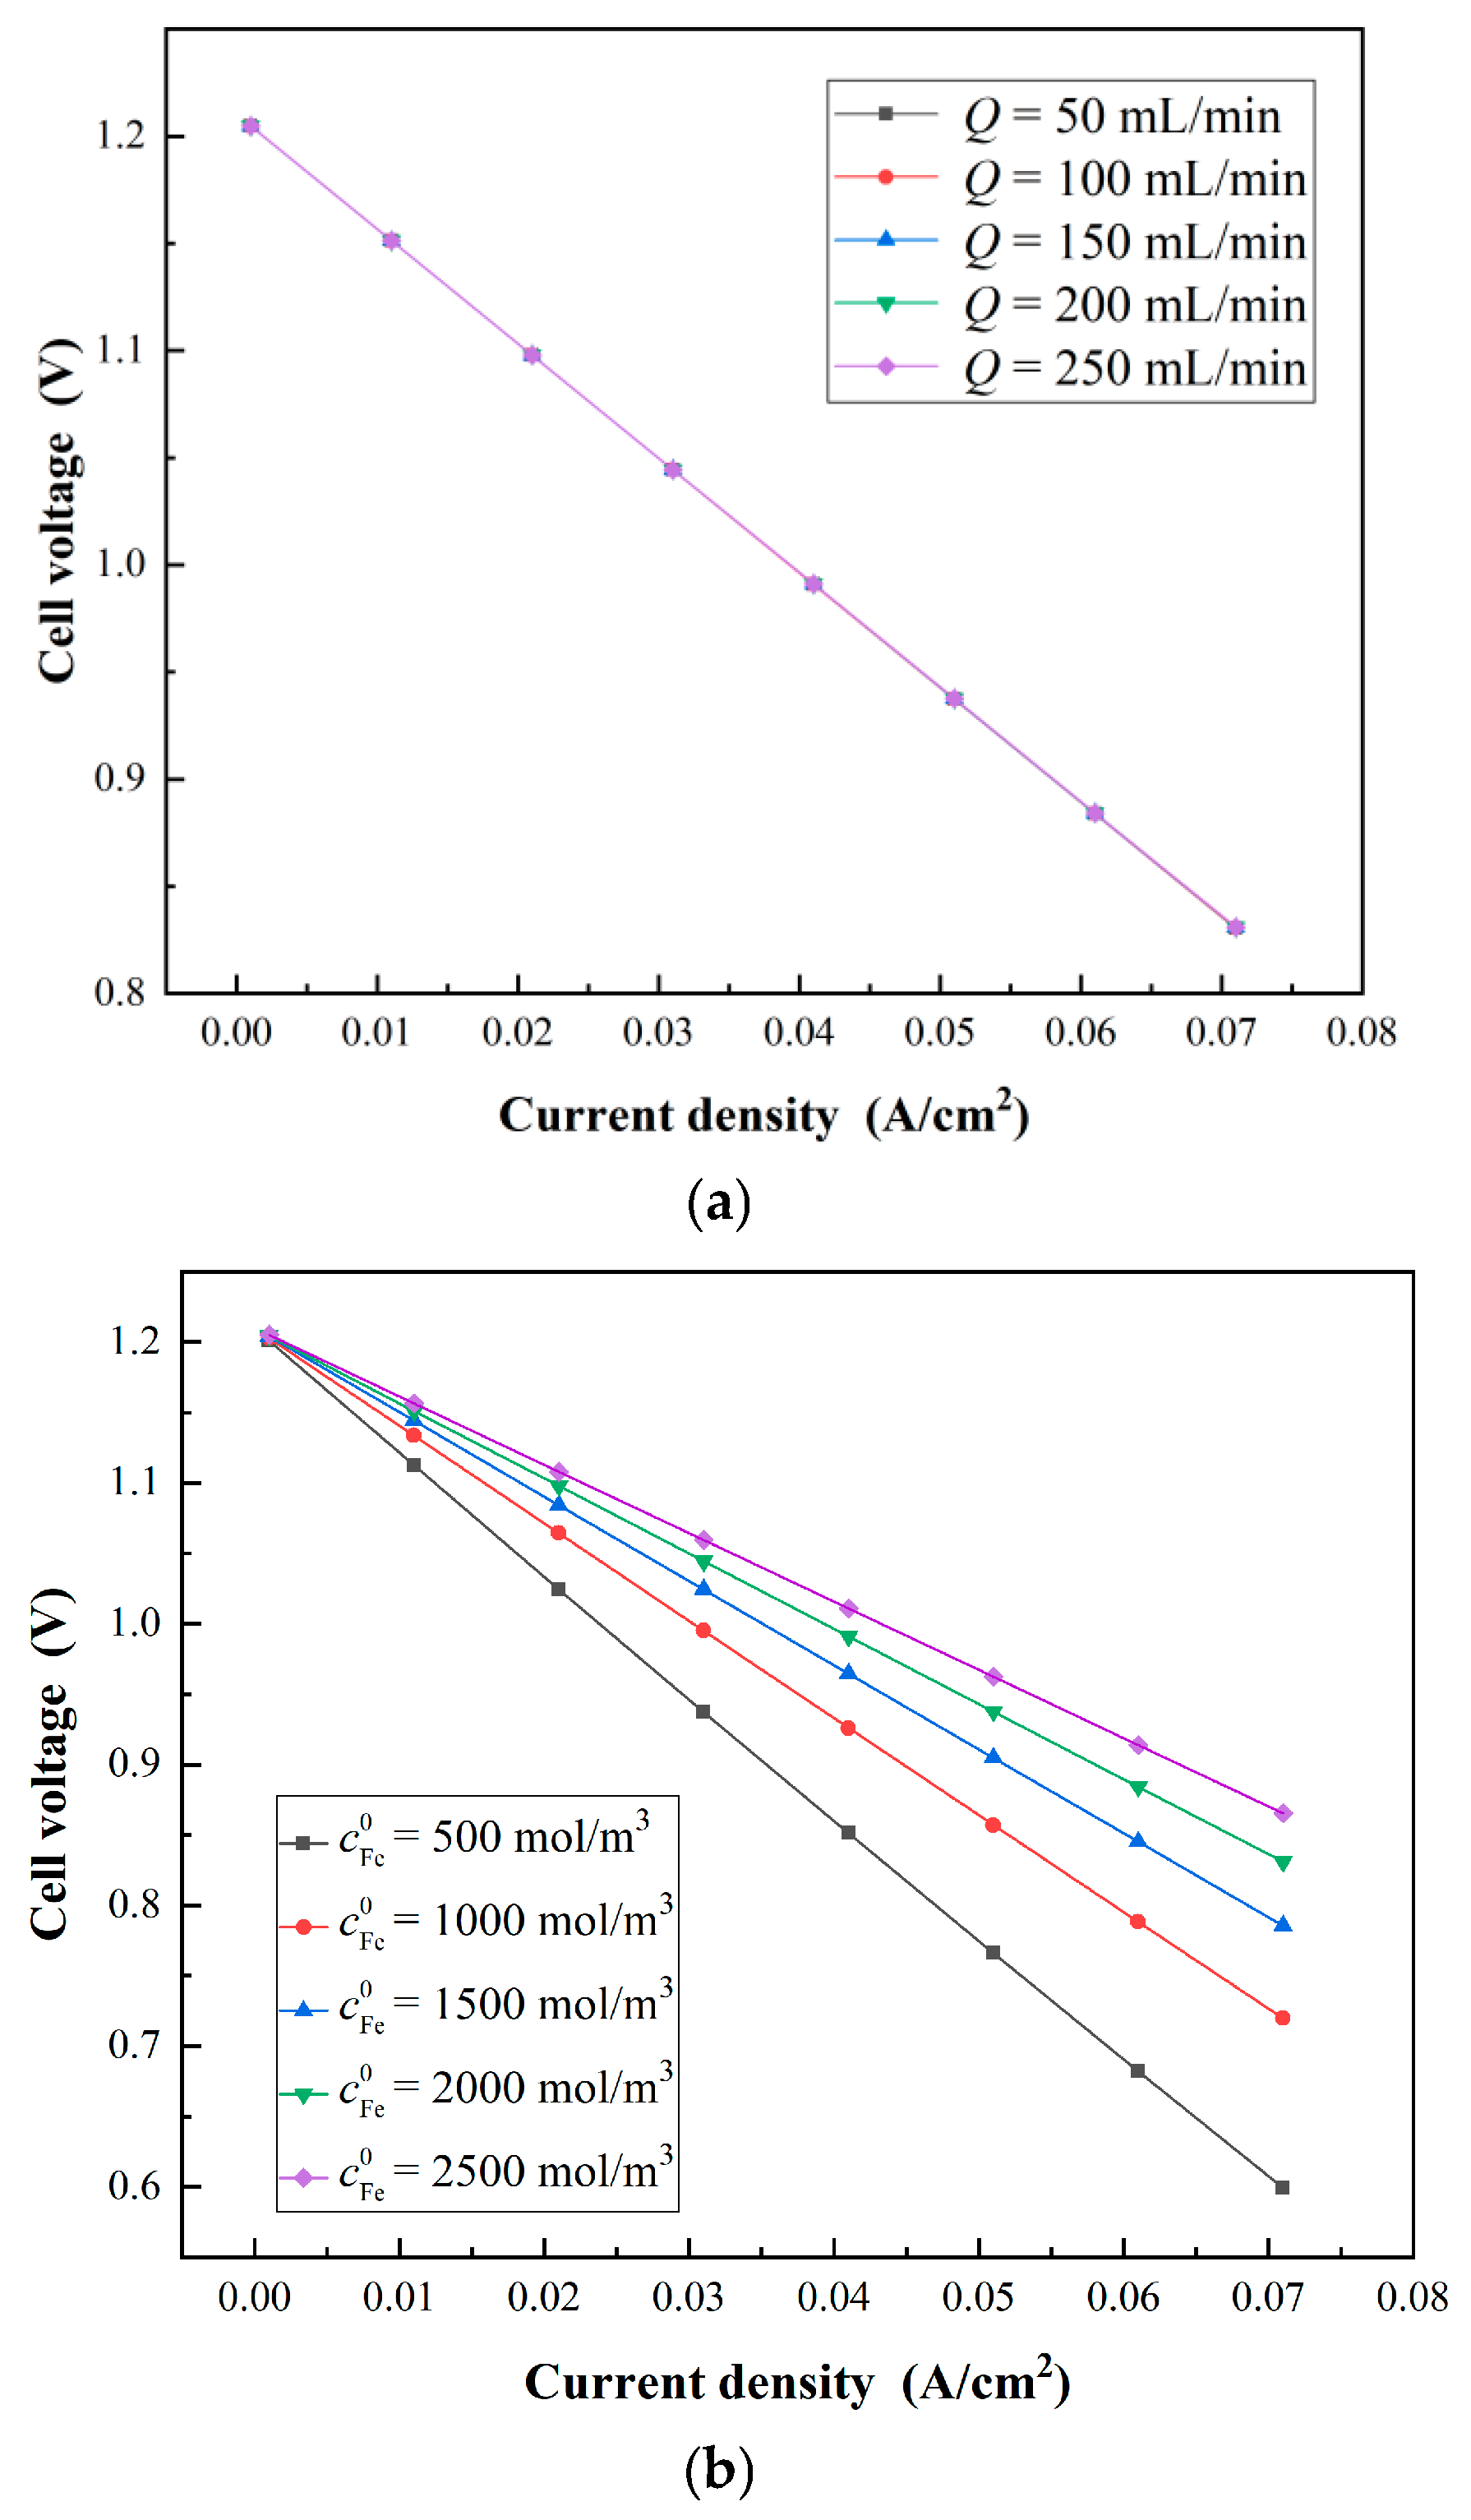
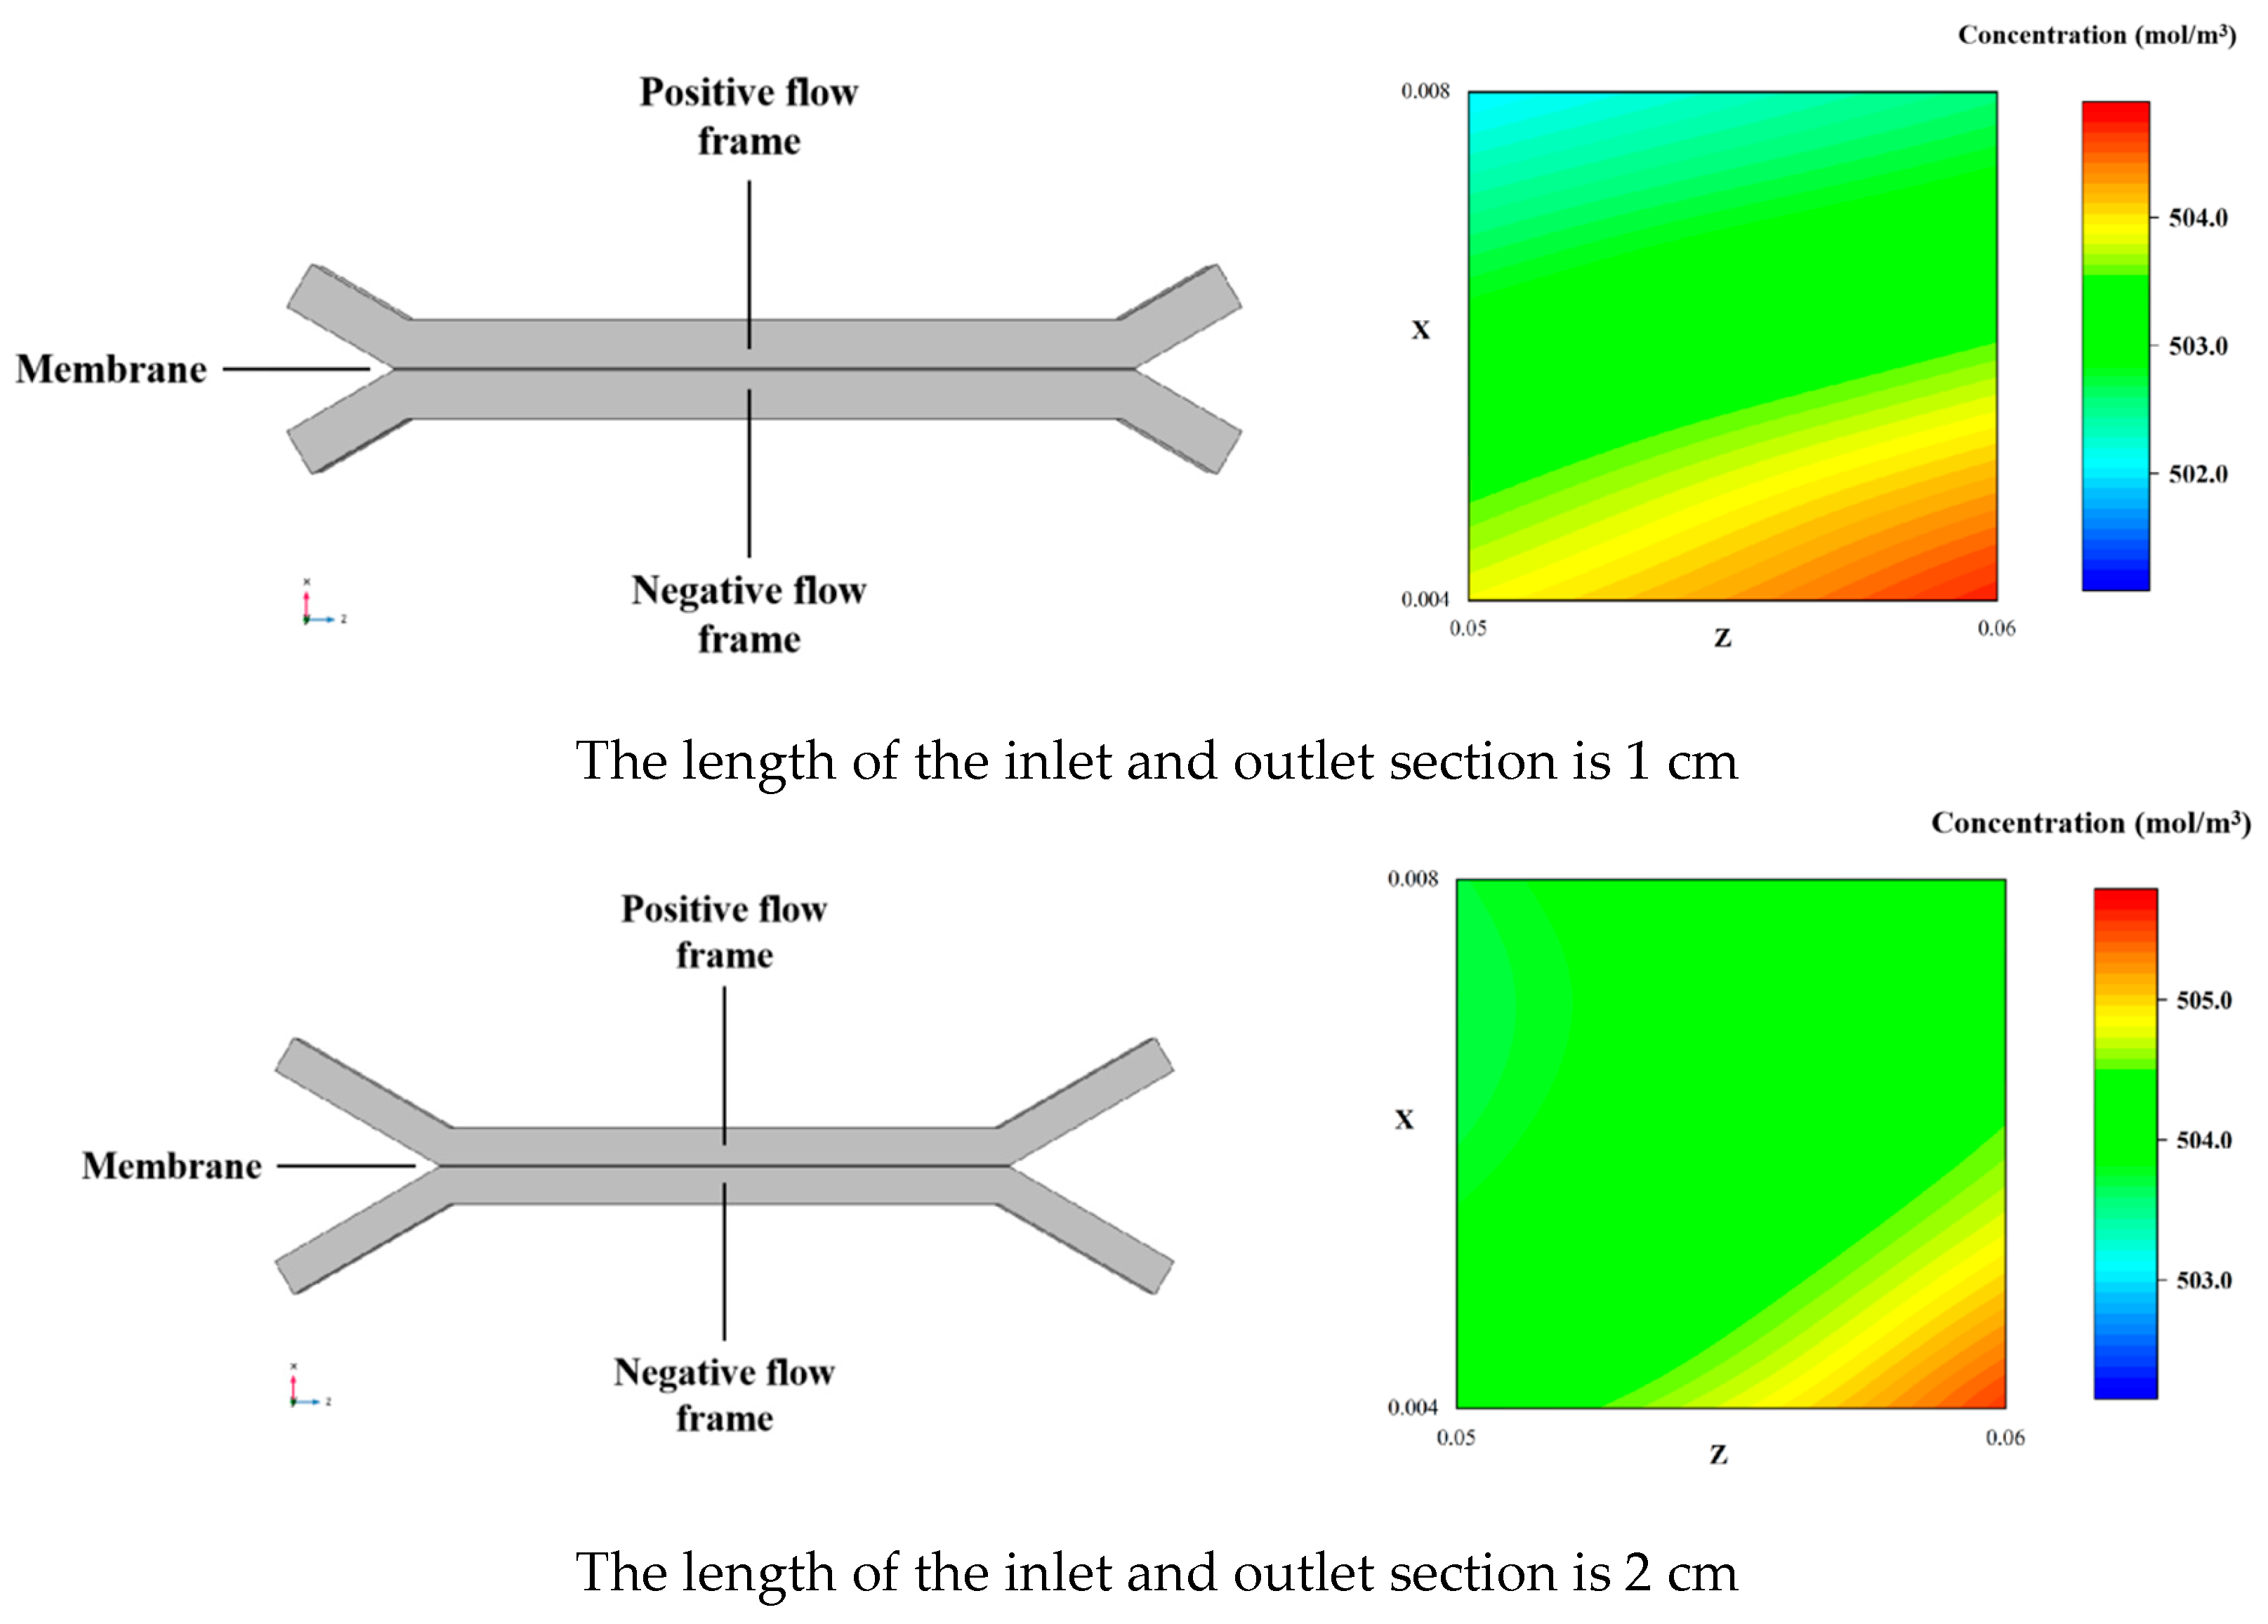
3.3. Results and Discussion

Figure 3c shows the Fe2+ concentration distribution on the cross-section (discharge process, battery voltage: 0.95 V, discharge current density: 0.05 A/cm2 (almost the same for all flow rates), SOC: 50%). When viewed from the half-width cross-section at the middle section of the positive flow channel of the semi-solid all-iron RFB, the left side is the inlet side, and the lower end is the membrane side. The slurry flowed from left to right. As shown in Figure 3c, the Fe2+ concentration gradient inside the positive flow channel at both ends of the flow channel, that is, the flow channel near the inlet and outlet ends, was larger. In contrast, the concentration distribution in the middle section of the flow channel was more uniform. In addition, the edge of the flow channel near the exit section had a higher local concentration area, and this area decreased with the increase in the flow rate. However, when the flow rate was too large, such as Q = 250 mL/min, the concentration of the product at the outlet was significantly reduced due to an insufficient reaction.
In Figure 4a, line 1 is at the mid-section of the semi-solid all-iron RFB, and line 2 is at the exit section of the battery. The concentration distribution of Fe2+ on these two cross-sections is shown in Figure 4b. The concentration of the product at the exit was higher, and the concentration gradient of Fe2+ on line 2 at the exit section was significantly larger than that of the section at the middle. Combined with the results in Figure 3c, it was found that the concentration changed more dramatically at the junction with the exit passage at an angle of 30°, and the concentration of the product Fe2+ near the membrane reached the maximum value, indicating that there was uneven mass transfer of electrolyte there. It was further considered that in the experiment, when the applied magnetic field was close to the turning area of the flow channel (as shown in Figure 2b), the charging current increased significantly. This was because the external magnetic field effectively improved the uneven distribution of electrolyte there.
From further observation of Figure 4b, it was found that increasing the slurry flow rate could reduce the concentration gradient of the product Fe2+. The higher the flow rate was, the flatter the concentration distribution curve was. The concentration difference on both sides of the membrane also decreased, which reduced the concentration polarization loss of the battery as well. However, the improvement effect of increasing the slurry flow rate was no longer evident after Q increased to 150 mL/min. At the same time, there was also a problem of an insufficient electrochemical reaction due to an excessively high slurry flow rate.
Figure 5a shows the change of the cell voltage with the current density during the discharge process of the semi-solid all-iron RFB under different slurry flow rates. By comparing the simulation results, it was found that changing the slurry flow rate had almost no effect on the polarization curve of the semi-solid all-iron RFB discharge process. The polarization curves at different slurry flow rates overlapped, which indicated that the slurry flow rate had an almost negligible impact on the battery performance during the discharging process of the semi-solid all-iron RFB.
As mentioned above, the change of the slurry flow rate mainly affected the flow and mass transfer inside the semi-solid all-iron RFB. Nevertheless, different slurry flow rates had little effect on the electrochemical performance of the battery. Due to the low flow rate, the flow channel inside the slurry electrode with high viscosity would become blocked. Increasing the slurry flow rate could effectively improve the mass transfer inside the cell. In contrast, a higher flow rate would cause a larger pressure drop. Therefore, it is recommended to select a flow rate of 150 mL/min during the operation of the semi-solid all-iron RFB.
Figure 5b shows the change of the cell voltage with the current density during the discharging process of the semi-solid all-iron RFB under different initial slurry electrolyte concentrations. Different initial electrolyte concentrations were selected: 500, 1000, 1500, 2000, and 2500 mol/m3. The following two conclusions were obtained by analyzing the simulation results: One is that changing the electrolyte concentration in the slurry did not significantly change the open-circuit voltage of the semi-solid all-iron RFB. This was because the open-circuit voltage was mainly determined by the potential energy of the reversible chemical reaction, and it had little relationship with the initial slurry electrolyte concentration; the other is that when the initial slurry electrolyte concentration was low, as the current density increased, the cell voltage dropped faster. As the initial slurry electrolyte concentration increased, the magnitude of the rate of decrease of the cell voltage was significantly reduced. However, the polarization curves at the various initial concentrations also became closer with the increase in the initial concentration, which showed that the optimization effect of increasing the electrolyte concentration on the polarization curve was also limited.
The model was further used to study the influence of different initial electrolyte concentrations in the slurry on the mass transfer in the flow channel of the semi-solid all-iron RFB. Different initial electrolyte concentrations were selected: 500, 1000, 1500, 2000, and 2500 mol/m3. For SOC = 50%, the Fe3+ concentration distribution at the half-width section of the positive middle section of the semi-solid all-iron RFB is shown in Figure 6. From the changes in the Fe3+ concentration distribution in Figure 6, it can be further seen that electrolyte accumulation was prone to occur at the junction of the middle section and the inlet and outlet flow channel sections. Changing the initial concentration of electrolytes could also help eliminate this problem. Increasing the initial electrolyte concentration improved the uniformity of the concentration distribution in the entire middle section. Under the condition of a higher initial electrolyte concentration, the concentration distribution in the middle section was more uniform and the concentration change was smoother.
Furthermore, the semi-solid all-iron RFB with different inlet and outlet flow channel lengths was also studied to find the flow channel size that was more conducive to battery performance and mass transfer of the flow channel. As shown in Figure 7a, different inlet and outlet flow passage lengths were selected: 3, 2, and 1 cm. The angle between the inlet and outlet sections and the middle section was kept at 30°. The width and depth of the flow channel were unchanged.
The semi-solid all-iron RFB with three flow channel lengths was connected to the middle section under different inlet section flow channel length conditions. When c F e 0 = 1000 mol/m3, SOC = 50%, and Q = 150 mL/min, there was still a higher concentration zone near the membrane area, and it was more evident in the exit section. To better understand the concentration distribution in this area, Figure 7b shows a partially enlarged view of the concentration distribution in this area.
From Figure 7b, it can be more clearly seen that when the lengths of the inlet and outlet sections of the flow channel were 1 cm, the concentration gradient in the flow channel was larger. When the lengths of the inlet and outlet sections of the flow channel were increased to 2 and 3 cm, respectively, the slurry electrolyte concentration distribution in the battery flow channel became more uniform. In particular, when the length of the flow channel in the inlet and outlet section was 2 cm, the concentration distribution was more uniform in the entire flow channel or a local area, and the area where the electrolyte product accumulated at the junction of the flow channel was also smaller, indicating that the mass transfer effect in the battery was better at this time. To further determine the effect of the channel length on the battery, the electrochemical performances of a semi-solid all-iron RFB with different inlet and outlet channel lengths were studied by using the model.
Figure 8 shows the SOCs corresponding to 10%, 50%, and 90% of the semi-solid all-iron RFB at the beginning, middle, and end of discharge, respectively, at the different inlet and outlet flow channel lengths. The cell voltage changed with current density in each process. When the channel lengths of the inlet and outlet sections were 3 cm, the cell voltage dropped most rapidly, indicating that the Coulombic efficiency of the battery was low at this time. However, although the lengths of the flow channels in the inlet and outlet sections were 2 cm, the polarization curve of the discharging process was not as smooth as when the length was 1 cm. However, in comparison, the battery performance was still good. In particular, when SOC = 50%, the highest battery open-circuit voltage was obtained when the channel lengths of the inlet and outlet sections were 2 cm, and the battery voltage was very close to that of the 1-cm channel lengths at low current densities.

4. Conclusions

Based on experimental and simulation studies, the performances and mass transfer characteristics of the semi-solid all-iron RFB under different conditions were comprehensively analyzed. The main conclusions obtained in this study are as follows:
1. The conductivity of the slurry electrode in the semi-solid all-iron RFB is related to the concentration of the added electrolyte. Increasing the concentration of the added electrolyte can increase the conductivity of the configured slurry electrode to a certain extent. However, at the same time, it should be noted that too high a concentration will make the solid electrolyte particles difficult to dissolve in the slurry, resulting in large precipitation in the slurry, which will affect the fluidity and conductivity of the slurry electrode.
2. In the charging experiment, different numbers of strong magnets were used to form external magnetic fields of different strengths. It was found that the polarization curve of the semi-solid all-iron RFB during the charging process gradually shifted upward with the increase in the number of magnets; that is, a higher current was obtained under the same charging voltage, indicating that the external magnetic field was beneficial to the formation of a tighter conductive network of the slurry electrode, which improved the conductivity and reduced the resistance. In addition, it was also found that the external magnetic field could effectively reduce the iron deposition in the negative flow channel during the charging process, which was beneficial to the flow and mass transfer of the slurry and avoided flow channel blockages.
3. In the discharging experiment, it was found that the external magnetic field could increase the discharge voltage and prolong the discharge time of the semi-solid all-iron RFB, thereby improving the voltage efficiency and coulombic efficiency of the battery.
4. During the operation of a semi-solid all-iron RFB, there was a concentration accumulation area at the junction of the inlet and outlet flow passage sections and in the flow passage sections on both sides of the membrane. In particular, in the area near the membrane, the product concentration was significantly higher than that in other areas. This phenomenon of electrolyte accumulation can be significantly improved by increasing the slurry flow rate and changing the lengths of the inlet and outlet channels.
5. By comparing the mass transfer characteristics and electrochemical performances of the battery under different slurry flow rates, it was found that when Q = 150 mL/min, the electrolyte concentration distribution in the flow channel was more uniform, but the slurry flow rate had almost no effect on the polarization curve of the battery discharging process.
6. The mass transfer inside the flow channel of the semi-solid all-iron RFB is related to the size of the flow channel. Based on the simulation results, it is believed that when the length of the flow channel in the inlet and outlet sections was 2 cm, the electrolyte concentration distribution in the flow channel was more uniform.

Author Contributions

Conceptualization, H.L. and Z.Z.; methodology, H.L.; software, H.L. and H.Z.; validation, H.L., H.Z. and Y.Z.; formal analysis, Z.Z.; investigation, Y.Z.; resources, H.Z.; data curation, H.L.; writing—original draft preparation, H.L.; writing—review and editing, Z.Z.; visualization, H.Z.; supervision, H.L.; project administration, Z.Z.; funding acquisition, Z.Z. All authors have read and agreed to the published version of the manuscript.

Funding

This research was supported by the Fundamental Research Funds for the Central Universities (No. 2023JBZY022).

Data Availability Statement

The authors declare data supporting reported results generated during the study, where data is unavailable due to privacy restrictions.

Conflicts of Interest

The authors declare no conflict of interest.

Nomenclature

BMagnetic field strength (Gs)
SOCState of charge
CECoulombic efficiency
VEVoltage efficiency
EEEnergy efficiency
tdisDischarge time (s)
tchCharging time (s)
V d i s ¯ Average discharge voltage (V)
V c h ¯ Average charging voltage (V)
ε Porosity of the slurry electrode (0.63)
jiPore wall flux (mol/m2s)
N i Flux of the substance i caused by migration, convection, and diffusion (mol/m2s)
avRatio of the surface area to the volume of the electrode (m−1)
N ± Anion and cation flux (mol/m2s)
D e f f Effective diffusion coefficient in the electrolyte (m2/s)
D0Diffusion coefficient of the electrolyte salt outside any porous structure (m2/s) (Fe2+: 7.2 × 10⁻¹⁰, Fe3+: 6.1 × 10⁻¹⁰, Fe0: 5 × 10⁻¹³, Cl: 2 × 10⁻⁹)
t ± 0 The number of cation or anion transfers
ilIonic current density in the electrolyte phase (A/m2)
FFaraday constant (C/mol) (96,485)
u Average flow rate (m/s)
j ± Interfacial flux of anions and cations between the solid active particles and the electrolyte solution (mol/m2·s)
cMolar concentration (mol/L)
μ i Chemical potential of the substance (J/mol)
RIdeal gas constant (8.314 J/mol·k)
TTemperature (K)
v ion velocities of substances (m/s)
ctTotal molar concentration in the electrolyte (mol/L)
DijStefan–Maxwell binary diffusion coefficient for multi-component diffusion (m2/s) (6.1 × 10⁻¹⁰)
c s , i Concentration of intercalation substance i in the solid active particle (mol/L)
Ds,jSolid-state diffusion coefficient of substance i in the solid active particle (m2/s)
rRadial coordinate (m)
RpRadius of the solid active particle (μm) (5)
isCurrent density due to electron conduction in the solid active particle phase (A/m2)
ϕ s Solid phase potential (V)
ϕ l Electrolyte phase potential (V)
σ s Electronic conductivity of the slurry electrode (S/m) (0.16)
σ e f f Effective electronic conductivity (S/m)
σ 0 Electrolyte conductivity (S/m) (0.16)
f ± Average molar activity of the electrolyte salt (mol/L)
ASpecific surface area of the electrode (m2/g) (20)
α t positive and negative ion exchange coefficient
η t Positive and negative electrode overpotential (V)
i t 0 Positive and negative electrode exchange current density (A/m2)

References

  1. Fu, Y.; Howard, A.; Zeng, C.; Chen, Y.; Gao, P.; Stinis, P. Physics-guided continual learning for predicting emerging aqueous organic redox flow bat-tery material performance. ACS Energy Lett. 2024, 9, 2767–2774. [Google Scholar] [CrossRef]
  2. Hatzell, K.B.; Beidaghi, M.; Campos, J.W.; Dennison, C.R.; Kumbur, E.C.; Gogotsi, Y. A high performance pseudocapacitive sus-pension electrode for the electrochemical flow capacitor. Electrochim. Acta 2013, 111, 888–897. [Google Scholar] [CrossRef]
  3. Cai, Y.; Zhao, X.; Wang, Y.; Ma, D.; Xu, S. Enhanced desalination performance utilizing sulfonated carbon nanotube in the flow-electrode capacitive deionization process. Sep. Purif. Technol. 2019, 237, 116381. [Google Scholar] [CrossRef]
  4. Dahiya, S.; Mishra, B.K. Enhancing understandability and performance of flow electrode capacitive deionisation by optimizing configurational and operational parameters: A review on recent progress. Sep. Purif. Technol. 2020, 240, 116660. [Google Scholar] [CrossRef]
  5. Boota, M.; Hatzell, K.; Alhabeb, M.; Kumbur, E.; Gogotsi, Y. Graphene-containing flowable electrodes for capacitive energy storage. Carbon 2015, 92, 142–149. [Google Scholar] [CrossRef]
  6. Zhang, C.; Hatzell, K.B.; Boota, M.; Dyatkin, B.; Beidaghi, M.; Long, D.; Qiao, W.; Kumbur, E.C.; Gogotsi, Y. Highly porous carbon spheres for electrochemical capacitors and capacitive flowable suspension electrodes. Carbon 2014, 77, 155–164. [Google Scholar] [CrossRef]
  7. Campos, J.W.; Beidaghi, M.; Hatzell, K.B.; Dennison, C.R.; Musci, B.; Presser, V.; Kumbur, E.C.; Gogotsi, Y. Investigation of carbon materials for use as a flowable electrode in electrochemical flow capacitors. Electrochim. Acta 2013, 98, 123–130. [Google Scholar] [CrossRef]
  8. Cho, Y.; Yoo, C.-Y.; Lee, S.W.; Yoon, H.; Lee, K.S.; Yang, S.; Kim, D.K. Flow-electrode capacitive deionization with highly enhanced salt removal performance utilizing high-aspect ratio functionalized carbon nanotubes. Water Res. 2019, 151, 252–259. [Google Scholar] [CrossRef] [PubMed]
  9. Dennison, C.; Beidaghi, M.; Hatzell, K.; Campos, J.; Gogotsi, Y.; Kumbur, E. Effects of flow cell design on charge percolation and storage in the carbon slurry electrodes of electrochemical flow capacitors. J. Power Sources 2014, 247, 489–496. [Google Scholar] [CrossRef]
  10. Lohaus, J.; Rall, D.; Kruse, M.; Steinberger, V.; Wessling, M. On charge percolation in slurry electrodes used in vanadium redox flow batteries. Electrochem. Commun. 2019, 101, 104–108. [Google Scholar] [CrossRef]
  11. Brunini, V.E.; Chiang, Y.-M.; Carter, W.C. Modeling the hydrodynamic and electrochemical efficiency of semi-solid flow batteries. Electrochim. Acta 2012, 69, 301–307. [Google Scholar] [CrossRef]
  12. Hoyt, N.C.; Wainright, J.S.; Savinell, R.F. Mathematical Modeling of Electrochemical Flow Capacitors. J. Electrochem. Soc. 2015, 162, A652–A657. [Google Scholar] [CrossRef]
  13. Chayambuka, K.; Fransaer, J.; Dominguez-Benetton, X. Modeling and design of semi-solid flow batteries. J. Power Sources 2019, 434, 226740. [Google Scholar] [CrossRef]
  14. Petek, T.J.; Hoyt, N.C.; Savinell, R.F.; Wainright, J.S. Slurry electrodes for iron plating in an all-iron flow battery. J. Power Sources 2015, 294, 620–626. [Google Scholar] [CrossRef]
  15. Petek, T.J.; Hoyt, N.C.; Savinell, R.F.; Wainright, J.S. Characterizing Slurry Electrodes Using Electrochemical Impedance Spec-troscopy. J. Electrochem. Soc. 2016, 163, A5001–A5009. [Google Scholar] [CrossRef]
  16. Yang, K.; Xiong, S.; Zhang, H. A comprehensive 3D multi-physics coupled simulation model of slurry redox flow batteries. J. Power Sources 2022, 531, 231315. [Google Scholar] [CrossRef]
  17. Fang, W.; Pan, S.; Zhang, F.; Zhao, Y.; Zhang, H.; Zhang, S. A three-dimensional flow-electrochemistry coupling model for optimizing the channel config-uration of lithium slurry redox flow battery. Chem. Eng. J. 2024, 485, 149572. [Google Scholar] [CrossRef]
  18. Devi, N.; Singh, P.; Arpornwichanop, A.; Chen, Y.-S. Study on the treatment of carbon black for slurry electrodes of all-iron redox flow batteries. Electrochim. Acta 2025, 511, 145393. [Google Scholar] [CrossRef]
  19. Xiong, B.; Zhao, J.; Li, J. Modeling of an all-vanadium redox flow battery and optimization of flow rates. In Proceedings of the 2013 IEEE Power & Energy Society General Meeting, Vancouver, BC, Canada, 21–25 July 2013; IEEE: Piscataway, NJ, USA, 2013; pp. 1–5. [Google Scholar]
Figure 1. The schematic diagram of the semi-solid all-iron redox flow battery. (a) The flow channel. (b) The battery structure. (c) 1—Semi-solid all-iron redox flow battery single cell; 2—Slurry storage tank; 3—Pump; 4—electronic load; 5—data collector; 6—Adjustable DC power supply; 7—DC voltage transmitter; 8—DC current transducer; 9—Stabilized DC power supply; 10—Computer.
Batteries 11 00166 g001aBatteries 11 00166 g001b
Figure 2. The effect of magnetic field on the semi-solid all-iron redox flow battery. (a) Polarization curves of the semi-solid all-iron redox flow battery during charging. (b) The turning area of the flow channel where the magnetic field has a more obvious effect on the mass transfer inside the electrode (see dotted circled regions). (c) Negative flow channel of the battery after charging. (d) Discharge time of the semi-solid all-iron redox flow battery under different conditions.
Batteries 11 00166 g002aBatteries 11 00166 g002b
Figure 3. The simulation of the semi-solid all-iron redox flow battery. (a) Three-dimensional model calculation domain. (b) Comparison of experimental and numerical results. (c) Concentration distribution of Fe2+ in cross-section of positive flow channel (discharge process, battery voltage: 0.95 V, discharge current density: 0.05 A/cm2 (almost the same for all flow rates), SOC: 50%).
Batteries 11 00166 g003aBatteries 11 00166 g003b
Figure 4. Concentration distribution of Fe2+ in the semi-solid all-iron redox flow battery. (a) The section line 1 at the middle section and the section line 2 at the exit. (b) Distribution change of Fe2+ concentration along the positive flow channel, membrane, and negative flow channel.
Batteries 11 00166 g004
Figure 5. The polarization curves of the battery during discharge. (a) Polarization curves of the battery during discharge at different slurry flows. (b) Polarization curves of the battery at different initial electrolyte concentrations.
Batteries 11 00166 g005
Figure 6. Concentration distribution of Fe3+ in cross-section of positive flow channel at different initial electrolyte concentrations (discharge process, SOC: 50%). (a) c0 Fe = 500 mol/m3, (b) c0 Fe = 1000 mol/m3, (c) c0 Fe = 1500 mol/m3, (d) c0 Fe = 2000 mol/m3, (e) c0 Fe = 2500 mol/m3.
Batteries 11 00166 g006
Figure 7. Comparison of different inlet and outlet section lengths. (a) Three-dimensional model of the battery with different lengths of inlet and outlet sections. (b) Partial enlarged view of concentration distribution of Fe2+ in the positive electrode cross-section (discharge process, c F e 0 = 1000 mol/m3, SOC = 50%, and Q = 150 mL/min).
Batteries 11 00166 g007aBatteries 11 00166 g007b
Figure 8. Polarization curves of the semi-solid all-iron redox flow battery at the beginning, the middle, and the end of discharge under different lengths of inlet and outlet sections.
Batteries 11 00166 g008
Table 1. Conductivity of slurry electrode with different electrolyte concentrations.
FeCl3
(M)
FeCl2
(M)
NH4Cl
(M)
Conductivity
(mS/cm)
Positive111180
Negative/11150
Table 2. Geometric parameters of numerical model of the semi-solid all-iron redox flow battery.
ParameterSymbolValueUnit
Flow channel widthW_channel0.01m
Flow channel depthD_channel0.004m
Middle section channel lengthL_ch_mid0.06m
Length of inlet and outlet channelL_ch_let0.03m
Membrane thicknessL_m0.00022m
Disclaimer/Publisher’s Note: The statements, opinions and data contained in all publications are solely those of the individual author(s) and contributor(s) and not of MDPI and/or the editor(s). MDPI and/or the editor(s) disclaim responsibility for any injury to people or property resulting from any ideas, methods, instructions or products referred to in the content.

