The experimental thermal characterization of the battery cell results is evaluated, discussed and incorporated into the simulation model of the commercially available 40 Ah battery cell. The temperature distribution of the battery cell model is simulated in three scenarios within a test environment. In the first two studies, the thermal model behavior will be analyzed based on the variation of the exterior test conditions of the battery within the climate chamber during controlled external conditions. In the third study, the restrictions and benefits of varying the standard reference cell design with similar internal structure will be evaluated and discussed from a BTMS point of view.
3.2. Characterization Results of Thermal Parameters
The experimental procedures undertaken for this section are explained in
Section 2.1.2. The radiation-related surface properties used in Equation (7) of the battery compartments are taken from a material data sheet provided by Optris GmbH
® (Berlin, Germany) [
66]. The geometry parameters used for the averaging procedures mentioned in Equations (8)–(11) were characterized and reported in our previous study [
47]. Altogether, the set of thermal parameters derived for the model parameterization in this study is considered to replicate the battery behavior realistically. The obtained values for the electrode stack components are in good agreement with data reported for a NMC/Graphite type stack in several other studies [
17,
29,
31,
32,
67]. An overview of the thermal parameters for the electrode stack, the battery and the environment at the 25 °C reference temperature is shown in
Table 1:
Temperature dependency of the electrode stacks thermal properties had often been assumed to be constants in the temperature range of interest in previous battery modeling approaches [
64,
65,
71]. However, there are several studies that report temperature dependency on material level, and suggest a similar tendency on cell level [
30,
32,
72]. Therefore, the temperature influence on the effective heat capacity and the effective thermal conductivity of the electrode stack is considered for the model parameterization with respect to the temperature range of 20 °C to 80 °C in this study. Finally, fitting polynomials are derived that will be used to parameterize the thermal properties of the electrode stack in Equation (1).
The experimentally determined stack component’s heat capacity and the calculated effective stack variable are shown in
Figure 3. The measured values of the heat capacity
interval are within 900
to 1300
for the electrode coating materials, are within 1200
to 1900
for the separator, and are within 900
to 1200
for the calculated effective stack heat capacity. The effective stack heat capacity interval is more comparable to the electrode coating’s range than to the separator’s range. The dominant influence of the electrode coatings is presumably based on the volume ratio within the effective stack capacity. The electrode’s coatings are represented by approximately 70%, the separator by 16% and the collector sheets by 14% of the overall stack volume. The value intervals for the different material types are in good agreement with heat capacity measurements in the temperature range up to 50 °C at 0%
from similar battery cell materials in the literature [
29,
31]. For each of the measurement objects a least-squares curve fitting procedure is used to analyze the heat capacity trend dependent on the temperature evolution. The resulting curves are nonlinear, and the related coefficient of determination
is above 0.97 in each case. Therefore, it can be concluded that each curve reproduces the temperature dependence seen within the experiments reasonably well. The polynomial orders derived in this study for the different materials, however, remain to be suggestions for the cell under use, since polynomials of orders varying in several degrees are reported in literature [
29,
72].
In case of the separator, the experimental values up to 27
are not considered for the fitting procedure, since such a steep slope is not reported in the literature within the temperature range of interest. Such a physical behavior would be a contrast to the evaluated results of similar separator material reported by others [
29]. The measurement error might be attributed to a gap or contact flaw between the separator sample and the crucible bottom, which would lead to an increased heat resistance within the sample system. Therefore, a decrease of the sample system’s DSC signal in comparison to the reference system’s DSC signal would lead to a decrease of the calculated heat capacity [
73].
Additional variable dependencies of heat capacity
will be named for completeness, but will not be further considered in this model study. In [
29], a nonlinear dependency on
is reported for NMC-type lithium–ion batteries, whereas a similar effect is not seen in iron–phosphate (LFP)-type lithium–ion batteries [
72].
In a study by Maleki et al. [
31], the influence of ageing on heat capacity is considered, and measurements of fresh and cycled cells, 500 cycles at 45 °C, on cobalt–oxide type battery cells were compared. It was concluded that ageing is negligible in the context of heat capacity in contrast to a study by Vertize at al. [
74], where a visible decrease in heat capacity up to 1
at the end of the cell’s lifetime was attributed to the change of internal chemical structures.
The temperature diffusivity of the stack components are considered with respect to the temperature range 20 °C to 80 °C within this study, as shown in
Figure 4. The measured sample temperature diffusivity
and the calculated through-plane temperature diffusivity
values are within the interval of 0.1
to 0.65
, while the in-plane temperature diffusivity
values are two factors of ten higher within a small interval around 11.1
. A positive linear trend is visible for the separator within the temperature range 20 °C to 80 °C, while the porous material temperature diffusivity shows a negative linear trend.
The in-plane temperature diffusivity is based on arithmetic averaging and the through-plane temperature diffusivity is calculated based on harmonic averaging. Therefore, the rise in magnitude related to the in-plane temperature diffusivity is due to the high thermal diffusivity of the current collector sheet materials, while the low values of the through-plane temperature diffusivity can be related to the short current collector thicknesses and the low magnitudes of the sample material values. For each of the measurement objects, a least-squares curve fitting procedure is considered to analyze the temperature diffusivity trend dependent on the temperature evolution. The resulting curves are linear, and the related coefficients of determination are within the interval range of 0.75 to 0.98. While the fit for the separator explains the variance of the measurements results less accurately, the fitting curves for the sample materials and the effective values are well matched.
Based on equation Equations (12) and (13), the effective thermal conductivity variables are calculated with respect to the previous thermal characterization results. The calculated through-plane thermal conductivity values are within the interval 0.6 to 0.72 , while the in-plane thermal conductivity values are almost two magnitudes higher within the interval 27.5 to 35.0 .
In both cases, a nonlinear, positive trend of the effective thermal conductivities is derived. Both quantities of interest increase roughly 15% in magnitude within the temperature range 20
to 80
, which is comparable to an increase of
of roughly 20% in the same temperature range, while
and
are decreased by 0.2% and 5%. While the ratio in magnitude of
and
is clearly induced by
and
, the positive temperature dependency trend is enhanced by
. The heat propagation effect based on the presented results would relate to the following: “Enhanced temperature levels within the electrode stack will lead to increased heat propagation and a decrease of its temperature non-uniformity”. Recent research advances focusing on the enhanced thermal conductivity of electrodes for NMC-type batteries have shown that a positive temperature dependency could be realistic, and even higher thermal conductivity magnitudes can be achieved by innovative electrode designs [
33]. The contrary effect, however, was deducted in former studies [
32,
75] on commercially-available, NMC-type, lithium–ion batteries, which derived twice a decrease in the magnitude of
, and an almost constant
within the overall temperature range of 0
to 40
under the presence of an electrolyte. Therefore, the derived temperature dependency results of the thermal parameters are considered to be trustworthy for the thermal model parameterization of the present study based on the same electrode type, but their transferability to other battery models is limited.
3.3. Thermal Model Study
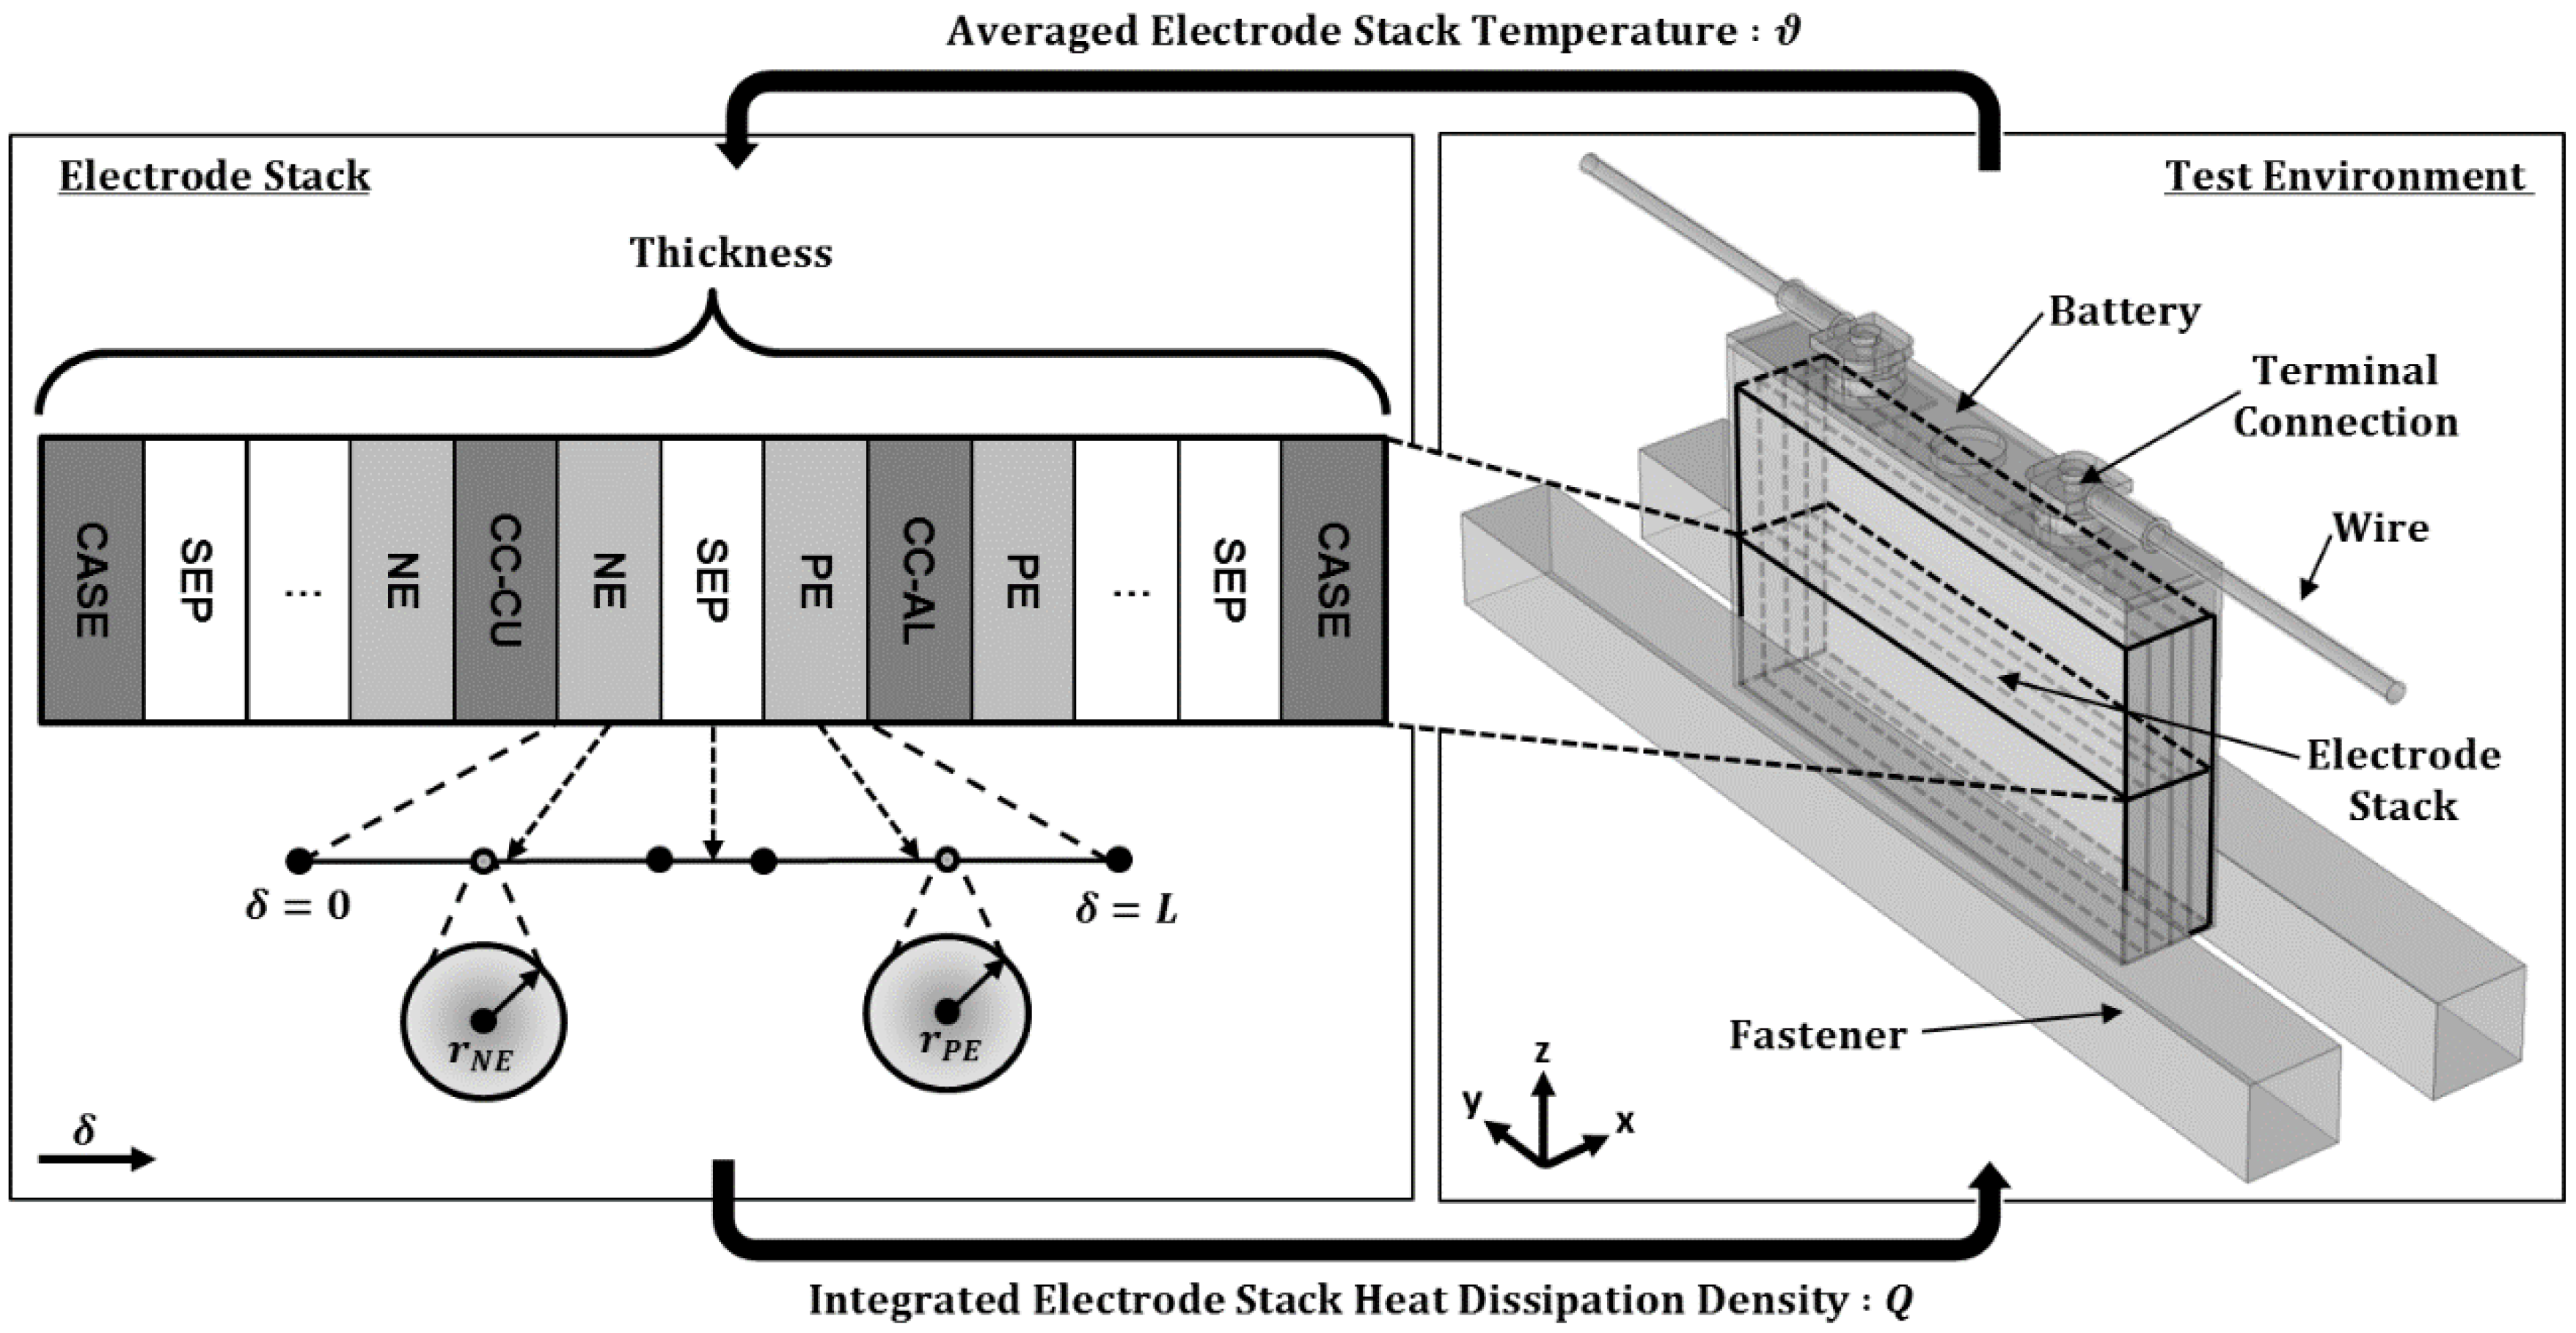
From a physics point of view, the temperature behavior of a battery cell could be analyzed with a focus on heat dissipation within or heat removal from its encapsulated electrode stack. The battery cells’ temperature distribution is realistically predicted when the balance of the two characteristics is properly matched. While the heat dissipation setting is analyzed and validated for the electrochemical part of the aforementioned battery model in our previous study [
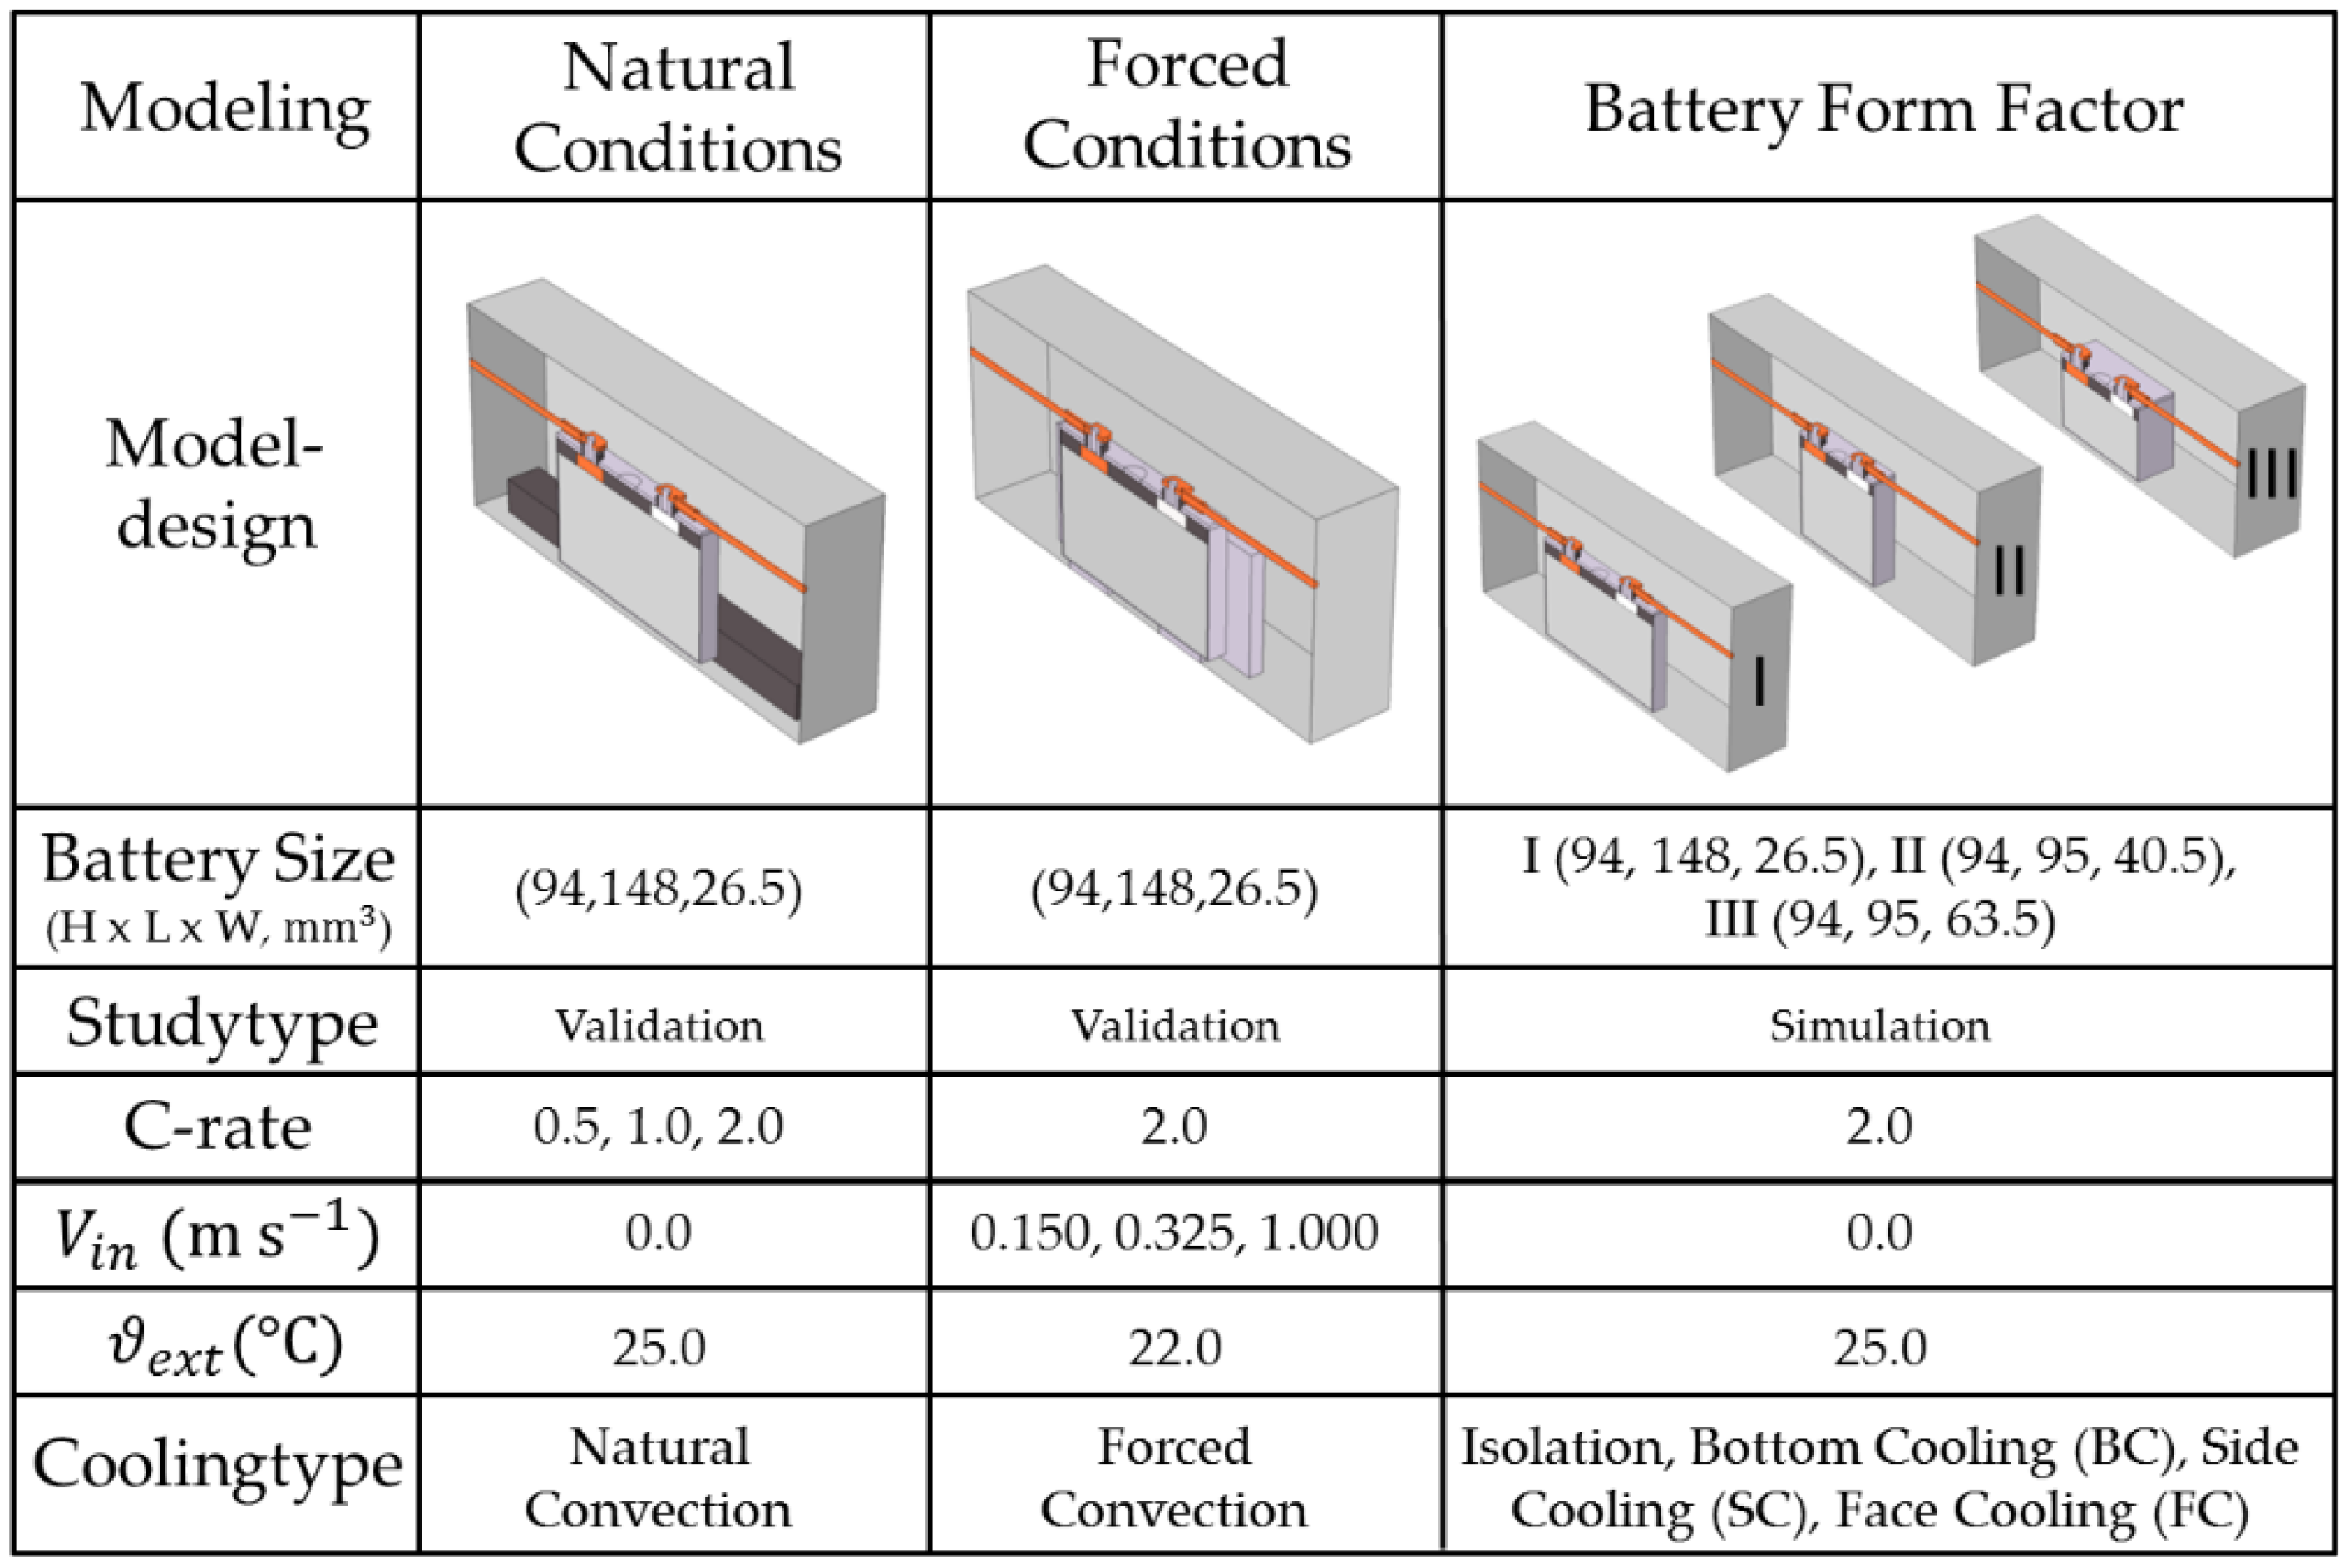
47], the present study will further examine the characteristics of heat removal within exterior test settings and realistic battery applications. Three model categories are evaluated in this study with a focus upon the natural convection condition, forced convection condition and the influence of the battery cell design. The underlying cooling type categories and model parameter variations are presented in
Figure 5:
In the first two model studies, the temperature modeling approach is evaluated in comparison to real case scenarios measured in our laboratory as described in
Section 2.1.3.
In the first study, the focus is set on temperature variation dependent on current rates within the battery cell, while an external flow force is considered to be negligible. In the second study the maximal temperature and average heat rejections are analyzed at a constant current rate under varying air inlet velocities to match experimentally determined surface temperature patterns of a battery cell located within a test cell array. The test setups are performed to quantify the model accuracy and understand the dynamic of heat generation and heat rejection.
Frequently stated BTMS strategies applied to lithium–ion batteries are bottom cooling (BC), small side cooling (SC) or large face cooling (FC) [
29,
65]. From the known cooling strategies, a hybrid of high conductive heat pipes with an externally-connected heat removal mechanism is reported to be very effective [
3]. A layout of the used cooling concepts is shown in
Figure 6:
The exterior thermal management might benefit from the known anisotropic thermal conductivity within the electrode stack, when cooling on surfaces next to enhanced heat flux patterns is prioritized. Therefore, model study three aims to evaluate the effectiveness of the proposed cooling concept by evaluating the maximal temperature rise and cooling times until temperature equilibrium is reestablished. The heat removal mechanism is considered to be ideal, which is modeled by a fixed temperature condition on a surface boundary on the heat pipe.
3.3.1. Thermal Validation—Natural and Forced Conditions
For the analysis of the scenario under natural convection, both of the temperature curves during 0.5 C, 1.0 C and 2.0 C during the discharge and charge phase and a subsequent rest phase were taken into account, as shown in
Figure 7a,b:
The simulated curves match well for the current levels 0.5 C and 1.0 C with a maximal error below 3.4%; however, at the current level 2.0 C, the error increased up to 7.9%. The absolute difference is comparable to a maximal temperature difference of roughly 0.8 K in the first two cases and a maximal temperature difference up to 2.2 K in the third case.
As a result of the error analysis, the model tends to overestimate the average battery surface temperature at the 2 C current rate, while those lower rates are properly matched. A fluid force dependent on a significant temperature rise, which could present the difference, would be based on the buoyancy effect; an upstream of heated air created under the influence of gravity. Its impact, however, is stated to be negligible when advection is present [
8,
18].
In the scenario under forced convection the influence of centralized fan air cooling within a climate chamber on the temperature magnitude of the batteries is studied. Therefore, the measured surface temperature curves of three battery cells, which were measured during 2 C cycles, are taken into account. Between each experimental curve a significant deviation of up to a two and a half degree Kelvin temperature difference is observable during the heating phase, each evaluated at the top of the battery. The result proves that the centralized fan is cooling each cell differently based on the position within the test arrangement. Three equivalent air cooling velocities were estimated by matching the measured surface temperature curves of the batteries within the test arrangement and a simulated average temperature curve of the battery model. All results are shown in
Figure 8:
The simulated curves deviate more pronounced for the batteries corresponding to the center and the midway position with equivalent inlet velocities 0.125 and 0.325 with a maximal error below 8.42% at and 6.20 % at , as compared to the battery at the side with a maximal error below 3.68% at and an equivalent inlet velocity of . The errors relate to a maximal absolute temperature difference of , and respectively. While in the first two cases the real battery surface temperature is overestimated, in the last case it is slightly underestimated. Due to the position of the batteries at the center and the middle within the test arrangement, a superimposed cooling influence is visible that is not considered, when only one battery is simulated alone. The superimposed experimental effect could be conductive cooling induced by the highly conductive metal fasteners. The battery at the side that is mostly exposed to fluctuating air is simulated with good accuracy. Hence, the thermal model accuracy increases with increasing equivalent air velocity.
The simulated surface temperature distribution
of the battery cell in both validation cases is shown in
Figure 9a,b:
In both cases, the maximal temperature level on the surface is located at the short sides and at the battery cell bottom, which coincides with the direction of in-plane thermal conductivity of the electrode stack. The minimal surface temperature is on the top of the battery cell in both cases, which might be due to presence of the low thermally conducting synthetic cradle on top of the electrode stack. The temperature around the terminal is slightly elevated compared to the rest of the top battery surface, which is due to its direct connection to the electrode stack.
In conclusion of both studies, the model accuracy resembles the realistic match of heat dissipation and heat removal. While heat dissipation increases with the current rate, heat removal is increased with exterior air inlet velocity. During the natural convection scenario, higher deviation occurred, when the temperature increase was more pronounced and heat rejection effects were not fully met within the simulation. During the forced convection scenario, the model accuracy was increased by matching the inlet velocity with the resulting average battery surface temperature during a 2 C cycle. The result at the forced convection scenario supports the suggestion that the temperature deviation between the simulated and experimental results in the natural convection scenario might be induced by the missing buoyancy flow force in the simulation. Altogether, the thermal model is able to predict the spatial temperature behavior of a battery within the test environment under the current rates and airstream velocities of interest with good accuracy.
3.3.2. Model Study—BTMS Compatibility under Battery form Factor Variation
The temperature levels might actually be effectively further decreased compared to the validation scenarios when conductive cooling plates are attached. A direct comparison for the cooling types BC, SC and FC with respect to the form factors I, II and III for the maximal temperature rise
of the electrode stack
is shown in
Figure 10:
An evaluation of the thermal characteristic within the electrode stack
is performed based on the following equations:
therein,
is the maximal temperature rise during the cycle
,
is the maximal spatial temperature difference during the cycle
,
is the average temperature rise during the heating phase
,
is the average temperature inhomogeneity indication factor during the heating phase
and
is the cooling time until temperature equilibrium is reached after heating is stopped.
variable is evaluated within the electrode stack volume
during the denoted test time
where
is the heating phase and
is the rest time.
A rating system compares the results at the
current rate of the standard PHEV2 design I against all other cases. Highlighted color modes and associated thresholds are shown in
Table 2. The results for the validation and model study scenarios are shown in
Table 3.
The best case scenario for each quantity of interest is given at cell design III/SC and III/BC. The worst case scenario for each quantity of interest is given at III/FC, I/SC and I/BC. The difference between the best and worst case to remove heat gradually increases from design I over II to III. Therefore, a BTMS could maintain an improved battery temperature performance at design III, especially with a strategy based on SC. However, if SC and BC are not applicable, a significant performance reduction is expected to occur in comparison with the best reference case I/FC.
During the natural convection, forced convection and isolation case at 2 C, higher temperature levels were reached than within each case with dominant cooling by conduction. From isolation, over natural convection to the forced convection case, the maximal and average temperature rise gradually decreases, while the maximal temperature difference and average temperature inhomogeneity indication factor gradually increase. The inverse proportionality of the two subcategories: “Temperature magnitude and temperature inhomogeneity” is reported in other studies [
55,
76] as well. This is deemed to be a challenge for an appropriate BTMS design.
Work at National Renewable Energy Laboratory was conducted to develop ageing models of lithium–ion cells that consider the impact of temperature and charge/discharge cycles on battery lifetime. The study [
7] by Smith et al. on an NMC/Graphite chemistry type battery cell reported on the influence of the battery cell’s yearly average temperature on the battery life. Within an average depth of discharge (DOD) range in between 20% to 75% for an average battery temperature of 20 °C, a lifetime of roughly ten years, and for an average battery temperature of 33 °C, a lifetime of approximately five years, was stated [
7]. The difference in 13 K average battery temperature equals a lifetime difference of roughly five years [
19], which likewise equals a lifetime difference of four to five months per degree Kelvin. Hence, from the evaluated cases in the present model study, the highest average temperature increase in each cell design combined with isolation would be comparable to a lifetime reduction of roughly two years. Similarly, each battery in scenario I/FC, III/SC or III/BC would equally benefit by the appropriately chosen BTMS cooling with a maximal lifetime enhancement of seven to eight months; a difference up to one year and four to five months.


