1. Introduction
The commitment to reduce greenhouse gas emissions [
1] has led countries and cities to start implementing actions to limit the environmental impact of the transportation sector. Such actions included restrictions on the circulation and selling of Internal Combustion Engine Vehicles (ICEV). Consequently, the automotive sector is being forced to accommodate their products to these requirements through the electrification of their models [
2].
The Electric Vehicle (EV) market has shown a steady growth over the last decade [
3], maintaining a momentum that is now undeniable [
4]. The number of light-duty EVs on the road rises every year, going from 3.1 million units in 2017 to 5.1 in 2018 and 7.2 in 2019 [
5].
Even though the numbers show a clear tendency towards the adoption of EVs, the market is still in its initial steps, with EVs only representing 2.6% of the global car sales [
3]. As such, EVs, and their lithium ion (Li-ion) batteries as core components, still require further efforts to overcome the existing challenges. Regardless of the continuous improvements, EVs are still mainly manufactured using large, heavy and costly Li-ion batteries, with no forecast of change in the near future [
6].
One of the key challenges for these Li-ion batteries is ageing. As a consequence of time and use, Li-ion batteries degrade, causing a decrease in capacity and power that starts the very first day they are built [
7]. This loss of performance concerned early EV manufacturers who feared that their clients would not be able to meet their day-to-day requirements after some years. This was a relevant concern at the time, considering that EVs had around 100 km of driving autonomy with their 16 to 24 kWh batteries. Therefore, it was stated that the End of Life (EoL) of these batteries, for traction purposes, should be fixed around 80% of State of Health (SoH) [
8,
9].
In this context, the concept of the second-life battery was born, influenced by two main factors: the high value of EV batteries with 70–80% SoH at EoL and the high costs of new batteries. Therefore, original equipment manufacturers (OEM) from automotive companies and utilities started exploring the idea of reusing EoL EV batteries for stationary purposes with less energy requirements, in the pursuit of value creation from circular architectures [
10]. In fact, second-life batteries offer an attractive price, even considering that the cost of new batteries is expected to drop in the upcoming years [
11].
Besides making use of the remaining energy in retired EV batteries, second-life applications also allow an increase in the battery lifetime of up to 10 additional years [
12,
13] or more [
14], depending on the application. There are several services that second-life batteries can offer to the electricity grid. Currently, the first generation of EV batteries are being tested for a diversity of applications, such as grid frequency regulation or peak demand control, all around the world. For instance, projects such as Bosch BMW Vattenfall where 2 MWh from second-life batteries have been installed for a grid-scale demonstrator in Hamburg (Germany) [
15]; that of Daimler AG in cooperation with GETEC Energie AG and The Mobility House on the premises of Remondis SE that built a 13 MWh recycling plant in Lünen (Germany) [
16]; the General Motors project with 108 kWh for their own facilities in Milford, MI (USA) [
17]; and the Sunbatt project developed in collaboration between the SEAT company and the UPC (Universitat Politècnica de Catalunya) in Spain to reuse PHEV batteries for the SEAT facilities [
18] are some of the examples where second-life applications are being put to test. Moreover, almost all EU next-generation calls related to batteries ask for second-life application approaches.
As an emerging market, large efforts are being put into analyzing the second-life battery performance and business profitability. Literature analysis on Rest of Useful Life (RUL) prognosis of EVs take the fixed threshold of 70–80% SoH for granted [
19,
20], and second-life business case studies also consider the same 70–80% SoH threshold as a departing point for their work [
21,
22]. Even a recent study of the EoL of automotive batteries considers this threshold and asks for similar studies in high-income countries [
23]. As no study has been completed to validate these thresholds, this study ventures into a statistical approach to have a first overview of what to expect at the EoL.
As the EV production increases, the cost of Li-ion batteries keeps dropping and currently lies between 180 to 270 EUR/kWh [
24]. In view of this cost reduction, car manufacturers have opted to improve the autonomy of the vehicles by increasing the battery capacity rather than reducing the price of EVs [
25,
26].
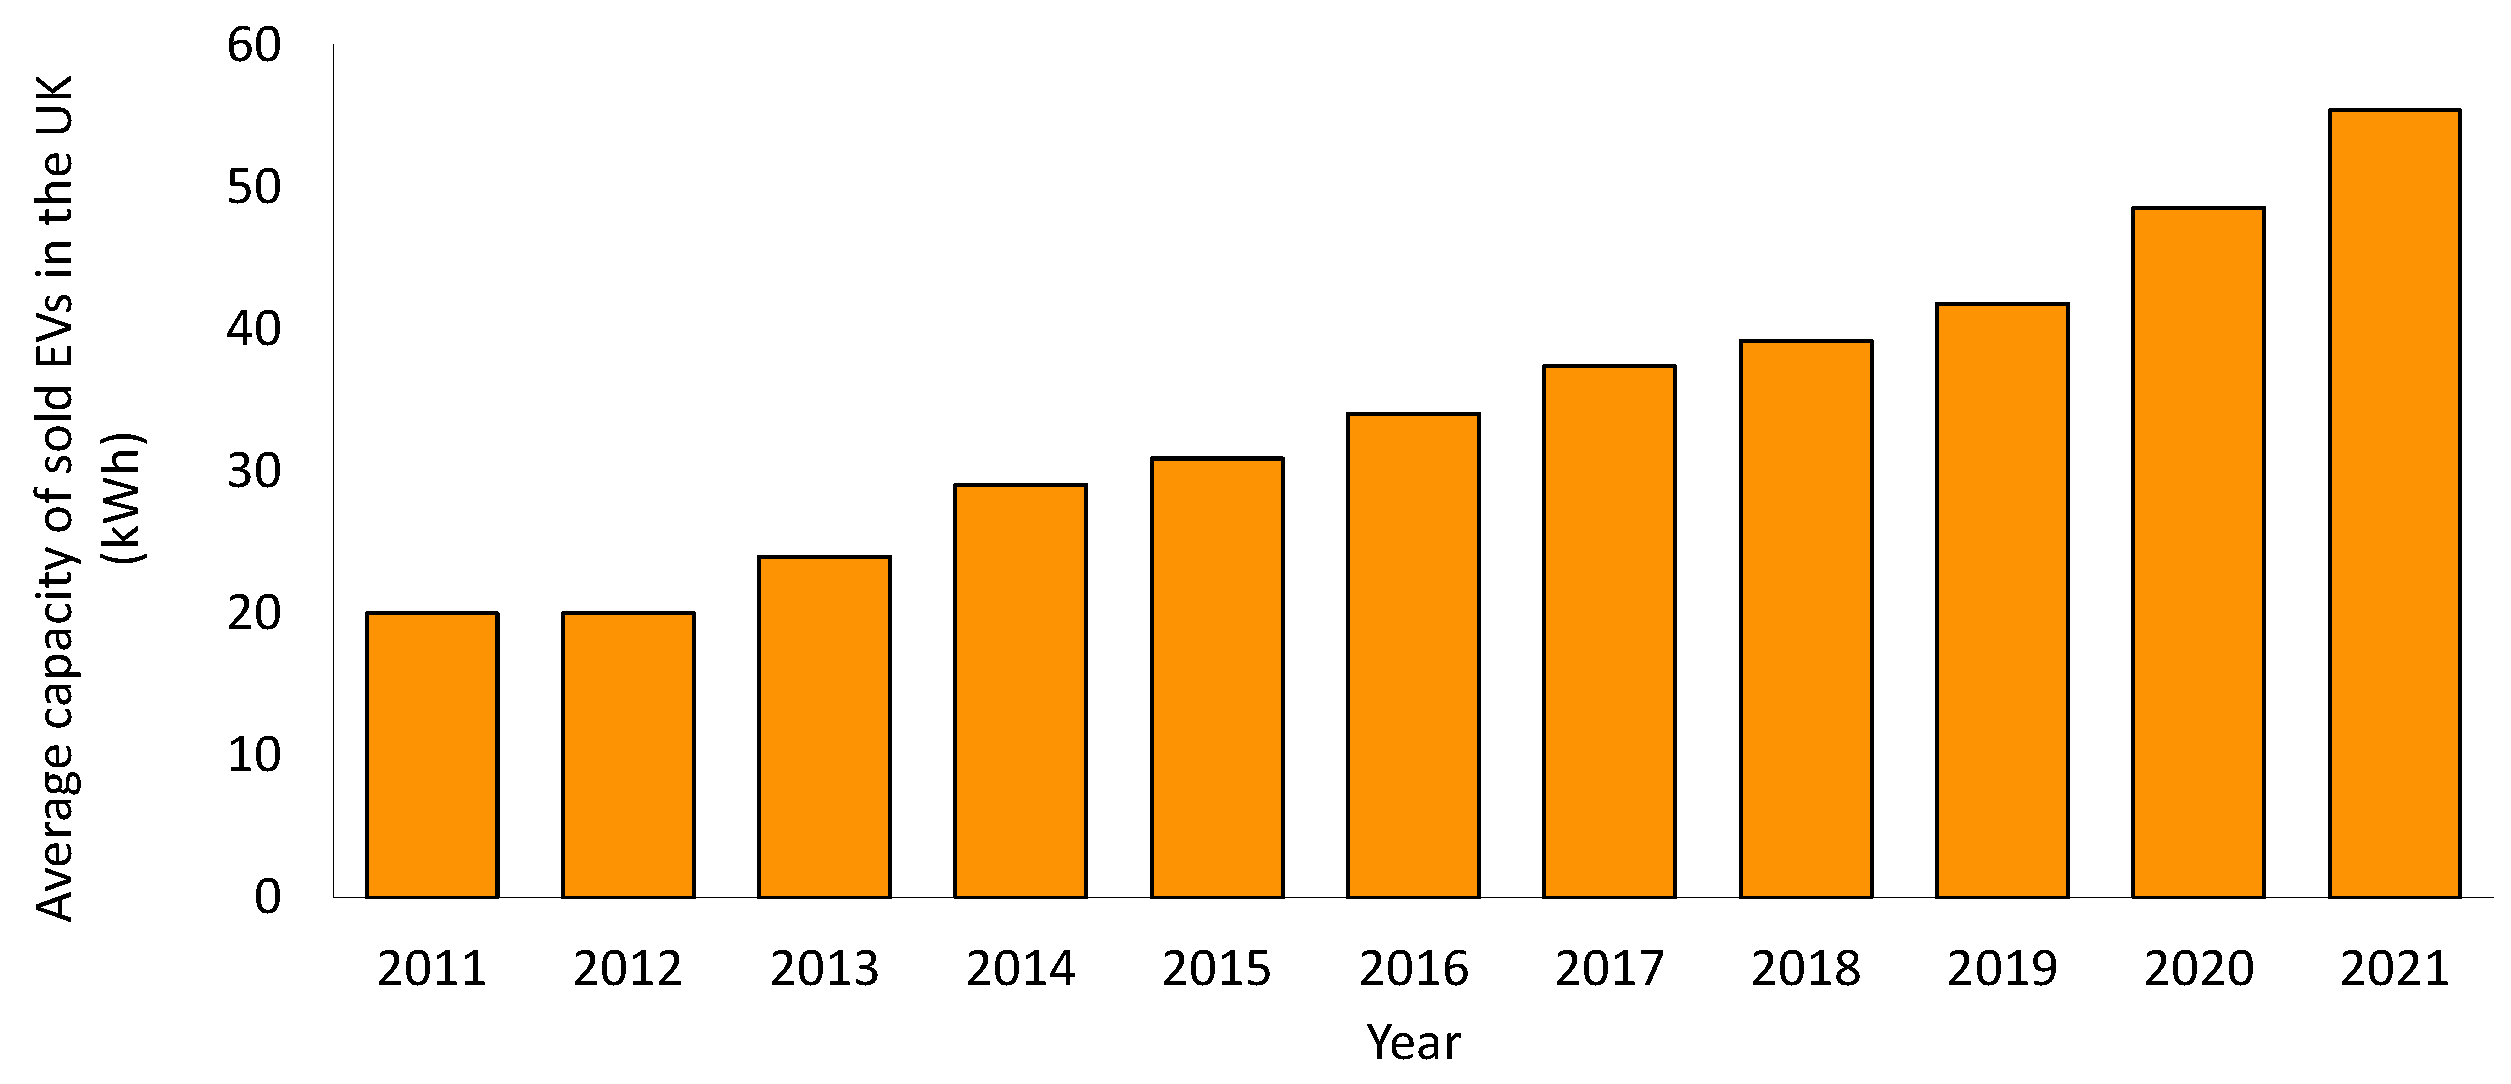
Figure 1 shows the evolution of the average capacity of EVs in the UK between 2011 and 2021. During 2011 and 2012, only two types of EVs were sold, those having 16 kWh and 24 kWh of battery capacity. After that, the 16 kWh battery models almost disappeared leaving space for the 30 and 40 kWh ones. With the arrival of luxury EV models, higher battery capacities (up to 100 kWh) entered the market. During the last few years, almost half of the models were 40 kWh capacity followed by 70 kWh capacity and, with fewer representations, 90 and 30 kWh models, respectively.
Increasing the EV battery capacity does not only positively affect the driving range. It also has other interesting side-effects related to the ageing phenomena during the EV’s first life, which will be further explored in this work. Temperature, depth of discharge (DoD), discharge rate (C-rate), state of charge (SoC) and time (even in use or not) are the main factors that have a direct incidence in battery ageing [
27]. Having a higher battery capacity directly softens the degradation caused by three of these factors: DoD, C-rate and temperature [
7]. Firstly, knowing that the driving profiles do not change, a battery with larger capacity will experience cycles with lower DoDs, reducing the degradation. Secondly, the C-rate per cell also decreases when increasing the battery capacity and, the lower the C-rate, the longer the lifespan. Finally, a lower C-rate also creates less self-heating due to the Joule effect, which means lower working battery temperatures and reduced ageing as a consequence.
In light of the previous points, the increased capacity of EV batteries will most likely have an important impact on the EoL conditions of the retired batteries, which will directly affect the second-life battery businesses. Therefore, the fixed EoL SoH threshold present in the literature for several years, when batteries differed from the ones currently on the market, may not be a good indicator of the actual state of the retired batteries. Indeed, some critical voices indicate that this 70–80% EoL threshold should be revised [
28,
29], arguing that the loss of performance at these levels of SoH may not be critical enough to force a battery replacement. Nonetheless, the actual SoH of retired vehicles, even for older models, remains unknown, as not many units have reached EoL yet. To clearly state whether second-life batteries are an interesting investment opportunity or not, it is important to know the remaining capacity of these batteries or, alternatively, their SoH after their first life.
Thus, the aim of this work is to evaluate the SoH of EV batteries at the EoL to both discuss what the second-life business should focus on and the 70–80% SoH threshold that has been blindly accepted. To do so, the study presents the most probable SoH value distribution at the EoL EV batteries for the following years based on the UK market data. This is achieved by taking into consideration multiple variables such as the EV battery capacity, the market evolution, the battery ageing and the vehicle use through time. The results aim to determine if the battery degradation is one of the causes for EV retirement, if the 70–80% SoH limit is too conservative or, on the contrary, if EVs will not even reach this limit and they will be retired beforehand. Finally, this study allows for the completion of a projection of the second-life battery availability through time and an analysis of the situation of the market on which they will impact. This study can be considered as a starting point for the estimation of which application is best suited for each type of battery.
2. Methodology
In order to have a better understanding of the EV batteries’ SoH when they reach EoL in the upcoming years, the following questions must be answered: How many EVs will be sold each year? What would be their capacity? What should be the average mileage of EVs at EoL? How do EV batteries degrade considering age, mileage and duty cycles?
Each of these questions will be addressed individually in this section. To do so, this study is based on UK data due to the ease of gathering data from retired vehicles in this country in comparison to other European ones. The methodology followed for this work is represented in
Figure 2.
2.1. Number of EVs Sold and Their Battery Capacity
To estimate the number of EVs sold each year, the data obtained from the Alternative Fuels Data Center are used [
30]. From this data, only full EVs are considered as a potential source for second-life batteries. PHEVs are discarded for three reasons: (i) The evolution of the EV market in the UK in the last years shows that, although PHEV vehicles have led the market in the past, in 2019 they lost market share in comparison to full EVs; (ii) PHEV batteries have even lower capacity than full EVs; (iii) Having more full cycles and being more stressed, PHEV batteries will end their life in vehicles in worse conditions (lower SoH) than those from full EVs.
The number of EVs sold per year can be expressed by Equation (1). However, as the market is quite variable and there was, at the time of the study, an important uncertainty due to the COVID-19 pandemic, the study forecasts the selling in the short term (until 2026):
Besides knowing the total number of EVs sold, it is important to consider the capacity that these vehicles will have. This is an important fact since, although having a similar SoH at EoL, the remaining capacity in them is clearly dependent on the size of the battery. For example, at 80% SoH, a 16 kWh has a remaining capacity of 12.8 kWh, whereas a 90 kWh still holds 72 kWh. On the other hand, the capabilities of the EV are worse for those vehicles having an initial lower capacity, which can affect the retirement date of their batteries. The data shown in
Figure 1 are used to obtain the share of each capacity over the EVs sold per year. From this data, it is clear that there is a trend towards higher capacity batteries over time.
2.2. Mileage Distribution at EoL
Even though the EV market started to grow more than ten years ago, it has not until recently reached a relevant proportion of market share. For this reason, there are still few retired EVs to draw any conclusions on the SoH of their batteries at EoL. Thus, it is necessary to extrapolate results and make several assumptions about EV EoL conditions.
First, this study considers that the average EV use or mileage will be similar to the one of ICEVs. To be even more conservative, this study will consider diesel vehicles instead of petrol as they tend to have a longer duration and mileage at the EoL. This first assumption is made on the basis that the battery capacity of current EVs is more than enough to satisfy common trips, which rarely exceed 100 km journeys [
31]. As previously mentioned, the capacity of the EVs on the road keeps increasing yearly (
Figure 1). Nowadays, the average capacity of the batteries from EVs sold in UK is higher than 50 kWh, which is about 10 times higher than the average daily consumption of EVs [
32]. Therefore, even at the EoL, when the capacity might substantially drop, most of the day-to-day trips could be still covered with severely aged batteries. In addition, it is expected that for longer trips, above 400 km, EV owners might decide to use other means of transportation or make use of fast charging stations on the way. Nevertheless, these trips are not that usual in the day-to-day use of private vehicles.
Thus, it can be assumed that the driving patterns of EVs will not be limited by battery capacity and therefore the ICEV use patterns can be considered as a good reference for EVs.
Secondly, as a consequence of the previous point, it can be assumed that EVs will be sent to dismantling facilities similar to diesel vehicles. This means that EVs will be cast aside having a similar distribution of mileage and years as diesel cars. To obtain that distribution, it is necessary to determine the age of vehicles when deregistered and also the mileage they have. As this is a statistical study, it is not meant to relate the age of vehicles with the mileage through an equation as in other works [
33]. Instead, this study works with the distribution of mileage of deregistered vehicles according to the age of the vehicle, to further relate it to the SoH of the batteries.
This is executed using the open data provided by the MOT (Ministry of Transportation) tests [
34], which are mandatory regular inspections of vehicles driving in the UK. From these datasets, only the following parameters were selected:
Test_class_id: indicates the type of vehicle. Number 4 refers to particular private cars;
Test_result: indicates whether the vehicle passed the test or not. Only P and PRS were selected, indicating a satisfactory test result;
Fuel_type: refers to the fuel used. DI values were taken for diesel vehicles;
Test_mileage: indicates the accumulated vehicle mileage at the moment of the test;
First_use_date: indicates the registration year of the vehicle.
According to the number of retired vehicles, it is acceptable to neglect those vehicles that are less than 1-year-old and those older than 20 years at their retirement, as they are not representative cases (less than 1%).
Some driving particularities of vehicle owners according to the vehicle’s age are shown in the boxplot in
Figure 3a. The median of the mileage completed by vehicles rapidly increases in the first 8 years, then, it continues to increase smoothly until it starts decreasing after 20 years. This is alternatively visible in
Figure 3b, where the density peak moves gradually towards higher mileages. However, this tendency softens as the vehicle ages. Note also that the distribution’s deviation increases with the age, concluding that the values are less concentrated and that there is a wider dispersion of the driving needs of car owners.
Having the empirical mileage distribution of the deregistered vehicles by age, the following step is to find the distribution function (i.e., Normal, Lognormal, Weibull, or Gamma functions) that better represents the empirical data. To do so, the Cullen and Frey graph is first used for all the distributions to discard those that clearly deviate from the empirical data. Then, the fitdis function in “R version 3.6.3 (2020)” is used to evaluate the parametric distribution that best fits with the empiric distribution through the values of Akaike Information Criterion (AIC) and Bayesian Information Criterion (BIC). Although both criteria compute the likelihood differently and result in different values, in this case, they both point to the same parametric distribution when identifying the minimum value. These parametric distributions are presented in
Section 3.
2.3. Battery Ageing Model
In addition to the battery capacity and the EV registration year, it is important to evaluate the ageing of EVs through time. The common procedure to estimate the battery ageing is through the use of battery models. These models can go from relatively simple electric equivalent models [
35] to more complex physical-based models [
36]. However, these models are linked to a specific battery type and profile of use. Therefore, a model should be defined for each battery type on the market, which would result in a large number of models. In addition, a simulation should be run for each driving profile to estimate the ageing of each use case. Knowing that there are as many driving profiles as EV owners in the world, the number of simulations and time needed to estimate the SoH of all vehicles would be unfeasible. For these reasons, instead of using specific battery ageing models, this study takes empirical SoH values from different EVs around the world. In this way, most of the ageing factors, such as temperature or driving styles, will be inherently considered even though they are not specifically tackled.
The SoH estimated data from real driving are taken from the EV Battery Degradation Comparison Tool by Geotab [
37]. This tool collects data from different EV models in many company fleets and presents the average SoH for each model and year. In this study, only the most-sold EV models in the UK are considered for the statistical analysis, which are all of the Tesla models, Nissan Leaf, Volkswagen Golf and BMW i3.
The data are used to obtain the degradation tendency of vehicles according to their age, which can be used to forecast the SoH of currently circulating vehicles over time. This tendency is relatively linear when grouping all EV models, with obtained R
2 values of 0.83 or 0.85, depending on the battery size. This regression can be translated into Equation (2), where α is the parameter that relates the ageing of the battery with time. This parameter is significantly different depending on the battery capacity, as shown in
Table 1.
The lower ageing factor for high-capacity batteries suggests that these EVs degrade more slowly over time. Nonetheless, knowing that higher capacity batteries are less stressed due to their size but not due to their materials or technology, it is important to translate these values into mileage and cycles to validate this ageing tendency.
For that, this study considers the value given by the UK government statistics portal in the file NTS0901 [
38], which indicates that the annual mileage of car fleets is about 28,175 km and, although not all fleets have the same behavior, this value is taken as a reference for the sake of simplicity. Equation (3) relates the SoH of the battery with the mileage through the parameter β. The value of β depends on the size of the battery, as shown in
Table 2. Notice that it decreases with the increase in battery capacity, which is in line with the pattern seen in Equation (2).
According to Equation (3), the lower capacity EVs reach the 80% SoH with a lower mileage than the high capacity ones. For example, vehicles with the smallest battery capacity are expected to arrive at 80% SoH around 100,000 km. However, when translating this ageing to battery cycles (considering a cycle as a full charge and discharge of a battery) the situation changes considerably.
To convert the mileage to cycles, the consumption of the vehicle must be considered. This consumption is strongly related to the weight of the vehicle (including the battery itself).
Table 3 shows the average consumption of affordable vehicles (lower capacity batteries) in contrast to luxury vehicles (higher capacity batteries).
Equation (4) relates the SoH of the EV with the number of cycles, by means of the factor µ. The value of µ depends on the size of the battery, as shown in
Table 4. Note that µ values for different battery sizes are closer to each other than α and β, being 12% higher for luxury cars.
Although previous relations showed that high capacity batteries might have a much better performance than low capacity ones in terms of mileage or lifetime, it is not the case when looking at the number of cycles. This means that battery technology is not that different in terms of ageing among the different capacity EVs.
Considering the previous facts, an enlargement of the lifespan of batteries during the first life could be easily obtained by increasing the battery capacity. By doing so, two problems are solved in a row: (a) range anxiety and (b) EVs’ longer lifespan. However, it should be highlighted that such large capacities are not required in most cases [
28]. Therefore, increasing the capacity may lead to an unnecessary use of resources to build an oversized battery, adding weight to the vehicle and reducing its efficiency.
3. Results
This section starts by presenting the EoL mileage distribution obtained as a result of the analysis presented in
Section 2.2. Then, the battery ageing model developed in
Section 2.3 will be validated. Finally, crossing the mileage parametric distributions with the ageing model in relation to the mileage, the following elements have been estimated:
The SoH of retired EV batteries;
The remaining capacity of retired EV batteries;
The increase in accessible capacity for second-life use per year.
Based on these findings, an overview of the stationary energy storage market and the possibilities for second-life batteries is presented in
Section 4 (Discussion).
3.1. EoL Mileage Distribution
In order to evaluate the EoL conditions of EV batteries, the starting point of the study is the mileage of EoL vehicles, based on the actual retirement rates of ICEVs. The parametric distributions are listed in
Table 5 ordered by the vehicle age at retirement.
3.2. Validation of the Ageing Model
In order to validate the ageing model developed in
Section 2.3, a comparison between the model and the warranty limits defined by different car manufacturers is presented in
Table 6. According to the model, the age and mileage needed to reach the SoH threshold considered exceed the warranty limits set by the manufacturers. This is to be expected, as warranties are defined so that only effectively damaged batteries or batteries suffering unexpected failures do not cross these limits.
Another interesting fact to observe from
Table 6 is that, as the battery capacity increases, car manufacturers take higher security margins in warranties, knowing that there are uncertainties regarding the ageing of batteries in EVs and because they have to ensure these values for all possible locations in the world. Note that, in terms of mileage, the deviation between warranty and degradation is maintained while it increases in relation to the age, as warranties tend to increase in mileage if the battery capacity increases but not so for the battery age. This goes in accordance with the increasing variability along age and mileage observed in the present study.
Therefore, numbers in
Table 6 confirm that the approximation executed in the study is robust enough to cross these trends with the mileage from retired vehicles and, with that, to obtain an estimation of the expected SoH of EV at the EoL, as will be presented in the following subsections.
3.3. EoL Batteries: Soh and Remaining Capacity
Figure 4 shows the probability density function of the SoH at EoL for different capacity vehicles. The values correspond to vehicles retired at 5-years-old, as an example. It is clear that the higher the battery capacity, the higher the SoH at EoL.
Figure 4 also shows how almost all vehicles having more than 40 kWh retired at 5-years-old will arrive at their EoL with more than 70% SoH, independently of their mileage. Remember that, for the 5-year-old retired vehicles the median of mileage is above 100,000 km while 75% are below 170,000 km, but some vehicles might go above 200,000 km (see
Figure 3).
However,
Figure 4 presents the most probable value following this model, which entails an inherent confidence rate. This confidence range indicates that the end of the tail of these density functions might differ by ±10% SoH. This variability increases linearly with ageing. That is, when fresh at 100% SoH, there is almost no variability (one can take the density value as good) but it increases as the battery ages, increasing the confidence range equally.
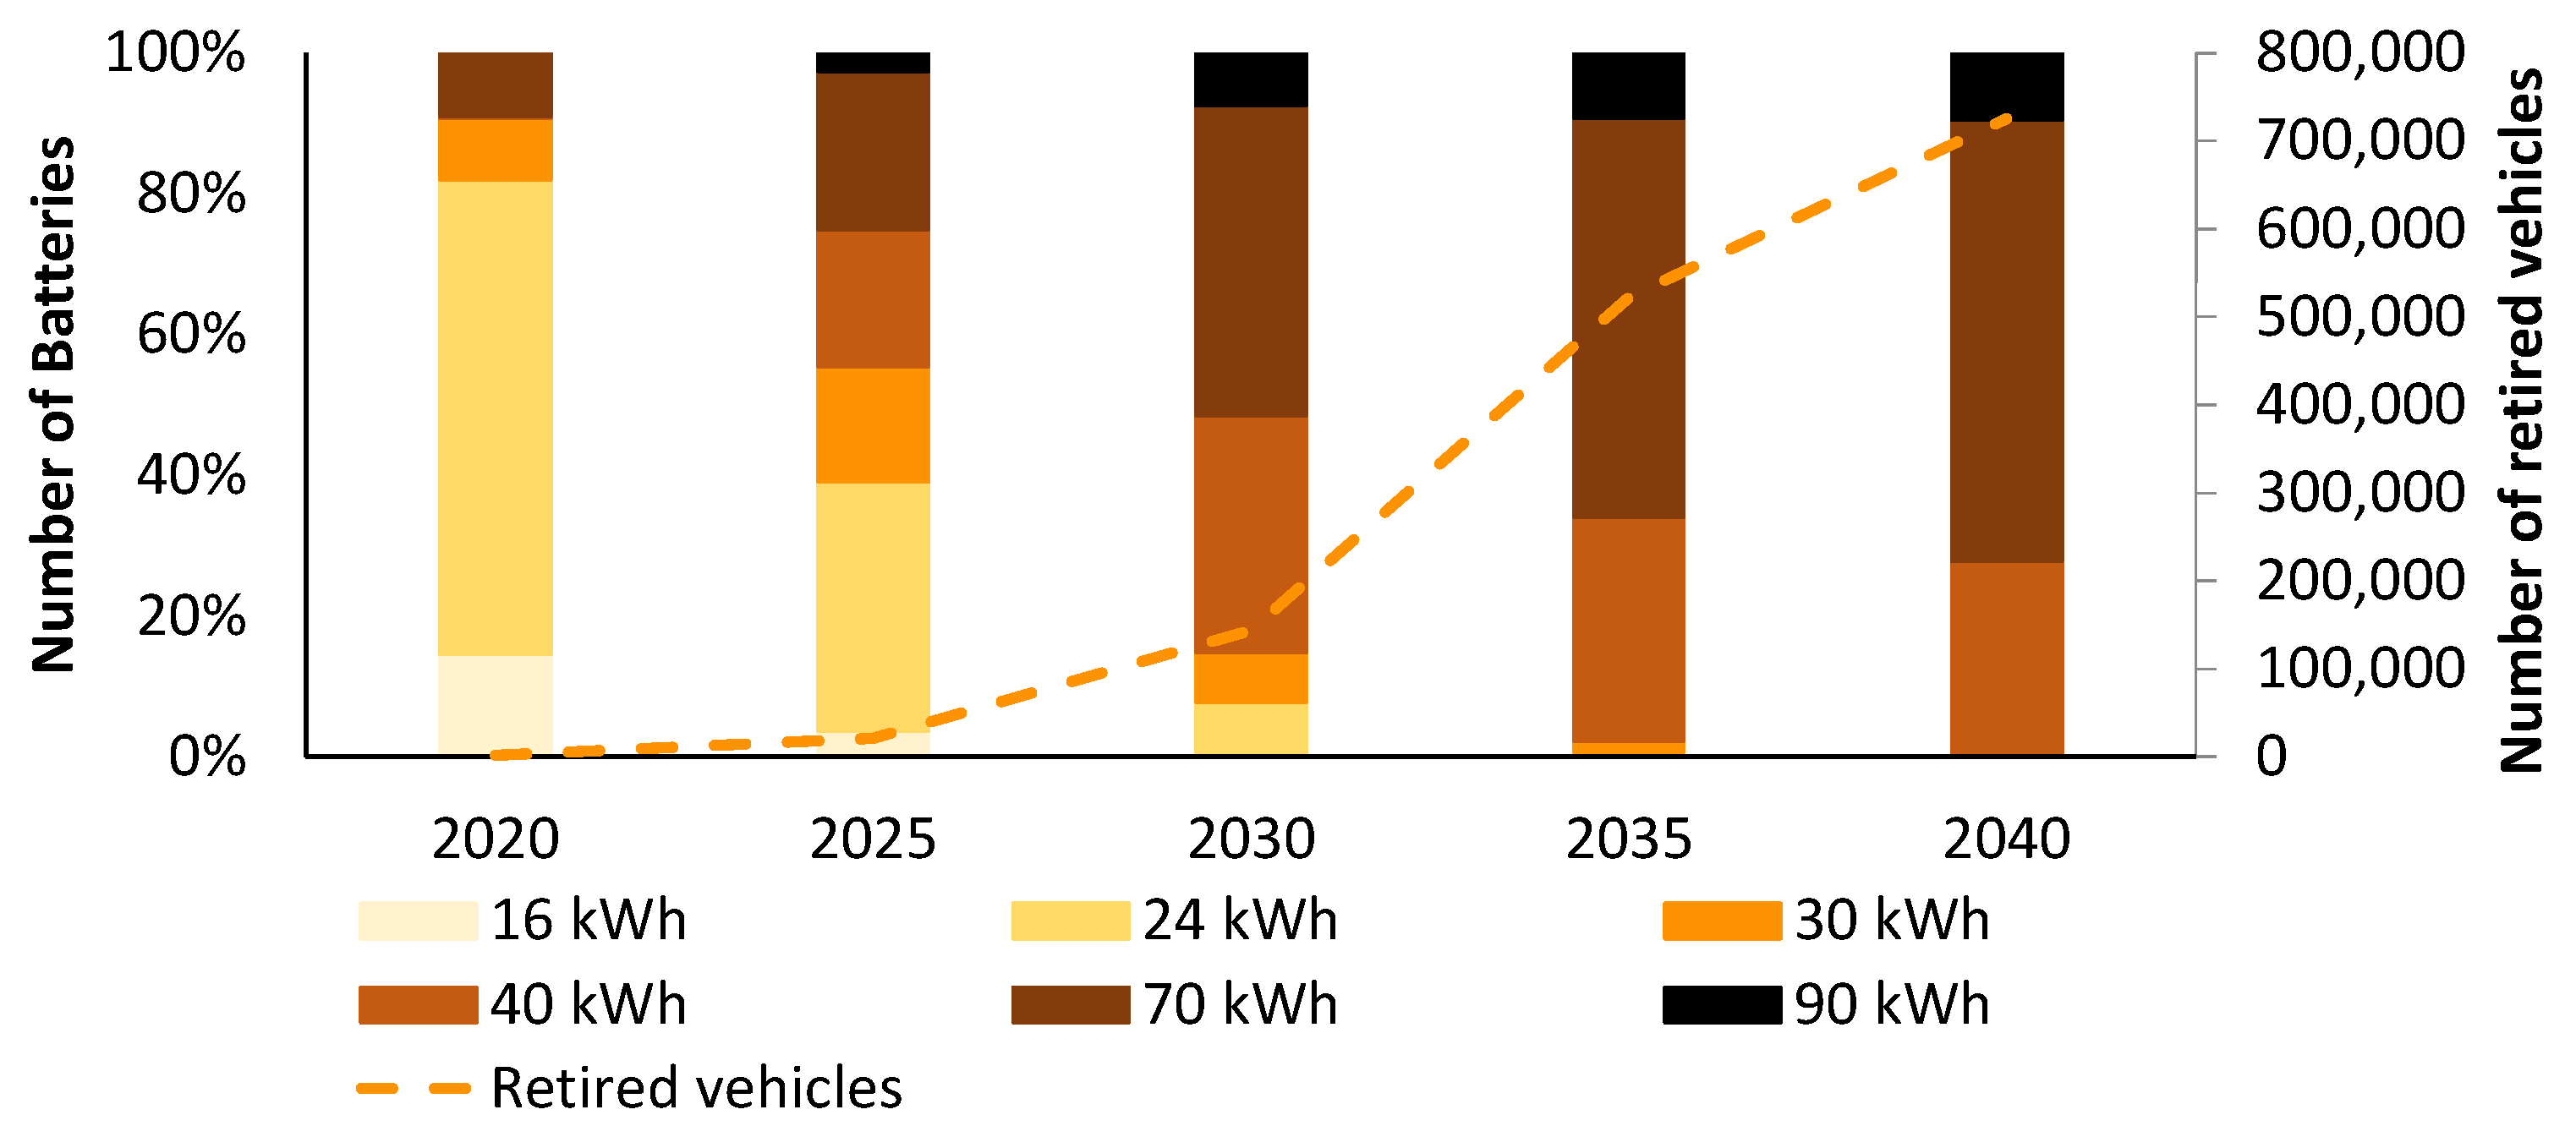
As the sales of EVs are continuously changing, this ageing approach has to be related to the year when the EV is sold. This leads to the results shown in
Figure 5, where the dashed line indicates the total number of EVs retired and, in columns, the share of each battery capacity-size of the retired vehicles.
According to these results, it is clear that for the following 5 years, most of the recovered EVs will be the ones with a battery capacity of 24 kWh or less. From then on, the share and the amount of higher capacity batteries will increase, with most of them being around 70 kWh by 2030. It is important to note that, although for the first years there is a relevant share of 24 kWh capacity batteries, the total amount of retired vehicles is extremely low in comparison to what is expected to occur around 2030. Thus, the battery re-use and second-life market seems much more interesting from then on. Nonetheless, it is important to evaluate the SoH of these recovered batteries to define their second-life purpose or whether, in the worst case, they must be directly retired.
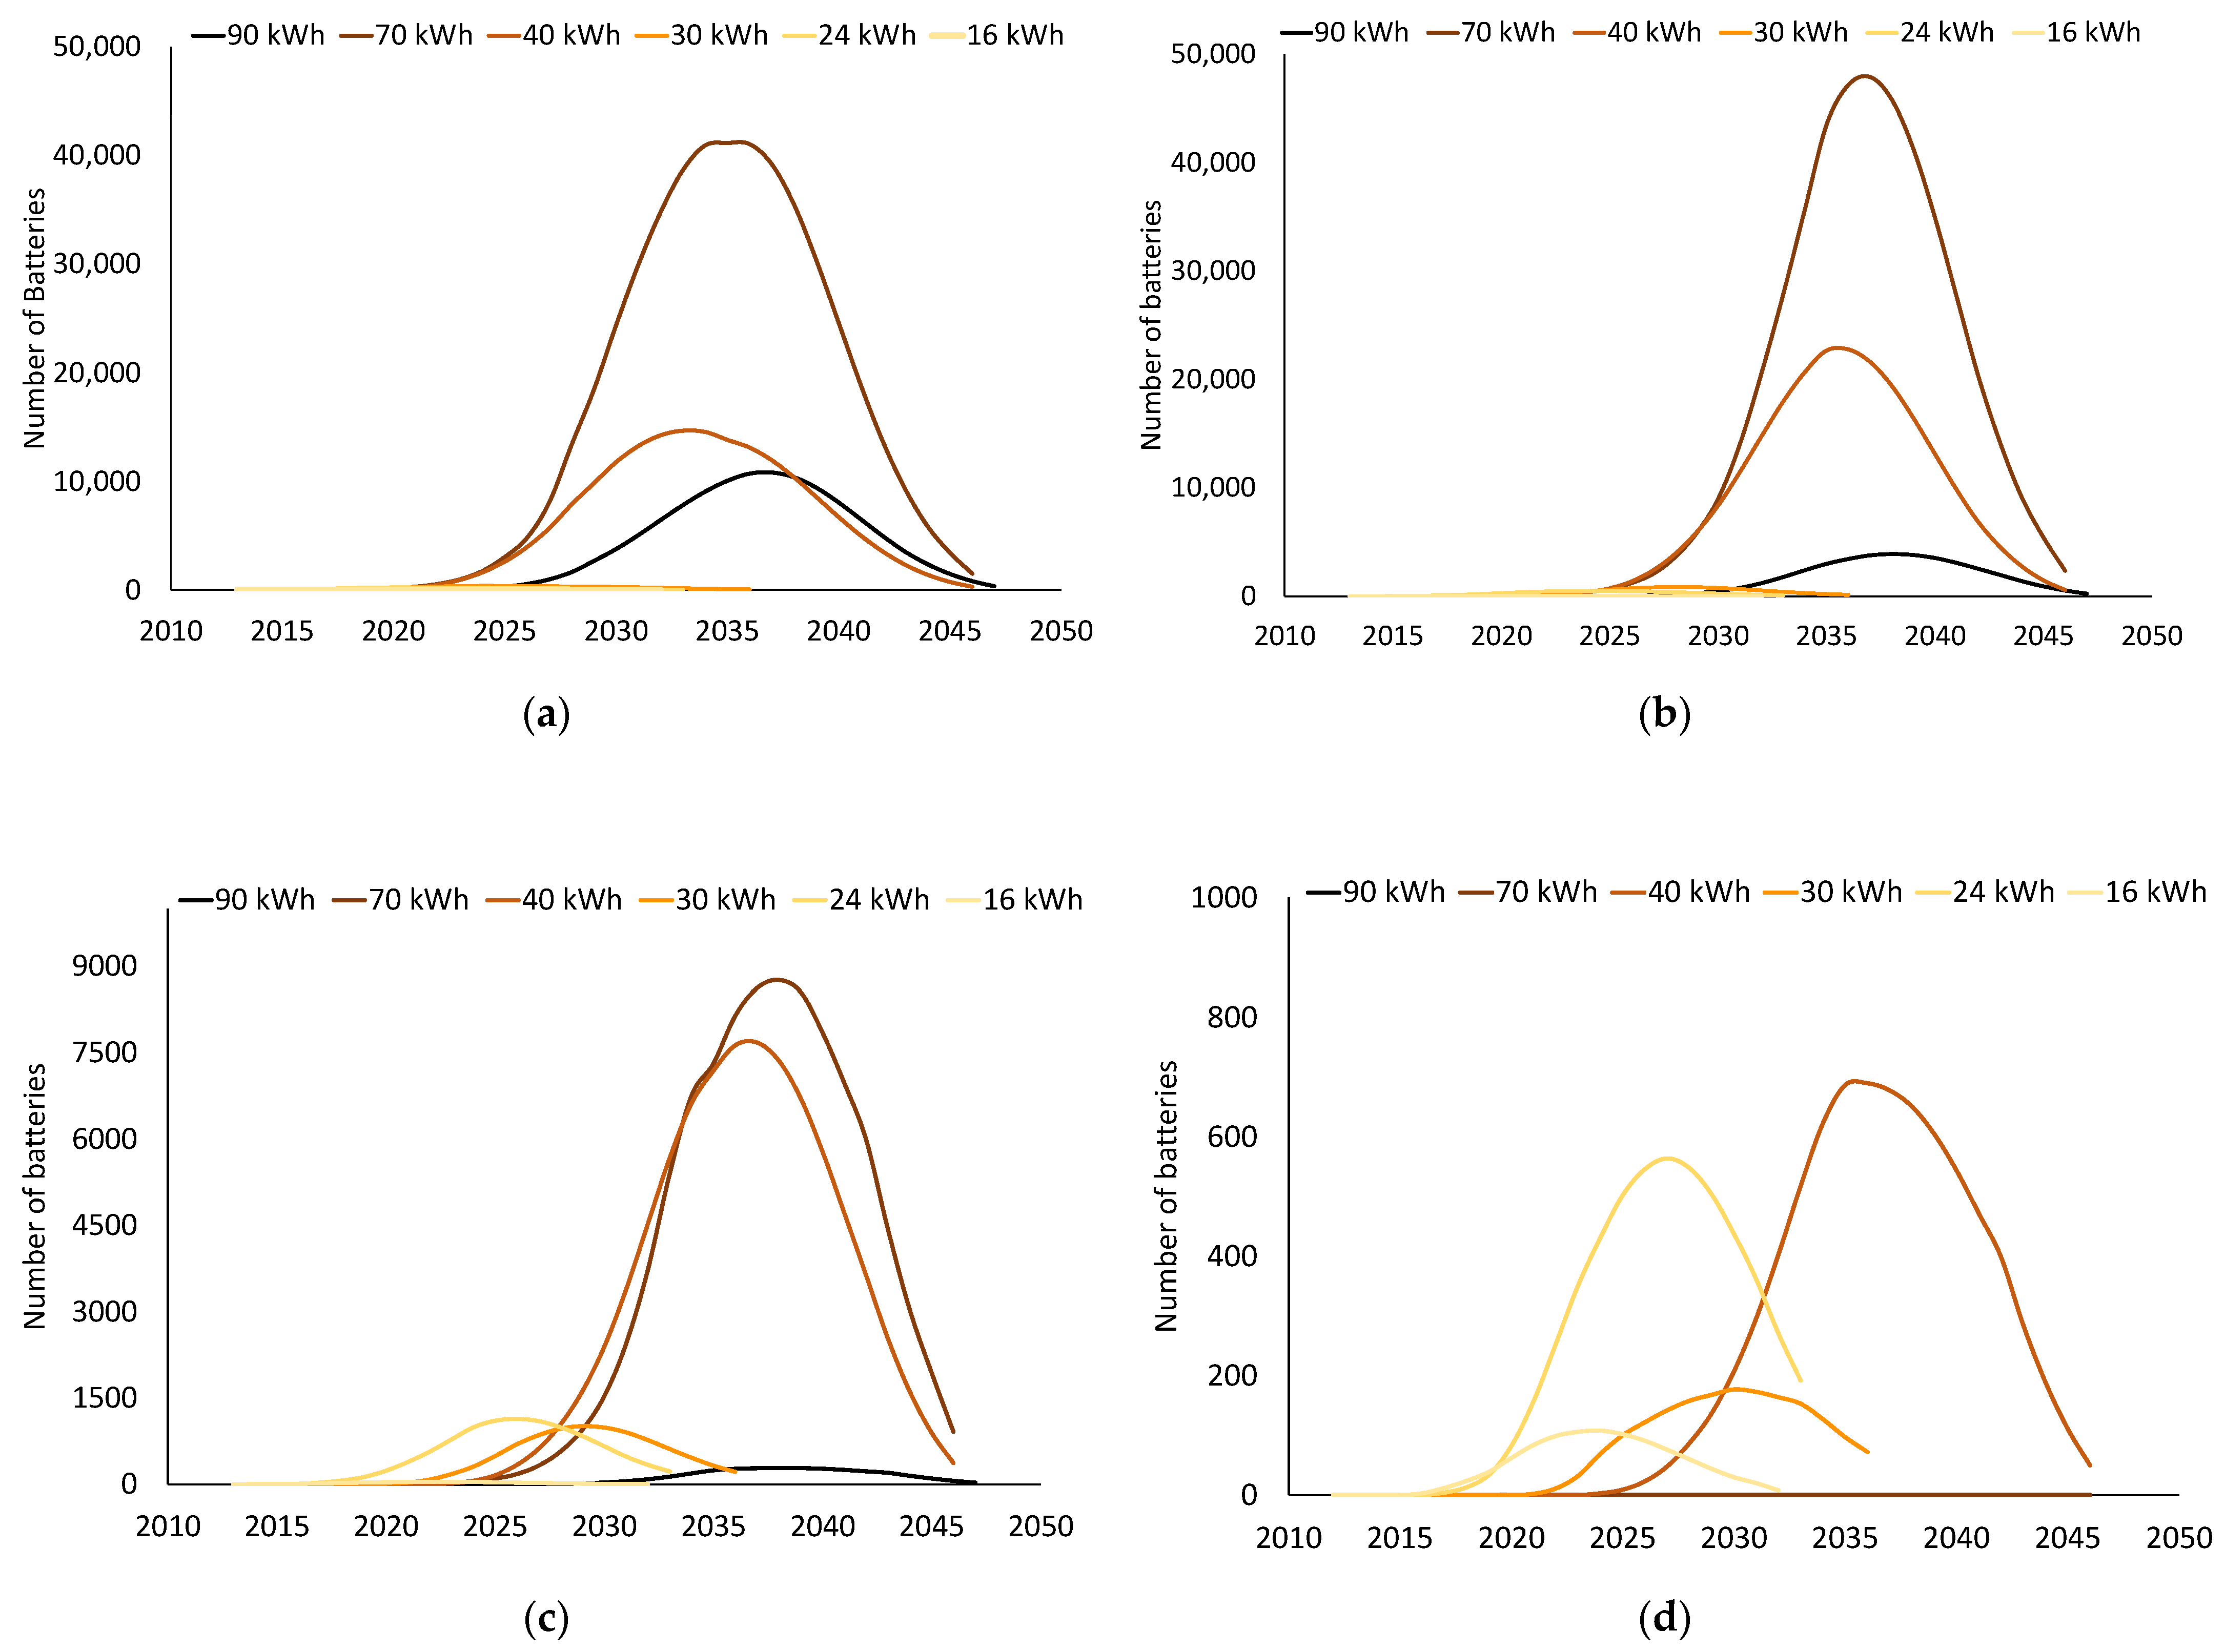
The following subplots in
Figure 6 present the evolution of SoH grouped in lustrums. It can be seen how, as the battery size increases, the background is covered by healthier batteries, which represents that the share of strongly degraded batteries (SoH < 60%) is mostly present in subplot (a) for 16 kWh EVs while, for battery capacities higher than 40 kWh, most of the recovered batteries will have SoH higher than 85%. Similarly, all subplots in the second column (EV batteries with capacities higher than 40 kWh) have the light-colored bars longer than the darker ones, which are almost irrelevant in comparison. This means that, while EV batteries grow bigger, almost all of the received batteries from retired vehicles will be relatively healthy (>75%).
Additionally, for subplots (a) and (c), the number of returned batteries is quite low for the years between 2030 and 2035. Moreover, the results indicate not to expect smaller batteries afterwards. Similarly, the batteries from retired EVs having a capacity higher than 40 kWh are expected to arrive in greatly increased quantities beyond 2030. As a bridge between low and high capacity batteries, between 2025 and 2035, it is expected that most of the retired vehicles will have around 30 kWh capacity batteries. Thus, for business purposes, it is advisable not to consider the re-use of 24 kWh batteries after 2030 and to incorporate those of 30 kWh from 2022 to 2035, when the business should clearly focus on higher battery capacities. Note that the right axis changes in the subplots due to the differences in the EV selling through time.
Another way to express these results is by putting the focus on the SoH. That is, instead of separating the plots by battery capacity,
Figure 7 presents the results in ranges of SoH. Beware that, similar to
Figure 6, the axis of the subplots change. According to this, the high peak visible in subplot (c), which almost reaches 10,000 retired EVs, is just a little higher than the low (black) rise in subplot (b). Therefore, the amount of heavily aged batteries should not discourage second-life battery companies, as they will be almost negligible considering the total amount of other healthier batteries to explore. Nonetheless, in subplot (c), the reader can observe how 24 kWh batteries (and 30 kWh to a lesser extent) will be available well before all of the rest and this opens their way to the second-life businesses before bigger batteries come into play in a similar way to what happened with the EV market growth.
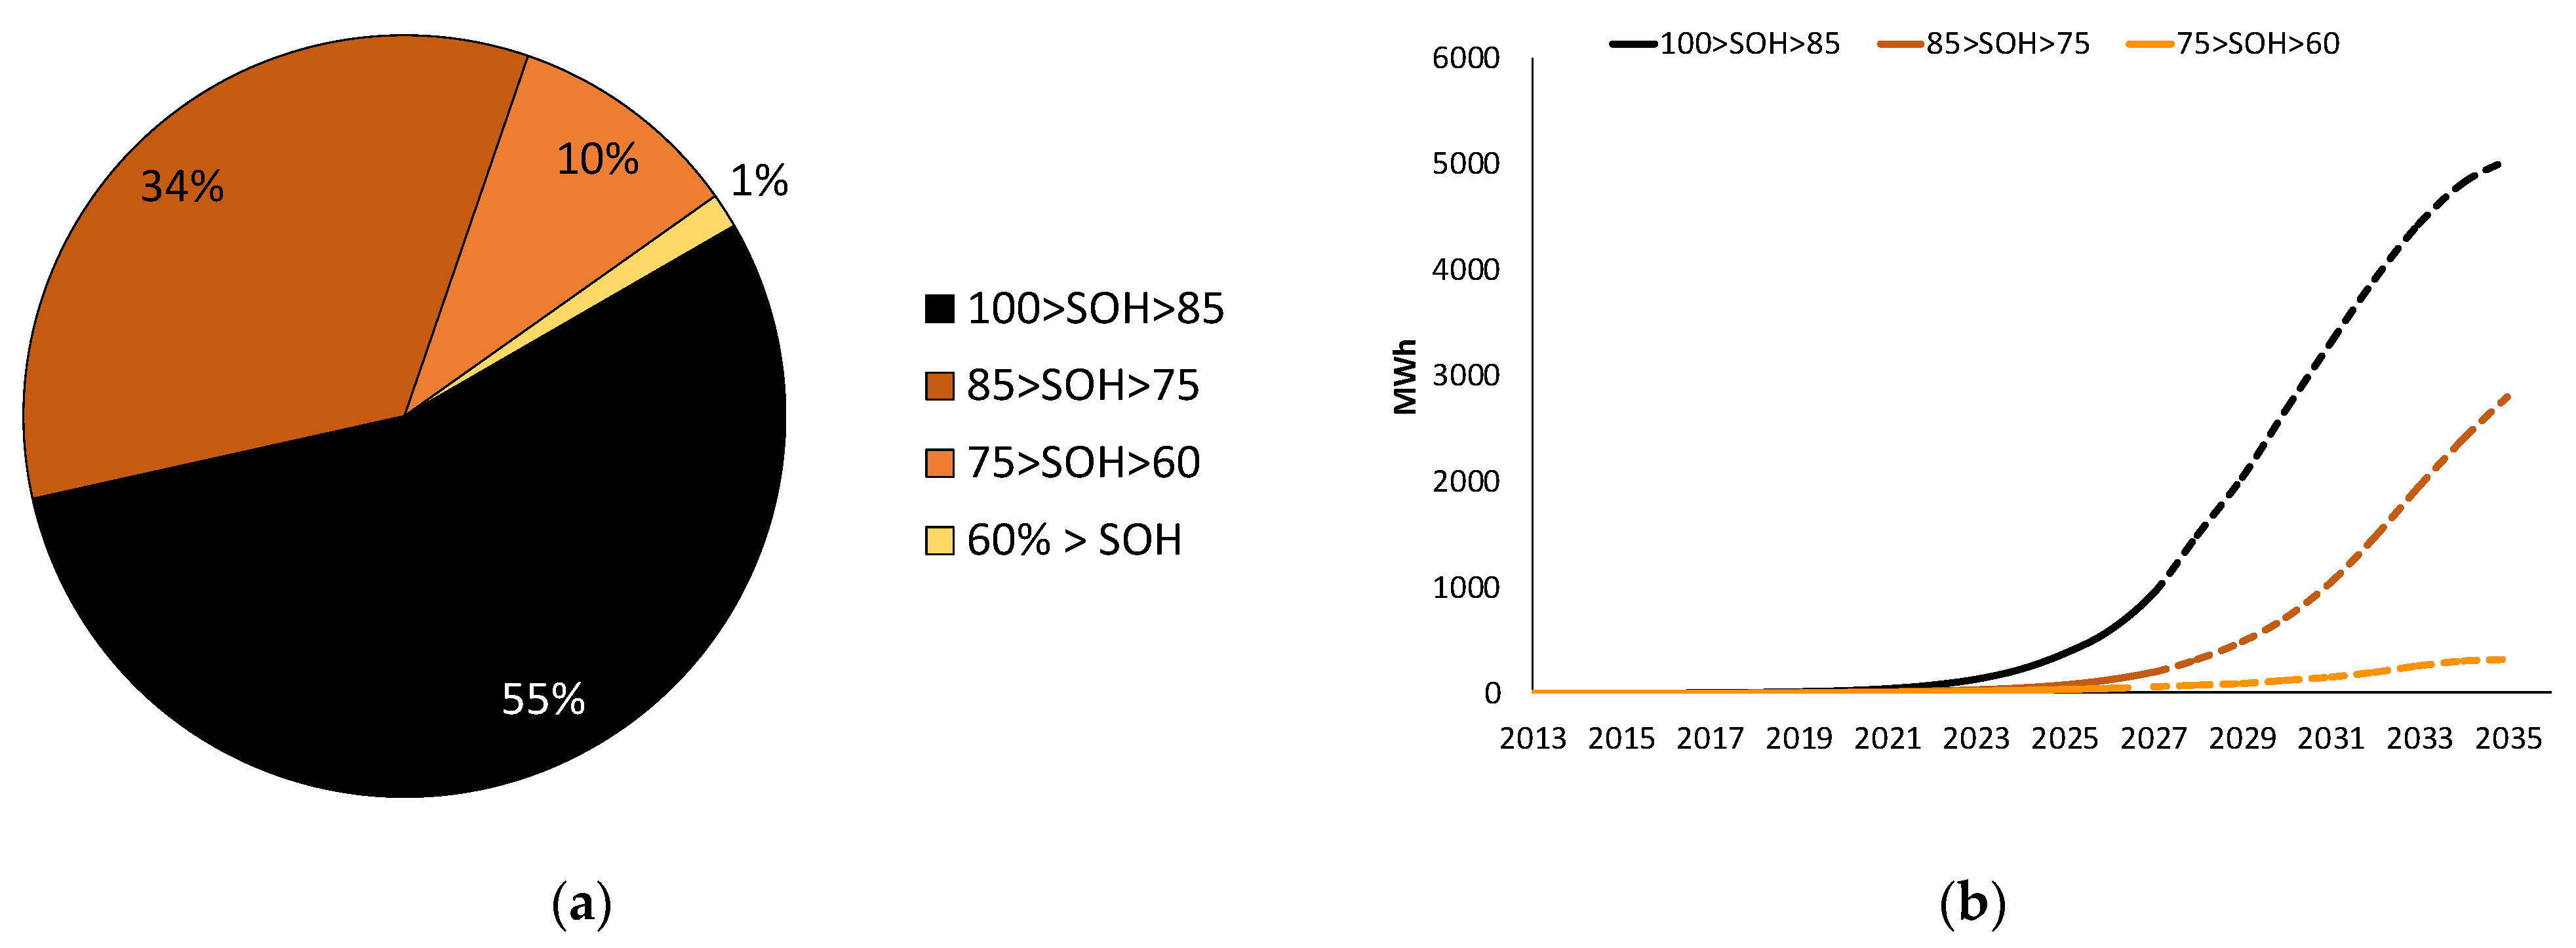
Figure 8a indicates that most batteries will reach EoL in a healthy state. In fact, 55% of batteries will have a SoH higher than 85%, while about 90% of recovered batteries will still have a SoH higher than 75%. Finally, less than 1% of batteries will have a SoH at their end of the first life in vehicles below 60%. These few batteries are not interesting for second-life purposes because of other problems related to the battery ageing (such as the increase in the internal resistance, the loss of power, the worsening of the overall battery efficiency [
7] or the proximity to the so-called ageing knee [
11] among others), and should be directly considered for recycling. From a business perspective and to enhance the circular economy, it is relevant to note that the first batteries to be considered for second-life applications are those having higher values of SoH.
The huge number of batteries that are expected to be recovered from EVs can be translated, relating the SoH at the EoL with the initial EV battery capacity, into the available overall capacity in MWh. By doing so,
Figure 8b proves that the available storage capacity increases year after year from 2020, which might place UK (and Europe) in the battery manufacturing market, although through the use of second-life batteries [
39].
4. Discussion
Supported by the results of this work, when considering the different capacities of EV batteries arriving in the foreseeable future, some preliminary (but not unique) links between the battery size and the second-life application might be established:
The 16 kWh capacity batteries will reach their EoL in an advanced ageing stage, making it difficult to conceive of their use for second-life applications. Furthermore, since the production has ceased, it does not make much sense to combine those that arrive in a relatively healthy state as there will be not many of them and the costs of development will be excessive;
Most 24 and 30 kWh batteries will reach a certain level of ageing that makes them suitable for low energy applications, such as micro-mobility in scooters, golf buggies, bicycles or electric pallet trucks. They might also be interesting for intermediate energy storage applications, such as self-consumption in buildings directly using the whole battery pack as it came from the EV. Although their sales have not been that high, some companies do believe that stacking them (up to six batteries) might be interesting enough to invest in them [
40]. However, this stacking option is considered because those 24 kWh battery models had an evolution to 30 kWh or higher maintaining most of the communication and safety issues. Nonetheless, the capacity of current batteries is increasing and evolving to higher standards ending in a limited provision in terms of energy and number of batteries to consider them for large energy applications;
Since the 40 kWh batteries are expected to be abundant and with relatively healthy standards at EoL in the vehicle, they may be used for all kinds of applications from small to high-energy demand ones. In addition, as the EV market expands from 2030 onwards, it is expected that many of those having a SoH higher than 85% will be re-used back into EVs as replacement parts;
The 70 kWh batteries are estimated to account for the majority of recovered batteries. Most of them are expected to arrive in good terms related to the SoH. From 2030 onwards, the quantity and healthy status make them suitable candidates for first life reuse. Similarly, they will be suitable for all kind of second-life applications but maybe they will be preferred for covering large energy-demand applications such as grid frequency regulations, energy storage systems for renewable sources, peak shaving, etc., where the energy requirement is in the range of MWh. They should be considered the first choice to address large energy demand applications;
Finally, the 90 kWh capacity batteries will have higher SoH standards at the EoL. This means that, in terms of use, these batteries could be considered as good as new batteries in most of the cases and, thus, perfectly suitable for any possible application (for first and second life). Even though, they will certainly not be used for brand new vehicles (although they technically could) as it is expected that, at the time of collection, new battery technologies with better energy and power density will be available in the market.
Besides finding the most suitable application for the retired batteries, second-life businesses must face other challenges, especially from the BMS perspective. These BMS are designed for their use during first life and to perform a set of tasks efficiently in such an environment. Giving a second life to EV batteries means using them in a different set-up. Therefore, several technical aspects must be tackled to ensure a correct performance of reused batteries. Among them, there are issues related to using SoX (SoC and SoH) algorithms operating in unexpectedly low SoH ranges, adapting the communication from the automotive standards to the stationary applications, thermal management of the battery in an application with no cooling system (unlike in the EV) and problems arising from stacking batteries with different SoH levels. Solving each of the aforementioned issues implies an increase in the installation/remanufacture costs.
Nonetheless, the increasing demand for stationary energy storage capacity in the world, which is projected to rise from 15 GWh in 2019 to 223 GWh in 2030 [
41], asks for affordable and valid solutions. This stationary energy storage capacity increase, which considers all kind of energy storage technologies, will be led by China and followed by Europe and North America, which is in line with the location of the higher demand for EVs. As a consequence, it can be expected that second-life batteries might cover part of this demand, but certainly they will not be suitable for all of the possible applications.
According to the ageing model presented, the projected capacity of second-life batteries available in the market by 2035 should be around 43.5 GWh from retired EV batteries in the UK (
Figure 8). This value represents about 20% of the world’s demand for stationary applications expected by that time. Considering that these results account only for the UK’s EV battery recovery and that the UK’s EV selling represented only 5% of the world’s EV demand in 2020 [
42], there should be a global cross-over between the available capacity of second-life batteries and the stationary energy storage capacity demand not far from 2030–2035, coinciding with most recent studies [
43] and the IEA report [
3].
Additionally, as technology advances and considering that most batteries will reach the EoL in good condition, it would be sensible to consider that many of the applications expected for second-life batteries could be also offered directly by batteries inside the vehicle through vehicle to grid strategies, leaving still less space for second-life battery businesses as they offer similar services with lesser effort (no need to transport, dismantle, refurbishing and re-install with new power equipment).
Thus, all of the expected needs for stationary energy storage systems [
44] will have an affordable alternative to consider in their business models. However, the second-life market is expected to be mainly regional due to logistic and manufacturing costs [
45] and it will not fit all possible stationary applications due to technical or even economic reasons. Moreover, after 2035, there would be many more batteries from retired vehicles than the stationary market could absorb and, thus, other paths for retired batteries should be analyzed, although there seem not to be many of them nowadays [
46].
However, the biggest energy storage needs will remain in the transportation sector (with 80% by 2035), implying that, from a global perspective, battery reuse is interesting and necessary but it will come (in average) 15 years too late and at an insufficient rate to be used back into new EVs. Moreover, battery reuse does not recover materials, it just postpones the recycling of the battery, so, in the end, the only way to recover these materials for new products is through recycling.
5. Conclusions
This work analyzes the characteristics of ICEV retirement and assumes that EVs would not behave differently. Under these circumstances, the study presents the most probable scenario of EV battery recovery for the following years highlighting that, in fact, most EV batteries will arrive to the EoL of the vehicle in relatively good condition, meaning that batteries will, generally, not force the EV retirement and, thus, the 70–80% SoH threshold must be revised (as less than 30% of the EV at retirement will have a SoH lower than 80%).
The expected high values of SoH open the door to the battery reuse possibilities which go from being reused in vehicles as spare parts for those batteries having a SoH higher than 85%, and for all other possibilities of second-life applications from stationary to micro-mobility choices in the rest of cases.
The study indicates that a minor number of EV batteries will arrive at SoH below 60%, which mostly belong to the first EV models that had a lower capacity (16–24 kWh). This fact, together with the relatively low number of recovered batteries, are important barriers for them to enter into the circular economy streams.
With the presented results, business models can be constructed, based on the health of EV batteries at EoL and when they will be available in the second-life market. It has been seen that battery repurposing is possible for most battery models when considering only the SoH at EoL. The current study presents some ideas on how second-life businesses should deal with it knowing, now, what to expect. However, the growth of stationary energy storage needs is slow and it will be covered in a decade by both new and second-life energy storage systems. Moreover, in few years, vehicle to grid technologies, together with the growing size of EV batteries, could also deliver similar services without adding the additional costs of battery repurposing.
Therefore, second-life businesses are interesting and they will be an option for some stationary applications, although they are expected to remain as local and relatively small businesses. In fact, the world should not count on battery reuse to soften the side effects of the growing demands of the mobility sector. Therefore, investments in other means of transportation, in reducing the mobility demands, in vehicle to grid solutions and in recycling should be targeted, rather than in second-life opportunities, as at some point, recycling needs will appear, no matter the battery’s SoH and use and other options will cover the battery re-use services.


 ,
, 


