Article

Solid Electrolyte Interphase Layer Formation on the Si-Based Electrodes with and without Binder Studied by XPS and ToF-SIMS Analysis

1
CNRS–Chimie ParisTech, Institut de Recherche de Chimie Paris (IRCP), PSL Research University, 11 Rue Pierre et Marie Curie, 75005 Paris, France
2
College of Energy, Xiamen University, Xiamen 361005, China
3
State Key Laboratory of Physical Chemistry of Solid Surfaces, College of Chemistry and Chemical Engineering, Xiamen University, Xiamen 361005, China
*
Author to whom correspondence should be addressed.
Batteries 2022, 8(12), 271; https://doi.org/10.3390/batteries8120271
Submission received: 24 October 2022 / Revised: 22 November 2022 / Accepted: 25 November 2022 / Published: 5 December 2022
(This article belongs to the Special Issue High Energy Lithium-Ion Batteries)

Abstract

:
The formation and evolution of the solid electrolyte interphase (SEI) layer as a function of electrolyte and electrolyte additives has been extensively studied on simple and model pure Si thin film or Si nanowire electrodes inversely to complex composite Si-based electrodes with binders and/or conductive carbon. It has been recently demonstrated that a binder-free Si@C-network electrode had superior electrochemical properties to the Si electrode with a xanthan gum binder (Si-XG-AB), which can be principally related to a reductive decomposition of electrolytes and formation of an SEI layer. Thus, here, the Si@C-network and Si-XG-AB electrodes have been used to elucidate the mechanism of SEI formation and evolution on Si-based electrodes with and without binder induced by lithiation and delithiation applying surface analytical techniques. The X-ray photoelectron spectroscopy and time-of-flight ion mass spectrometry results demonstrate that the SEI layer formed on the surface of the Si-XG-AB electrode during the discharge partially decomposes during the subsequent charging process, which results in a less stable SEI layer. Contrarily, on the surface of the Si@C-network electrode, the SEI shows less significant decomposition during the cycle, demonstrating its stability. For the Si@C-network electrode, initially, the inorganic and organic species are formed on the surface of the carbon shell and the silicon surface, respectively. These two parts of species in the SEI layer gradually grow and then fuse when the electrode is fully discharged. The behavior of the SEI layer on both electrodes corroborates with the electrochemical results.

1. Introduction

Silicon is regarded as a promising candidate of anode material for the next generation of Li-ion batteries (LIBs), due to its high specific capacity (over 3500 mAh·g−1), a low operating voltage of 0.5 V (vs. Li+/Li), and high abundance in the Earth’s crust. However, the huge volume changes of Si (over 280%) during lithiation/delithiation processes lead to pulverization and then delamination of the Si electrode and, consequently, instability of the solid electrolyte interphase (SEI) layer and, finally, reduced electrode conductivity of the Si-based electrode [1]. The continuous growth of the SEI layer will decrease the conductivity between the Si-particles and the conductive agents and become inactive to the lithiation/delithiation processes. To solve this problem, several strategies have been reported, including the modifications of electrode materials [2,3,4,5,6,7,8], binders [9,10,11,12,13,14,15,16,17], electrolyte solvent [18,19,20,21], salts [22,23,24], and electrolyte additives [19,25,26,27,28,29,30].
Applying these strategies, the huge volume changes of Si are buffered and the pulverization of the electrodes can be significantly reduced. At the same time, the SEI layer also becomes more stable and resistant, resulting in fewer side reactions during charge-discharge processes leading to higher coulombic efficiency. Several surface analytical techniques were used to characterize the SEI layer at different stages of charge–discharge potentials in these studies [21,23,31,32,33]. The SEI layer generation and evolution mechanisms were discussed to guide the development of new functional materials leading to enhanced performances of Si-based anodes. Chan et al. demonstrated a formation of a complex SEI composition at a discharged state (at 0.5 V) and a relatively simple SEI composition with mainly Li2CO3 and LiF after discharge (to 0.01 V) on a Si nanowire anode in a LiPF6/EC-DEC electrolyte by ex situ X-ray photoelectron spectroscopy (XPS) [34]. Dynamic behavior of the SEI layer was also demonstrated on graphite and other types of negative electrode materials [35,36]. Hou et al. investigated the decomposition mechanism of fluoroethylene carbonate (FEC) in a LiPF6/ethylene carbonate (EC) electrolyte on the surface of a Si anode [37]. The reduction in Li+-coordinated FEC occurs prior to the potential decomposition of EC. The uncoordinated FEC passivates the anode surface by forming LiF. Philippe et al. demonstrated that the LiPF6 salt decomposition results in the formation of SiOxFy species and the dissolution of Li2O on the Si anode surface due to the formation of HF by the reaction between LiPF6 and traces of water [22]. The lithium bis(fluorosulfonyl)imide (LiFSI) salt has lower sensitivity toward hydrolysis. Thus, it shows a continuous reaction with SiO2 leading to the formation of Li4SiO4. Moreover, the reduction products of LiFSI play a particular role in a passivation layer by preventing further reduction in the salt during cycling. However, most of these analyses of the mechanism of SEI generation and evolution have applied pure silicon electrodes (e.g., Si thin film, Si nanowires, etc.,) to simplify the analysis, interpretation, and identification of complex species. Other electrode components affecting the SEI layer variations have not been systematically investigated [26,38,39,40,41,42].
In our previous studies [8], a binder-free Si@C-network electrode with a relatively simple structure was fabricated. It exhibited significantly superior performances than the silicon nanoparticle electrode with a xanthan gum binder (Si-XG-AB electrode). Therefore, more thorough studies and comparison of the evolution of SEI on this Si@C-network electrode and Si-XG-AB electrode is necessary to have a more comprehensive knowledge of the SEI variation with multiple battery components.
In this work, a detailed surface characterization by means of XPS and time-of-flight secondary ion mass spectrometry (ToF-SIMS) techniques were performed on the aforementioned binder-free Si@C-network and Si-XG-AB electrodes. The surface modifications of Si-based electrodes, the interface stability, and the in-depth distribution of different chemical species as a function of lithiation and delithiation potentials were investigated and discussed.

2. Experimental Part

2.1. Si-Based Electrodes

The Si@C-network electrode was prepared by in situ carbonization using the same method as that in our previous paper [8]. 0.05 g Si nanoparticles (Alfa Aesar, 50–100 nm) and 0.05 g xanthan gum (XG) were stirred in deionized water to make a homogenous slurry and then coated on the Cu current collector. After drying in a vacuum oven overnight at 100 °C, it was put in an Ar atmosphere and heated to 600 °C for 2 h (a heat rate of 5 °C·min−1) to obtain the Si@C-network electrode. The Si@C-network electrode comprises 83.4 wt% of Si and 16.6 wt% of carbon. For comparison, the Si-XG-AB electrode was prepared by mixing 0.06 g Si nanoparticles (SiNPs) with 0.02 g acetylene black (AB) and 0.02 g XG in 1.0 mL deionized water to form a homogeneous slurry. Then, the slurry was coated on thecurrent collector and dried in a vacuum at 100 °C for 12 h. The mass loading of the active Si is 0.4 mg·cm−2 on both the Si@C-network electrode and the Si-XG-AB electrode.

2.2. Galvanostatic Tests

The galvanostatic tests of the Si-XG-AB and the Si@C-network electrodes were performed in 1M LiPF6/dimethyl carbonate (DMC) at the rate of 0.2 C (1 C = 3580 mAh·g−1) using a VMP3 Biologic multi-channel potentiostat/galvanostat. To activate the electrodes, the first cycles were performed with a current of 200 mA·g−1.

2.3. Morphology Characterizations

The morphological characterizations of Si-XG-AB and Si@C-network electrodes were performed by SEM (a Zeiss Ultra55 microscope with a high-resolution field emission gun, Schottky SEM-FEG).

2.4. XPS and ToF-SIMS Characterizations

2.4.1. XPS and ToF-SIMS Experimental Conditions

XPS measurements were performed under an ultra-high-vacuum (~10−9 mbar) using a ThermoElectron ESCALAB 250 spectrometer with a monochromatic Al Kα X-ray radiation source (hν = 1486.6 eV). Survey and high-resolution spectra were obtained at a 90° take-off angle. Binding energy was corrected by setting the lower energy C 1 s peak at 285.0 eV (corresponding to C-C sp3 bond). Some characteristic peaks, e.g., the narrow peak at ~284.0 eV corresponding to the C-C sp2 bond [41], the peak at ~685.0 eV corresponding to the Li-F bond [23,34], and the peak at 528.0 eV corresponding to the Li-O bond [39] were also be taken into account in the binding energy correction. The CASA software (version 2.3.17) was used for peak fitting and decomposition. The Shirley-type background and Gaussian/Lorentzian ratio of 70/30 were used for all peak fittings.
ToF-SIMS ion depth profiles analysis was performed using a ToF-SIMS 5 spectrometer (IONTOF GmbH, Munster, Germany) under 10−9 mbar, with a 25 keV Bi+ beam (100 × 100 μm2) for analysis, delivering a target current of 1.2 pA and a 2 keV Cs+ beam (300 × 300 μm2) for sputtering, delivering a target current of 90 nA. Data acquisition and analyses were performed with Ion-Spec software (version 6.8).

2.4.2. Sample Preparation for XPS and ToF-SIMS

XPS and ToF-SIMS analyses were performed after the electrochemical tests at different stages of lithiation/delithiation in 1M LiPF6/DMC electrolyte at 200 mA·g−1 in Swagelok cells, as shown in Figure 1. During the first cycle of charge–discharge, four points of lithiation and delithiation were chosen for each type of electrode:
-
point 1 (~0.8–1.0 V) corresponding to the state after electrolyte decomposition and SEI formation [19,23,34,41,43];
-
point 2 (~0.1–0.3 V) corresponding to the further formation of the SEI layer before the lithiation of crystalline Si [44,45,46];
-
point 3 (0.01 V) corresponding to the full lithiated state of the electrode [47,48,49]; and
-
point 4 (3.0 V) corresponding to the full delithiated state of the electrode.
At each point, the cycling was stopped and the sample was immediately transferred into the Ar-filled glove box. Then, the cell was disassembled and rinsed with DMC more than three times, dried with Ar-flow, and transferred directly to the XPS or ToF-SIMS analysis chamber under anaerobic and anhydrous conditions without any exposition to the ambient air as detailed in our previous work [50].

3. Results and Discussion

3.1. Morphological Characterization of Electrodes by SEM

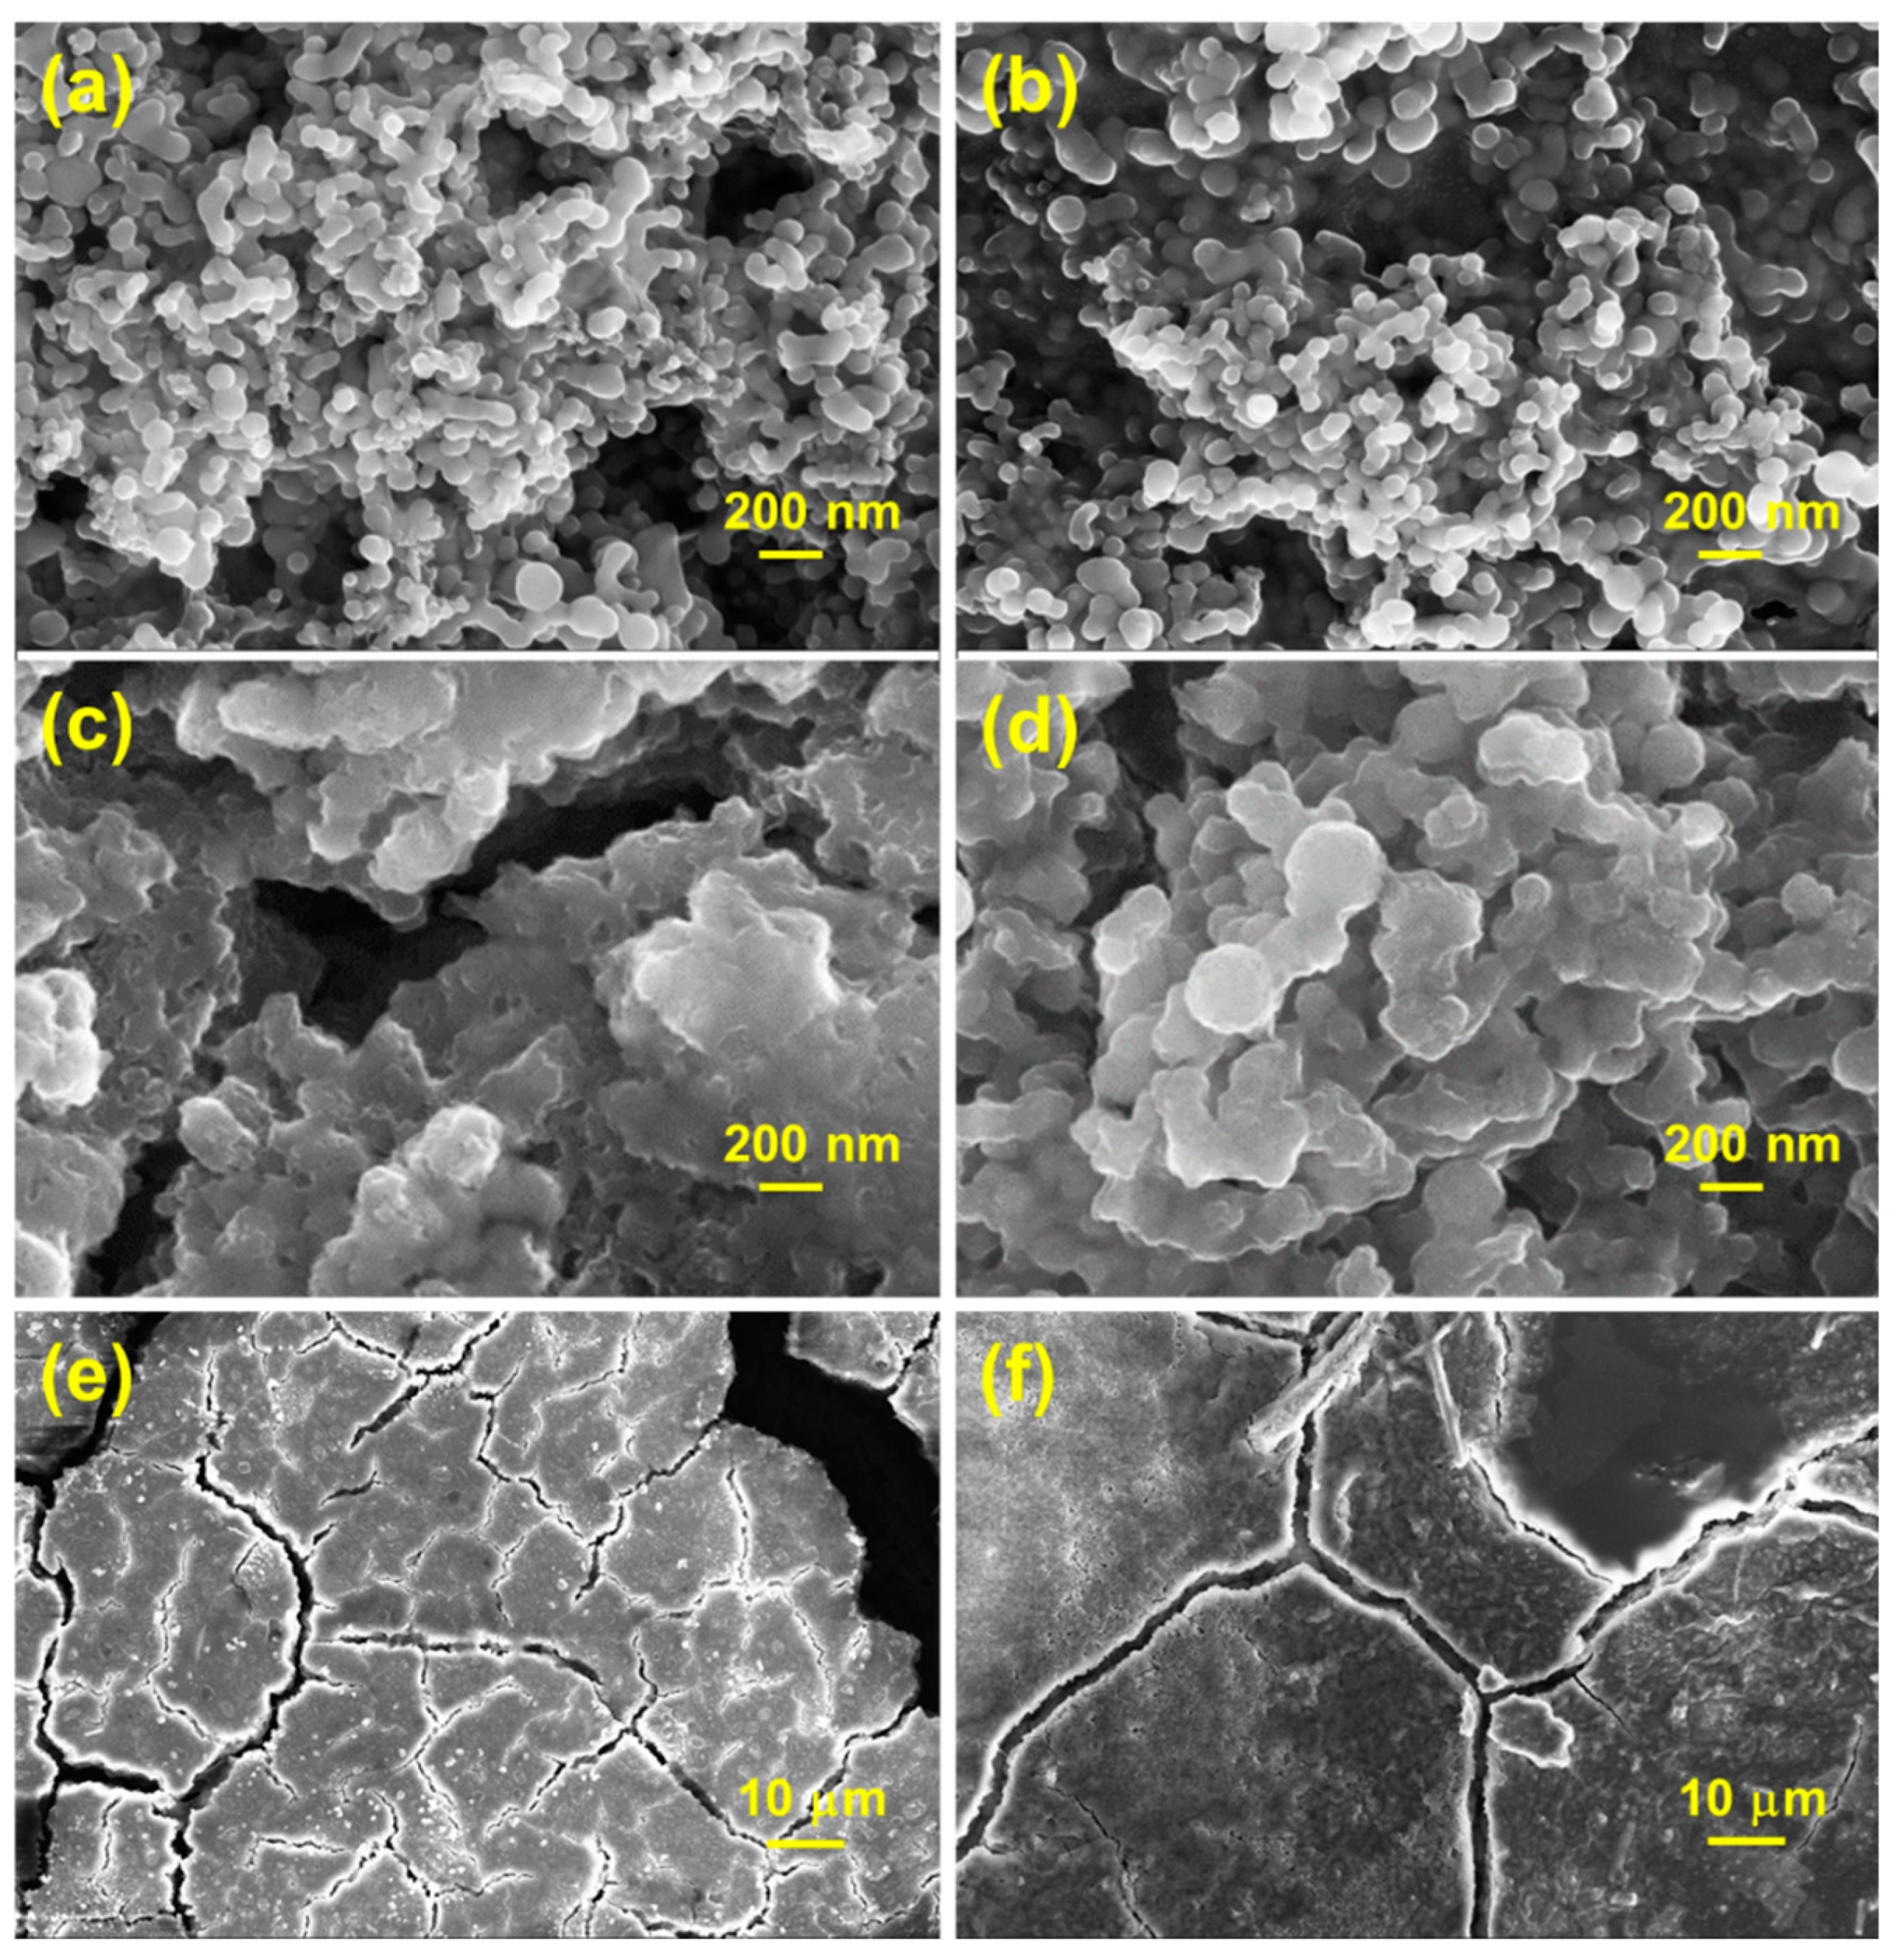
The SEM images of the Si-XG-AB and the Si@C-network electrodes before and after cycling are shown in Figure 2 and the Supplementary Materials (Figure S1). Before cycling, the Si@C-network and the Si-XG-AB electrodes exhibit a similar size of SiNPs of around 50–100 nm. The Si@C-network electrode (Figure 2b and Figure S1b) shows some linkages between SiNPs, forming a three-dimensional structure. In the case of the Si-XG-AB electrode, the SiNPs together with the AB particles of 5–10 nm are covered by an XG binder (Figure 2a). The higher magnification images of pristine Si-XG-AB and Si@C-network electrodes (Figure S1) demonstrate more clearly the morphology of SiNPs and AB particles.
After 100 cycles of galvanostatic tests, the Si@C-network electrode (Figure 2d) shows a grainy morphology with bigger particles than the pristine sample. The Si-XG-AB electrode (Figure 2c) also exhibits bigger particles. The particle size increase observed for both types of electrodes can be due to the SEI layer deposition over the particles and also the process of lithiation leading to the pulverization of Si particles. However, the lower resolution images (Figure 2e,f) show a more cracked layer with numerous defects on the surface of Si-XG-AB than on the Si@C-network electrode, which would indicate the formation of thicker and more defectuous SEI layer with an enhanced decomposition of the electrolyte. The presence of pores and defects can lead to enhanced diffusion of electrolytes in the bulk of the layer and/or layer/electrode interface and renewal of the SEI with continuous consumption of electrolytes. Less significant formation of cracks on the surface of Si@C (Figure 2f) can indicate a higher stability of the electrolyte during the 100 cycles and, consequently, lower consumption of the electrolyte.

3.2. Galvanostatic Tests

The galvanostatic tests of the Si-XG-AB and the Si@C-network electrodes performed in 1M LiPF6/DMC at the rate of 0.2 C were preceded in the Supplementary Materials (Figure S2) by the initial cycle performed with the current of 200 mA·g−1 to activate the electrodes. The Si-XG-AB and Si@C-network electrodes exhibit their initial charge capacities of 2568.1 mAh·g−1 and 2866.4 mAh·g−1, respectively. After 100 cycles, the capacity of the Si-XG-AB electrode drops significantly to 54.3 mAh·g−1, in contrary to the Si@C-network electrode, which shows a much slower capacity decrease reaching the final value of 952.2 mAh·g−1. The more unstable cycle life of the Si-XG-AB electrode in comparison to the Si@C-network electrode can be explained by the surface and/or bulk electrode modifications with a continuous SEI layer formation inside the cracks (as shown by SEM in Figure 2e) during each cycle. Accordingly, the conductive agent loses contact with SiNPs leading to damage to the conductive network. Better stability of the Si@C-network electrode can be explained by a more robust and less vulnerable carbon layer enveloping Si particle and providing good conductivity. Thus, the electrode shows fewer cracks (Figure 2f) and, consequently, less electrolyte is consumed during each process of lithiation/delithiation.

3.3. Surface Characterizations

3.3.1. XPS Surface Characterizations of the Si-XG-AB Electrode

In order to better understand the influence of binder-free Si@C-network electrodes on the surface modifications at different stages of lithiation/delithiation (four points, as shown in Figure 1), the surface characterizations were performed on both electrodes. A detailed explanation of the selection of these four points is presented in Section 2.4 of the experimental part.
First of all, the XPS results are presented for the Si-XG-AB electrode. The high-resolution XPS spectra of C 1s, F 1s, O 1s, and Si 2p and the peak decompositions for pristine and after different lithiation/delithiation states (points 1–4) during the first charge–discharge cycle of the Si-XG-AB electrodes are shown in Figure 3. The binding energies of all spectra were corrected with reference to the C-H and the C-C sp3 peak at 285.0 eV.
The pristine Si-XG-AB electrode exhibit a narrow peak at ~284.0 eV corresponding to the C-C sp2 bond [41], which corresponds to the 20 wt% of AB present in the electrode. The high intensities of the C-H, C-C sp3 peak, and C-OH, −OCH3 peak (~287.1 eV) [23,42,51,52,53] can be attributed to the organic species in the XG binder molecule. After the electrolyte decomposition and the SEI layer formation (point 1), the peak area ratio of the C-C sp2 peak decreases a little, illustrating the formation of a thin SEI layer on the electrode. However, the other higher binding energy peaks do not show significant changes, and the peaks attributed to XG are overlapped with peaks corresponding to SEI layer species. At more negative potential, after the further stages of the SEI formation and the lithiation of Si (point 2), the C-C sp2 peak ratio continues to decrease and a new peak formed at ~282.5 eV, which corresponds to the lithiation of AB [54]. The attenuation of the C-C sp2 peak confirms the thickening of the SEI layer. The relative ratios of the peaks at 286.5 eV, 288.9 eV, and 290.0 eV increase, indicating the formation of C-O ether linkage, O-C=O, and the carbonate species on the electrode surface, respectively. After the full lithiation of the Si electrode (point 3), the peak area ratio of the C-Li and C-C sp2 peak is much lower than at point 2, demonstrating a thick SEI layer formed on the surface, which shields the signals from the SiNPs-AB-binder region. The existence of a C-C sp2 peak also demonstrates that the AB is partially lithiated during cycling. The amount of C-O ether linkage and carbonate species have further increased at this point, corresponding to Reactions (1)–(4) [19,55,56,57,58], as shown below.
DMC + e + Li+ → CH3OCO2Li + CH3
DMC + 2e + 2Li+ → Li2CO3 + C2H6
n R· → Rn (polymers)
2 ROCO2Li + H2O → Li2CO3 + ROH +CO2
At point 4 of delithiation, the C-Li peak still can be observed but shows a much lower peak area ratio, demonstrating that most of the AB has been delithiated. The ratios of the peaks corresponding to C-O ether linkage and carbonate species decrease a lot, indicating the decomposition of these species during the delithiation. The shape of the XPS profiles at points 2 and 4 looks similar but quite different from the profile of point 3, indicating that the SEI layer formed at the fully lithiated state is not stable and can easily undergo decomposition.
There is no F 1s signal on the pristine Si-XG-AB electrode. At point 1, the intensity of the F 1s signal is weak. At further lithiation state (point 2), a big Li-F peak at 685.0 eV [23,34,42,51,53,54], due to decomposition of LiPF6 according to Reactions (5)–(8) [55,57,58,59] and a small peak intensity at 686.8 eV corresponding to SiOF [60,61,62,63], can be observed below.
LiPF6 ⇌ LiF + PF5
ROCO2Li + HF → ROCO2H (sol) + LiF
Li2CO3 + 2 HF → H2CO3 (sol) + 2 LiF
ROLi + HF → ROH + LiF
The presence of SiOF can be a fingerprint of the bare Si electrode. After the full lithiation (point 3), the ratio of the Li-F peak becomes much higher, while the peaks corresponding to SiOF and P-F (688.0 eV) are nearly invisible (a total area ratio of 5.40% in the F 1s spectra) [23,42,51,53,54], illustrating the thicker SEI layer formed on the electrode surface. After the full cycle at the delithiation state (point 4), the SiOF signal corresponding to the Si substrate becomes obvious, indicating a thinning of the SEI layer.
The O-C=O (533.6 eV), Si-O, C-O (532.9 eV), and C=O, P=O (532.0 eV) peaks [23,42,51,54,55,59,60,64,65] are present in the O 1s spectra for the Si-XG-AB pristine sample (Figure 3). The presence of the organic species can be attributed to the XG binder molecules. At point 1, the C=O, P=O, and C-O peak ratios increase significantly [51,54,55,59,60,65], due to the formation of related organic species in the SEI layer. At point 2, the peak corresponding to ROLi, LixSiOy (530.5 eV) appears, confirming the lithiation of Si oxide [41,55,56,66]. At a fully lithiated state (point 3), the ratio of ROLi and LixSiOy peaks further increase and a Li-O peak appears at 528.0 eV, according to Reaction (9) [39]:
SiO2 + 4 Li+ + 4 e→ Si + 2 Li2O
The decrease in the C-O, Si-O peak at this point can be attributed to the thickening of the SEI layer, since the Si-O signal is related to the bulk Si, and Si-O undergoes lithiation. After delithiation (point 4), the lower intensity of LixSiOy confirms a partial delithiation. The Li-O peak vanished and C=O, P=O become the principal species on the electrode surface.
The Si 2p spectrum displays the Si 2p3/2 and the Si 2p1/2 spin-orbit doublet and its decomposition indicates that the surface of the pristine Si-XG-AB electrode is covered by a thin layer of Si oxides (Si+ at ~100.1 eV, Si2+ at ~101.8 eV, and Si4+ at ~103.5 eV) [38,60,61,67,68], which agrees with the decomposition of O 1s core level peak (showing the Si-O species). The lowest binding energy peak at ~99.1 eV (Si 2p3/2) can be attributed to Si0 [38,41]. At point 1, the Si 2p3/2 peaks corresponding to Si+ and Si2+ increase, and the Si4+ peak decreases, which can be attributed to the reduction in Si oxide during discharge and/or formation of Si fluorides (due to overlapping of the Si 2p peaks with the same Si valence corresponding to oxides and fluorides [38,60,61,67,68]). At point 2, the ratios of the Si 2p peaks do not show significant changes, but the peaks are shifted to lower binding energies due to the differential charging effect related to the surface heterogeneity (the presence of different compounds on the Si electrode) [23,67]. Therefore, at later stages of lithiation/delithiation (after point 2), the Si 2p peaks were assigned to different Si compounds by calculating the difference in the binding energies corresponding to Si0 and other Si peaks. The Si 2p3/2 peak at the lowest binding energy (96.2 eV) can be attributed to the Li-Si alloy [41]. The Si 2p3/2 peaks of 2.2 eV and 3.9 eV are higher than Li-Si, corresponding to the Si+ and Si2+ species, respectively [38,60,61,67,68]. At a fully lithiated state (point 3), the Si 2p peak intensity is much lower (as compared to other states), indicating the formation of a thick SEI layer. After delithiation (point 4), the Si 2p peaks are shifted back to higher binding energy but are still lower than those observed for the pristine sample. The peaks corresponding to Si0, different oxides and fluorides, and a new peak corresponding to SiOxFy (104.5 eV) [38,60,67] can be distinguished.

3.3.2. XPS Surface Characterizations of the Si@C-Network Electrode

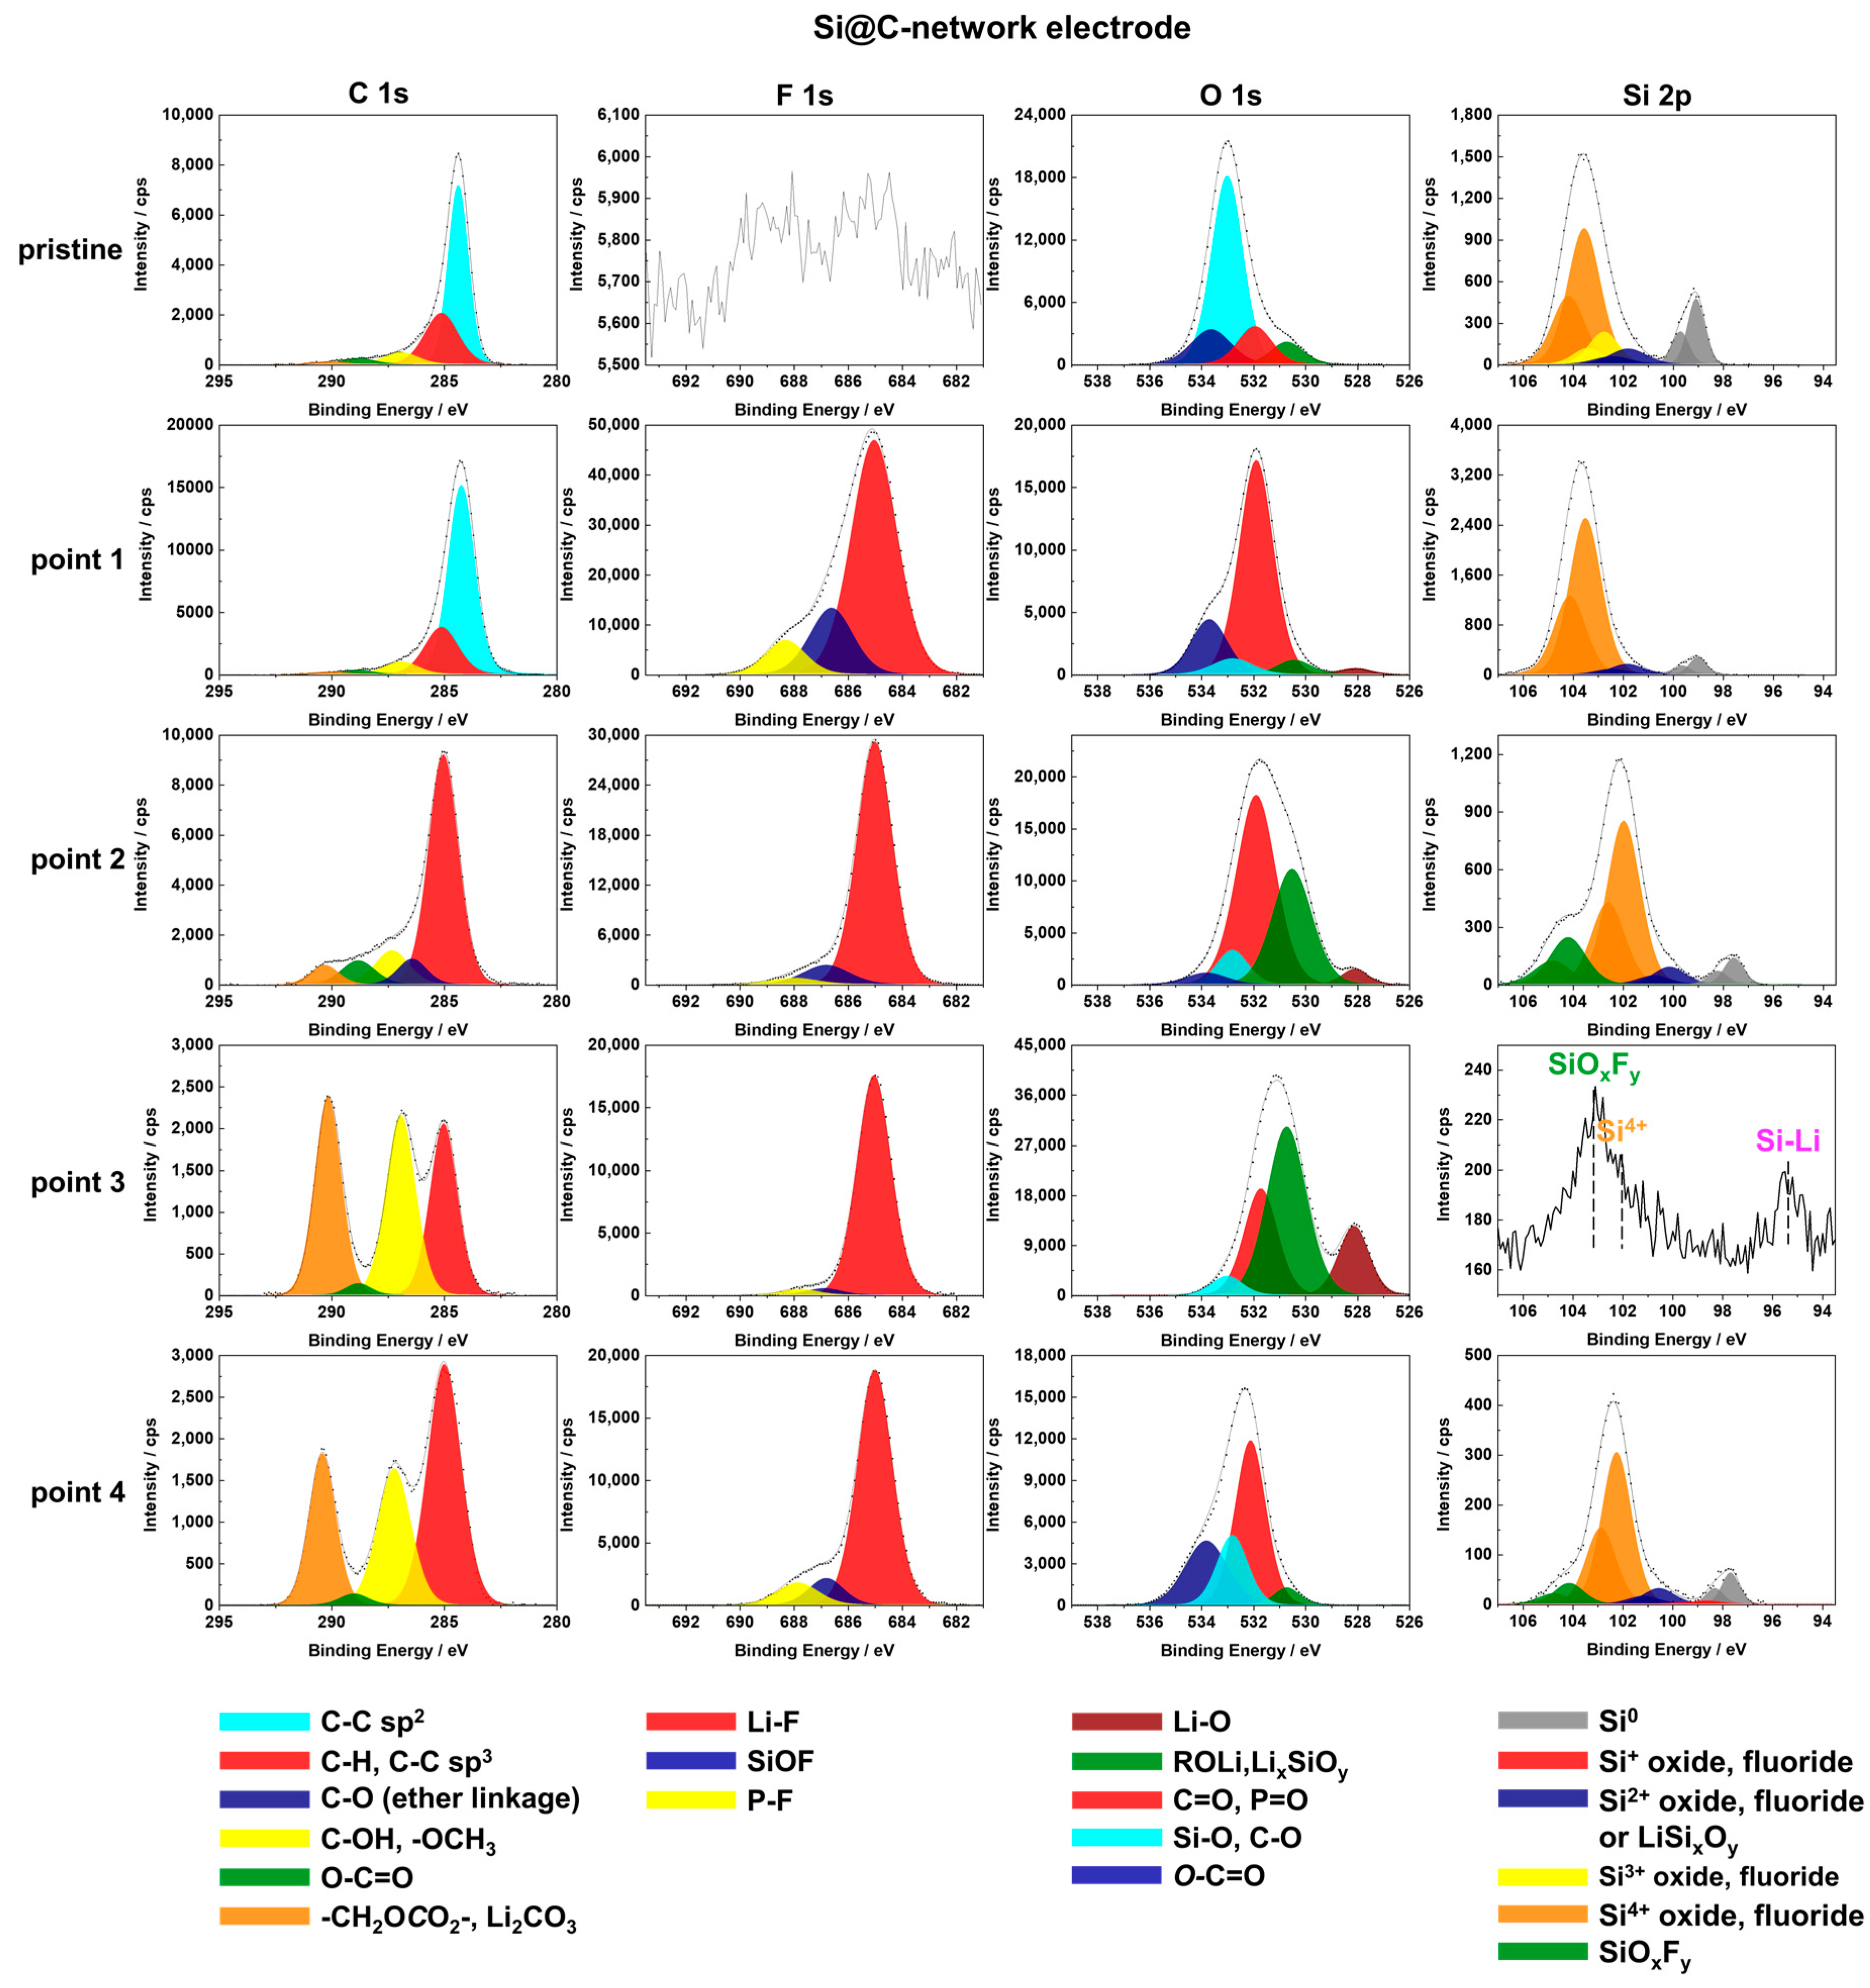
The high-resolution XPS spectra of C 1s, F 1s, O 1s, and Si 2p and the peak decompositions for the pristine sample and at different electrochemical states (points 1–4) of the first charge–discharge cycle of the Si@C-network electrode are shown in Figure 4. Similar to the Si-XG-AB electrode, binding energies of all spectra were also corrected with reference to the C-H and C-C sp3 peak at 285.0 eV.
The C 1s profile at point 1 is nearly the same as the C 1s profile of the pristine sample. Both of them present a very high peak corresponding to the carbon network on the surface (C-C sp2 and 284.0 eV), a smaller peak corresponding to the C-H and C-C sp3 contamination, while the other peaks show relatively low ratios, demonstrating that almost all ingredients of XG are carbonized. Although the C 1s profiles have similar shapes for the pristine sample and after the first lithiation (point 1), the SEI formation can be evidenced from analyses of the F 1s and O 1s. No F 1s signal can be observed for the pristine sample, while at point 1, a high ratio of the Li-F (685.0 eV) peak and lower ratios of the SiOF (686.8 eV) and P-F peaks (688.0 eV) can be observed. The pristine sample shows a high peak in O 1s corresponding to Si oxide (532.9 eV), while at point 1, the major species of C=O, P=O are formed due to the decomposition of electrolyte [41,51,54]. A decrease in the Si0 signal ratio in the Si 2p core level region for the sample at point 1, with reference to the pristine sample, also confirms the formation of the SEI layer. From the results obtained on C 1s, F 1s, O 1s, and Si 2p, it can be concluded that the SEI formed on the surface of the Si@C-network electrode at point 1 mainly occurs in the zones between SiNPs and carbon inside the carbon network, as shown in Figure 5.
At point 2 of lithiation, the C-C sp2 peak disappears and the C-H/C-C sp3 becomes a dominating contribution, indicating the further growth of the SEI layer, which covers the carbon network of the electrode. The decrease in the SiOF peak in F 1s agrees with the thickening of the SEI layer. The high ratio peak at 531.9 eV can be mainly attributed to ROLi species and not to LixSiOy, because the carbon network surrounding the SiNPs is covered by the SEI layer, and less of the Si-related signal can be observed by the XPS. The schematic diagram of SEI growth at point 2 is also shown in Figure 5. Similar to the Si 2p profiles of the Si-XG-AB electrode (described above), the peaks are shifted to a lower binding energy due to the differential charging effect.
At point 3, the Si@C-network electrode is fully lithiated and the SEI layer is further varying. The species found by decomposition of in C 1s core level region such as C-OH, OCH3, and carbonate, are the main components originating from the decomposition of the DMC solvent, according to Reactions (1) and (2) and the reaction as already confirmed in our previous work [21]:
DMC + e + Li+ → CH3OLi + CH3OCO
The high ratios of ROLi, LixSiOy, and C=O, P=O peaks in O 1s spectra confirm the formation of CH3OLi and lithium carbonate. The Li-O peak is also observed on Si-based electrodes at a fully lithiated state [34,42]. The main species in the area of F 1s spectra is Li-F, following decomposition of LiPF6 according to Reactions (5)–(8), while the P-F and SiOF species are nearly invisible. The Si 2p signal is significantly attenuated due to the growth of the SEI layer so that the Si 2p peaks cannot be easily decomposed. The Li-Si, Si4+, and SiOxFy species were identified by calculating the differences between the binding energy of peaks [38,41,42,67].
After the delithiation at point 4, the C 1s profile shows only some slight modifications, with reference to the C 1s profile at point 3. The carbon network is still covered by the SEI layer. There are no C-O ether linkage species formed after the cycle in 1 M LiPF6/DMC, which agrees with our previous results [21]. The SiOF peak ratio in F 1s spectra increases a little, illustrating a decrease in the SEI layer thickness (schematically shown in Figure 5). The Li-O peak disappears after delithation and C=O, P=O becomes the major species in O 1s spectra. In Si 2p spectra, the Li-Si peak vanishes, and the Si0 peak emerges with a high Si4+ signal.
Summarizing the XPS results, it could be concluded that several SEI layer species are easily formed during the lithiation and then easily undergo decomposition during the delithiation on the Si-XG-AB electrode. Thus, the formation of the SEI layer is dynamic and reversible during the first cycle of lithiation/delithiation. Consequently, the Si-XG-AB electrode spent a high quantity of electrolyte in order to form an SEI layer at every cycle, which may lead to lower coulombic efficiency. Furthermore, the continuous formation of the SEI layer every cycle can lead to the termination of SiNPs and AB particles and, therefore, impairment of the conductive network of the electrode, resulting in capacity fading.
The SEI layer on the Si@C-network electrode forms on the Si surface inside the carbon layer at the beginning of lithiation (point 1), and then during the further lithiation stages (points 2 and 3), and grows thicker to cover the carbon network. During delithiation (point 4), the SEI layer thickness slightly decreases but still covers the carbon network, and the components of the SEI layer are not significantly modified. Therefore, the Si@C-network electrode exhibits a more stable SEI layer in comparison to the Si-XG-AB electrode, which is beneficial to the coulombic efficiency and cycle life of the electrode.

3.4. ToF-SIMS Surface and Bulk Characterizations

To have a better insight into the surface variation of the Si-XG-AB and the Si@C-network electrodes, ToF-SIMS ion depth profiles were performed at all states of lithiation/delithiation, similar to for the XPS tests presented above. Figure 6 shows the ToF-SIMS negative ion depth profiles for Si-XG-AB and Si@C-network pristine electrodes. As observed by SEM in Figure 2, the diameter of the SiNPs on Si-XG-AB and Si@C-network electrodes is 50–100 nm. Thus, in the 100 × 100 μm2 analyzed area, the high quantity of SiNPs can be sputtered and characterized. However, the SiNPs are not homogenously and evenly distributed on the surface (as demonstrated by SEM images in Figure 2). Thus, all particles will be not etched at the same time. At the beginning of sputtering, the signals corresponding to the binder layer of Si-XG-AB and the carbon network of the Si@C-network electrode of the particles present on the outermost surface will be detected. With the sputtering time increase, the surface particles will be partially etched while the particles present in the innermost might be still intact. As a result, a mixture of signals corresponding to the surface and bulk particles can be detected. A stable intensity of all ions can be observed already after around 150 s of sputtering. This stable signal intensity can be explained by an in-depth uniform electrode composition made of homogenous slurries. Therefore, our discussion here is focused on the signals of the first 200 s of sputtering time corresponding to the layer covering the Si surface.
In this work, all the ToF-SIMS depth profiles are normalized by Cu signal intensity, considering that the Cu substrate is inactive during the lithiation/delithiation process. The presence of a Cu signal in all profiles can indicate that the electrode materials (the Si-XG-AB and Si@C-network) do not form a complete and compact layer on the Cu current collector.
In Figure 6a, the initial 24 s of the depth profile for a pristine Si-XG-AB electrode shows increasing intensities of the C3 signal from AB. The higher intensities of CH2 and CH3O signals (corresponding to organic species) at the beginning of the sputtering, show the enrichment in a binder. The Cu signal from the Cu substrate increases rapidly to reach a plateau at around 24 s of sputtering. On the Si@C-network electrode, clearly, a C3 peak before the Si3, SiC, and Cu signals can be observed, indicating the existence of carbon network on the Si surface.
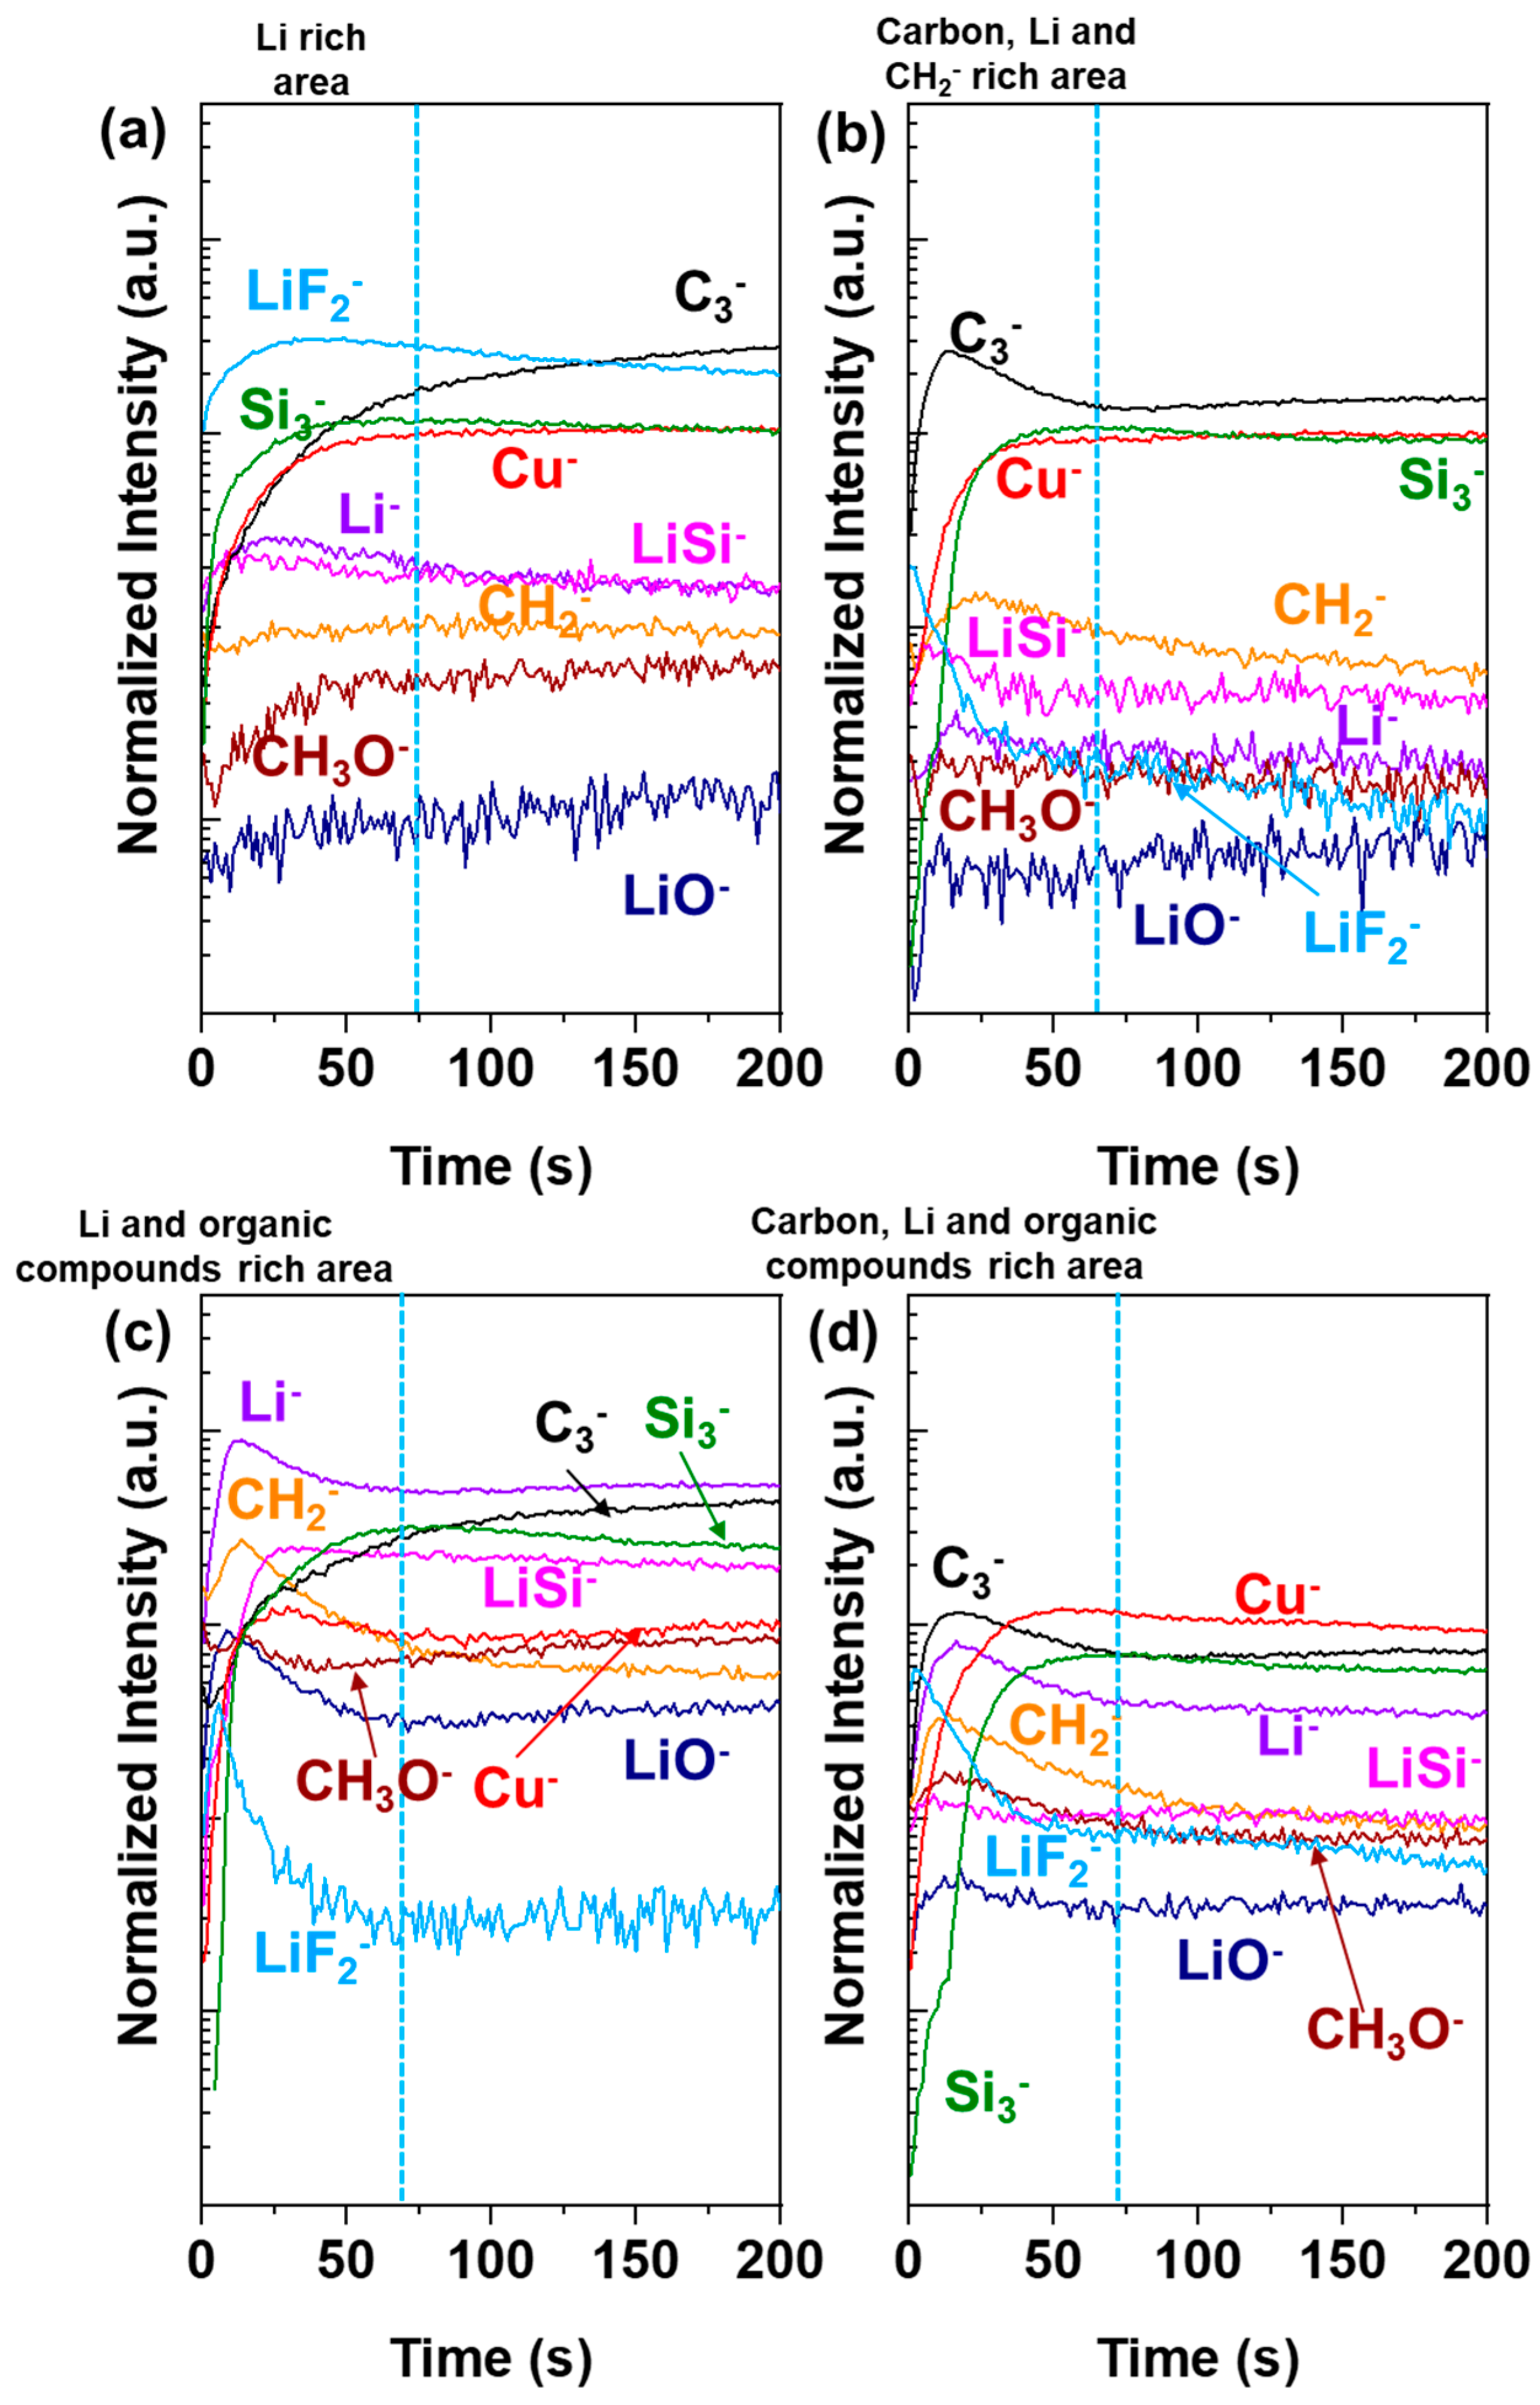
The ToF-SIMS depth profiles for the Si-XG-AB electrode and Si@C-network electrodes at point 1 and point 2 are shown in Figure 7. At point 1 (Figure 7a), the Si-XG-AB electrode shows a maximum intensity at around 25 s and a small decrease in the Li and LiSi species for 74 s, while the intensities of LiF2 increase in the first 20 s and then become stable, demonstrating there is a Li-rich area at the beginning of sputtering (indicated by a dashed line in Figure 7) corresponding to the outer part of the electrode.
For the Si@C-network electrode at point 1 (Figure 7b), the LiF2 signal shows the maximum intensity at the beginning of sputtering time and then an abrupt decrease until 40 s. The C3 profile reaches the maximum at 10 s and then decreases. The maximum CH2 signal intensity is shifted to a higher sputtering time (25 s). The Cu and Si3 signals become stable at 40 s. This alteration of maximum signal intensities demonstrates that LiF species are present on the surface of the carbon network and the CH2-related organic species are principally formed between the carbon network and Si particles. This agrees with the XPS results obtained at point 1. There are two hypotheses related to the in-depth enrichment of LiF and organic species. One explanation is that the LiF salt can be more easily deposited on the porous carbon network than the organic species. The other explanation is that during the formation of LiF, the HF is consumed according to Reactions (6)–(8), but the SEI layer formed on the carbon network hinders the diffusion of HF from the electrolyte into the bulk of the electrode in the carbon network and Si. Therefore, the formation of LiF between the carbon network and Si is more difficult than on the electrode surface. At the same time, more Li carbonates (originating from organic compounds of electrolytes) can be found in the area between the carbon network and Si without undergoing the reaction with HF.
At point 2 (Figure 7c), the Si-XG-AB electrode presents the maximum peak intensities for Li, LiF2, CH2, LiO, and CH3O signals before the stable intensities of C3, Cu, and Si3, indicating that the surface SEI layer is enriched in Li salt and organic compounds. Compared to point 1 (Figure 7a), the intensities of Li, LiO, CH2, CH3O, and LiSi species show a significant increase, indicating the further uptake of the SEI layer and the partial lithiation of Si.
Similarly to point 1, the LiF2 profile shows also the maximum intensity in the beginning and then a rapid decrease until 46 s on the Si@C-network electrode (Figure 7b), indicating deposition of LiF on the surface of carbon at point 2 (Figure 7d). The peaks of C3, Li, CH2, CH3O, and LiO can be observed before the stable intensities of signals of Cu and Si3, demonstrating that the organic species are well mixed with the carbon network and are different from the profiles obtained at point 1, which shows the organic species-rich area between the carbon network and Si. The intensities of Li, LiO, CH2, CH3O, and LiSi signals are higher with reference to the profiles obtained at point 1, demonstrating the growth of the SEI layer and the partial lithiation of Si, similar to the Si-XG-AB electrode.
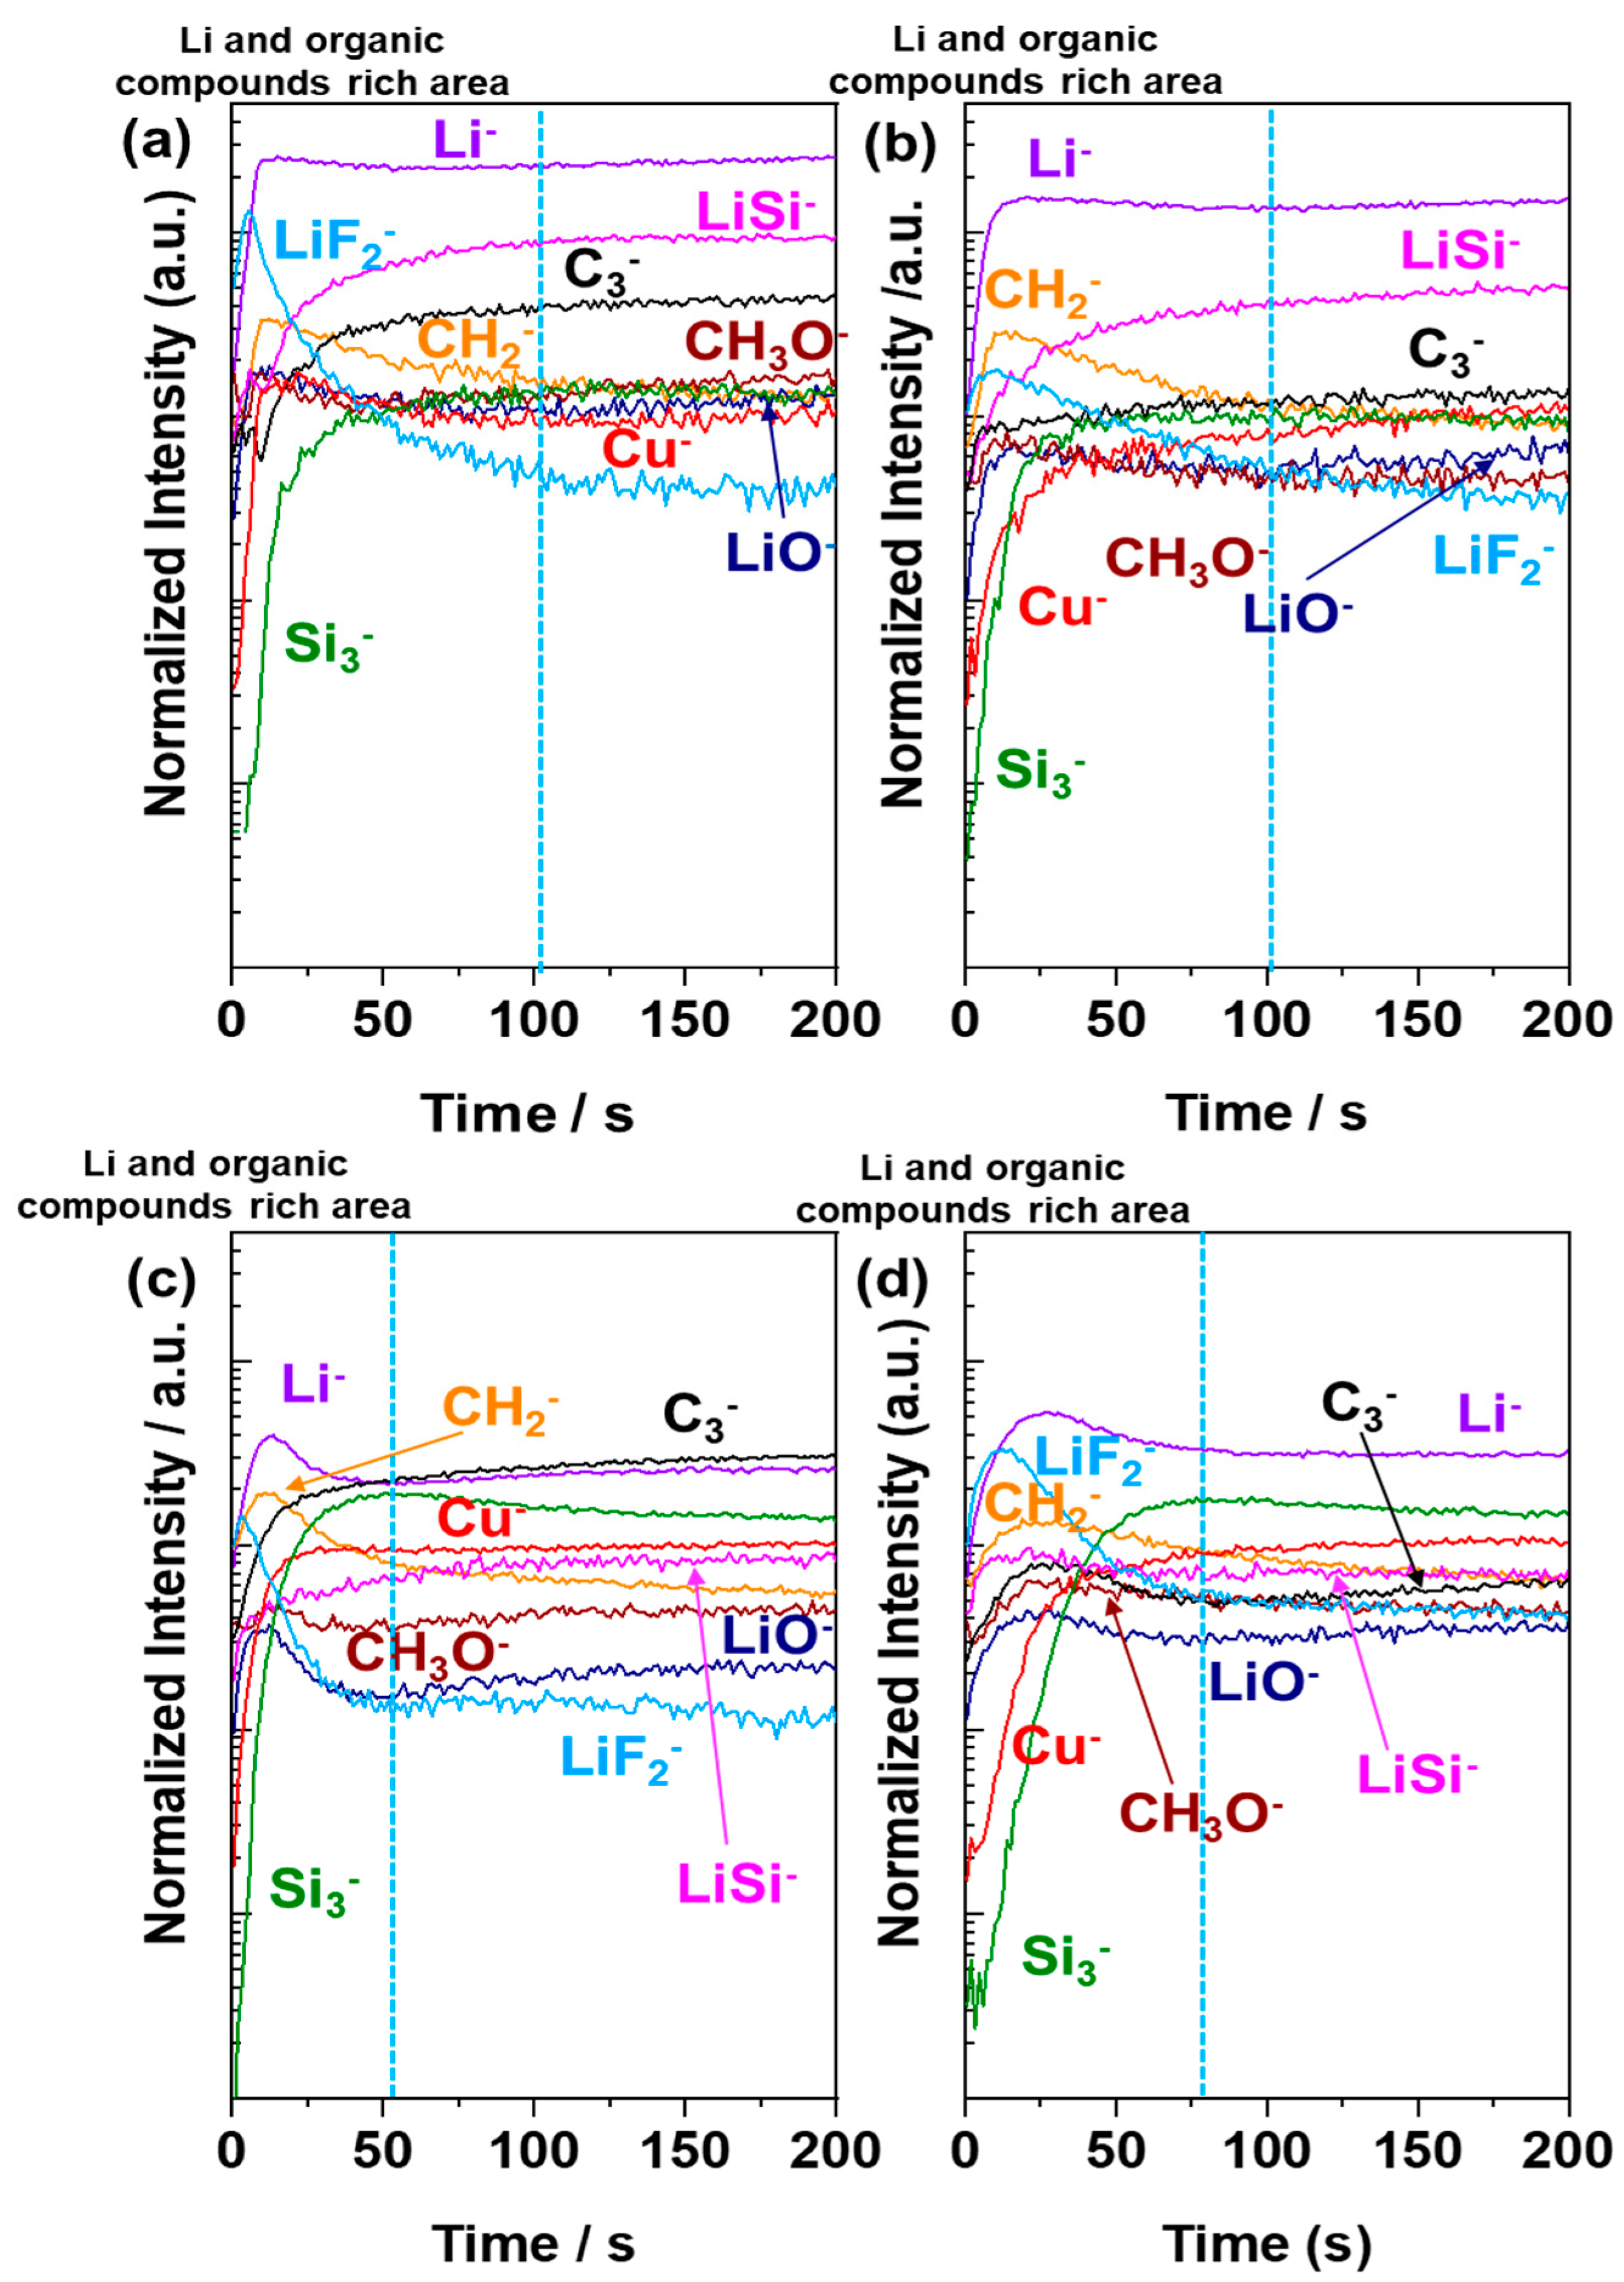
The ToF-SIMS depth profiles for the Si-XG-AB electrode and Si@C-network electrodes at points 3 and point 4 are shown in Figure 8. At point 3, the Si-XG-AB electrode is fully lithiated, which can be confirmed by very high intensities of Li, LiF2, and LiSi signals (Figure 8a). The maximum intensities of LiF2 and CH2 peaks obtained before the stable signals of Si3 and C3 (corresponding to the Si electrode material and AB conductive agent), agree with the high quantity of LiF and organic species observed by the XPS at point 3. On the Si@C-network electrode, the C3 signal is not as high (Figure 8b) as at points 1 and 2 (Figure 7b,d), which can be explained by the high amount of organic species well mixed with the carbon network. However, it should be noticed that the C3 signal can originate from the organic species, as well as from the carbon network. Therefore, when the SEI layer is mixed with the carbon layer, it becomes enriched in organic species leading to the disappearance of the C3 peak. The high intensities of LiF2 and CH2 peaks are observed before reaching the stable intensities of Si3 and Cu signals, confirming that the SEI layer is rich in LiF and organic species.
After delithiation at point 4 (Figure 8c), the intensity of the LiSi signal decreases, and a flat LiSi profile at point 3 (Figure 8a) changes to the profile with a peak at the beginning of sputtering, demonstrating the dealloying of Li-Si. The high CH2 and LiF2 peaks at the beginning of sputtering can be still observed, illustrating that the SEI layer is well present after delithiation. However, these two species show a faster decrease than in the case of the Si-XG-AB electrode at point 3, indicating that the SEI becomes thinner after delithiation. After the delithiation of the Si@C-network electrode (point 4, Figure 8d), the C3, Li, CH2, and LiO profiles present their peaks at the same position, similar to the Si@C-network electrode at point 2 (Figure 7d), indicating that the Li carbonate salts are still well mixed with the carbon network after delithiation. The LiF2 peak becomes wider than that at point 2, indicating that the LiF salt is also formed in the inner part of the SEI layer after a full cycle. Compared with point 3, most of the species at point 4 show lower intensities, except for Si3, demonstrating the dealloying of Li-Si and the decomposition of Li-related and organic species in the SEI layer, which corroborates with the XPS results shown in Figure 4. The lower sputtering time (76 s) of the Li and organic species-rich area at point 4 than that at point 3 (102 s) indicates the thinning of the SEI layer induced by the delithiation process.

4. Conclusions

In this work, the SEI formation processes on a binder-free Si@C-network electrode and a binder-containing Si-XG-AB electrode have been investigated by surface analytical techniques. The XPS results demonstrated that the SEI layer containing carbonate species and C-O ether linkage species on the Si-XG-AB electrode decomposes from the fully lithiated state to the fully delithiated state leading to the formation of −OCH3 and O-C=O whereas, on the Si@C-network electrode, the SEI layer (with the main species being −OCH3 and carbonate) only shows slight changes during the delithiation. The ToF-SIMS results also illustrate the growth and decomposition of the SEI on the Si-XG-AB electrode, while on the Si@C-network electrode, the formation of a LiF-rich layer on a carbon shell and an organic-rich layer on the Si surface can be observed, respectively. These two layers converge together at the fully lithiated state and then do not undergo a severe decomposition during delithiation, illustrating much better surface layer stability on the Si@C-network electrode than on the Si-XG-AB electrode, which agrees with the electrochemical and morphology characterization results.

Supplementary Materials

The following supporting information can be downloaded at: https://www.mdpi.com/article/10.3390/batteries8120271/s1.

Author Contributions

Conceptualization, Z.-Y.W. and L.D. methodology, Z.-Y.W. and L.D.; validation, Z.-Y.W., S.Z., A.S., J.Ś. and P.M.; formal analysis, Z.-Y.W., S.Z. and A.S.; investigation, Z.-Y.W., J.Ś.; data curation, S.Z., A.S. and Z.-Y.W.; writing—original draft preparation, Z.-Y.W.; writing—review and editing, J.Ś.; supervision, J.Ś.; project administration, J.Ś.; funding acquisition, P.M., J.Ś.; J.-T.L.: conceptualization, validation, writing-review & editing; L.H.: validation; S.-G.S.: validation. All authors have read and agreed to the published version of the manuscript.

Funding

This research was financed by Région Ile-de-France by the partial support for the XPS and ToF-SIMS equipment and by a scholarship from the China Scholarship Council (CSC) under the grant CSC N°201706310139 (Z.-Y. Wu).

Institutional Review Board Statement

Not applicable.

Informed Consent Statement

Not applicable.

Data Availability Statement

The data presented in this study are available within this article and Supplementary Information.

Conflicts of Interest

The authors declare no conflict of interest.

References

  1. Jin, Y.; Zhu, B.; Lu, Z.; Liu, N.; Zhu, J. Challenges and Recent Progress in the Development of Si Anodes for Lithium-Ion Battery. Adv. Energy Mater. 2017, 7, 1700715. [Google Scholar] [CrossRef] [Green Version]
  2. Dong, Y.; Slade, T.; Stolt, M.J.; Li, L.; Girard, S.N.; Mai, L.; Jin, S. Low-Temperature Molten-Salt Production of Silicon Nanowires by the Electrochemical Reduction of CaSiO3. Angew. Chem. Int. Ed. 2017, 129, 14645–14649. [Google Scholar] [CrossRef]
  3. Sun, L.; Wang, F.; Su, T.; Du, H. Room-Temperature Solution Synthesis of Mesoporous Silicon for Lithium Ion Battery Anodes. ACS Appl. Mater. Interfaces 2017, 9, 40386–40393. [Google Scholar] [CrossRef] [PubMed]
  4. Yang, J.; Wang, Y.; Li, W.; Wang, L.; Fan, Y.; Jiang, W.; Luo, W.; Wang, Y.; Kong, B.; Selomulya, C.; et al. Amorphous TiO2 Shells: A Vital Elastic Buffering Layer on Silicon Nanoparticles for High-Performance and Safe Lithium Storage. Adv. Mater. 2017, 29, 1700523. [Google Scholar] [CrossRef] [PubMed]
  5. Chen, B.; Zu, L.; Liu, Y.; Meng, R.; Feng, Y.; Peng, C.; Zhu, F.; Hao, T.; Ru, J.; Wang, Y.; et al. Space-Confined Atomic Clusters Catalyze Superassembly of Silicon Nanodots within Carbon Frameworks for Use in Lithium-Ion Batteries. Angew. Chem. Int. Ed. 2020, 132, 3161–3166. [Google Scholar] [CrossRef]
  6. Zhu, B.; Liu, G.; Lv, G.; Mu, Y.; Zhao, Y.; Wang, Y.; Li, X.; Yao, P.; Deng, Y.; Cui, Y.; et al. Minimized lithium trapping by isovalent isomorphism for high initial Coulombic efficiency of silicon anodes. Sci. Adv. 2019, 5, eaax0651. [Google Scholar] [CrossRef] [Green Version]
  7. Fang, R.; Miao, C.; Mou, H.; Xiao, W. Facile synthesis of Si@TiO2@rGO composite with sandwich-like nanostructure as superior performance anodes for lithium ion batteries. J. Alloys Compd. 2020, 818, 152884. [Google Scholar] [CrossRef]
  8. Deng, L.; Wu, Z.-Y.; You, J.; Yin, Z.; Ren, W.; Zhang, P.; Xu, B.; Zhou, Y.; Li, J. The Si@C-Network Electrode Prepared by an In Situ Carbonization Strategy with Enhanced Cycle Performance. ChemElectroChem 2020, 7, 4999–5004. [Google Scholar] [CrossRef]
  9. Magasinski, A.; Zdyrko, B.; Kovalenko, I.; Hertzberg, B.; Burtovyy, R.; Huebner, C.F.; Fuller, T.F.; Luzinov, I.; Yushin, G. Toward Efficient Binders for Li-Ion Battery Si-Based Anodes: Polyacrylic Acid. ACS Appl. Mater. Interfaces 2010, 2, 3004–3010. [Google Scholar] [CrossRef]
  10. Kovalenko, I.; Zdyrko, B.; Magasinski, A.; Hertzberg, B.; Milicev, Z.; Burtovyy, R.; Luzinov, I.; Yushin, G. A Major Constituent of Brown Algae for Use in High-Capacity Li-Ion Batteries. Science 2011, 334, 75–79. [Google Scholar] [CrossRef]
  11. Liu, J.; Zhang, Q.; Zhang, T.; Li, J.-T.; Huang, L.; Sun, S.-G. A Robust Ion-Conductive Biopolymer as a Binder for Si Anodes of Lithium-Ion Batteries. Adv. Funct. Mater. 2015, 25, 3599–3605. [Google Scholar] [CrossRef]
  12. Li, J.-T.; Wu, Z.-Y.; Lu, Y.-Q.; Zhou, Y.; Huang, Q.-S.; Huang,, L.; Sun, S.-G. Water Soluble Binder, an Electrochemical Performance Booster for Electrode Materials with High Energy Density. Adv. Energy Mater. 2017, 7, 1701185. [Google Scholar] [CrossRef]
  13. Zhao, Y.; Yue, F.; Li, S.; Zhang, Y.; Tian, Z.; Xu, Q.; Xin, S.; Guo, Y. Advances of polymer binders for silicon-based anodes in high energy density lithium-ion batteries. InfoMat 2021, 3, 460–501. [Google Scholar] [CrossRef]
  14. Chen, L.; Xie, X.; Xie, J.; Wang, K.; Yang, J. Binder effect on cycling performance of silicon/carbon composite anodes for lithium ion batteries. J. Appl. Electrochem. 2006, 36, 1099–1104. [Google Scholar] [CrossRef]
  15. Hochgatterer, N.S.; Schweiger, M.R.; Koller, S.; Raimann, P.R.; Wöhrle, T.; Wurm, C.; Winter, M. Silicon/Graphite Composite Electrodes for High-Capacity Anodes: Influence of Binder Chemistry on Cycling Stability. Electrochem. Solid State Lett. 2008, 11, A76. [Google Scholar] [CrossRef]
  16. Chou, S.-L.; Pan, Y.; Wang, J.-Z.; Liu, H.-K.; Dou, S.-X. Small things make a big difference: Binder effects on the performance of Li and Na batteries. Phys. Chem. Chem. Phys. 2014, 16, 20347–20359. [Google Scholar] [CrossRef] [PubMed]
  17. Kwon, T.; Choi, J.W.; Coskun, A. The emerging era of supramolecular polymeric binders in silicon anodes. Chem. Soc. Rev. 2018, 47, 2145–2164. [Google Scholar] [CrossRef] [Green Version]
  18. Chen, L.; Wang, K.; Xie, X.; Xie, J. Effect of vinylene carbonate (VC) as electrolyte additive on electrochemical performance of Si film anode for lithium ion batteries. J. Power Sources 2007, 174, 538–543. [Google Scholar] [CrossRef]
  19. Etacheri, V.; Haik, O.; Goffer, Y.; Roberts, G.A.; Stefan, I.C.; Fasching, R.; Aurbach, D. Effect of Fluoroethylene Carbonate (FEC) on the Performance and Surface Chemistry of Si-Nanowire Li-Ion Battery Anodes. Langmuir 2012, 28, 965–976. [Google Scholar] [CrossRef]
  20. Li, Y.; Xu, G.; Yao, Y.; Xue, L.; Zhang, S.; Lu, Y.; Toprakci, O.; Zhang, X. Improvement of cyclability of silicon-containing carbon nanofiber anodes for lithium-ion batteries by employing succinic anhydride as an electrolyte additive. J. Solid State Electrochem. 2013, 17, 1393–1399. [Google Scholar] [CrossRef]
  21. Wu, Z.-Y.; Lu, Y.-Q.; Li, J.-T.; Zanna, S.; Seyeux, A.; Huang, L.; Sun, S.-G.; Marcus, P.; Światowska, J. Influence of Carbonate Solvents on Solid Electrolyte Interphase Composition over Si Electrodes Monitored by In Situ and Ex Situ Spectroscopies. ACS Omega 2021, 6, 27335–27350. [Google Scholar] [CrossRef] [PubMed]
  22. Philippe, B.; Dedryvère, R.; Gorgoi, M.; Rensmo, H.; Gonbeau, D.; Edström, K. Improved Performances of Nanosilicon Electrodes Using the Salt LiFSI: A Photoelectron Spectroscopy Study. J. Am. Chem. Soc. 2013, 135, 9829–9842. [Google Scholar] [CrossRef] [PubMed]
  23. Pereira-Nabais, C.; Światowska, J.; Chagnes, A.; Ozanam, F.; Gohier, A.; Tran-Van, P.; Cojocaru, C.-S.; Cassir, M.; Marcus, P. Interphase chemistry of Si electrodes used as anodes in Li-ion batteries. Appl. Surf. Sci. 2013, 266, 5–16. [Google Scholar] [CrossRef] [Green Version]
  24. Han, B.; Liao, C.; Dogan, F.; Trask, S.E.; Lapidus, S.H.; Vaughey, J.T.; Key, B. Using Mixed Salt Electrolytes to Stabilize Silicon Anodes for Lithium-Ion Batteries via in Situ Formation of Li–M–Si Ternaries (M = Mg, Zn, Al, Ca). ACS Appl. Mater. Interfaces 2019, 11, 29780–29790. [Google Scholar] [CrossRef] [Green Version]
  25. Ren, W.-F.; Zhou, Y.; Li, J.-T.; Huang, L.; Sun, S.-G. Si anode for next-generation lithium-ion battery. Curr. Opin. Electrochem. 2019, 18, 46–54. [Google Scholar] [CrossRef]
  26. Eshetu, G.G.; Figgemeier, E. Confronting the Challenges of Next-Generation Silicon Anode-Based Lithium-Ion Batteries: Role of Designer Electrolyte Additives and Polymeric Binders. ChemSusChem 2019, 12, 2515–2539. [Google Scholar] [CrossRef]
  27. Dalavi, S.; Guduru, P.; Lucht, B.L. Performance Enhancing Electrolyte Additives for Lithium Ion Batteries with Silicon Anodes. J. Electrochem. Soc. 2012, 159, A642. [Google Scholar] [CrossRef]
  28. Markevich, E.; Salitra, G.; Aurbach, D. Fluoroethylene Carbonate as an Important Component for the Formation of an Effective Solid Electrolyte Interphase on Anodes and Cathodes for Advanced Li-Ion Batteries. ACS Energy Lett. 2017, 2, 1337–1345. [Google Scholar] [CrossRef] [Green Version]
  29. Choi, N.-S.; Yew, K.H.; Kim, H.; Kim, S.S.; Choi, W.-U. Surface layer formed on silicon thin-film electrode in lithium bis(oxalato) borate-based electrolyte. J. Power Sources 2007, 172, 404–409. [Google Scholar] [CrossRef]
  30. Ma, L.; Glazier, S.L.; Petibon, R.; Xia, J.; Peters, J.M.; Liu, Q.; Allen, J.; Doig, R.N.C.; Dahn, J.R. A Guide to Ethylene Carbonate-Free Electrolyte Making for Li-Ion Cells. J. Electrochem. Soc. 2016, 164, A5008–A5018. [Google Scholar] [CrossRef]
  31. Pereira-Nabais, C.; Światowska, J.; Chagnes, A.; Gohier, A.; Zanna, S.; Seyeux, A.; Tran-Van, P.; Cojocaru, C.-S.; Cassir, M.; Marcus, P. Insight into the Solid Electrolyte Interphase on Si Nanowires in Lithium-Ion Battery: Chemical and Morphological Modifications upon Cycling. J. Phys. Chem. C 2014, 118, 2919–2928. [Google Scholar] [CrossRef]
  32. Pereira-Nabais, C.; Światowska, J.; Rosso, M.; Ozanam, F.; Seyeux, A.; Gohier, A.; Tran-Van, P.; Cassir, M.; Marcus, P. Effect of Lithiation Potential and Cycling on Chemical and Morphological Evolution of Si Thin Film Electrode Studied by ToF-SIMS. ACS Appl. Mater. Interfaces 2014, 6, 13023–13033. [Google Scholar] [CrossRef] [PubMed]
  33. Feng, Y.; Koo, B.M.; Seyeux, A.; Światowska, J.; Henry de Villeneuve, C.; Rosso, M.; Ozanam, F. ToF-SIMS Li Depth Profiling of Pure and Methylated Amorphous Silicon Electrodes After Their Partial Lithiation. ACS Appl. Mater. Interfaces 2022, 14, 35716–35725. [Google Scholar] [CrossRef] [PubMed]
  34. Chan, C.K.; Ruffo, R.; Hong, S.S.; Cui, Y. Surface chemistry and morphology of the solid electrolyte interphase on silicon nanowire lithium-ion battery anodes. J. Power Sources 2009, 189, 1132–1140. [Google Scholar] [CrossRef]
  35. Bryngelsson, H.; Stjerndahl, M.; Gustafsson, T.; Edström, K. How dynamic is the SEI? J. Power Sources 2007, 174, 970–975. [Google Scholar] [CrossRef]
  36. Rezvani, S.J.; Nobili, F.; Gunnella, R.; Ali, M.; Tossici, R.; Passerini, S.; Di Cicco, A. SEI Dynamics in Metal Oxide Conversion Electrodes of Li-Ion Batteries. J. Phys. Chem. C 2017, 121, 26379–26388. [Google Scholar] [CrossRef]
  37. Hou, T.; Yang, G.; Rajput, N.N.; Self, J.; Park, S.-W.; Nanda, J.; Persson, K.A. The influence of FEC on the solvation structure and reduction reaction of LiPF6/EC electrolytes and its implication for solid electrolyte interphase formation. Nano Energy 2019, 64, 103881. [Google Scholar] [CrossRef]
  38. Jeschull, F.; Lindgren, F.; Lacey, M.J.; Björefors, F.; Edström, K.; Brandell, D. Influence of inactive electrode components on degradation phenomena in nano-Si electrodes for Li-ion batteries. J. Power Sources 2016, 325, 513–524. [Google Scholar] [CrossRef]
  39. Radvanyi, E.; De Vito, E.; Porcher, W.; Jouanneau Si Larbi, S. An XPS/AES comparative study of the surface behaviour of nano-silicon anodes for Li-ion batteries. J. Anal. At. Spectrom. 2014, 29, 1120–1131. [Google Scholar] [CrossRef]
  40. Bordes, A.; De Vito, E.; Haon, C.; Secouard, C.; Montani, A.; Marcus, P. Investigation of Lithium Insertion Mechanisms of a Thin-Film Si Electrode by Coupling Time-of-Flight Secondary-Ion Mass Spectrometry, X-ray Photoelectron Spectroscopy, and Focused-Ion-Beam/SEM. ACS Appl. Mater. Interfaces 2015, 7, 27853–27862. [Google Scholar] [CrossRef]
  41. Philippe, B.; Dedryvère, R.; Allouche, J.; Lindgren, F.; Gorgoi, M.; Rensmo, H.; Gonbeau, D.; Edström, K. Nanosilicon Electrodes for Lithium-Ion Batteries: Interfacial Mechanisms Studied by Hard and Soft X-ray Photoelectron Spectroscopy. Chem. Mater. 2012, 24, 1107–1115. [Google Scholar] [CrossRef]
  42. Philippe, B.; Dedryvère, R.; Gorgoi, M.; Rensmo, H.; Gonbeau, D.; Edström, K. Role of the LiPF6 Salt for the Long-Term Stability of Silicon Electrodes in Li-Ion Batteries—A Photoelectron Spectroscopy Study. Chem. Mater. 2013, 25, 394–404. [Google Scholar] [CrossRef]
  43. Nguyen, C.C.; Song, S.-W. Characterization of SEI layer formed on high performance Si–Cu anode in ionic liquid battery electrolyte. Electrochem. Commun. 2010, 12, 1593–1595. [Google Scholar] [CrossRef]
  44. Aurbach, D.; Levi, M.D.; Levi, E.; Schechter, A. Failure and Stabilization Mechanisms of Graphite Electrodes. J. Phys. Chem. B 1997, 101, 2195–2206. [Google Scholar] [CrossRef]
  45. Ota, H.; Sakata, Y.; Inoue, A.; Yamaguchi, S. Analysis of Vinylene Carbonate Derived SEI Layers on Graphite Anode. J. Electrochem. Soc. 2004, 151, A1659. [Google Scholar] [CrossRef]
  46. Hu, Y.; Kong, W.; Li, H.; Huang, X.; Chen, L. Experimental and theoretical studies on reduction mechanism of vinyl ethylene carbonate on graphite anode for lithium ion batteries. Electrochem. Commun. 2004, 6, 126–131. [Google Scholar] [CrossRef]
  47. Cui, L.-F.; Ruffo, R.; Chan, C.K.; Peng, H.; Cui, Y. Crystalline-Amorphous Core-Shell Silicon Nanowires for High Capacity and High Current Battery Electrodes. Nano Lett. 2009, 9, 491–495. [Google Scholar] [CrossRef]
  48. Laïk, B.; Ung, D.; Caillard, A.; Sorin Cojocaru, C.; Pribat, D.; Pereira-Ramos, J.-P. An electrochemical and structural investigation of silicon nanowires as negative electrode for Li-ion batteries. J. Solid State Electrochem. 2010, 14, 1835–1839. [Google Scholar] [CrossRef]
  49. Hou, X.; Zhang, M.; Wang, J.; Hu, S.; Liu, X.; Shao, Z. High yield and low-cost ball milling synthesis of nano-flake Si@SiO2 with small crystalline grains and abundant grain boundaries as a superior anode for Li-ion batteries. J. Alloys Compd. 2015, 639, 27–35. [Google Scholar] [CrossRef]
  50. Światowska-Mrowiecka, J.; Maurice, V.; Zanna, S.; Klein, L.; Marcus, P. XPS study of Li ion intercalation in V2O5 thin films prepared by thermal oxidation of vanadium metal. Electrochim. Acta 2007, 52, 5644–5653. [Google Scholar] [CrossRef]
  51. Verma, P.; Maire, P.; Novák, P. A review of the features and analyses of the solid electrolyte interphase in Li-ion batteries. Electrochim. Acta 2010, 55, 6332–6341. [Google Scholar] [CrossRef]
  52. Konstadinidis, K.; Zhang, P.; Opila, R.L.; Allara, D.L. An in-situ X-ray photoelectron study of the interaction between vapor-deposited Ti atoms and functional groups at the surfaces of self-assembled monolayers. Surf. Sci. 1995, 338, 300–312. [Google Scholar] [CrossRef]
  53. Philippe, B.; Hahlin, M.; Edström, K.; Gustafsson, T.; Siegbahn, H.; Rensmo, H. Photoelectron Spectroscopy for Lithium Battery Interface Studies. J. Electrochem. Soc. 2015, 163, A178–A191. [Google Scholar] [CrossRef] [Green Version]
  54. Malmgren, S.; Ciosek, K.; Hahlin, M.; Gustafsson, T.; Gorgoi, M.; Rensmo, H.; Edström, K. Comparing anode and cathode electrode/electrolyte interface composition and morphology using soft and hard X-ray photoelectron spectroscopy. Electrochim. Acta 2013, 97, 23–32. [Google Scholar] [CrossRef]
  55. Xu, K.; von Cresce, A. Interfacing electrolytes with electrodes in Li ion batteries. J. Mater. Chem. 2011, 21, 9849–9864. [Google Scholar] [CrossRef]
  56. Etacheri, V.; Geiger, U.; Gofer, Y.; Roberts, G.A.; Stefan, I.C.; Fasching, R.; Aurbach, D. Exceptional Electrochemical Performance of Si-Nanowires in 1,3-Dioxolane Solutions: A Surface Chemical Investigation. Langmuir 2012, 28, 6175–6184. [Google Scholar] [CrossRef] [PubMed]
  57. Campion, C.L.; Li, W.; Lucht, B.L. Thermal Decomposition of LiPF6-Based Electrolytes for Lithium-Ion Batteries. J. Electrochem. Soc. 2005, 152, A2327. [Google Scholar] [CrossRef]
  58. Wilken, S.; Treskow, M.; Scheers, J.; Johansson, P.; Jacobsson, P. Initial stages of thermal decomposition of LiPF6-based lithium ion battery electrolytes by detailed Raman and NMR spectroscopy. RSC Adv. 2013, 3, 16359–16364. [Google Scholar] [CrossRef]
  59. Dedryvère, R.; Gireaud, L.; Grugeon, S.; Laruelle, S.; Tarascon, J.-M.; Gonbeau, D. Characterization of Lithium Alkyl Carbonates by X-ray Photoelectron Spectroscopy: Experimental and Theoretical Study. J. Phys. Chem. B 2005, 109, 15868–15875. [Google Scholar] [CrossRef]
  60. Ermolieff, A.; Martin, F.; Amouroux, A.; Marthon, S.; Westendorp, J.F.M. Surface composition analysis of HF vapour cleaned silicon by X-ray photoelectron spectroscopy. Appl. Surf. Sci. 1991, 48, 178–184. [Google Scholar] [CrossRef]
  61. Cardinaud, C.; Rhounna, A.; Turban, G.; Grolleau, B. Analyse XPS des surfaces de Si et SiO2 exposées aux plasmas de CHF3 et CHF3—C2F6. Polymérisation et gravure. Rev. de Phys. Appliquée 1989, 24, 309–321. [Google Scholar] [CrossRef]
  62. Gruntz, K.J.; Ley, L.; Johnson, R.L. Photoelectron spectra of fluorinated amorphous silicon (a −Si:F). Phys. Rev. B 1981, 24, 2069–2080. [Google Scholar] [CrossRef]
  63. Zazzera, L.A. XPS and SIMS Study of Anhydrous HF and UV/Ozone-Modified Silicon (100) Surfaces. J. Electrochem. Soc. 1989, 136, 484. [Google Scholar] [CrossRef]
  64. Andersson, A.M.; Edström, K. Chemical Composition and Morphology of the Elevated Temperature SEI on Graphite. J. Electrochem. Soc. 2001, 148, A1100. [Google Scholar] [CrossRef]
  65. Dupré, N.; Moreau, P.; De Vito, E.; Quazuguel, L.; Boniface, M.; Bordes, A.; Rudisch, C.; Bayle-Guillemaud, P.; Guyomard, D. Multiprobe Study of the Solid Electrolyte Interphase on Silicon-Based Electrodes in Full-Cell Configuration. Chem. Mater. 2016, 28, 2557–2572. [Google Scholar] [CrossRef] [Green Version]
  66. Bordes, A.; Eom, K.; Fuller, T.F. The effect of fluoroethylene carbonate additive content on the formation of the solid-electrolyte interphase and capacity fade of Li-ion full-cell employing nano Si–graphene composite anodes. J. Power Sources 2014, 257, 163–169. [Google Scholar] [CrossRef]
  67. Gauthier, M.; Danet, J.; Lestriez, B.; Roué, L.; Guyomard, D.; Moreau, P. Nanoscale compositional changes during first delithiation of Si negative electrodes. J. Power Sources 2013, 227, 237–242. [Google Scholar] [CrossRef]
  68. Lehner, A.; Steinhoff, G.; Brandt, M.S.; Eickhoff, M.; Stutzmann, M. Hydrosilylation of crystalline silicon (111) and hydrogenated amorphous silicon surfaces: A comparative X-ray photoelectron spectroscopy study. J. Appl. Phys. 2003, 94, 2289–2294. [Google Scholar] [CrossRef]
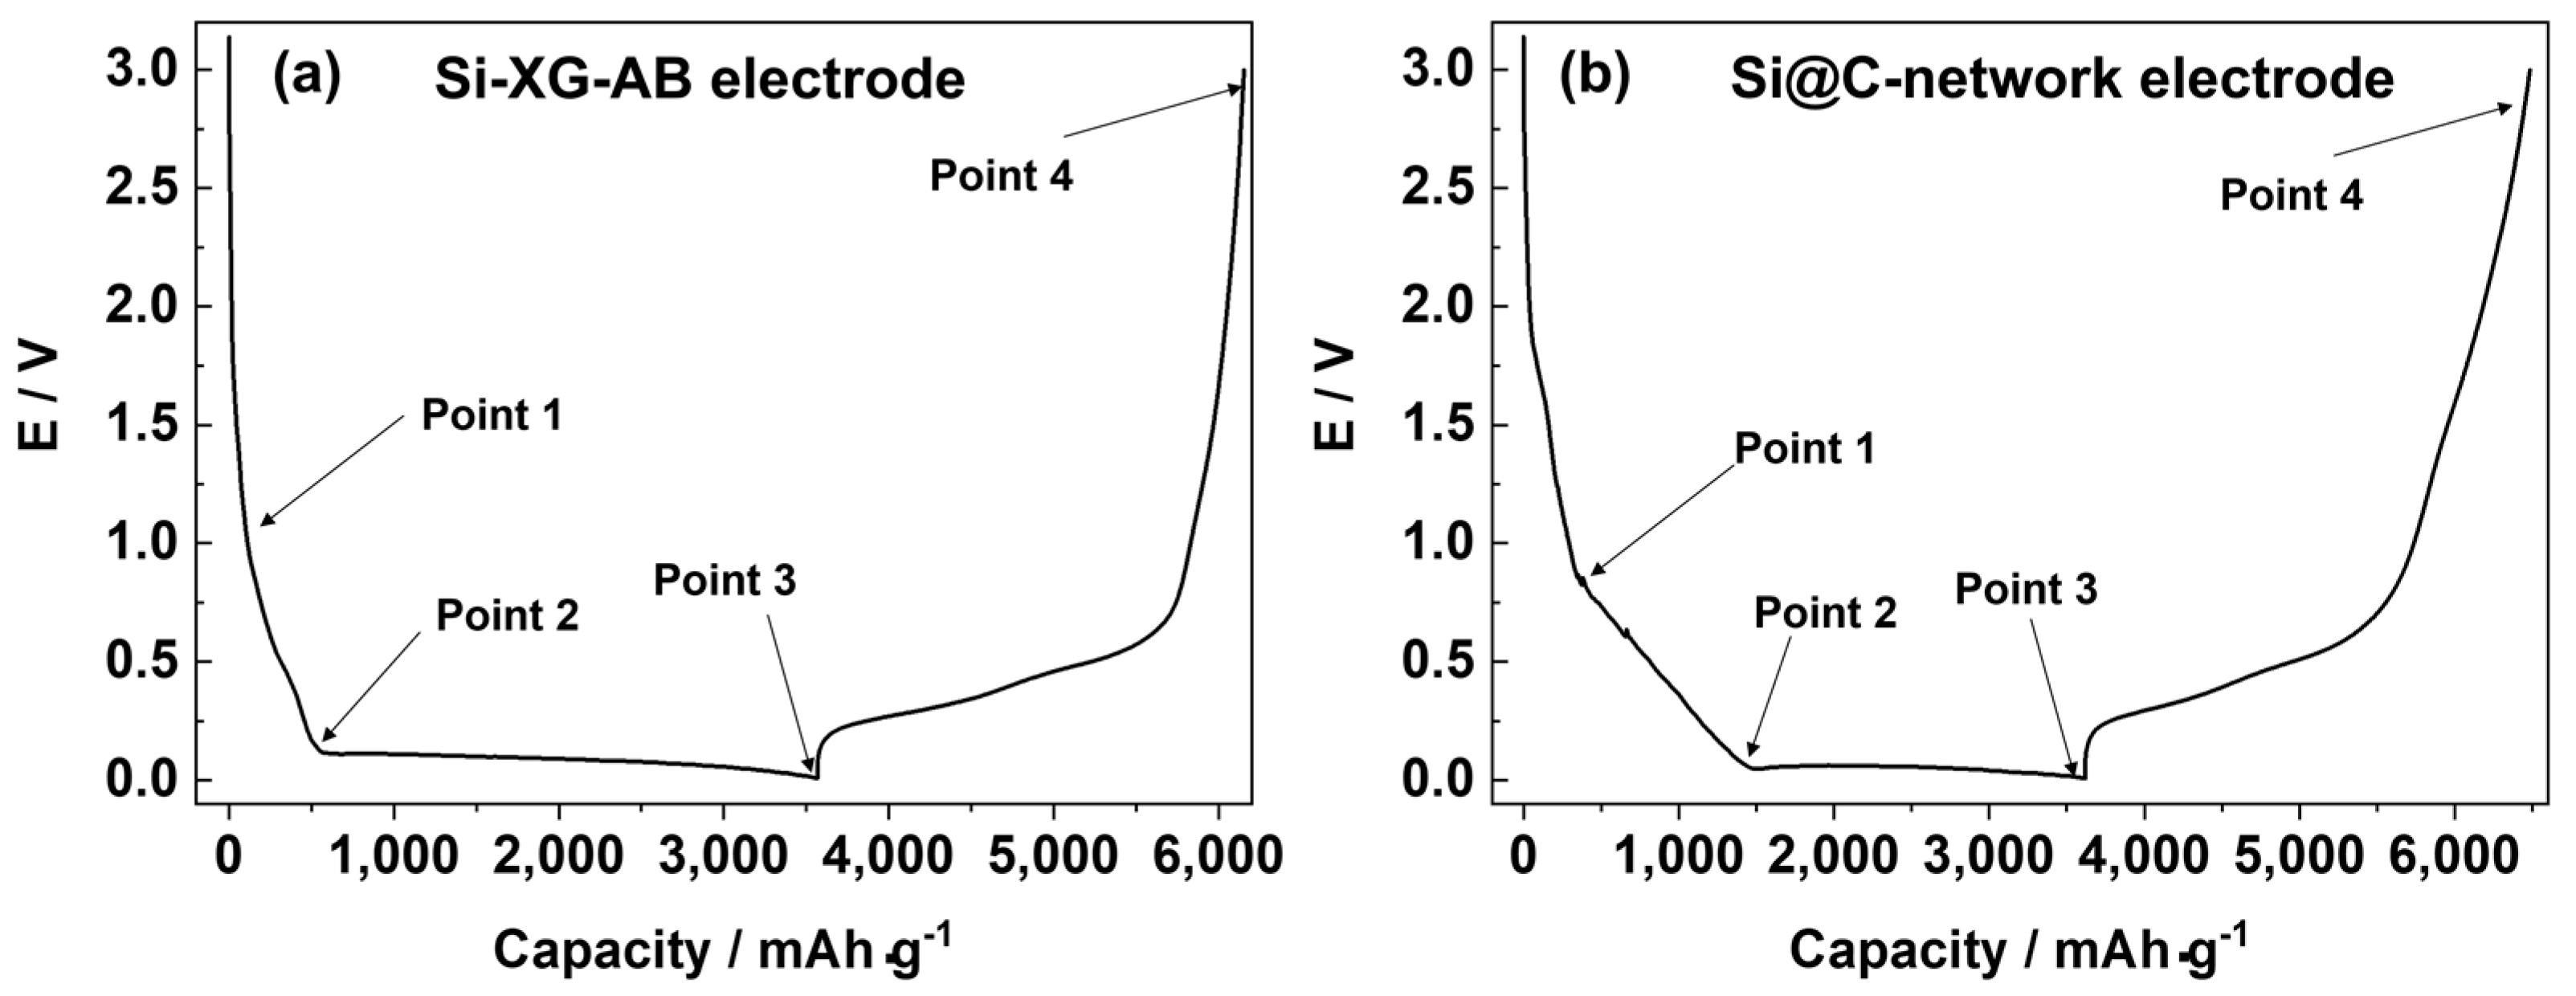
Figure 1. The first cycle of charge–discharge curves of (a) Si-XG-AB electrode and (b) Si@C-network electrode for XPS and ToF-SIMS sample preparations performed in 1M LiPF6/DMC electrolyte at 200 mA·g−1.
Batteries 08 00271 g001
Figure 2. Morphology of a pristine (a) Si-XG-AB electrode, (b) Si@C-network electrode and after galvanostatic cycling in LiPF6/DMC at 0.2 C for 100 cycles, (c,e) Si-XG-AB, and (d,f) Si@C-network electrode.
Batteries 08 00271 g002
Figure 3. High-resolution C 1s, F 1s, O 1s, and Si 2p core level spectra obtained on the pristine surface of the Si-XG-AB electrode and the Si-XG-AB electrode after different stages of lithiation/delithiation (points 1–4) in 1 M LiPF6/DMC.
Batteries 08 00271 g003
Figure 4. High-resolution C 1s, F 1s, O 1s, and Si 2p core level spectra obtained on the pristine and after different stages of lithiation/delithiation (points 1–4) in 1 M LiPF6/DMC of the Si@C-network electrode.
Batteries 08 00271 g004
Figure 5. Schematic diagram of the pristine Si@C-network electrode and after different stages of lithiation/delithiation (points 1–4) on the Si@C-network electrode.
Batteries 08 00271 g005
Figure 6. ToF-SIMS negative ion depth profiles for pristine (a) Si-XG-AB electrode; (b) Si@C-network electrode (sputtering area 300 μm × 300 μm).
Batteries 08 00271 g006
Figure 7. ToF-SIMS negative ion depth profiles for the Si-XG-AB electrode at (a) point 1 (c) point 2; the Si@C-network electrode at (b) point 1 (d) point 2 (sputtering area 300 μm × 300 μm).
Batteries 08 00271 g007
Figure 8. ToF-SIMS negative ion depth profiles for the Si-XG-AB electrode at (a) point 3 (c) point 4; the Si@C-network electrode at (b) point 3 (d) point 4 (sputtering area 300 μm × 300 μm).
Batteries 08 00271 g008
Publisher’s Note: MDPI stays neutral with regard to jurisdictional claims in published maps and institutional affiliations.