Abstract
Sodium-beta alumina is a solid-state electrolyte with outstanding chemical, electrochemical, and mechanical properties. Sodium polyaluminate is successfully employed in established Na–S and Na–NiCl2 cell systems. It is a promising candidate for all-solid-state sodium batteries. However, humidity affects the performance of this solid electrolyte. In this work, the effect of humidity on disk-shaped samples of Li-stabilized sodium-beta alumina stored in three different environments is quantified. We used impedance analysis and additional characterizations to investigate the consequences of the occurring degradation, namely ion exchange and subsequent buildup of surface layers. Sodium-beta alumina’s ionic conductivity gradually deteriorates up to two orders of magnitude. This is due to layers developed superficially during storage, while its fracture strength of 240 MPa remains unaffected. Changes in microstructure, composition, and cycle life of Na|BASE|Na cells highlight the importance of proper storage conditions: In just one week of improper storage, the critical current density collapsed from the maximum of 9.1 mA cm−2, one of the highest values reported for sodium-beta alumina, to 1.7 mA cm−2 at 25 °C. The results validate former observations regarding sodium-beta alumina’s moisture sensitivity and suggest how to handle sodium-beta alumina used in electrochemical cell systems.
1. Introduction
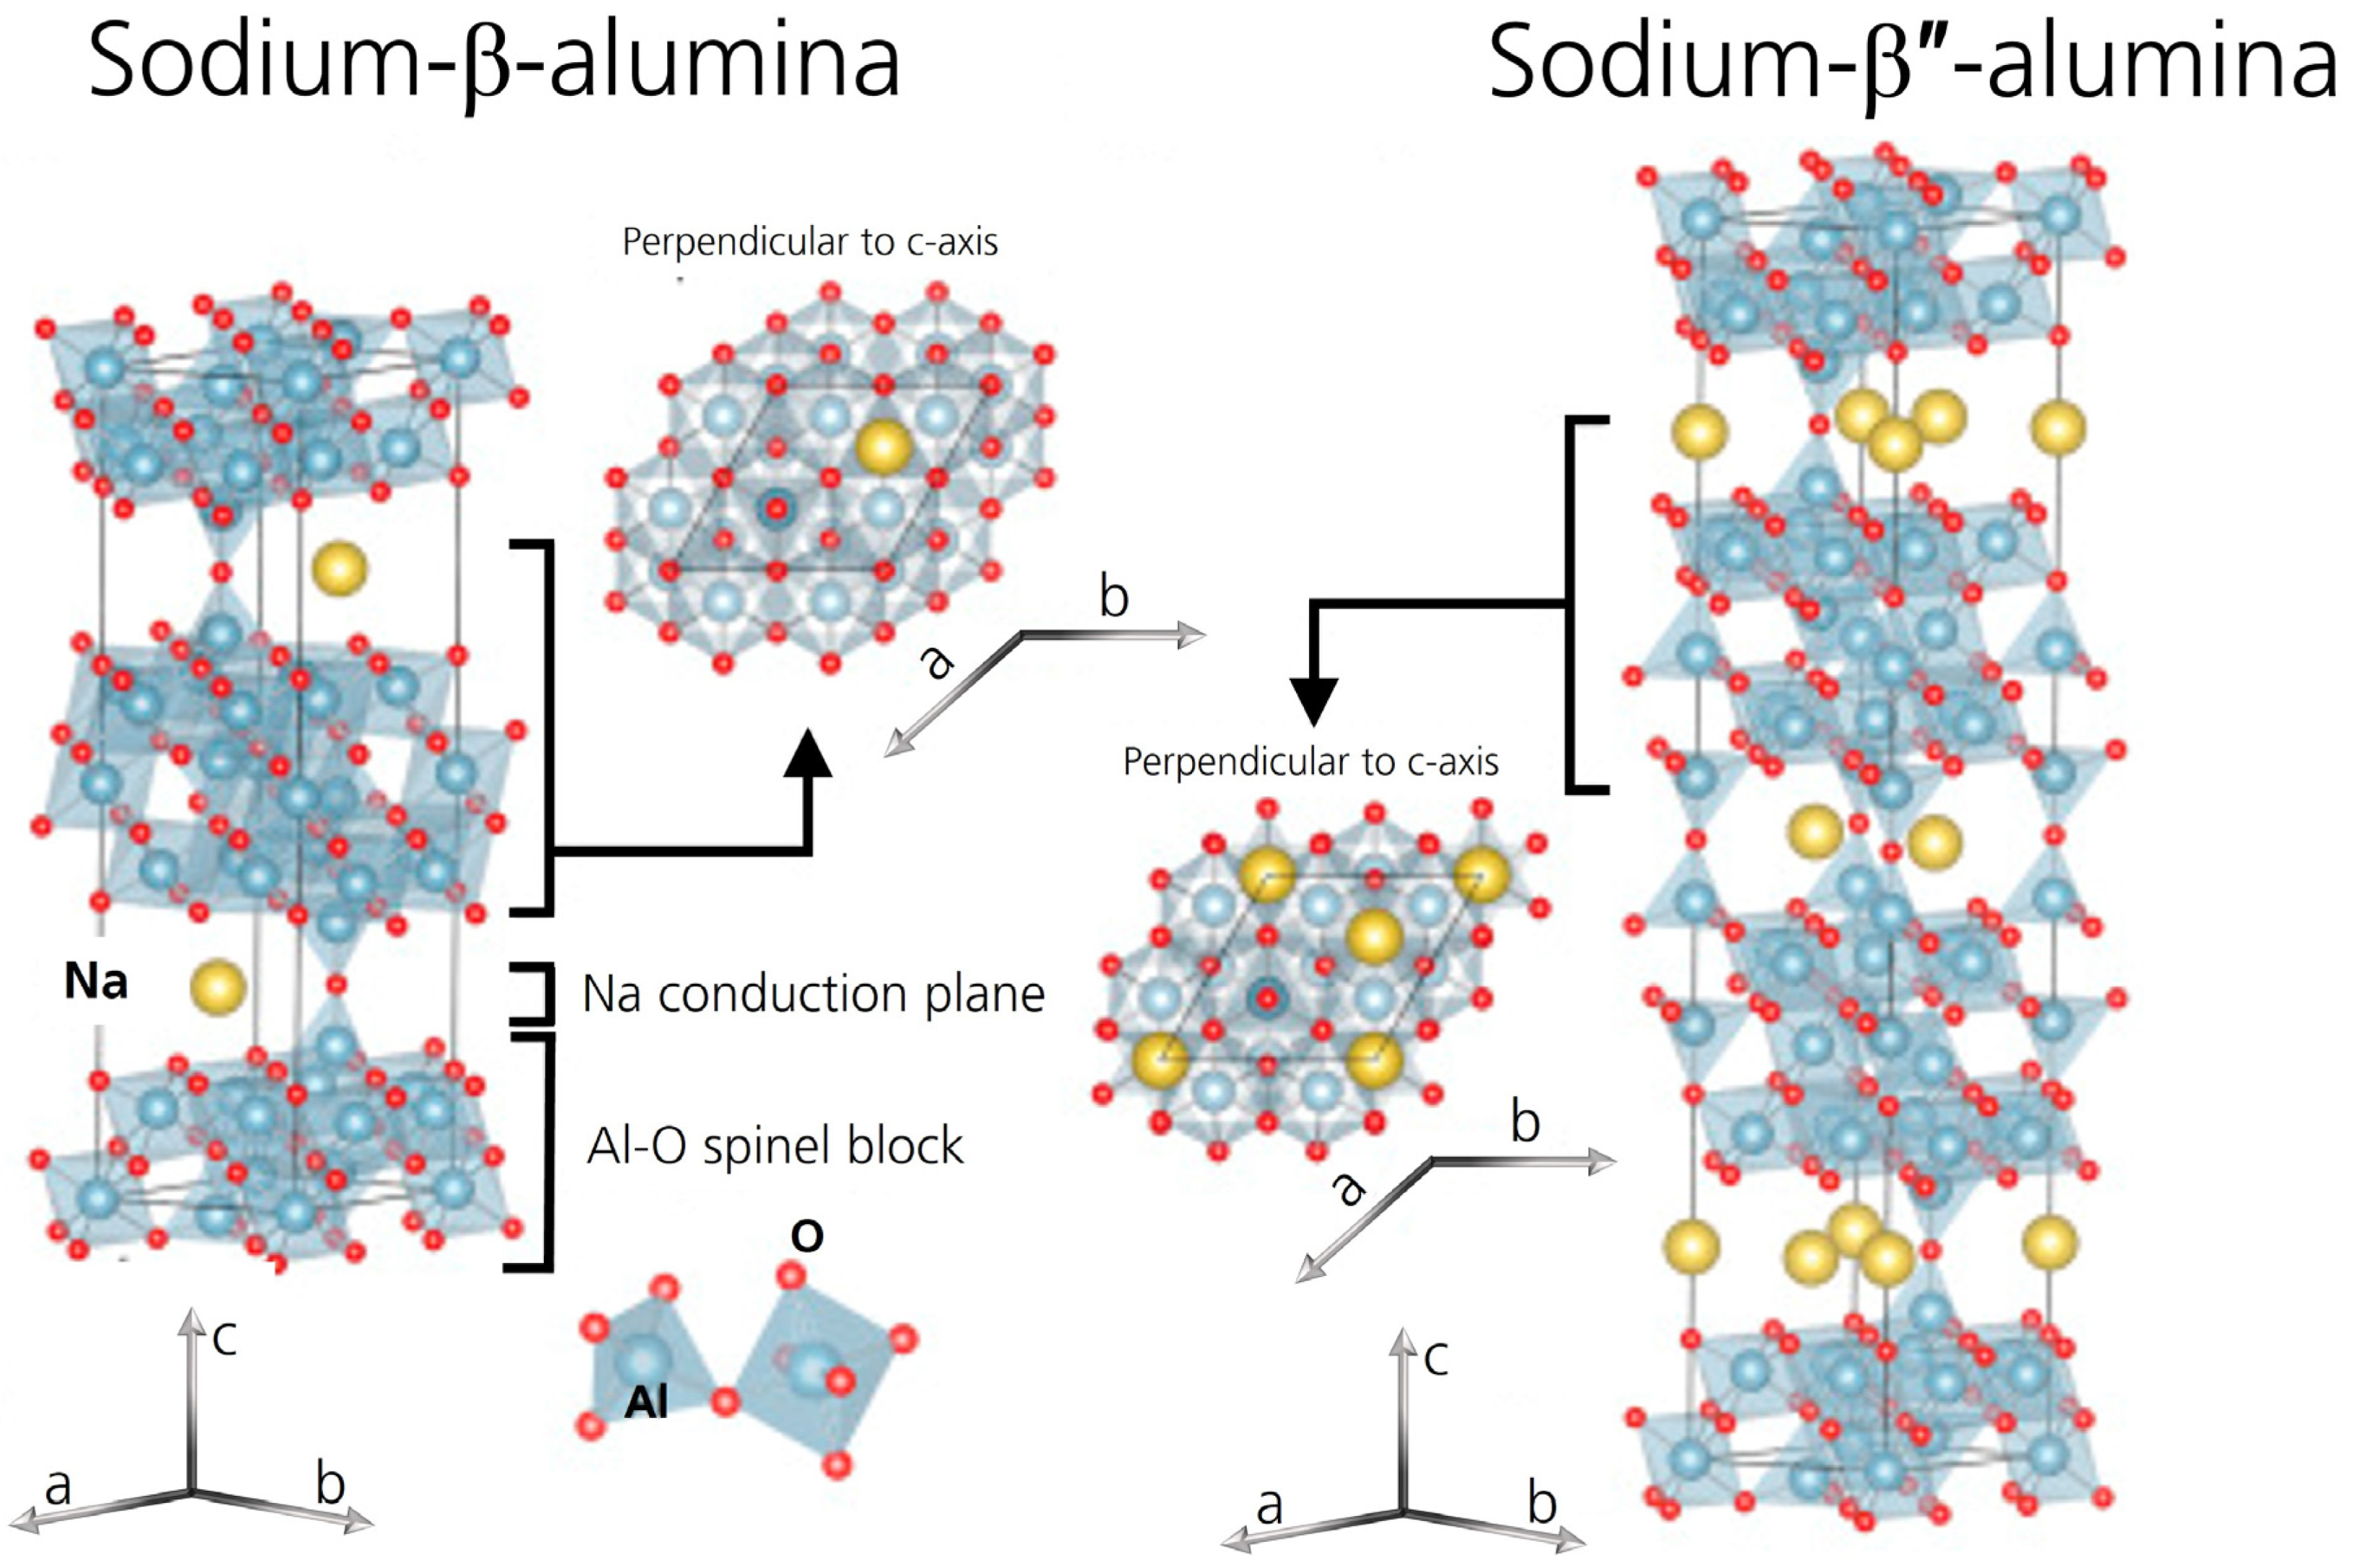
The ion-conducting ceramic sodium-beta alumina solid electrolyte (BASE) is environmentally friendly and based on abundant elements. It shows high ionic conductivity, mechanical strength, and low electronic conductivity [1]. Contrary to other solid electrolytes, BASE is stable against sodium [2] and shows excellent electrochemical stability [1,3]. The Na–NiCl2 and the Na–S cells are two well-known applications. They utilize tubular sodium-beta alumina solid electrolytes [4]. A planar cell design is also considered for these cell systems due to simpler handling, ease of production, and quality control [5]. Furthermore, disk-shaped sodium-beta alumina is increasingly used for solid-state batteries in mid- to low-temperature applications [6,7]. All cell types mentioned above are Na-based cells, which endeavor to play a substantial role in the post-Li-ion era [8]. Because they utilize sodium, they have the advantages of the earth’s abundance in sodium [9] and its high specific capacity of 1166 mAh g−1. Moreover, the standard potential of the Na+/Na couple is −2.71 V vs. the standard hydrogen electrode. BASE exhibits a mixture of two different crystal structures, Na-β-alumina and Na-β″-alumina, which are sodium polyaluminates (Figure 1). The Greek symbol denotes the respective crystal structure, while sodium-beta alumina/BASE are used as interchangeable, generic terms for the fabricated ceramic. The two crystal structures have the empirical formulas NaAl11O17 and NaAl5O8. However, both structures exhibit an excess of sodium over the ideal stoichiometry, making them non-stoichiometric compounds [10,11,12]. Sodium-β-alumina has a hexagonal crystal structure with two spinel blocks and a conduction plane (a0 = 0.559 nm, c0 = 2.26 nm, space group: P63/mmc) [13,14]. Sodium-β″-alumina exhibits a rhombohedral unit cell (a0 = 0.559 nm, c0 = 3.39 nm, space group: Rm) [14] with three spinel blocks and intermediate conduction planes [15]. The conduction planes of both structures are perpendicular to the c-axis, making the crystals anisotropic conductors. Sodium-β″-alumina exhibits a higher fraction of sodium ions in the conduction planes. Due to its higher ionic conductivity, it is the preferred phase (>95% phase content [6]) in the solid electrolyte. Sodium-β″-alumina usually is stabilized by the addition of Li+ or Mg2+ ions. The ions substitute Al3+ in the spinel blocks [14]. The polycrystalline sodium-beta alumina solid electrolyte exhibits a total ionic conductivity σtotal of 1–5 mS cm−1 at room temperature [6]. The ionic conductivity includes the conductivities of the bulk (σb) and grain boundary (σgb). The ionic conductivity increases considerably at higher temperatures and reaches values around 300 mS cm−1 at 300 °C [16]. However, the well-conducting sodium-β″-alumina phase is prone to water uptake [17], resulting in multiple consequences. The water-induced degradation is not only of academic interest. It is also an essential question for production and storage conditions, e.g., in Na–NiCl2 and Na–S cell production, because BASEs are vital for these cell systems.

Figure 1.
Crystal structures of sodium-β-alumina and sodium-β″-alumina. Adapted from [18], Copyright (2017), with permission from Elsevier.
The literature reported a negative influence of water (vapor) on the performance of BASEs in the 1970s and 1980s (see Table 1). Effects included a shape change of impedance spectra [19,20], weight increase [21], and mechanical deterioration [20,22]. Surface layers developed [19,22,23], and position- and intensity effects of reflections in the diffractogram [22] were observed. Furthermore, water (vapor) also affected the c0 lattice parameter [23,24]. It increased resistance in the radial direction for tubular samples [17] and annulets stored in laboratory air [20]. Finally, it decreased the cycle life of cells utilizing a moist BASE [25]. It is assumed that water is occluded by the ceramic’s micropores first. Afterward, much slower ion exchange, in which H3O+ replaces Na+, causes a deterioration of BASE [21]. Hence, it is of interest whether measures must be taken to avoid water uptake and how rigorously they must be implemented. For example, for Li-ion chemistry, even slight traces of water must be avoided at all costs [26,27].

Table 1.
Effects on differently stabilized sodium-beta aluminas stored in a humid atmosphere. β″: β″-phase content, r.h.: relative humidity, t: storage time in days, R: resistance, σ: mechanical strength, and c0: c0 lattice parameter. *: H2O in N2(RT). n/a: no information was found in the corresponding reference. +: increase, −: decrease, and o: no change.
This paper quantifies the humidity-induced degradation of disk-shaped, polycrystalline Li-stabilized sodium-beta alumina solid electrolytes (BASEs). We reassess whether even temporary storage in an inappropriate atmosphere affects BASE performance. We also determine the consequences for cell systems. The reassessment is due to differences in BASE shape and composition, storage conditions, and measuring methods compared to the older literature. Therefore, we stored disk-shaped samples of Li-stabilized sodium-beta alumina in controlled environments with three different relative humidities (r.h.): dry (0% r.h., N2 atmosphere), room (44% r.h., air), and humid (96% r.h., air) atmosphere. We regularly investigated the disks’ most crucial properties, i.e., ionic and electronic conductivities and mechanical strength. These parameters are essential for using this ceramic electrolyte in electrochemical cells. We first analyze the ceramic’s microstructure. We then demonstrate that sodium-beta alumina’s chemical composition changes when stored in 44% r.h. Furthermore, X-ray diffraction patterns indicate a buildup of surface layers. The results allow us to present a potential reaction mechanism. The mechanism parallels the degradation mechanism of sodium-beta alumina’s Li-analog. The unchanged mechanical strength hints that these changes are restricted to the surface, indeed, which is underlined by experimental observations. Finally, we measured a gradual but substantial deterioration in BASE’s ionic conductivity by two orders of magnitude. Time constant analysis underlines the assumption that the additional resistance is caused by the evolution of surface layers. Critical current density (CCD) evaluations show an even faster effect of humidity on the performance of moist sodium-beta alumina. It suggests that humidity directly affects the BASE|Na interface. Thus, storage in a dry atmosphere and thorough polishing is necessary for high-power applications utilizing Li-stabilized sodium-beta alumina. Following these steps, the CCD reaches values up to 9.1 mA cm−2 at an areal capacity of 0.25 mAh cm−2.
2. Materials and Methods
2.1. Sample Preparation
AlO(OH) (>98%, Nabaltec AG, Schwandorf, Germany), Na2CO3 (≥99.5%, Carl Roth GmbH + Co. KG, Karlsruhe, Germany), and Li2CO3 (≥99 %, Carl Roth GmbH + Co. KG, Karlsruhe, Germany) were mixed in the stoichiometry Na1.9Al10.67Li0.33O17. Afterward, the powder was calcined at 1280 °C for two hours in MgO crucibles in a furnace (N450, Nabertherm GmbH, Lilienthal, Germany). The powder mixture was suspended in water and mixed with an organic binder. Granules were obtained after spray-drying. The granules were pressed uniaxially into disk-shaped ceramic green bodies. Stacks of green bodies were sintered under an air atmosphere in a MgO crucible within a high-temperature furnace (HTL 16/17, Thermconcept Dr. Fischer GmbH & Co. KG, Bremen, Germany) at 1600 °C for 30 min. Excess powder of finely ground sodium-beta alumina was strewed between every single disk before the sintering process to provide an additional sodium source and to prevent sticking. Disk-shaped sodium-beta alumina solid electrolytes of roughly 314 mm2 (radius = 10 mm) × 1.3 mm were obtained. The disks were sanded to remove any excess powder from the disk surfaces. Afterward, the electrolytes were dried at 250 °C for 30 min to remove any moisture adsorbed during the sanding process. Then, they were brought immediately into a nitrogen-filled glovebox system (X-Line, GS GLOVEBOX Systemtechnik GmbH, Malsch, Germany, O2 < 1 ppm, H2O < 0.2 ppm).
To investigate the influence of humidity on the samples, we stored disks in a nitrogen-filled glovebox with a dry atmosphere (H2O < 0.2 ppm) and in two desiccators. The first desiccator’s bottom was filled with a binary saturated aqueous solution of potassium carbonate instead of desiccant. The second desiccator’s bottom was filled with purified water. This approach resulted in an atmosphere of stable relative humidity (r.h.) of 44% and 96%, with only a slight deviation in temperature (Figure S1).
2.2. Sample Characterization
Density analysis was carried out in toluene via Archimedes’s principle (XA204DR, Mettler-Toledo, Columbus, OH, USA). We measured the absolute density in a He-Pycnometer (Pycnomatik-ATC, Thermo Fisher, Waltham, MA, USA).
Scanning electron microscope (SEM) and energy-dispersive X-ray spectroscopy (EDX) scans were performed on the pristine sample’s fracture surface to analyze the microstructure (Ultra 55+, Carl Zeiss, Oberkochen, Germany). The surface was polished water-free using a diamond suspension. Afterward, the disk was thermally etched at 1500 °C for 30 min to visualize grain size and boundaries in the SEM image.
X-ray diffraction (XRD) patterns were measured from sintered disks (D8 Advance, Bruker, Billerica, MA, USA) in the range of 5° to 90° 2θ. We performed quantitative XRD evaluation by the Rietveld refinement method with Autoquan 2.8.0.2.
The infrared (IR) spectra were recorded from wavenumbers 4000 to 500 cm−1 using a Nicolet iS50 ATR-FT-IR spectrometer (Thermo Fisher Scientific, Waltham, MA, USA) with a deuterated triglycine sulfate (DTGS) detector with KBr window. We performed the measurements using eight scans per measurement. For measurement, we milled the disks after storage to a fine powder and pressed a tiny amount of it onto the ATR-FT-IR’s extended range diamond crystal.
We conducted fracture strength tests on twenty sintered disks per measurement by the ball-on-three-balls (Bo3B) method (Zwick 100, Zwick, Ulm, Germany). We evaluated the data with maximum likelihood estimation from Weibull statistics. Before fracture strength analysis, the disks were stored for 28 days in the glovebox and the desiccators.
Gold electrodes (99.99 %) were sputtered for conductivity measurements onto both sides of the samples (EM MED 020, Leica Microsystems GmbH, Wetzlar, Germany). One batch of samples was polished before measurement and the other batch before storage. Corundum sandpaper was used. We obtained Au-electrode thicknesses between 150–200 nm, determined with the equipped quartz balance (EM QSG 100, BAL-TEC AG, Balzers, Liechtenstein). We quantified ionic conductivities with electrochemical impedance spectroscopy (EIS) for each point in time and relative humidity. The excitation voltage was 20 mV from 7 MHz to 1 Hz with 36 points per decade while averaging four measurements per point. A waiting period of four oscillations was applied for each measurement frequency (SP-240, Biologic, Seyssinet-Pariset, France). The temperature ranged from 25 °C to 100 °C.
We determined the disks’ electronic conductivity with Au-blocking electrodes at 25 °C with chronoamperometry (CA) (VMP-3, Biologic, Seyssinet-Pariset, France). We applied DC polarizations of 0.5 V and 5.0 V for 60 min at each polarization. For EIS and CA measurements, a docking station (PAT-Heater-4, EL-cell, Hamburg, Germany) connected the measuring cells (PAT-Cells, EL-Cell, Hamburg, Germany) to the potentiostat and controlled the temperature. The measuring cells were assembled inside a nitrogen-filled glovebox to prevent moisture uptake. The measuring cells were helium leak tested, and air and moisture contaminations were avoided.
Critical current density (CCD) was evaluated on three specimens for each measurement using a symmetric Na|BASE|Na setup. We masked the solid electrolyte with a plastic foil for precise CCD evaluation. We defined a 0.5 cm2 contact area of metallic sodium with the ceramic disks. Then, thin sodium foils with a diameter of 10 mm were pressed onto both sides of the masked solid electrolyte. Stainless steel current collectors were employed. We performed the CCD experiments by galvanostatic cycling with SP-150 and SP-240 potentiostats (Biologic, Seyssinet-Pariset, France) while applying an initial pressure of 2 MPa. For cycling, we followed the method proposed by Sharafi et al. [28] to ensure good interfacial contact and initialized the cells at 85 °C. Afterward, we cycled the cells at 25 °C and increased the current density by 0.1 mA cm−2 for every cycle while keeping the transferred charge constant (0.25 mAh cm−2 per half cycle, i.e., for stripping as well as plating). After each cycle, an impedance measurement was performed to confirm the state of the cell. Like other groups, we defined the CCD as the current density’s absolute value when a sudden drop in potential was observed and the charge transfer resistance vanished in the Nyquist plot.
3. Results
3.1. Density and Microstructure Analysis
The pristine Li-stabilized beta-alumina solid electrolyte’s (BASE’s) absolute density was 3.20 ± 0.01 g cm−3. The density determined via Archimedes’s principle is 3.19 ± 0.03 g cm−3, corresponding to ≈99% absolute density.
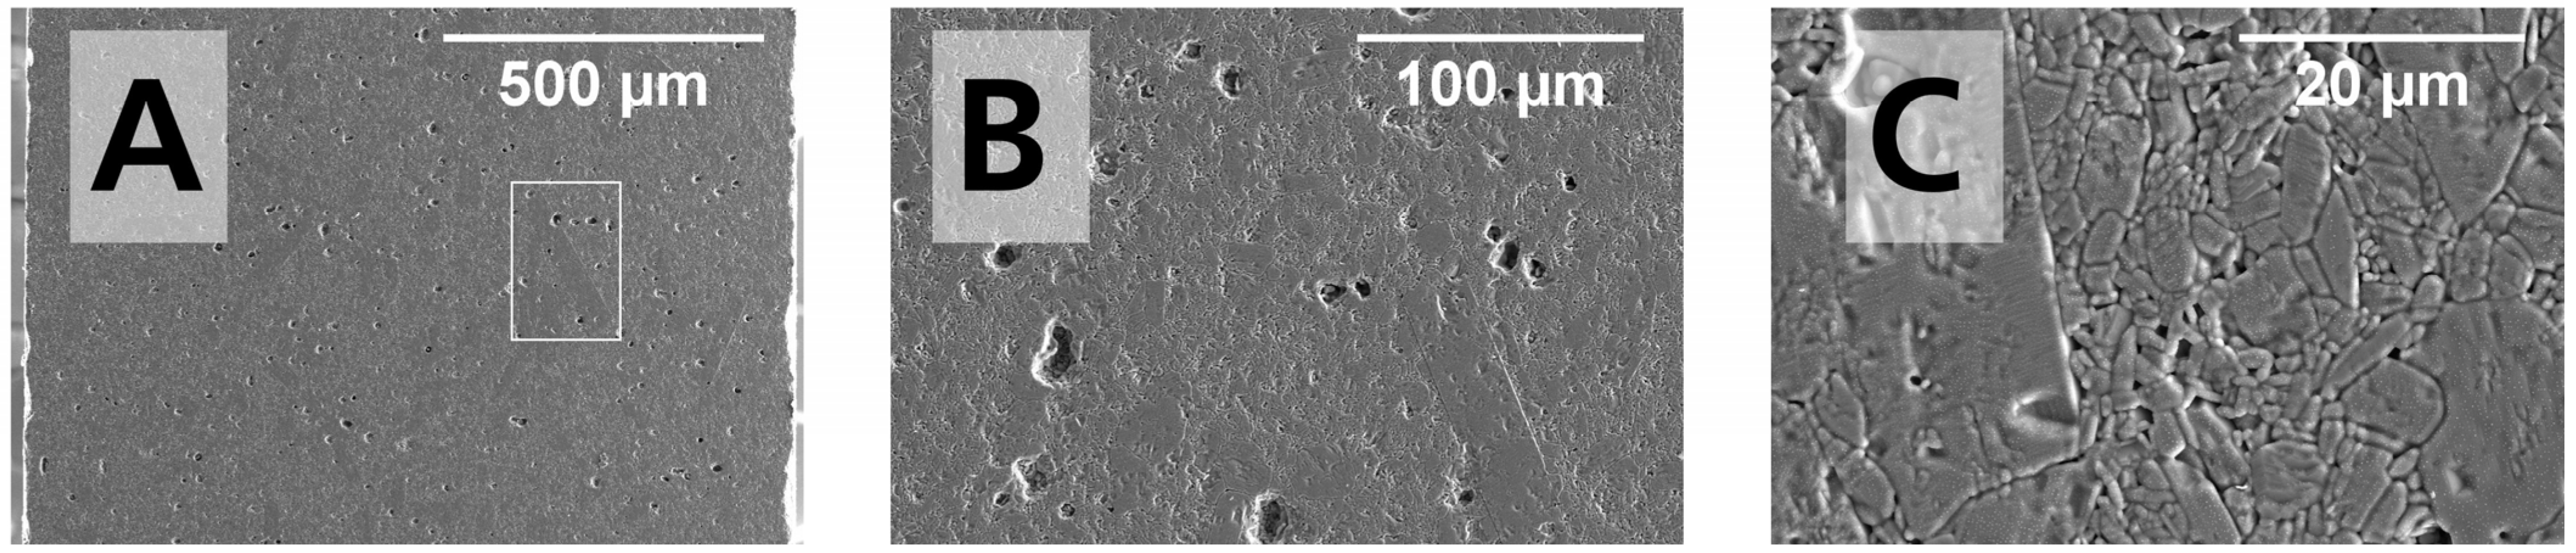
Figure 2 shows an SEM image of the cross-section of the thermally etched and polished pristine sample with different magnifications. Figure 2A reveals a microstructure with large grains embedded in a finer matrix of smaller grains and multiple pores. Several large grains (>100 µm) are visible, with a maximum grain length of up to 230 µm. The larger grains are embedded in medium-sized grains (10–20 µm, Figure 2B) and a matrix of multiple grains smaller than 5 µm. The fine matrix outweighs the large grains (see Figure 2C). The synthesized disks exhibit a microstructure typical for the conventional solid-state synthesis route. We ascribe this microstructure to the high sintering temperature of 1600 °C. The structure is expected, as we recently described the dependency of pores and grain growth on the sintering temperature [29]. Generally speaking, a microstructure with large grains favors BASE’s ionic conductivity but is detrimental to its mechanical stability. Pores and defects with sizes up to 20 µm might be occluded easily by water, promoting water-induced degradation. Despite the visible pores, the density analysis confirms an overall high density of up to 99%.

Figure 2.
SEM images of the pristine sample’s polished fracture surface with (A) no (B) medium and (C) large magnifications. The white box highlights a grain with a length of 230 µm.
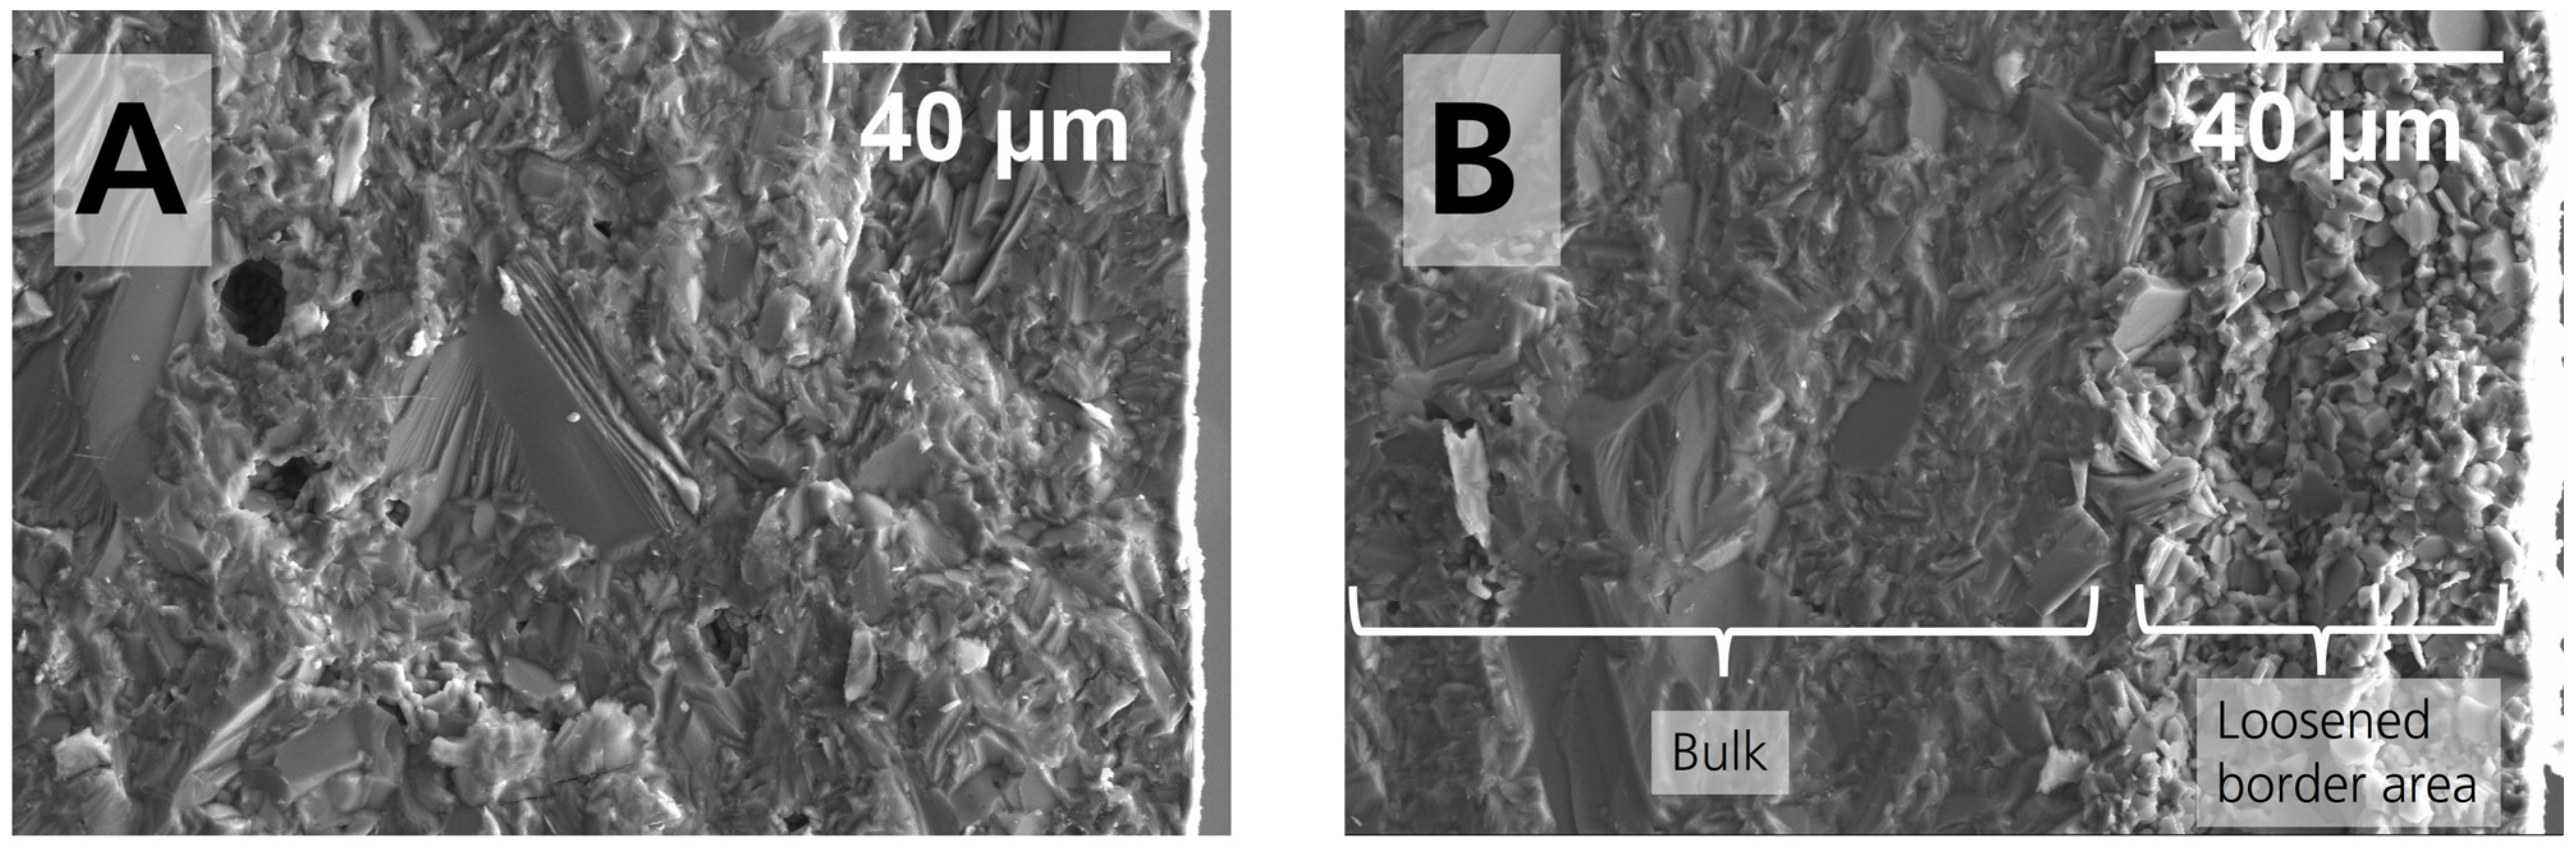
Because we expected humidity to impact disks superficially and in the first few microns, we fractured the disk and inspected the microstructure at the edges of the cross-section. The pristine sample’s unpolished cross-section is shown in Figure 3. The edges are visible on the outer right of the SEM images. The pristine sample’s cross-section in Figure 3A shows a homogeneous microstructure similar to the microstructure in Figure 2. The surface topography is rough because the sample was not polished before. Some pores are embedded in the matrix. The unpolished sample’s cross-section stored in 44% r.h. for 28 days is shown in Figure 3B. We noticed a conspicuous difference in the first 40 µm, measured from the edge, compared to the pristine sample. For the stored sample, the microstructure is loosened on the outer right compared to the pristine sample. Despite lacking quantification, the loosening is evident for the moisture-exposed sample in the first 40 µm. It contradicts the microstructure of the pristine sample, where the grains are not separated. From SEM analysis covering the entire border area of the cross-section, we can confirm that the loosening is observable along the entire disk, so we excluded a random defect.
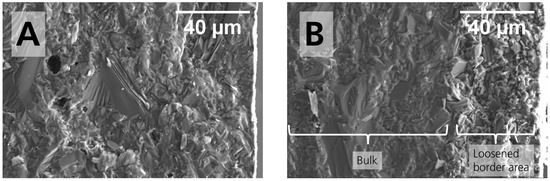
Figure 3.
Cross-section’s SEM images with enhanced magnification close to the right edge for the (A) pristine sample and (B) sample stored for 28 days in 44% r.h. The white rectangle shows one of the right side’s three EDX analysis areas.
While polishing samples for conductivity measurements, we noticed a change in the electrolyte’s surface that confirms the “loosening effect”: When we polished the specimens, abrasion was negligible for the disks stored in 0% r.h. and 96% r.h. In contrast, polishing created much more abrasion for the 44% r.h.-stored disks (Figure S2). We assume that the storage in 44% r.h. is causative for the observed microstructural change, i.e., loosening. A loosened structure is less rigid, and thus, more abrasion was generated. A possible reaction mechanism will be discussed thoroughly in Section 3.3. The loosened layer’s limited thickness might influence the sample’s conductivity. Conduction pathways could be hindered, or additional capacitances could arise. The effect on ionic conductivity is discussed in Section 3.5.
3.2. Chemical Characterization and Additional Observations
We also determined the pristine and 44% r.h.-stored samples’ composition in the bulk as well as in the left and right (loosened) border areas. We chose three rectangles for EDX analysis at different spots along the electrolyte’s bulk, left border area, and right border area. No difference between those areas was observed for the pristine sample. The bulk stoichiometry of the 44% r.h.-stored sample normalized to oxygen, quantified via EDX, is Na1.90±0.11Al10.70±0.06O17±0.15. The bulk stoichiometry is identical to the stoichiometry we aimed at for synthesis (see Section 2.1). The stoichiometry in the loosened border areas normalized to oxygen shows a lower sodium content with Na1.73±0.03Al10.76±0.02O17±0.01 in the left border area and Na1.74±0.02Al10.75±0.02O17±0.02 in the right border area of the specimen’s fracture surface (Figure 3B). Hence, humidity affects the composition of high-density, polycrystalline Li-stabilized sodium-beta alumina. The finding is congruent with results from Heavens [23]. In contrast to Heaven’s study, we determined the actual composition by EDX. The sodium content is significantly lower in the border area compared to the bulk for the 44% r.h.-stored sample, while the aluminum and oxygen content is unchanged. We measured the content at three different areas for each border area. Thus, we excluded a coincidence. The high sintering temperature is not responsible for the decrease in sodium content in the border area, as it was not observed for the pristine sample. The decreased sodium content in the border area hints that samples stored in 44% r.h. undergo an ion exchange, which was first proposed by Will [21]. After initial water adsorption, oxonium ions may slowly diffuse into the conduction slabs. The oxonium ions then replace Na+ ions [21,23]. Hence, the amount of sodium ions in the border area decreases.
To our interest, the disks stored in 44% r.h. were stained. The staining increased with time, for the first time observable by plain eyesight after circa 14 days. It was more distinct after drying than before drying. The staining/coloration darkened the matrix and resulted in a greyish-colored disk (Figure 4A). It can be seen best when light is transmitted through the specimen. In comparison, the pristine specimen was white, and the specimens stored in the glovebox remained white. The specimens stored in 96% r.h. also remained white, even though they were dripping wet (Figure 4C). Literature [25,30] reported a coloration for specimens in contact with sodium. We want to point out that the mechanism in our work is different because the disk’s darkening occurred already during storage in the absence of sodium. We assume that the coloration is due to a superficially occurring buildup of reaction products, as we will clarify in Section 3.3. Figure 4B shows that the buildup is removable by polishing, suggesting that the layers are limited to the surface.
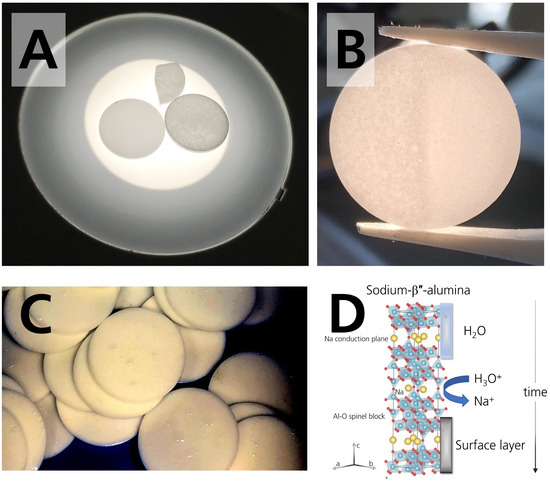
Figure 4.
(A) Photograph of two disks and a disk fragment. The left disk was stored in the glovebox. It shows no stains or coloration. The disk on the right side is darkened after 28 days of storage in 44% r.h. The fragment is also darkened and belongs to a disk stored in 44% r.h. for 28 days. (B) Photograph of the colored specimen. Coloration can be removed by polishing, which was done on the right part of the specimen stored in 44% r.h. for 28 days. (C) Photograph of the droplets condensing on the surface of the specimens stored in the desiccator with 96% r.h. The photograph was taken 21 days after initial storage. The photograph was adjusted for the brightness to visualize the droplets. (D) Scheme of sodium-β″-alumina’s crystal structure and the occurring degradation mechanism when stored in a humid atmosphere. Adapted from [18], Copyright (2017), with permission from Elsevier.
3.3. XRD Analysis
Diffraction patterns were recorded to verify the phase composition of the disks. The diffraction patterns are corrected for the Kα radiation. Figure 5 shows the diffractogram of the pristine sample and the samples stored for 28 days in 44% r.h. (44%, 28 d) and 96% r.h. (96%, 28 d). All diffractograms are shown enlarged in Figure S3. The freshly prepared, pristine disk’s diffraction pattern is in good agreement with the reflections of Li-stabilized sodium-β″-alumina (Na1.72Al10.66Li0.30O17, pdf 01-084-0210). Slight shifts are observed because we aimed for higher sodium content in our samples. We determined a phase content of 94.7% and 4.8% for the pristine sample with Rietveld refinement for sodium-β″-alumina and NaAlO2, respectively. The minor reflections at 30.3° and 33.6°, highlighted with asterisks, can be ascribed to NaAlO2 (pdf 83-0316) impurities. A high phase content of Na-β″-alumina is desirable for usage in cell systems because it exhibits a higher fraction of sodium ions in its conduction planes than Na-β-alumina. Simultaneously, the sodium-β″-alumina phase is particularly prone to water uptake [17]. The pristine sample contained only negligible quantities of the sodium-β-phase.
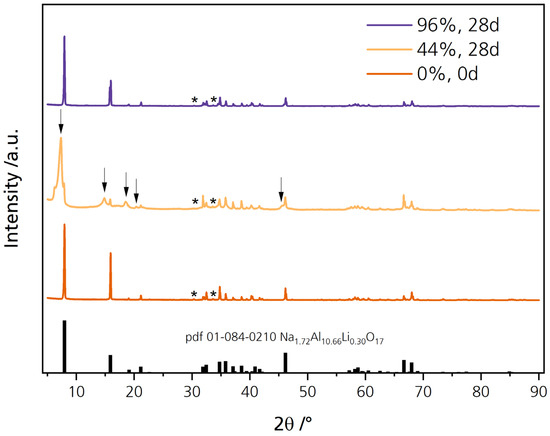
Figure 5.
Diffraction patterns of the pristine disk and the disks stored for 28 days in 44% r.h. and 96% r.h. The reflections, highlighted with asterisks, can be related to NaAlO2.
The diffraction pattern of the sample stored in 44% r.h. for 28 days also agrees with reflections reported in the literature. However, some reflections are shifted and broadened, while others cannot be related to Na1.72Al10.66Li0.30O17 (pdf 01-084-0210). They are highlighted with an arrow in Figure 5. The characteristic reflection at 7.9° is shifted to 7.3° while a broadening is visible. At 14.8°, 18.6°, and 20.4°, new reflections are visible, while a significant shoulder is observable at 45.6°. We related the reflections of NaOH∙H2O (pdf 00-030-1194), Na2CO3∙H2O (pdf 08-0448), and Al(OH)3 (pdf 00-018-005) qualitatively to our diffraction pattern (compare Figure S4). The surface products probably added up to the loosened microstructure and were responsible for the additional abrasion (Figure S2). The shifting and broadening of the characteristic reflection from 7.9° to 7.3° indicates a c0 lattice parameter elongation, as elaborated by Bay et al. [31]. The elongation equals a decrease in sodium content. This result is congruent with the lower sodium content determined by EDX. It is also in line with other findings [22,23,24] observing a c0 elongation, i.e., ion exchange between Na+ and H3O+. The reaction pathway of sodium-beta alumina stored in a humid atmosphere can be explained similarly to the effect of air exposure on Li-ion-conducting oxide ceramic’s (Li7La3Zr2O12, LLZO) surface chemistry and its rise in interfacial resistance [32]. After water adsorption and oxonium ion migration into the conduction slabs, where they replace sodium ions, Na+ diffuses to the surface. There it reacts with the adsorbed water and forms hydrated sodium hydroxide (rxn. 1) [19,33] (Figure 4D). This theory is congruent with the slightly altered chemical composition we measured via EDX (see Section 3.1). As atmospheric carbon dioxide is present, Na2CO3 is a plausible reaction product (rxn. 2).
Simultaneously, impurities of NaAlO2 may react with Al(OH)3 and NaOH in the presence of water vapor [22]. The phase content of NaAlO2 was determined to be around 5%. A decrease could be responsible for a loosened microstructure. ATR-IR confirms the XRD results for the carbonates at 1450 cm−1 for the 44% r.h.-stored sample (Figure S5), literature reports similar products [19,22,23], and the buildup mechanism is plausible. Bay et al. [34] recently confirmed the buildup of hydroxides and carbonates on sodium-beta alumina with XPS analysis. We assume that the surface products also darkened the specimens, which is observable by plain eyesight (Figure 4A). However, in SEM images of the fractured disks, no surface layers were observable when investigating the fracture surface. We assume that the observation is not possible with our magnifications because the formed layer’s thickness is limited. The XRD results underline the theory that sodium-beta alumina reacts under certain conditions with adsorbed moisture and carbon dioxide to form surface contaminations such as NaOH∙H2O and Na2CO3∙H2O (Figure 4D). Preliminarily, oxonium ions must replace Na+ leading to a depletion of Na+ in the border areas, which was observed via EDX.
No change in the diffraction pattern and no surface products are observable for the 96% r.h.-stored sample. As discussed in the following sections, other effects also did not apply to the disks stored in 96% r.h., but only to those stored in 44% r.h. The mechanism is likely dependent upon the level of water vapor present. The attacking species in moderate humidity might differ from an ultra-moist atmosphere [20]. We further assume that surface products, when developed at all, were dissolved directly due to the disks´ ultra-moist surfaces (Figure 4C). Thus, no change in diffractogram was observed for the 96% r.h.-stored sample. The unchanged diffraction pattern is in line with the observation that these specimens were not darkened.
3.4. Fracture Strength Analysis
We performed fracture strength analysis on pristine specimens and specimens after 28 days of storage to investigate Li-stabilized BASE’s vulnerability to humidity regarding mechanical stability. Mechanical stability is vital because all-solid-state cell concepts require high pressure for good performance [35]. The resiliency to the resulting stress acting on the electrolyte is also critical in planar Na–NiCl2 cell designs [36,37]. Last, high mechanical stability helps reduce the solid electrolyte’s thickness, reducing the cell’s resistance and overvoltage.
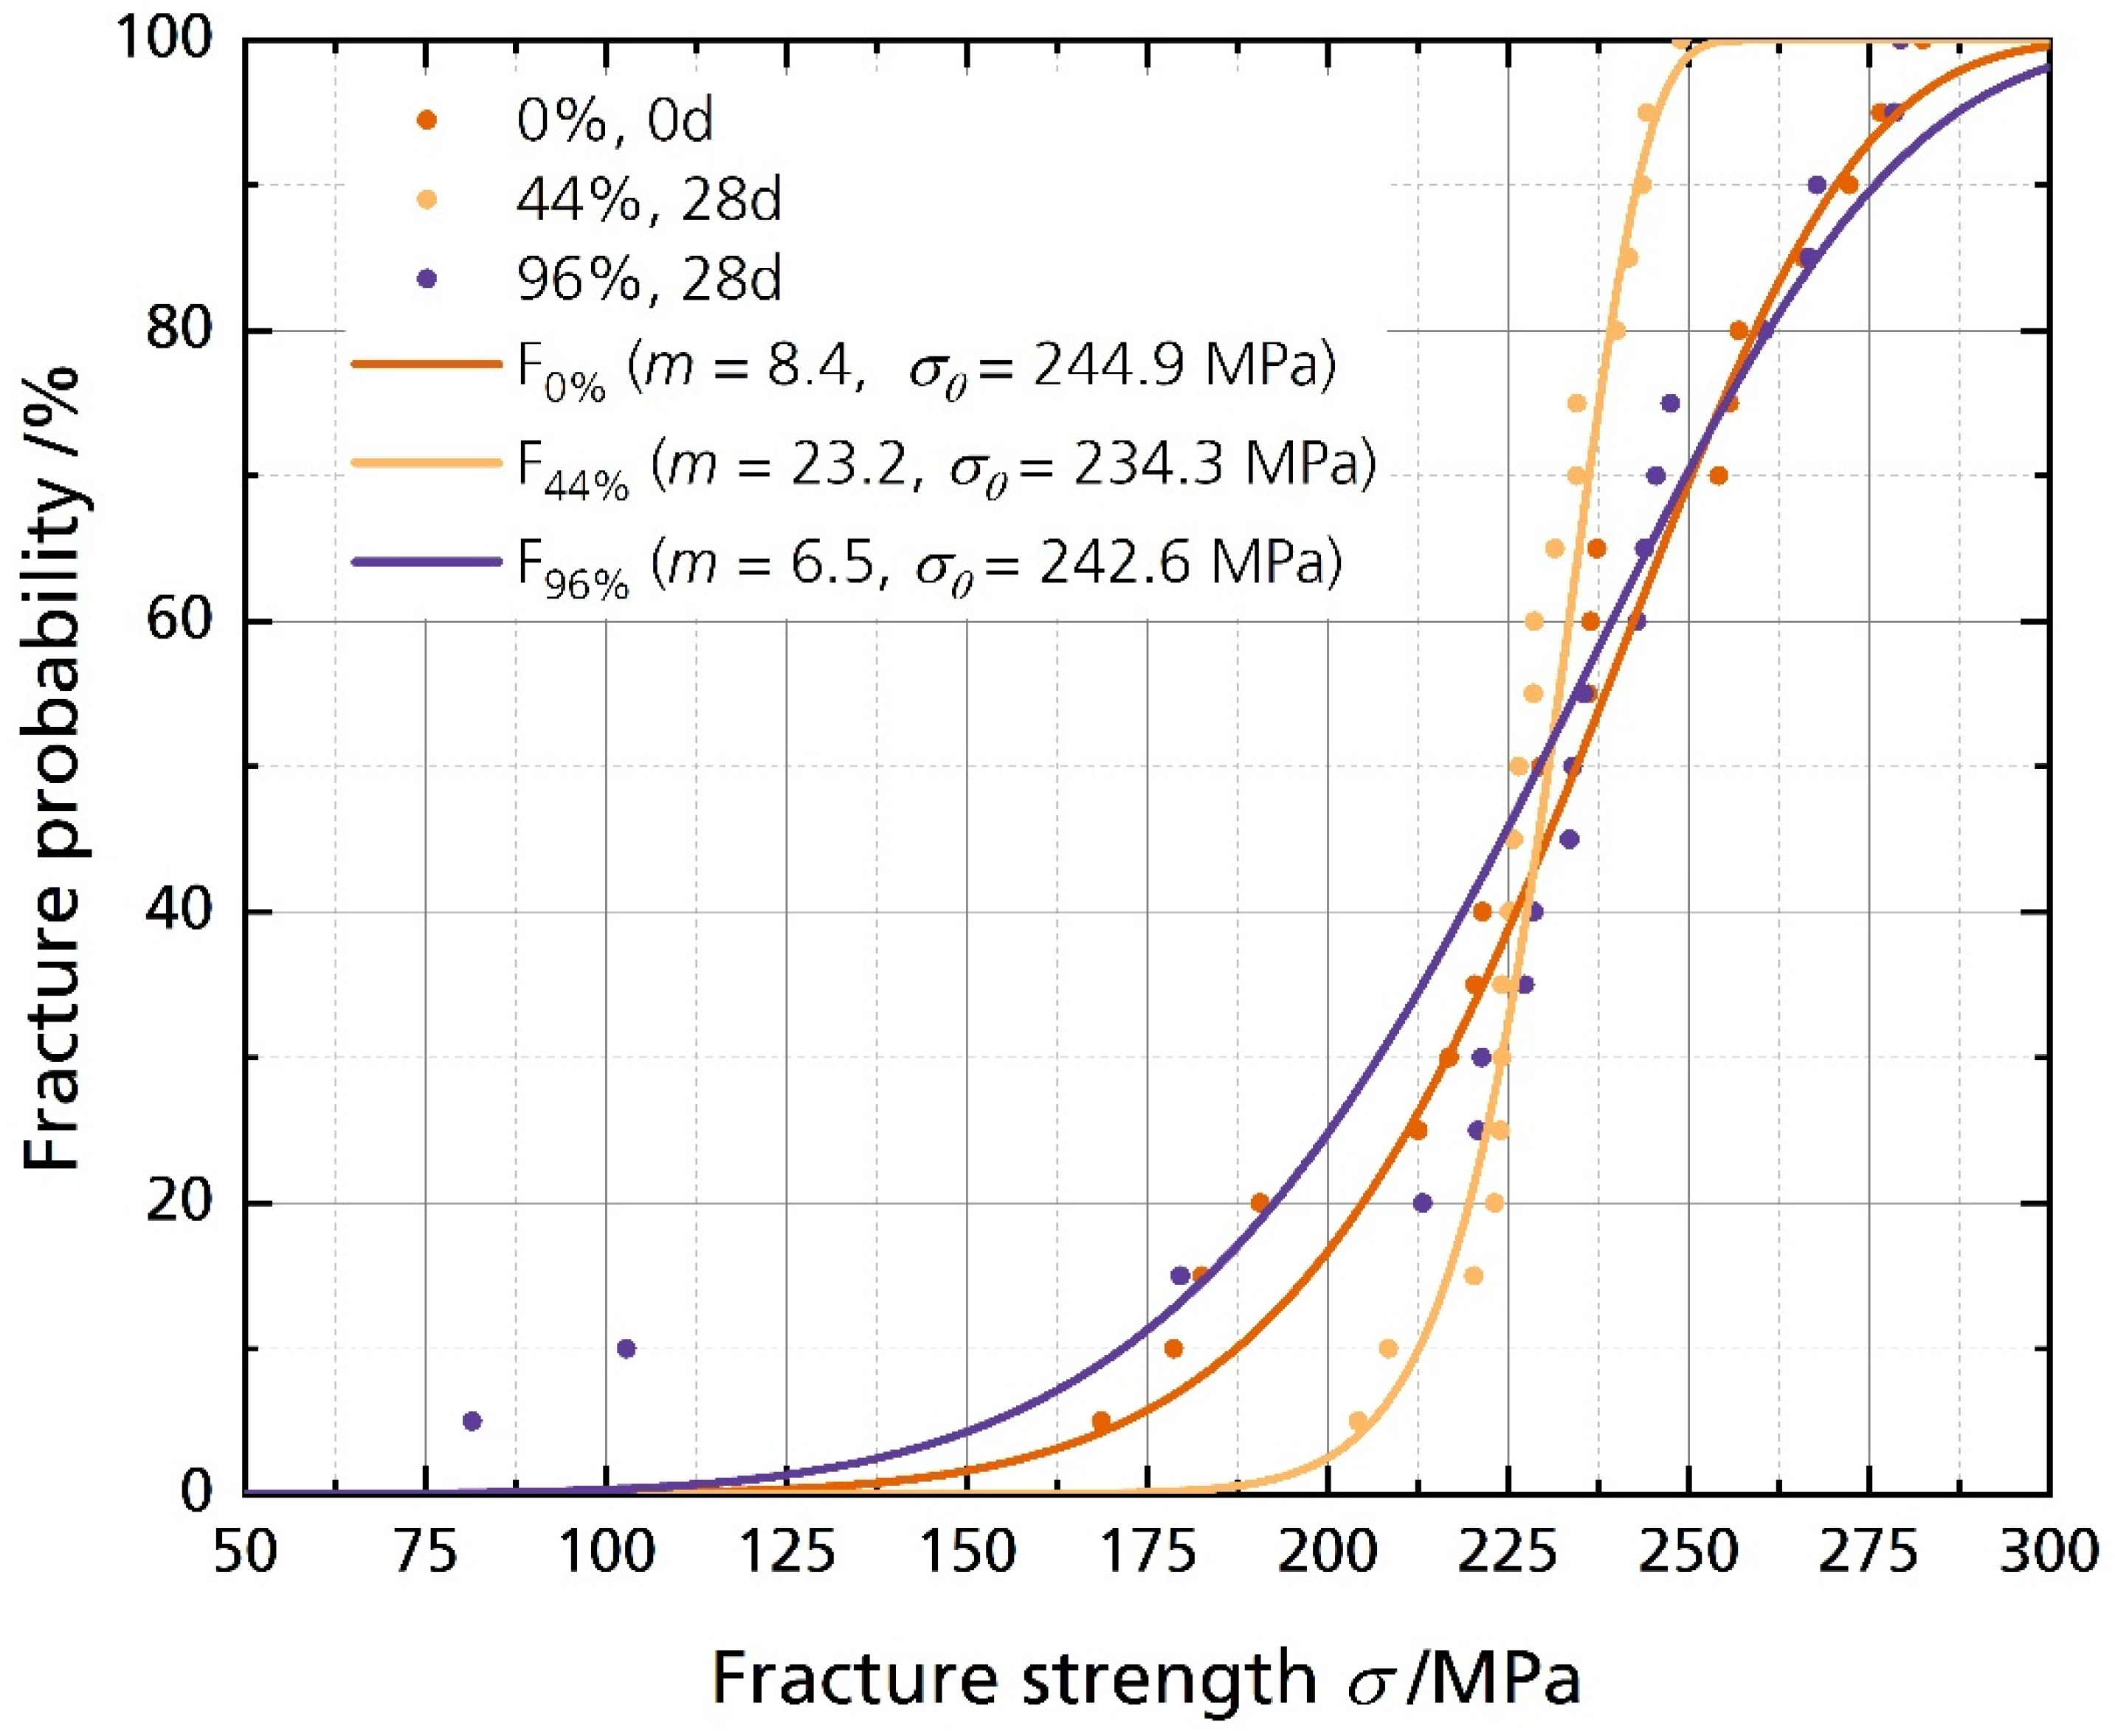
Figure 6 shows the disks’ fracture strength with the corresponding calculated cumulative distributions. The data is summarized in Table 2. The characteristic strength σ0 for a fracture probability of 63.2% is calculated as 244.9 MPa, 234.3 MPa, and 242.6 MPa for the pristine sample and the samples stored in 44% r.h. and 96% r.h. for 28 days, respectively. The fracture strength σ0.001 for a fracture probability of 0.1% is 84.4 MPa, the lowest for the sample stored in 96% r.h. for 28 days. The highest value for σ0.001 corresponds to the 44% r.h.-stored sample with 174.0 MPa. The Weibull modulus m of the sample stored in 44% r.h. is 23.2, considerably higher than the moduli of the other two samples. However, the average fracture strength shows no significant difference between the pristine and the stored samples. The unchanged mechanical strength contradicts the findings from Armstrong and Sellick, where the Li-stabilized electrolyte (85% sodium-β″-alumina) “crumbled readily into a powder when rubbed” [20]. However, our sample has a much higher sodium-β″-alumina phase content. It was reported that single-phase sodium-beta alumina is more stable than multiphase sodium-beta alumina [22]. The characteristic strengths σ0 and the average fracture strength σavg show no significant differences between the samples stored in different humidities. We neither observed a decline in characteristic strength σ0 after storing the sample in 44% r.h. nor for the sample stored in 96% r.h. However, σ0.001 is remarkably lower for the 96% r.h.-stored sample, indicating a lower fracture strength for a fracture probability of 0.1%. The characteristic strengths of 250 MPa are common for Li-stabilized beta aluminas, dependent on the fracturing method. We reported the characteristic strength of differently fabricated BASEs recently [6].

Figure 6.
Weibull plot of the fracture strength analysis with their corresponding cumulative distribution functions (cdf), calculated with F(σ, m, σ0) = 1 − exp(−σ/σ0)m).
Table 2.
Characteristic strengths σ0 and σ0.001, Weibull moduli m, average fracture strengths σavg and the fracture strengths’ corresponding standard deviation σσ of the pristine sample and the samples stored for 28 days in 44% r.h. and 96% r.h.
Therefore, we must reject the simple statement that Li-stabilized BASEs stored in humid environments fail only because of mechanical deterioration. As discussed above, the storage in a humid environment had no significant effect on the average and characteristic fracture strength. Storage also did not lead to more and more inhomogeneous defects in the 44% r.h.-stored sample, while the effect on Weibull modulus of the electrolytes stored in 96% r.h. was little. The results for the samples stored in 44% r.h. and 96% r.h. are surprising, as we expected to weaken the solid electrolyte. Even samples stored in an ultra-humid atmosphere of 96% r.h., coated with water drops during storage (Figure 4C), showed no significant mechanical deterioration after 28 days. However, the failure probability might be higher. Lastly, we have to note that we observed cracking of the specimens stored in 96% r.h. after the sixth month. The cracking leaves no doubt that water affects BASEs massively after an extended time (Figure S6).
3.5. Conductivity Analysis
3.5.1. Ionic Conductivity
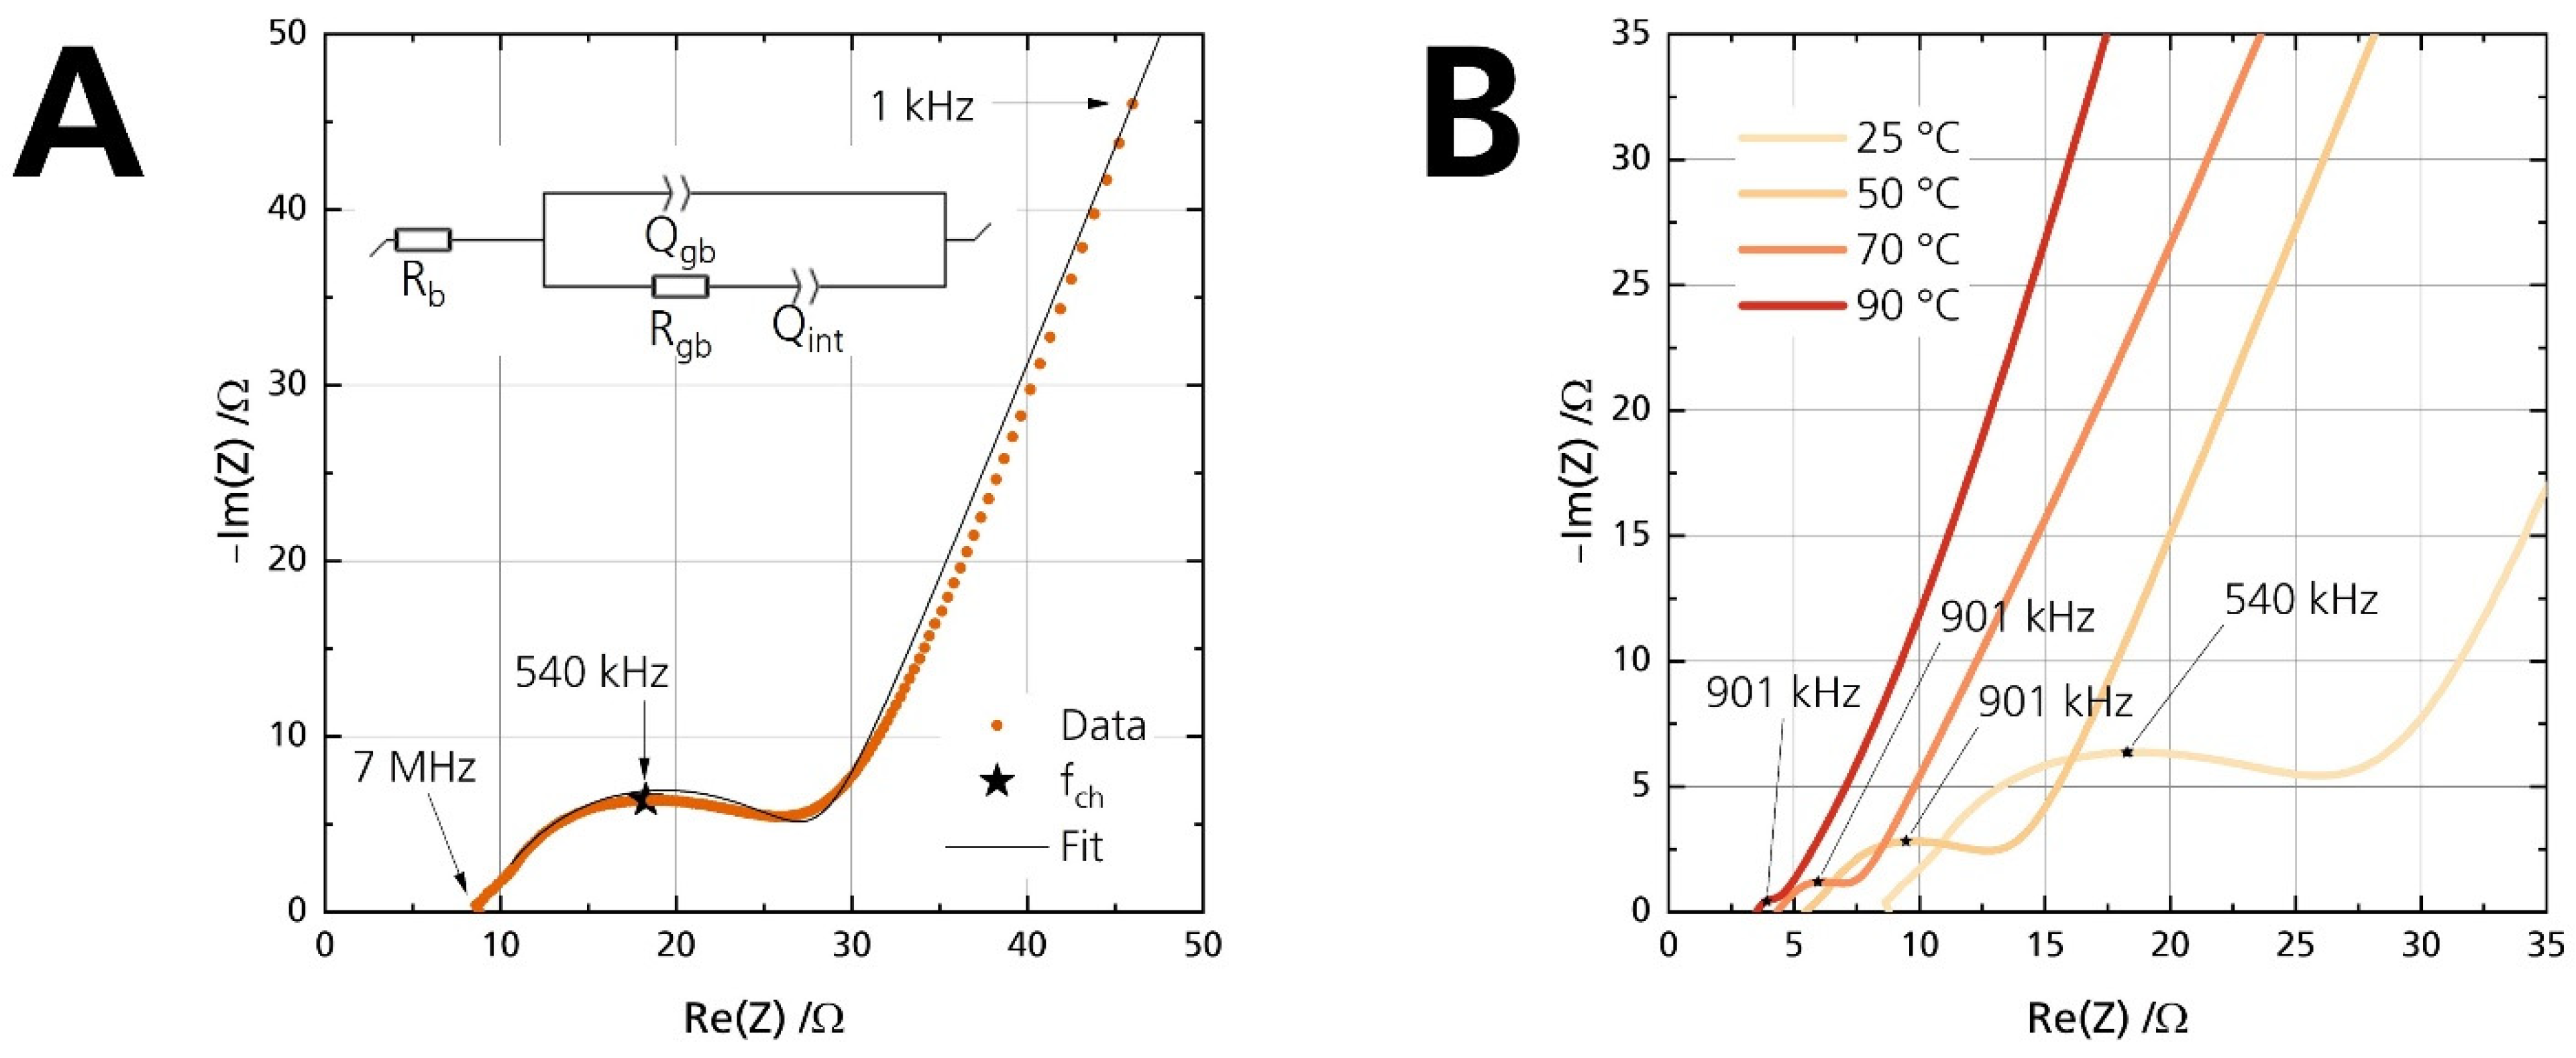
The disks’ ionic conductivity σionic is determined by fitting Nyquist plots of the electrochemical impedance spectra (EIS) with an equivalent circuit, following the method proposed by Huggins [38]. A representative Nyquist plot with its corresponding equivalent circuit used for evaluation is shown exemplarily in Figure 7A. R and Q indicate the resistance and constant phase element, respectively. Fitting was performed on the plot, starting from the first point above the real part of the Nyquist plot. As sodium-beta alumina is a well-known ion conductor and electronic insulator [2], we assume that the electronic conductivity is negligible for analysis of the Nyquist plot. This assumption can be made because the Nyquist plots show a dominant low-frequency tail (cf. Figure 7). Otherwise, the interfacial capacitance Qint would have been shorted out from the additional electronic contribution, and no low-frequency tail would have been observable.
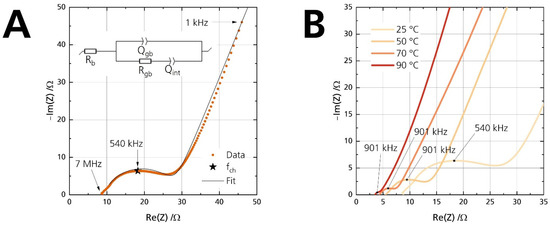
Figure 7.
(A) Nyquist plot of the pristine disk at 25 °C, shown from 7 MHz to 1 kHz. The arrows indicate the measurement frequency. The inset shows the equivalent circuit used for fitting. (B) Nyquist plots of the pristine disk for four different temperatures. The apex frequency is labeled to the data points.
Rb and Rgb are the bulk and grain-boundary resistance, respectively. The equivalent circuit gives the bulk resistance Rb from the (high-frequency) starting point on the left of the semicircle. A second semicircle could have been observable for electrolytes with high bulk resistance or measurements at low temperatures. It would originate from a parallel arrangement of the bulk resistance Rb and its corresponding capacitance. However, no semicircle is observable in this work because the conductivities were measured above 25 °C. The time constant of the bulk process is too small to be in the measuring range of the used potentiostats. Hence, we did not incorporate another capacitance for the bulk process. The visible semicircle represents the parallel combination of the grain boundary resistance Rgb and its respective non-ideal grain boundary capacitance Qgb. The low-frequency tail is observed due to the interfacial capacitance Qint. Ionic species are blocked at the two sodium-beta alumina/gold interfaces. The capacitive properties of the two non-ideal interfaces are combined into a single constant phase element Qint. Despite polishing, surface roughness was not obliterated. Therefore, the capacitance line arising from Qint is not strictly vertical [39]. The Qgb and Qint values underline the validity of the equivalent circuit. Table 3 shows exemplarily that they are congruent with the characteristic capacitance [40] from the contribution of the grain boundary (visible high-frequency semicircle) and the interface between the ceramic electrolyte and the applied gold electrodes (low-frequency line).
Table 3.
Key parameters derived from the equivalent circuit shown in Figure 7 and capacitance values corresponding to grain boundaries and interfaces given by Irvine et al.
Figure 7B shows that BASE’s ionic conductivity correlates positively with the temperature, i.e., Rb and Rgb decrease. The extrapolated intercept of the fit with the real part of the Nyquist plot corresponds to the total ionic resistance Rionic (Rb + Rgb). The total resistance Rionic as the sum of the bulk resistance Rb and grain boundary resistance Rgb is used to calculate the ionic conductivity σionic of the samples according to the thickness t and area A of the disk with the help of Equation (1):
Resistance contributions from the cell housing and wiring are negligible for analysis in this case. We calculated the activation energy from the Arrhenius-type equation, derived from the Nernst-Einstein equation, shown in Equation (2).
where T denotes the temperature in Kelvin, σ0 is the pre-exponential factor, EA is the activation energy, and kB denotes the Boltzmann constant.
Figure 8 shows the Arrhenius plot of the pristine disk and the disks stored in 44% r.h. and 96% r.h. for 21 days. Figure S7 shows the corresponding ionic conductivity instead of ln(σT). The disks were polished after storage directly before the experiment. The pristine sample exhibits an activation energy of 0.25 eV, while the activation energy is 0.29 eV for the sample stored in 44% r.h. and 96% r.h for 21 days. However, both activation energies are very similar to other reported activation energies, which we summed up elsewhere [6]. The samples´ ionic conductivity correlates strongly with the temperature, as is expected. The pristine sample’s ionic conductivity increases from 1.3 mS cm−1 at 25 °C to 8.7 mS cm−1 at 100 °C. As the standard deviation indicates, we found no significant differences in ionic conductivity between the pristine samples and those stored in 44% r.h. and 96% r.h. for any point in time when they were polished with corundum sandpaper before measurement (Figure S8). The independency of relative humidity and storage time from ionic conductivity on freshly polished samples supports reports which describe only superficial product buildup [23] or slow diffusion of oxonium ions [24] into the conduction plane, leading to a resistance increase constrained to the surface region [17]. Possible surface contamination was removed due to the polishing with abrasive paper immediately before measurement. The removal also applies to layers altered by ion exchange.
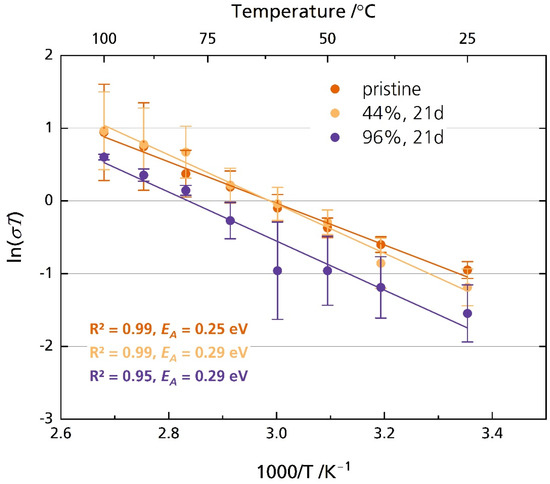
Figure 8.
Arrhenius plot of the pristine disks and disks stored in 44% r.h. and 96% r.h. The disks were polished with corundum sandpaper after storage and before measurement. The error bars represent the standard deviations.
After that, we investigated samples polished after fabrication and afterward stored in atmospheres with different relative humidities of 44% and 96%. This time, no additional polishing was performed before measurement. For the samples stored in 96% r.h., no distinct semicircle was observed. The semicircle was absent in the Nyquist plot of the sample stored for a relatively short time (7 days) and the samples stored for 14 days, 21 days, and 28 days (Figure S9). The absence is probably because of the incomplete removal of adsorbed moisture visible on the sample’s surface (Figure 4C). We were aware of reports that high-temperature treatment can reverse humidity-induced degradation effects [17,21,23,24] and even surface contamination [34]. Because we wanted to observe whether humidity alters the samples, we chose a relatively mild temperature treatment of 150 °C to remove only superficially adsorbed moisture. The chosen temperature protocol might be inadequate for providing a dry enough surface to obtain perfect interfacial contact between the sample and the sputtered gold electrodes. Because no other changes were observed, e.g., visible color changes or changes in the diffractogram, we ascribe the absence of a distinct semicircle solely to the adsorbed moisture and the resulting insufficient contact between the electrolyte and gold electrodes. Therefore, we could not retrieve reliable data to quantify the possible effects on BASE’s ionic conductivity when stored in super- moist 96% r.h.
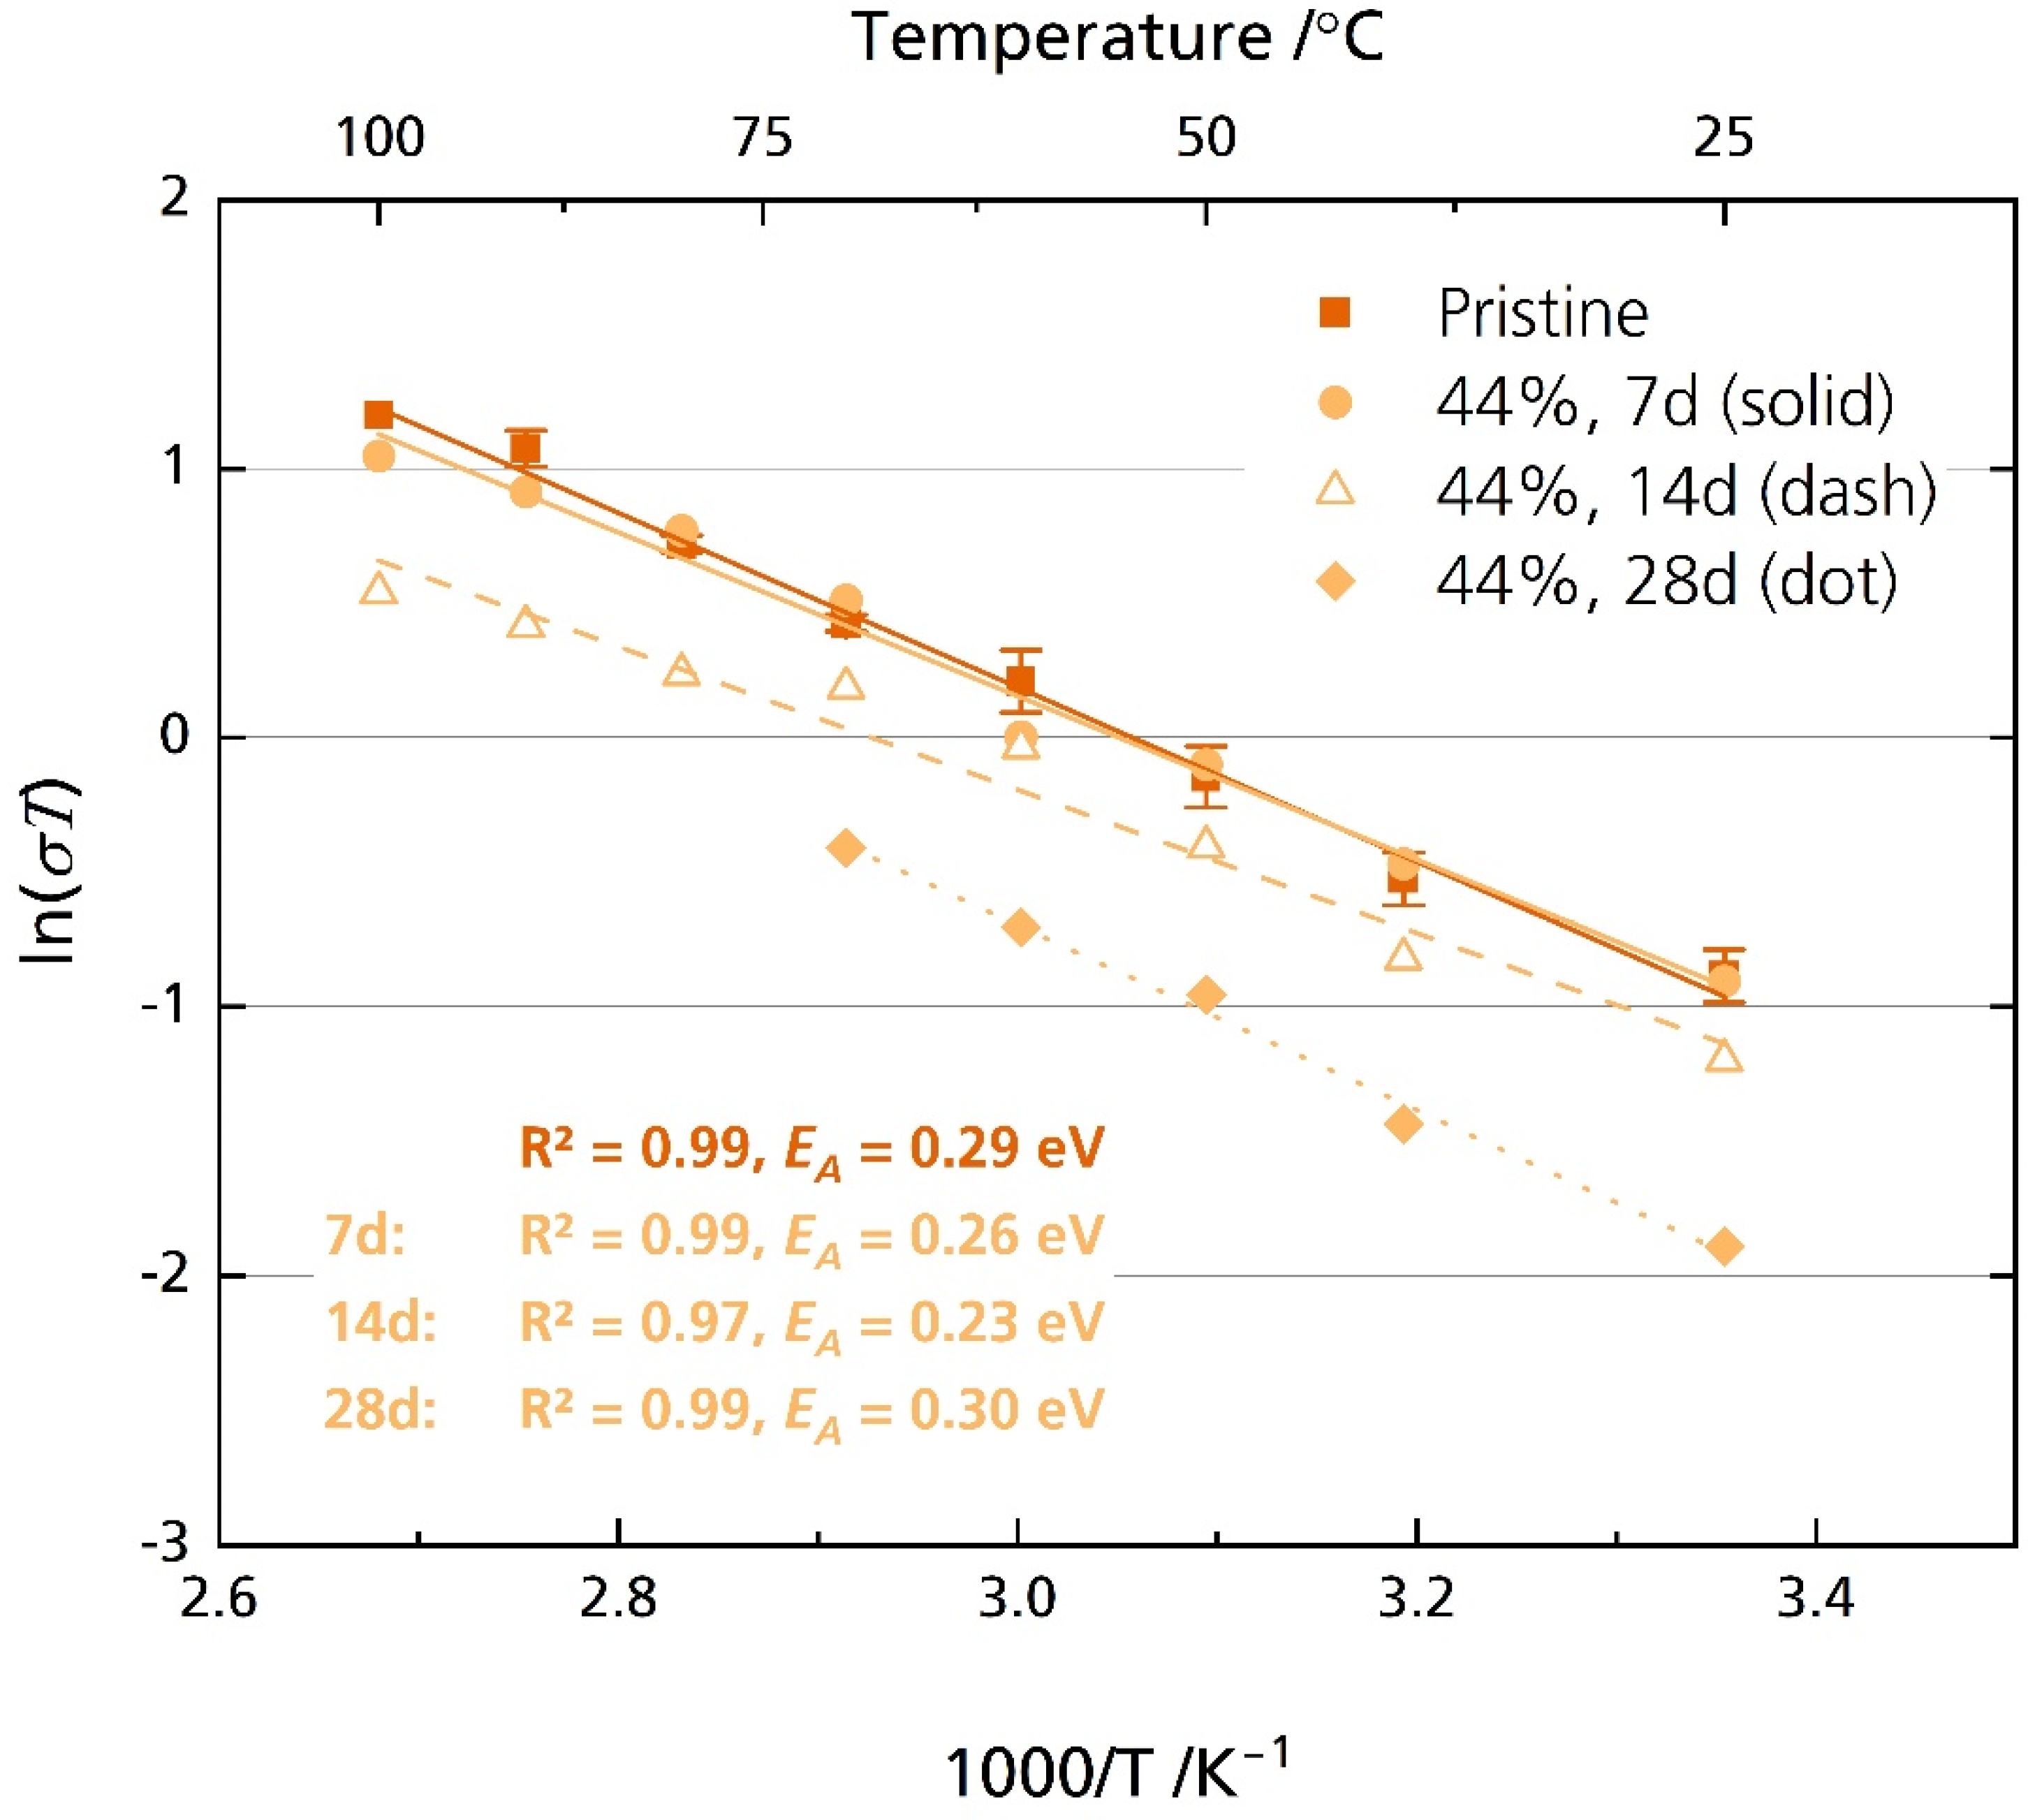
On the contrary, the semicircle of the 44% r.h.-stored samples was well resolved, beside the sample stored for 28 days in the temperature range of 80 °C to 100 °C. First, analysis in the high-frequency range from 7 MHz to 10 kHz was performed. The activation energies are between 0.23 eV for the sample stored for 14 days and 0.30 eV for the sample stored for 28 days. The pristine sample exhibits an activation energy of 0.28 eV. These values are reasonable and were reported for multiple other sodium-beta aluminas [6]. While we observed no degradation after seven days of storage, longer storage time decreased the disks’ ionic conductivity. For example, while pristine disks’ average ionic conductivity σionic is 1.6 mS cm−1 at 25 °C, it is only 0.5 mS cm−1 after storing the sample for 28 days in 44% r.h. (Figure 9 and Figure S10). At 80 °C, a typical operational temperature for medium-temperature cell systems utilizing BASEs [6], we calculated an average ionic conductivity of 6.4 mS cm−1 for the pristine sample. The results align with other literature reports for Li-doped [20] and Mg-doped [21] sodium-beta aluminas. Notably, Armstrong and Sellick [20] reported a decrease in ionic conductivity only for the sample stored in laboratory air. They also observed no detrimental effect for samples stored in 100% r.h. These observations resemble our XRD, microstructural, and fracture strength tests. A possible explanation was given: the attacking species depends upon the amount of water vapor present after initial adsorption. For lower relative humidity, oxonium ions might be the attacking species. For high relative humidity, water might be the attacking species.
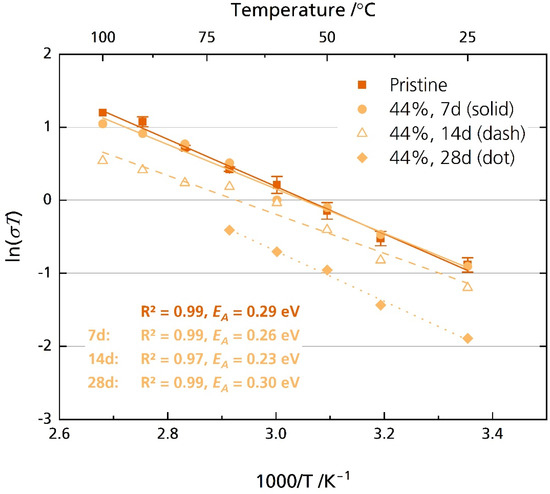
Figure 9.
Arrhenius plot of the pristine disks and the disks stored for 7, 14 and 28 days in 44% r.h. The disks were polished with corundum sandpaper before storage but not before measurement. The error bars represent standard deviations.
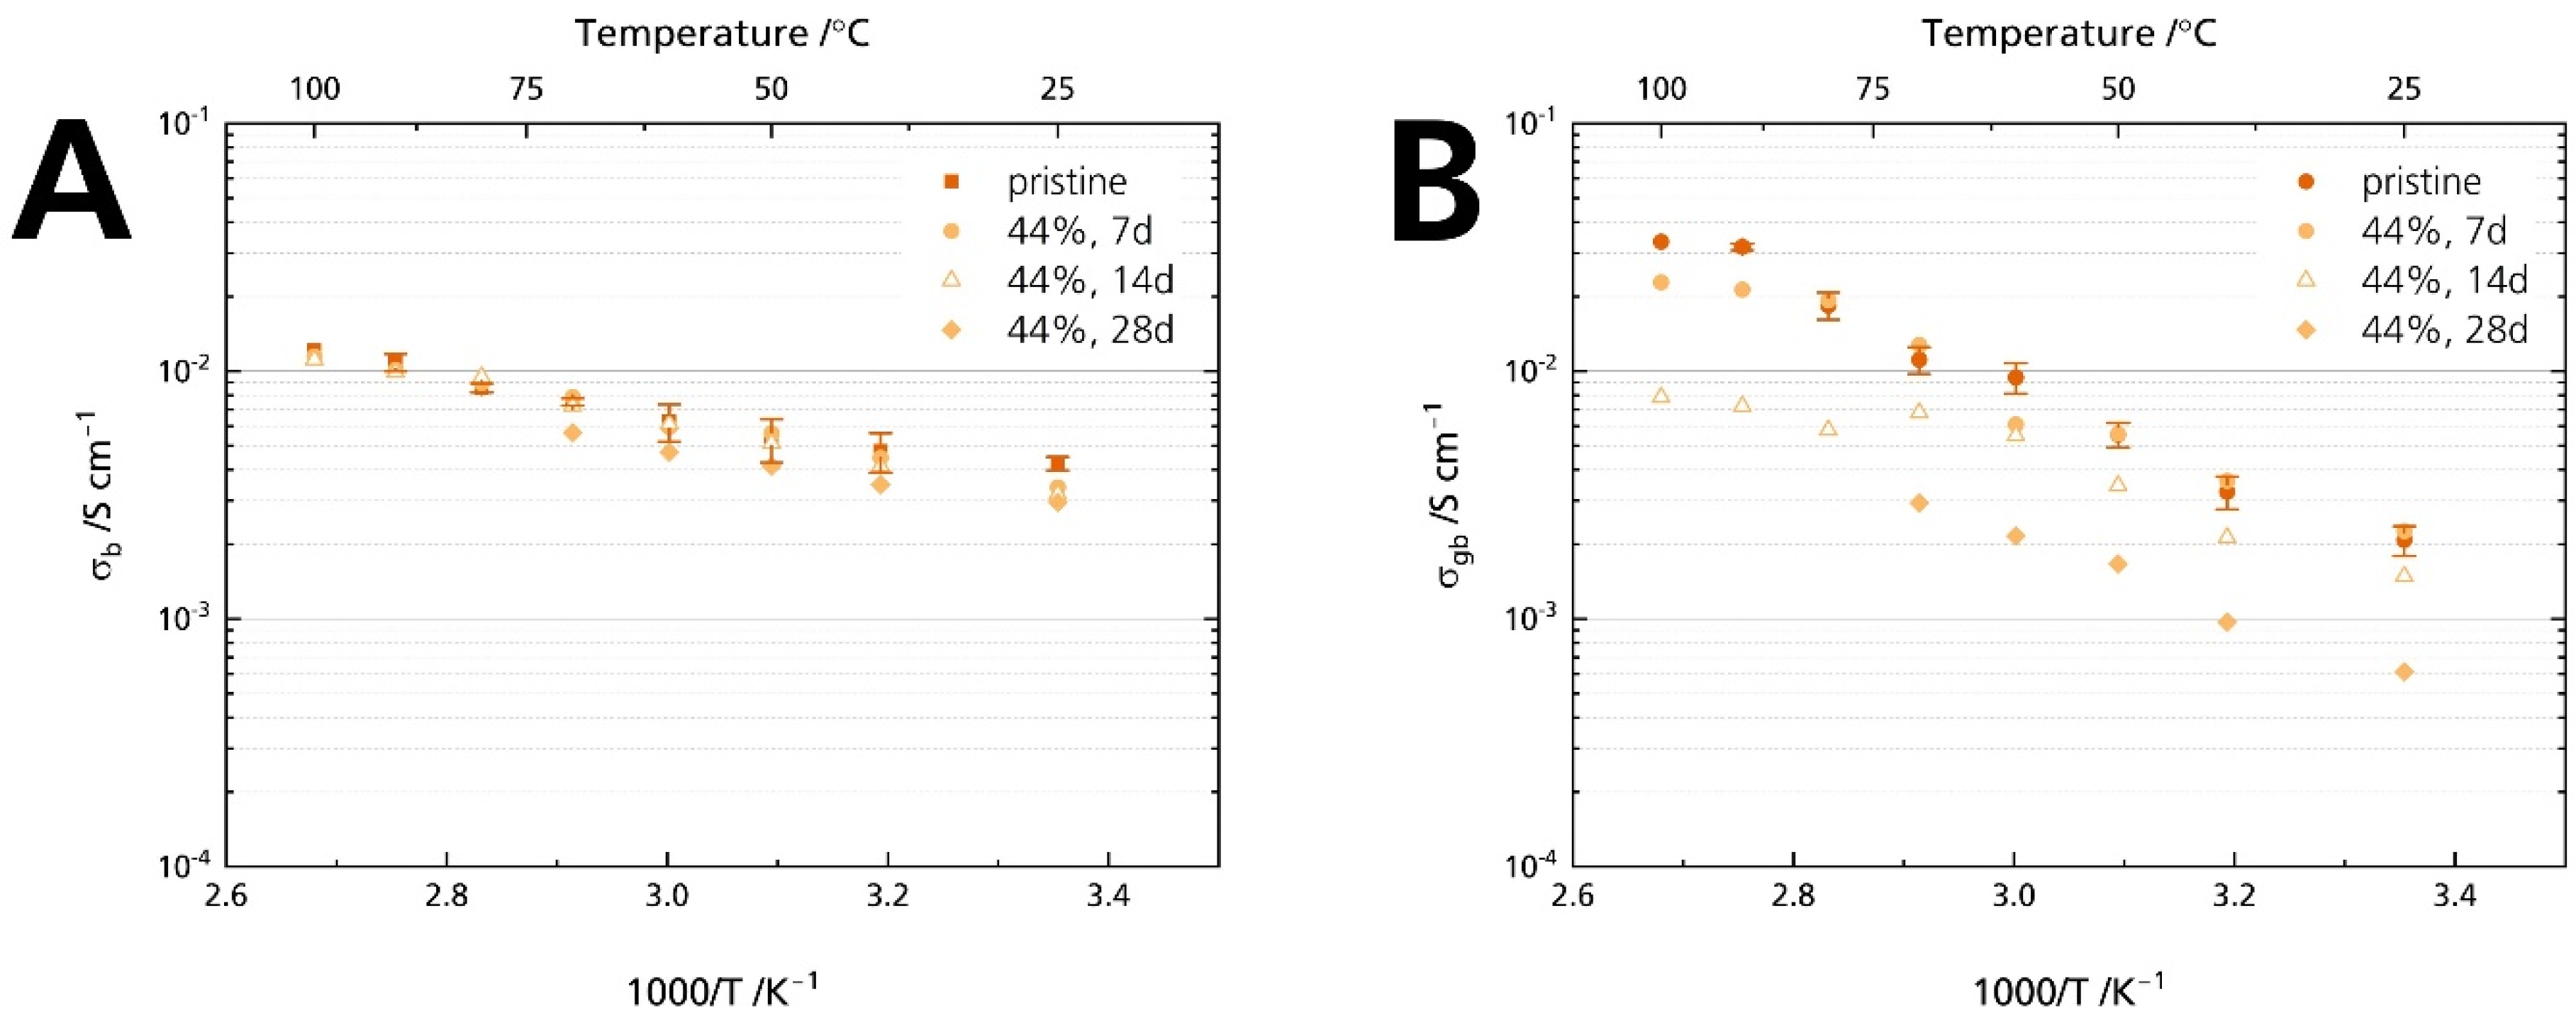
Figure 10 proves that grain boundaries govern Li-stabilized BASE’s resistance increase: While the bulk resistance is similar for all samples (Figure 10A), we calculated an increase in grain boundary resistance (Figure 10B). Will [21] reported an increase in grain boundary resistance for Mg-stabilized sodium-beta alumina. This comparison hints that neither Li+ nor Mg2+ stabilization of the sodium-β″-alumina phase suppresses humidity-induced deterioration. The result also is in line with other reports that NaAlO2, determined in the specimens’ diffraction patterns (Figure 5), is prone to react with H2O and CO2 at the grain boundaries [1].
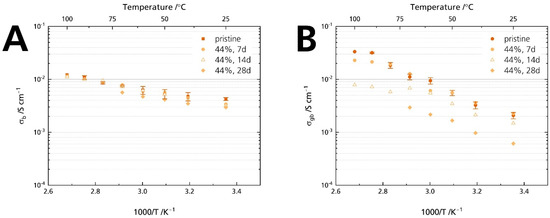
Figure 10.
Development of the conductivities after storage times of 7, 14, and 28 days for the samples stored in 44% r.h.: (A) bulk and (B) grain boundary conductivity. The error bars represent standard deviations.
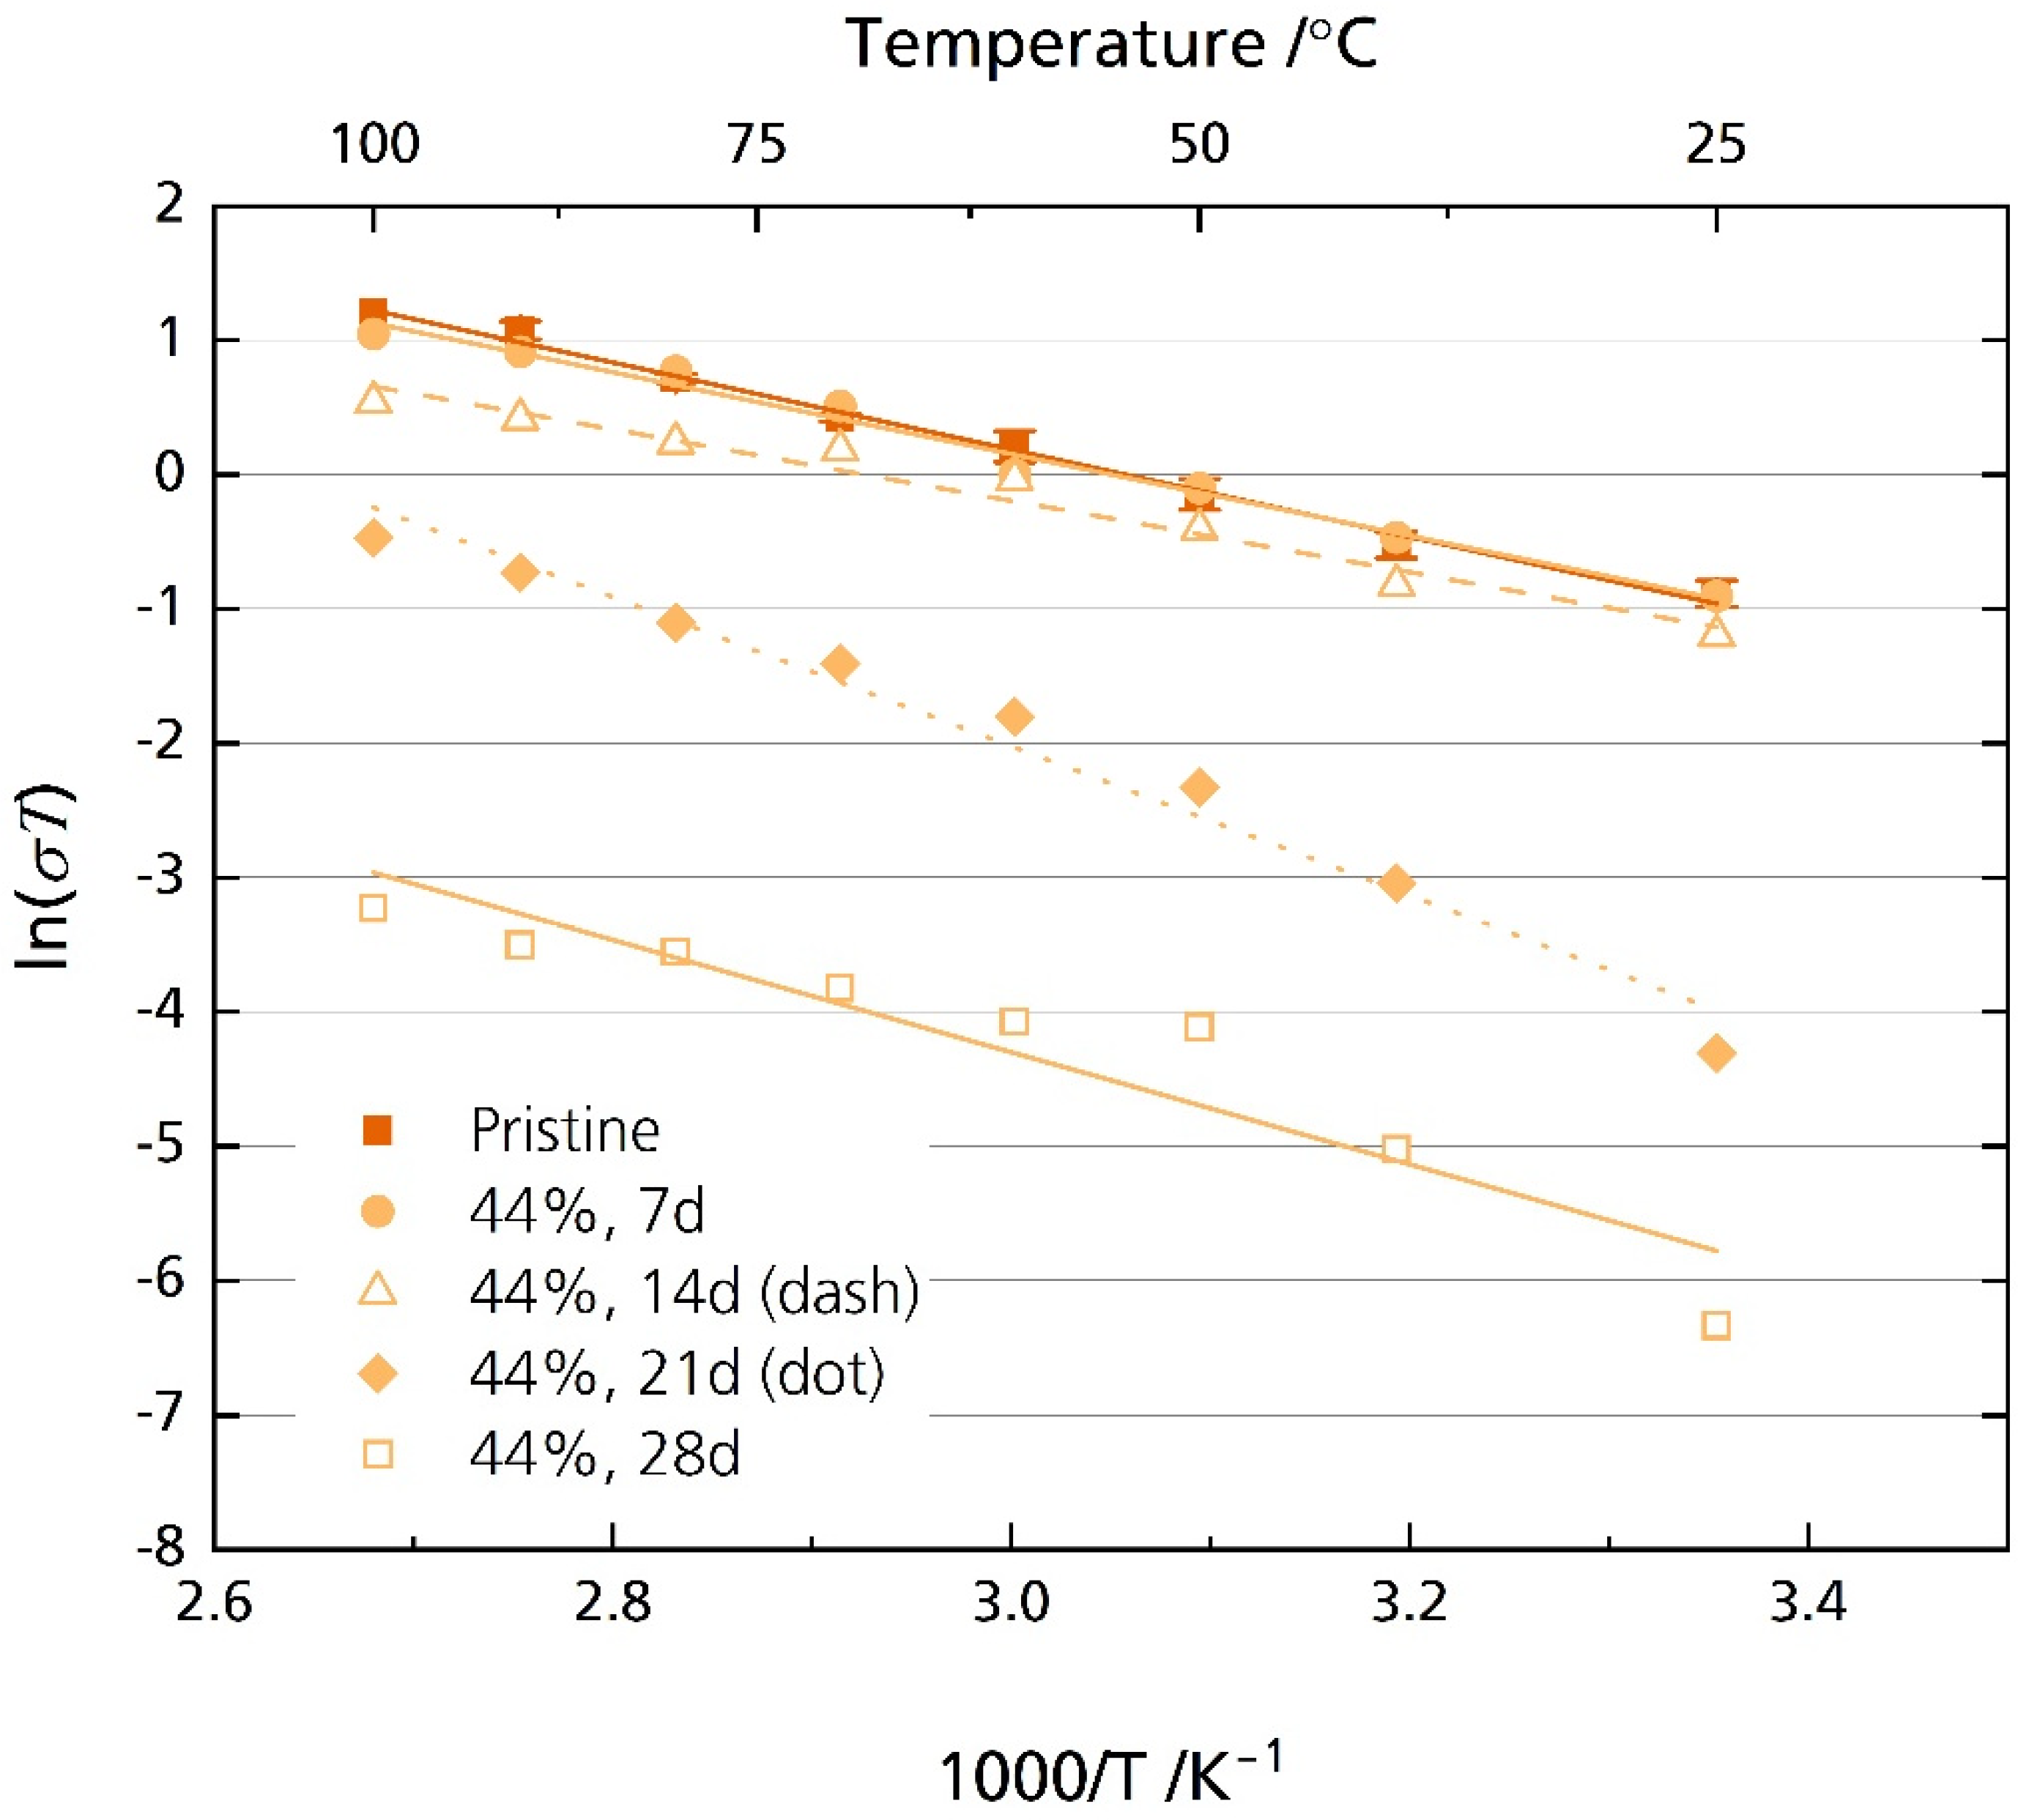
After storage for 21 days, we observed a very distinct bending in the medium- to low-frequency range in the Nyquist spectrum only for the samples stored in 44% r.h. Note that no bending was observed in the Nyquist plot for the samples stored in 96% r.h. (cf. Figure S9) Furthermore, the high-frequency semicircle, related to the grain boundary process, was increasingly difficult to resolve with prolonged storage time for the 44% r.h.-stored samples. This is the reason for the missing values in Figure 9. An R + Q/R + Q equivalent circuit was used to analyze the samples stored in 44% r.h. for 21 and 28 days over the entire frequency range. Here, we omitted Rgb for the resistance corresponding to the dominant semicircle developed after 21 and 28 days due to the above reasons. Figure 11 shows the resulting Arrhenius plot (compare Figure S11 for the corresponding ionic conductivity values). The values of the pristine sample and the samples stored for seven and fourteen days in Figure 11 are identical to those in Figure 9.
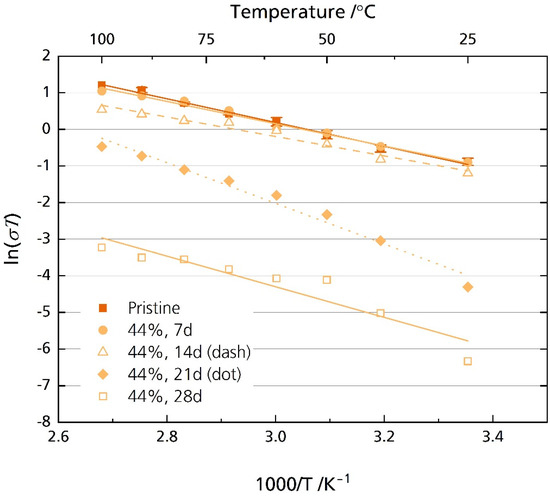
Figure 11.
Arrhenius plot of the pristine sample and the specimens stored in 44% r.h for 7, 14, 21, and 28 days considering the whole frequency range.
Figure 11 shows a substantial decrease in ionic conductivity when storing the specimens in 44% r.h. for more than 14 days. The pristine sample’s ionic conductivity is 1.6 mS cm−1 at room temperature. It decreases to 45 µS cm−1 and 5.9 µS cm−1 for the samples stored for 21 (EA = 0.48 eV, R2 = 0.98) and 28 (EA = 0.36 eV, R2 = 0.88) days, respectively. Even at 100 °C, the ionic conductivity reaches only 1.7 mS cm−1 and 0.1 mS cm−1 for the samples stored for 21 and 28 days, respectively. In comparison, the pristine sample’s ionic conductivity is 8.9 mS cm−1 at 100 °C. Again, this result is congruent with other reports, where a considerable increase in resistance was also observed for Li-stabilized [20] and Mg-stabilized [21] BASEs.
The shape of the Nyquist plot of the pristine sample and the samples stored in 44% r.h. for 21 and 28 days look similar. They can be mistaken for each other (cf. Figure 6A and Figure S9B). Both Nyquist plots form an elongated and depressed semicircle. Both plots show a low-frequency tail. The semicircle corresponds to a parallel RQ-element, as described above. Hence, one could assume that the underlying processes responsible for the evolution of the semicircle are the same. This would indicate that the ionic conductivity’s deterioration is solely due to grain boundary processes and demonstrates the disadvantages of the Nyquist presentation. Here, the frequency information is omitted. We wanted to clarify the origin of the semicircle, which developed after 21 days in the Nyquist plot of the 44% r.h.-stored samples. Thus, we calculated relaxation time constants and capacitances according to Equation (3):
In Equation (3), Rionic and Q are the respective semicircle’s resistance and constant phase element values, with n being the form factor of the constant phase element.
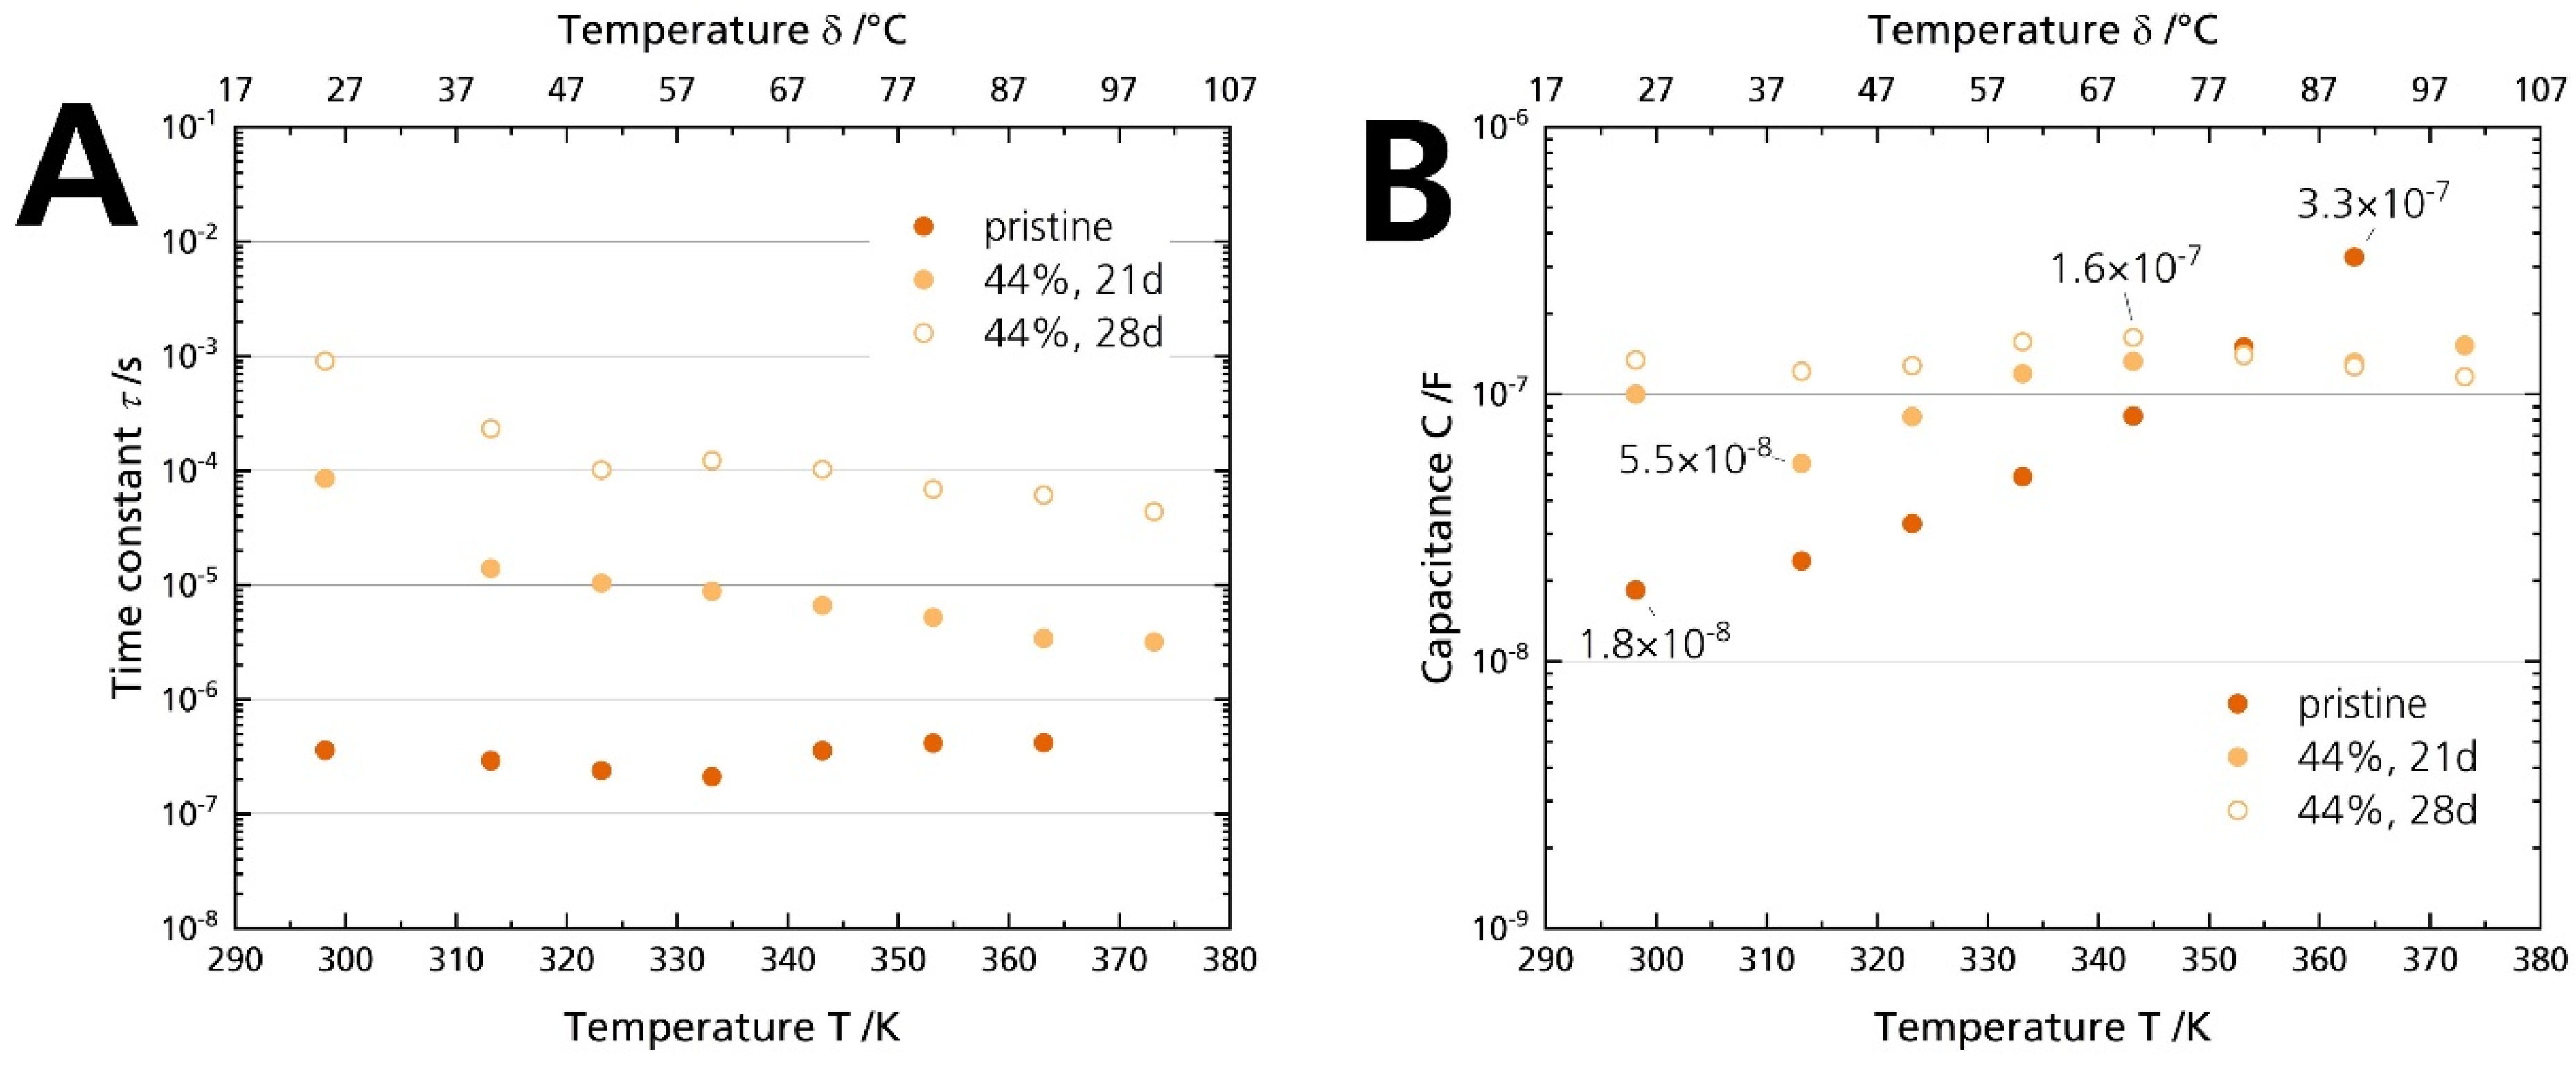
Figure 12A shows that the time constants τ of the pristine sample and the 44% r.h.-stored sample differ by two orders of magnitude. While the time constants range from 0.2–0.4 µs associated with the grain boundary conduction, they increase to 1 ms at room temperature for the sample stored for 28 days. It hints that the underlying processes are indeed not (solely) due to a grain boundary deterioration. The difference indicates that a much slower phenomenon dominates the processes for the 44% r.h.-stored sample. Thus, another resistive element is causative for the arisen semicircle, not the grain boundary resistance Rgb. However, only capacitances can be related to specific phenomena and assist in the deconvolution of the underlying processes [40]. The capacitances were calculated from the constant phase element and the form factor according to Equation (3). While the capacitance of the pristine sample is 1.8 × 10⁻⁸ F at 25 °C, but increases with temperature, all values for the samples stored in 44% r.h. are between 5.5 × 10⁻⁸ F and 1.6 × 10⁻⁷ F (Figure 12B). We ascribe the shape change of the Nyquist spectrum (and hence, the resistance rise) of the 44% r.h.-stored specimen to surface contamination: First, Irvine et al. [40] give a capacitance range from 10−9–10−7 F, which is congruent with the capacitances of the stored samples. Second, the characteristic frequency is lowered compared to the pristine sample. We calculated time constants from 1 ms to 0.1 ms, which are values too slow for grain boundary conduction [41]. Third, we observed the buildup of surface products with increasing storage time by plain eyesight (Figure 4A) and XRD (Figure 5), which was removable by polishing the surface. Fourth, the buildup also correlates chronologically with the appearance of the depressed semicircle in the Nyquist plot. No semicircle in the medium- to low-frequency range can be seen when there is no coloration. Hence, in conjunction with former experimental observations, the time constant analysis underlines that surface layers cause the substantial ionic conductivity decrease, not grain boundary degradation. The layers form due to storage in a humid atmosphere. We exclude a dominant electrode contribution due to adsorbed moisture for the longer stored samples [19], as no electrode contribution was observed for the samples stored in 96% r.h, although they were dripping wet (cf. Figure 4C and Figure S6). We assume that we observed no surface layers for the samples stored in 96% r.h. because the soluble products were promptly dissolved, or the water-film hindered the BASE’s reaction with CO2 in the first place.
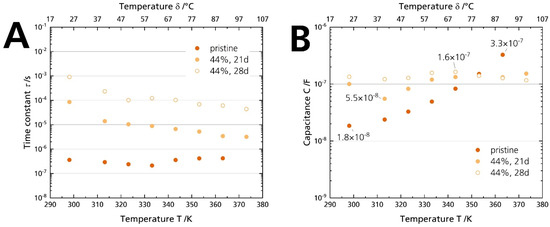
Figure 12.
(A) Time constants and (B) capacitances calculated with Equation (3) from the PEIS measurements of the pristine sample and the specimens stored for 21 days and 28 days in 44% r.h.
However, we cannot exclude deterioration of the grain boundaries completely because the capacitances are also partially in the range of grain boundary phenomena (10−11–10−8 F). Due to similar capacitances, the semicircles caused by surface and grain boundary phenomena may overlap in the Nyquist spectra. Therefore, the contribution of the two phenomena cannot be clearly separated.
3.5.2. Electronic Conductivity
In addition to ionic conductivity, electronic conductivity is a crucial parameter for solid electrolytes. High electronic conductivity can cause dendrite formation due to reduced sodium ions in the electrolyte, leading to cell failure [42]. It also promotes the cell’s self-discharge. As a rule of thumb, Dudney [43] proposed an electronic conductivity around 10−12 S cm−1 for solid electrolytes. However, even though electronic conductivities of this order of magnitude are observed [2], it is not the only factor governing dendrite growth. For example, BASEs perform extraordinarily well when their electronic conductivities are many orders of magnitude higher [34]. We quantified the electronic conductivity to understand whether humidity affects electronic conductivity and, thus, cell performance, similarly to ionic conductivity. Due to the ion-blocking nature of the sputtered Au electrodes, residual current stems only from electronic contributions after a sufficiently long time. A schematic current over time graph is shown in Figure S12. The electronic resistance is then calculated via Ohm’s law. Here, the resistance is calculated with the help of the constant current response. For polarization, 0.5 V and 5.0 V were used.
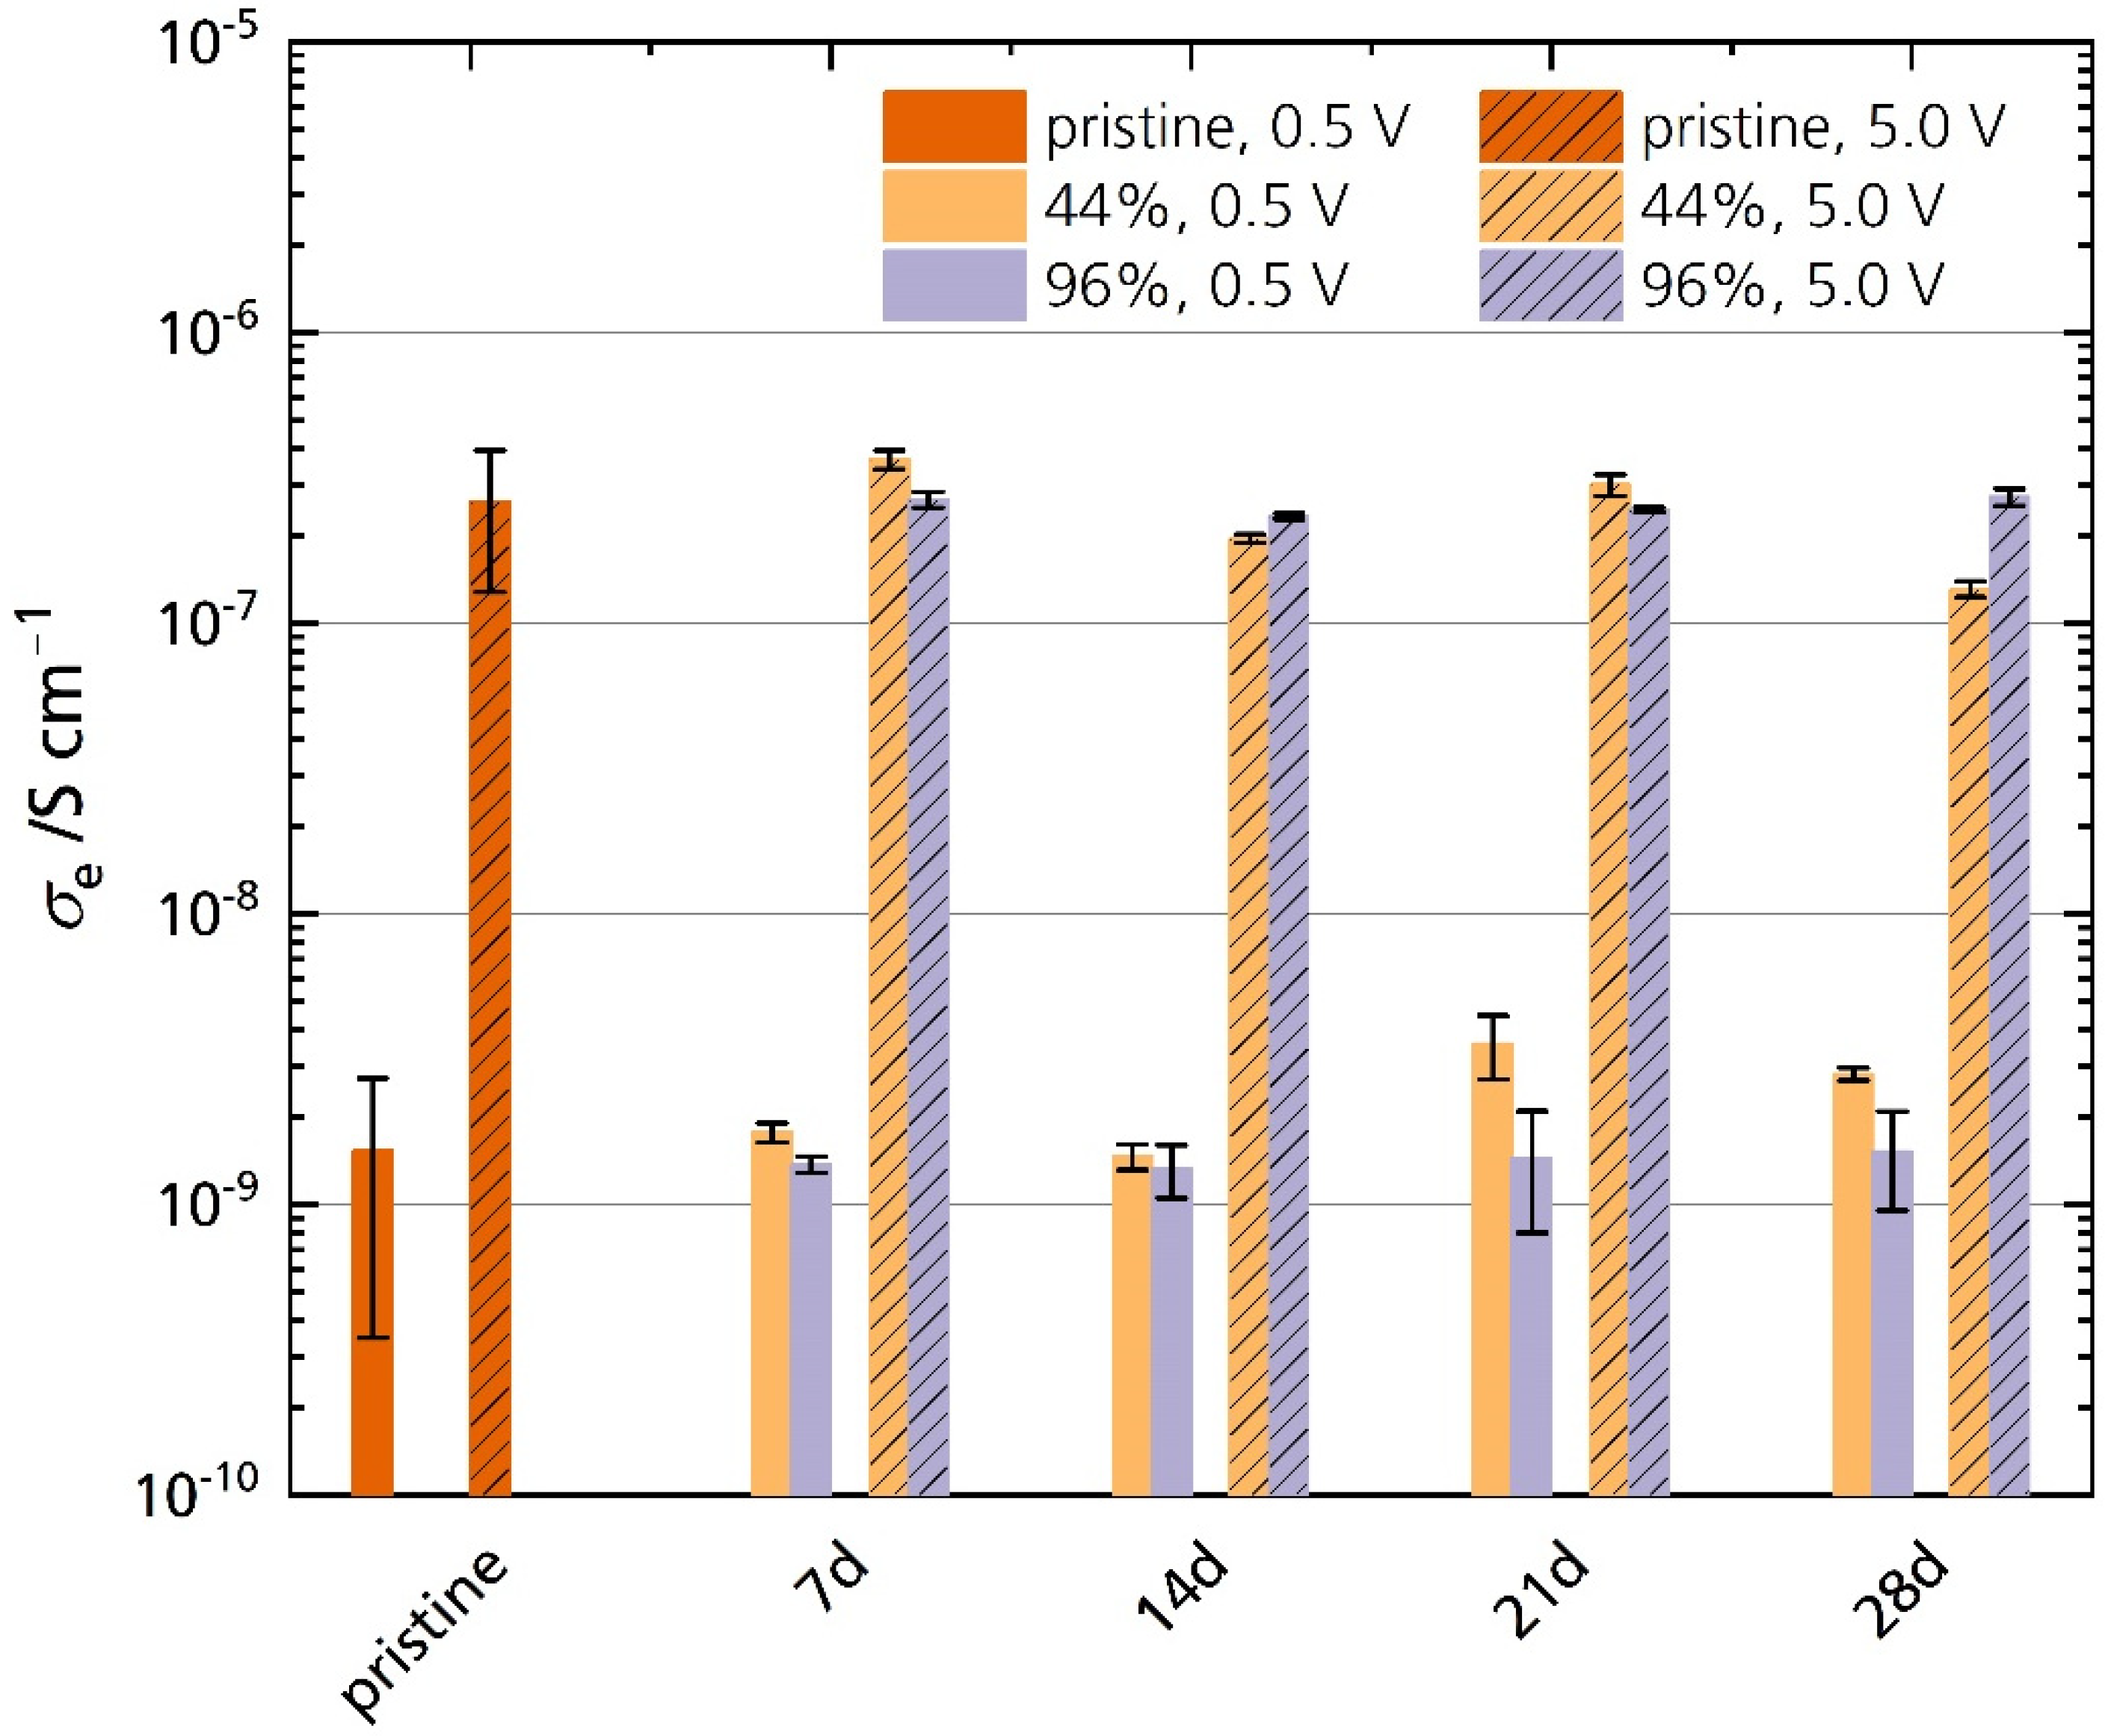
Figure 13 shows the electronic conductivities σe of the pristine specimen and the specimens stored in 44% r.h. and 96% r.h. measured at 25 °C. The electronic conductivities of all samples increase with increasing polarization. The pristine sample’s average electronic conductivity is 1.5 × 10⁻⁹ S cm−1 and 2.6 × 10⁻⁷ S cm−1 for 0.5 V and 5.0 V polarization, respectively. We found no significant difference in electronic conductivity between the pristine and the stored samples for both polarizations. No correlation between storage time and electronic conductivity is observed. A reason for this is also the pristine sample’s large standard deviation. It indicates that other factors such as microstructure, the surface roughness of the respective sample, and oven temperature control influence the sensitive measurement. The oven temperature varies at lower temperatures, which may explain these differences in conductivity. There are minor differences in σe between the stored samples, especially after 21 days and 28 days of storage time. For example, the 44% r.h.-stored sample shows higher electronic conductivities under a polarization of 0.5 V after 28 days. However, the electronic conductivity of 44% r.h.-stored samples is lower than their 96% r.h. counterparts under a polarization of 5.0 V. This behavior shows again that the factors stated above are more important than the storage time. Hence, no trend is observable with storage time, in contrast to the observations for ionic conductivities. We can conclude that Li-stabilized sodium-beta alumina’s electronic conductivity is unaffected after 28 days of storage in a humid atmosphere. Thus, improper storage will not necessarily increase self-discharge. Because the electronic conductivity stays unchanged, we can further exclude that the semicircle observed in the Nyquist plots (see Section 3.5.1) is associated with charge transfer processes, e.g., electron transfer from and to oxide ions at the electrode-ceramic interface [40].

Figure 13.
Electronic conductivities of the pristine sample and the samples stored in 44% r.h. and 96% r.h. for 0.5 V and 5.0 V polarization. The error bars represent standard deviations.
3.6. Critical Current Density
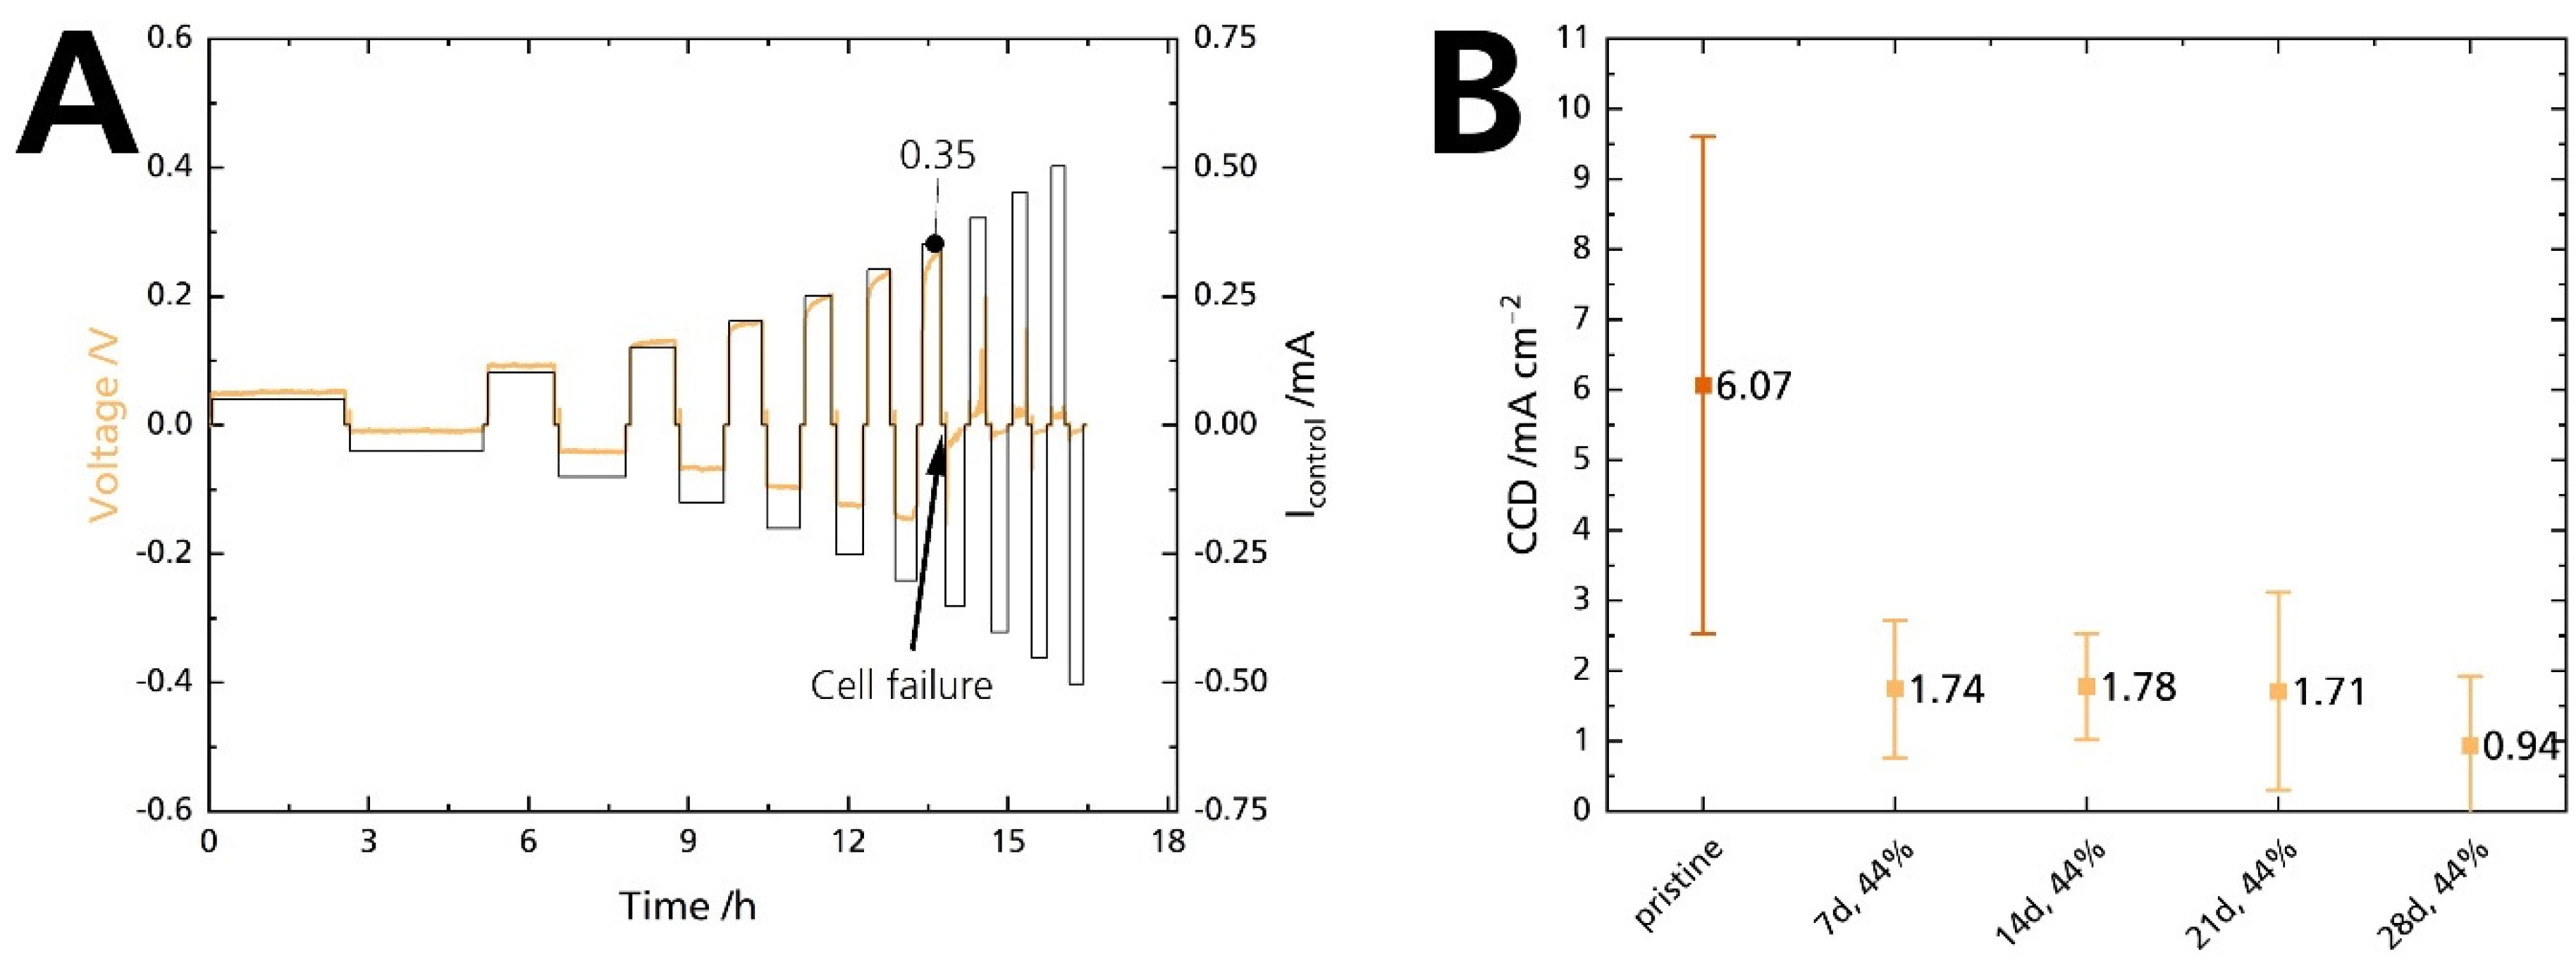
Mechanical strength and conductivity are intrinsic properties of solid electrolytes. For cells, the interaction of the solid electrolyte with its adjacent electrodes comes into play. Especially the Na|BASE interface is critical for high-power applications. Poor interface contact leads to dendrite formation and short circuits at high currents [35]. The critical current density (CCD) defines a solid-state cell’s maximum available current density [44]. In summary, the CCD corresponds to the atomic electrodeposition rate, which exceeds the material flow rate from a metal-filled flaw. Thus, CCD gives the current at which the subcritical stress is no longer maintained. Exceeding the critical current leads to electrolyte failure and cell death [45]. In this work, symmetrical Na|BASE|Na cells were used to quantify the CCD in galvanostatic cycling experiments. The cycled areal capacity is 0.25 mAh cm−2. Figure 14A shows a representative working electrode’s potential response of a Na|BASE|Na cell at 25 °C, in which the BASE was stored in 44% r.h for 14 days. The potential response shows a slight asymmetry, probably due to differences in the contact area of sodium. At 0.35 mA, a sudden drop in potential can be seen. The potential drop is shown enlarged in Figure S13 (Supplementary Material). The current corresponds to a CCD of 0.70 mA cm−2. We summarize the results of the CCD measurements in Figure 14B. The pristine sample’s average CCD is 6.1 mA cm−2, with a maximum CCD of 9.1 mA cm−2 achieved at 25 °C under a calculated 2 MPa. The average CCD of the samples stored for 7, 14, 21, and 28 days is 1.74, 1.78, 1.71, and 0.94 mA cm−2, respectively. The bars represent the standard deviations. We ascribe the large standard deviations to variations in cell pressure. We noticed that the pressure management related to a screw and torque adjustment is not ideal. Here, pressure management needs to be improved. The standard deviations overlap heavily for the stored samples. We want to emphasize the pristine sample’s outstanding CCD value at 25 °C because it is among the highest reported CCD values for an untreated BASE. For example, Bay et al. [34] reported an average CCD of 0.4 mA cm−2 for an untreated specimen and 4 mA cm−2 for a specimen heat treated at 700 °C to reduce surface contamination. The experimental conditions were similar. Recently, Deng et al. [7] reported a CCD of 7.0 mA cm−2 at 80 °C and 0.18 MPa for a BASE with yttria-stabilized zirconia.

Figure 14.
(A) CCD measurement of a Na|BASE|Na cell. The BASE was stored in 44% r.h. for 14 days. (B) Comparison of the CCD experiment at 25 °C for a cycled areal capacity of 0.25 mAh cm−2 in symmetrical Na|BASE|Na cells. The error bars represent standard deviations.
The CCD value of the pristine sample is excellent, but a drastic decrease occurred when the sample was submitted to 44% r.h. The potential response shows that the decrease occurs after seven days, and the CCD remains at low levels afterward. Contrary to the decrease in ionic conductivity, there is no gradual degradation. Furthermore, it seems unlikely that the slight decrease in ionic conductivity after 7 and 14 days can cause such a substantial decrease in CCD. As no increase in electronic conductivity was observed, we can exclude a correlation between those parameters. We assume that the moisture itself is responsible for the deterioration of the CCD value as it reacts promptly with sodium, and not humidity-induced phenomena (i.e., ion exchange, surface layers). Seven days are sufficient to moisten the BASE’s surface, even in 44% r.h. This explanation is congruent with observations made by Viswanathan and Virkar [25] on Li-stabilized sodium-beta alumina. Absolute dryness is mandatory for achieving high CCDs and enhanced cycle life.
4. Conclusions
We stored disk-shaped specimens of Li-stabilized sodium-beta alumina in three different environments to investigate the effect of humidity on key performance parameters of the solid electrolyte. Storage of the disks in a humid atmosphere affects their properties in multidirectional ways.
Contrary to expectations, the disks’ mechanical stability was unaffected by all three relative humidities after 28 days of storage. However, the present study reveals that even temporary storage in an inappropriate atmosphere significantly affects sodium-beta alumina. After two weeks of storage, we noticed effects for the specimens stored in 44% r.h. The affected disks’ changes included (i) microstructural changes, (ii) differences in chemical composition, and (iii) darkening of the ceramic’s matrix due to the buildup of surface layers, which are underlined by a time constant analysis. The surface layer consisting of carbonates and hydroxides gradually and substantially deteriorated the ionic conductivity of the solid electrolyte stored in 44% r.h. We proposed a possible reaction mechanism for the surface layer evolution. It is likely connected to a preceding ion exchange between Na+ and H3O+. We conclude that the buildup responsible for the decrease in ionic conductivity is limited to the surface because it is removable by polishing. In contrast, extended storage in an inert atmosphere poses no problem, while the disks’ ultra-moist surface prevented layer buildup for the 96% r.h.-stored specimens.
However, as humidity drastically reduced the critical current density after only one week, i.e., promoted cell failure, it is advisable to accommodate simple but helpful responses in the preparation process. They include specimen storage in a dry atmosphere and thorough polishing and drying at adequate, high temperature. Future investigations should investigate the influence of relative humidity under an inert atmosphere to confirm the degradation mechanism. Furthermore, the difference in degradation between moderate and ultra-moist atmospheres will be the subject of future investigations. Thorough material characterization with advanced surface analysis, including transmission electron spectroscopy and x-ray photoelectron spectroscopy, might be helpful.
Supplementary Materials
The following supporting information can be downloaded at: https://www.mdpi.com/article/10.3390/batteries8090103/s1. Figure S1. (Top) Storage of the specimens in two desiccators filled with a saturated potassium carbonate solution and distilled water. (Bottom) History of temperature and relative humidity in the desiccators. The numbers represent the minimum and maximum values reached in the time interval. Figure S2. Abrasion of sanded disks. Upper half shows the abrasion of a disk stored for 21 days in 44% r.h. in a desiccator, while the powder in the lower half corresponds to the abrasion of a disk stored for 21 days in 96% r.h. in a desiccator. Figure S3. Enlarged diffractograms of (top) the pristine disk and the disks stored for 28 days in (middle) 44% relative humidity (r.h.) and (bottom) 96% r.h. Figure S4. Diffraction pattern of the sample stored for 28 days in 44% r.h. with reference patterns of NaOH∙H2O (pdf 00-030-1194), Na2CO3∙H2O (pdf 08-0448), and Al(OH)3 (pdf 00-018-005). Figure S5. Peak evolution at 1450 cm−1 was observed with ATR-IR after storing a specimen for 28 days in 44% r.h. Figure S6. Cracking of a BASE observed after roughly sixth month of storage time in 96% r.h. Figure S7. Ionic conductivity of the pristine disks and disks stored in 44% r.h. and 96% r.h. for 21 days is plotted over 1000/T, instead of ln(σT) over 1000/T. Please note the logarithmic y-axis. The error bars represent the standard deviations. Figure S8. Arrhenius plot of the pristine sample, samples stored over 21 days in 44% r.h. and the sample stored for 21 days in 96% r.h. The samples were polished with corundum sandpaper before measurement. The standard deviation is given as connected lines for better visualization because otherwise, there would be too much overlap. Figure S9. Nyquist plot of the samples stored for 21 days in 44% and 96% r.h. Figure S10. Ionic conductivity of the pristine sample and the samples stored for 7, 14 and 28 days in 44% r.h. is plotted over 1000/T, instead of ln(σT) over 1000/T. Please note the logarithmic y-axis. Figure S11. Ionic conductivity of the pristine disk and the specimens stored in 44% r.h for 7, 14, 21 and 28 days considering the whole frequency range. The ionic conductivity is plotted over 1000/T, instead of ln(σT) over 1000/T. Please note the logarithmic y-axis. Figure S12. Schematic of the current over time function when a constant DC polarization is applied to the specimen. Figure S13. Representative potential response of a Na/BASE/Na cell at room temperature, in which BASE was stored for 21 days in 44% r.h. The cycled capacity is 0.25 mAh cm−2.
Author Contributions
Conceptualization, M.P.F.; methodology, M.P.F.; validation, M.P.F. and C.D.; formal analysis, M.P.F.; investigation, M.P.F.; resources, M.P.F. and C.D.; data curation, M.P.F.; writing—original draft preparation, M.P.F.; writing—review and editing, M.P.F., C.D., M.S. (Matthias Schulz) and M.S. (Michael Stelter); visualization, M.P.F.; supervision, M.S. (Matthias Schulz); project administration, M.S. (Matthias Schulz); funding acquisition, M.S. (Michael Stelter). All authors have read and agreed to the published version of the manuscript.
Funding
M.P.F. is grateful for financial support from the Landesgraduiertenakademie of the Friedrich-Schiller-University Jena. Open Access funding was enabled and organized by Projekt DEAL.
Institutional Review Board Statement
Not applicable.
Informed Consent Statement
Not applicable.
Data Availability Statement
The data presented in this study are available on request from the corresponding author.
Acknowledgments
All authors thank Detlef Rohländer for the gold sputtering and SEM measurements. We want to also thank Torsten Martin for assisting with ATR-FT-IR measurements and Karl Skadell for proofreading as well as helpful discussion.
Conflicts of Interest
The authors declare no conflict of interest.
References
- Lu, X.; Xia, G.; Lemmon, J.P.; Yang, Z. Advanced materials for sodium-beta alumina batteries: Status, challenges and perspectives. J. Power Sources 2010, 195, 2431–2442. [Google Scholar] [CrossRef]
- Wenzel, S.; Leichtweiss, T.; Weber, D.A.; Sann, J.; Zeier, W.G.; Janek, J. Interfacial Reactivity Benchmarking of the Sodium Ion Conductors Na3PS4 and Sodium β-Alumina for Protected Sodium Metal Anodes and Sodium All-Solid-State Batteries. ACS Appl. Mater. Interfaces 2016, 8, 28216–28224. [Google Scholar] [CrossRef]
- Pujar, P.; Gupta, B.; Sengupta, P.; Gupta, D.; Mandal, S. Sodium ion incorporated alumina—A versatile anisotropic ceramic. J. Eur. Ceram. Soc. 2019, 39, 4473–4486. [Google Scholar] [CrossRef]
- Hueso, K.B.; Palomares, V.; Armand, M.; Rojo, T. Challenges and perspectives on high and intermediate-temperature sodium batteries. Nano Res. 2017, 255, 410. [Google Scholar] [CrossRef]
- Li, G.; Lu, X.; Kim, J.Y.; Lemmon, J.P.; Sprenkle, V.L. Cell degradation of a Na–NiCl2 (ZEBRA) battery. J. Mater. Chem. A 2013, 1, 14935–14942. [Google Scholar] [CrossRef]
- Fertig, M.P.; Skadell, K.; Schulz, M.; Dirksen, C.; Adelhelm, P.; Stelter, M. From High- to Low-Temperature: The Revival of Sodium-Beta Alumina for Sodium Solid-State Batteries. Batter. Supercaps 2022, 5, e202100131. [Google Scholar] [CrossRef]
- Deng, T.; Ji, X.; Zou, L.; Chiekezi, O.; Cao, L.; Fan, X.; Adebisi, T.R.; Chang, H.-J.; Wang, H.; Li, B.; et al. Interfacial-engineering-enabled practical low-temperature sodium metal battery. Nat. Nanotechnol. 2022, 17, 269–277. [Google Scholar] [CrossRef]
- Hasa, I.; Mariyappan, S.; Saurel, D.; Adelhelm, P.; Koposov, A.Y.; Masquelier, C.; Croguennec, L.; Casas-Cabanas, M. Challenges of today for Na-based batteries of the future: From materials to cell metrics. J. Power Sources 2021, 482, 228872. [Google Scholar] [CrossRef]
- Vaalma, C.; Buchholz, D.; Weil, M.; Passerini, S. A cost and resource analysis of sodium-ion batteries. Nat. Rev. Mater. 2018, 3, 652. [Google Scholar] [CrossRef]
- Beevers, C.A.; Ross, Μ.A.S. The Crystal Structure of “Beta Alumina” Na2O·11Al2O3. Z. Krist. Cryst. Mater. 1937, 97, 59–66. [Google Scholar] [CrossRef]
- Vries, R.C.; Roth, W.L. Critical Evaluation of the Literature Data on Beta Alumina and Related Phases: I, Phase Equilibria and Characterization of Beta Alumina Phases. J. Am. Ceram. Soc. 1969, 52, 364–369. [Google Scholar] [CrossRef]
- Sudworth, J.L.; Barrow, P.; Dong, W.; Dunn, B.; Farrington, G.C.; Thomas, J.O. Toward Commercialization of the Beta-Alumina Family of Ionic Conductors. MRS Bull. 2000, 25, 22–26. [Google Scholar] [CrossRef]
- Bragg, W.L.; Gottfried, C.; West, J. The Structure of β Alumina. Z. Krist. Cryst. Mater. 1931, 77, 255–274. [Google Scholar] [CrossRef]
- Dell, R.M.; Moseley, P.T. Beta-alumina electrolyte for use in sodium/sulphur batteries: Part I. Fundamental properties. J. Power Sources 1981, 6, 143–160. [Google Scholar] [CrossRef]
- Yamaguchi, G.; Suzuki, K. On the Structures of Alkali Polyaluminates. Bull. Chem. Soc. Jpn. 1968, 41, 93–99. [Google Scholar] [CrossRef]
- Dirksen, C.L.; Skadell, K.; Schulz, M.; Fertig, M.P.; Stelter, M. Influence of 3d Transition Metal Doping on Lithium Stabilized Na-β″-Alumina Solid Electrolytes. Materials 2021, 14, 5389. [Google Scholar] [CrossRef]
- Dunn, B. Effect of Air Exposure on the Resistivity of Sodium Beta and Beta Aluminas. J. Am. Ceram. Soc. 1981, 64, 125–128. [Google Scholar] [CrossRef]
- Chi, C.; Katsui, H.; Goto, T. Effect of Li addition on the formation of Na-β/βʹʹ-alumina film by laser chemical vapor deposition. Ceram. Int. 2017, 43, 1278–1283. [Google Scholar] [CrossRef]
- Armstrong, R.D.; Sellick, D.P. A. c. impedance studies on sodium β-alumina tubes for use in sodium-sulphur cells. J. Appl. Electrochem. 1979, 9, 623–628. [Google Scholar] [CrossRef]
- Armstrong, R.D.; Sellick, D.P. A Study into the Effect of Water Vapour on Sodium β-Aluminas. Electrochim. Acta 1980, 25, 1199–1204. [Google Scholar] [CrossRef]
- Will, F.G. Effect of Water on Beta Alumina Conductivity. J. Electrochem. Soc 1976, 123, 834–836. [Google Scholar] [CrossRef]
- Harbach, F. Further experiments concerning the water take-up of fully and partially stabilized beta″ alumina ceramics. Solid State Ion. 1983, 9–10 Pt 1, 231–236. [Google Scholar] [CrossRef]
- Heavens, S.N. Surface layers in polycrystalline sodium\-alumina. J. Mater. Sci. 1982, 17, 965–969. [Google Scholar] [CrossRef]
- Flor, G.; Marini, A.; Massarotti, V.; Villa, M. Reactivity of β-Aluminas with Water. Solid State Ion. 1981, 2, 195–204. [Google Scholar] [CrossRef]
- Viswanathan, L.; Virkar, A.V. Wetting characteristics of sodium on β-alumina and on nasicon. J. Mater. Sci. 1982, 17, 753–759. [Google Scholar] [CrossRef]
- Kawamura, T.; Okada, S.; Yamaki, J. Decomposition reaction of LiPF6-based electrolytes for lithium ion cells. J. Power Sources 2006, 156, 547–554. [Google Scholar] [CrossRef]
- Lux, S.F.; Lucas, I.T.; Pollak, E.; Passerini, S.; Winter, M.; Kostecki, R. The mechanism of HF formation in LiPF6 based organic carbonate electrolytes. Electrochem. Commun. 2012, 14, 47–50. [Google Scholar] [CrossRef]
- Sharafi, A.; Meyer, H.M.; Nanda, J.; Wolfenstine, J.; Sakamoto, J. Characterizing the Li–Li7La3Zr2O12 interface stability and kinetics as a function of temperature and current density. J. Power Sources 2016, 302, 135–139. [Google Scholar] [CrossRef]
- Dirksen, C.L.; Skadell, K.; Schulz, M.; Stelter, M. Effects of TiO2 doping on Li+-stabilized Na-β″-alumina for energy storage applications. Sep. Purif. Technol. 2019, 213, 88–92. [Google Scholar] [CrossRef]
- De Jonghe, L.C.; Buechele, A. Chemical colouration of sodium beta-aluminas. J. Mater. Sci. 1982, 17, 885–892. [Google Scholar] [CrossRef]
- Bay, M.-C.; Heinz, M.V.; Danilewsky, A.N.; Battaglia, C.; Vogt, U.F. Analysis of c-lattice parameters to evaluate Na2O loss from and Na2O content in β″-alumina ceramics. Ceram. Int. 2021, 47, 13402–13408. [Google Scholar] [CrossRef]
- Sharafi, A.; Yu, S.; Naguib, M.; Lee, M.; Ma, C.; Meyer, H.M.; Nanda, J.; Chi, M.; Siegel, D.J.; Sakamoto, J. Impact of air exposure and surface chemistry on Li–Li7La3Zr2O12 interfacial resistance. J. Mater. Chem. A 2017, 5, 13475–13487. [Google Scholar] [CrossRef]
- Garbarczyk, J.E.; Jakubowski, W.; Wasiucionek, M. Effect of selected mobile ions on moisture uptake by beta″ alumina. Solid State Ion. 1983, 9–10 Pt 1, 249–253. [Google Scholar] [CrossRef]
- Bay, M.-C.; Wang, M.; Grissa, R.; Heinz, M.V.F.; Sakamoto, J.; Battaglia, C. Sodium Plating from Na-β″-Alumina Ceramics at Room Temperature, Paving the Way for Fast-Charging All-Solid-State Batteries. Adv. Energy Mater. 2020, 10, 1902899. [Google Scholar] [CrossRef]
- Spencer Jolly, D.; Ning, Z.; Darnbrough, J.E.; Kasemchainan, J.; Hartley, G.O.; Adamson, P.; Armstrong, D.E.J.; Marrow, J.; Bruce, P.G. Sodium/Na β″ Alumina Interface: Effect of Pressure on Voids. ACS Appl. Mater. Interfaces 2020, 12, 678–685. [Google Scholar] [CrossRef]
- Lu, X.; Chang, H.J.; Bonnett, J.F.; Canfield, N.L.; Jung, K.; Sprenkle, V.L.; Li, G. Effect of cathode thickness on the performance of planar Na-NiCl2 battery. J. Power Sources 2017, 365, 456–462. [Google Scholar] [CrossRef]
- Heinz, M.V.; Graeber, G.; Landmann, D.; Battaglia, C. Pressure management and cell design in solid-electrolyte batteries, at the example of a sodium-nickel chloride battery. J. Power Sources 2020, 465, 228268. [Google Scholar] [CrossRef]
- Huggins, R.A. Simple method to determine electronic and ionic components of the conductivity in mixed conductors a review. Ionics 2002, 8, 300–313. [Google Scholar] [CrossRef]
- Armstrong, R.D.; Burnham, R.A. The effect of roughness on the impedance of the interface between a solid electrolyte and a blocking electrode. J. Electroanal. Chem. Interfacial Electrochem. 1976, 72, 257–266. [Google Scholar] [CrossRef]
- Irvine, J.T.S.; Sinclair, D.C.; West, A.R. Electroceramics: Characterization by Impedance Spectroscopy. Adv. Mater. 1990, 2, 132–138. [Google Scholar] [CrossRef]
- Hüttl, J.; Seidl, C.; Auer, H.; Nikolowski, K.; Görne, A.L.; Arnold, M.; Heubner, C.; Wolter, M.; Michaelis, A. Ultra-low LPS/LLZO interfacial resistance—Towards stable hybrid solid-state batteries with Li-metal anodes. Energy Storage Mater. 2021, 40, 259–267. [Google Scholar] [CrossRef]
- Han, F.; Westover, A.S.; Yue, J.; Fan, X.; Wang, F.; Chi, M.; Leonard, D.N.; Dudney, N.J.; Wang, H.; Wang, C. High electronic conductivity as the origin of lithium dendrite formation within solid electrolytes. Nat. Energy 2019, 4, 187–196. [Google Scholar] [CrossRef]
- Nazri, G.-A. (Ed.) Lithium Batteries: Science and Technology; Springer: Boston, MA, USA, 2003; ISBN 978-0-387-92674-2. [Google Scholar]
- Lu, Y.; Zhao, C.-Z.; Yuan, H.; Cheng, X.-B.; Huang, J.-Q.; Zhang, Q. Critical Current Density in Solid-State Lithium Metal Batteries: Mechanism, Influences, and Strategies. Adv. Funct. Mater. 2021, 31, 2009925. [Google Scholar] [CrossRef]
- Park, R.J.-Y.; Eschler, C.M.; Fincher, C.D.; Badel, A.F.; Guan, P.; Pharr, M.; Sheldon, B.W.; Carter, W.C.; Viswanathan, V.; Chiang, Y.-M. Semi-solid alkali metal electrodes enabling high critical current densities in solid electrolyte batteries. Nat. Energy 2021, 6, 314–322. [Google Scholar] [CrossRef]


Publisher’s Note: MDPI stays neutral with regard to jurisdictional claims in published maps and institutional affiliations. |
© 2022 by the authors. Licensee MDPI, Basel, Switzerland. This article is an open access article distributed under the terms and conditions of the Creative Commons Attribution (CC BY) license (https://creativecommons.org/licenses/by/4.0/).