
Modified Biogeography Optimization Strategy for Optimal Sizing and Performance of Battery Energy Storage System in Microgrid Considering Wind Energy Penetration


Abstract
:1. Introduction
- Evaluating the effect of using wind power on the DODs and life spans of BESSs;
- Considering the effects of wind power variations on the performance of the BESS in various places and seasons;
- Using the capacity incremental method for sizing the BESS until achieving the optimum size and the effects on the BESS’s DOD;
- Using the IBBOA to solve the optimization problem and proposing an efficient method for integrating BESS into WPMG.
2. Problem Formulation
2.1. Wind Power Scheme
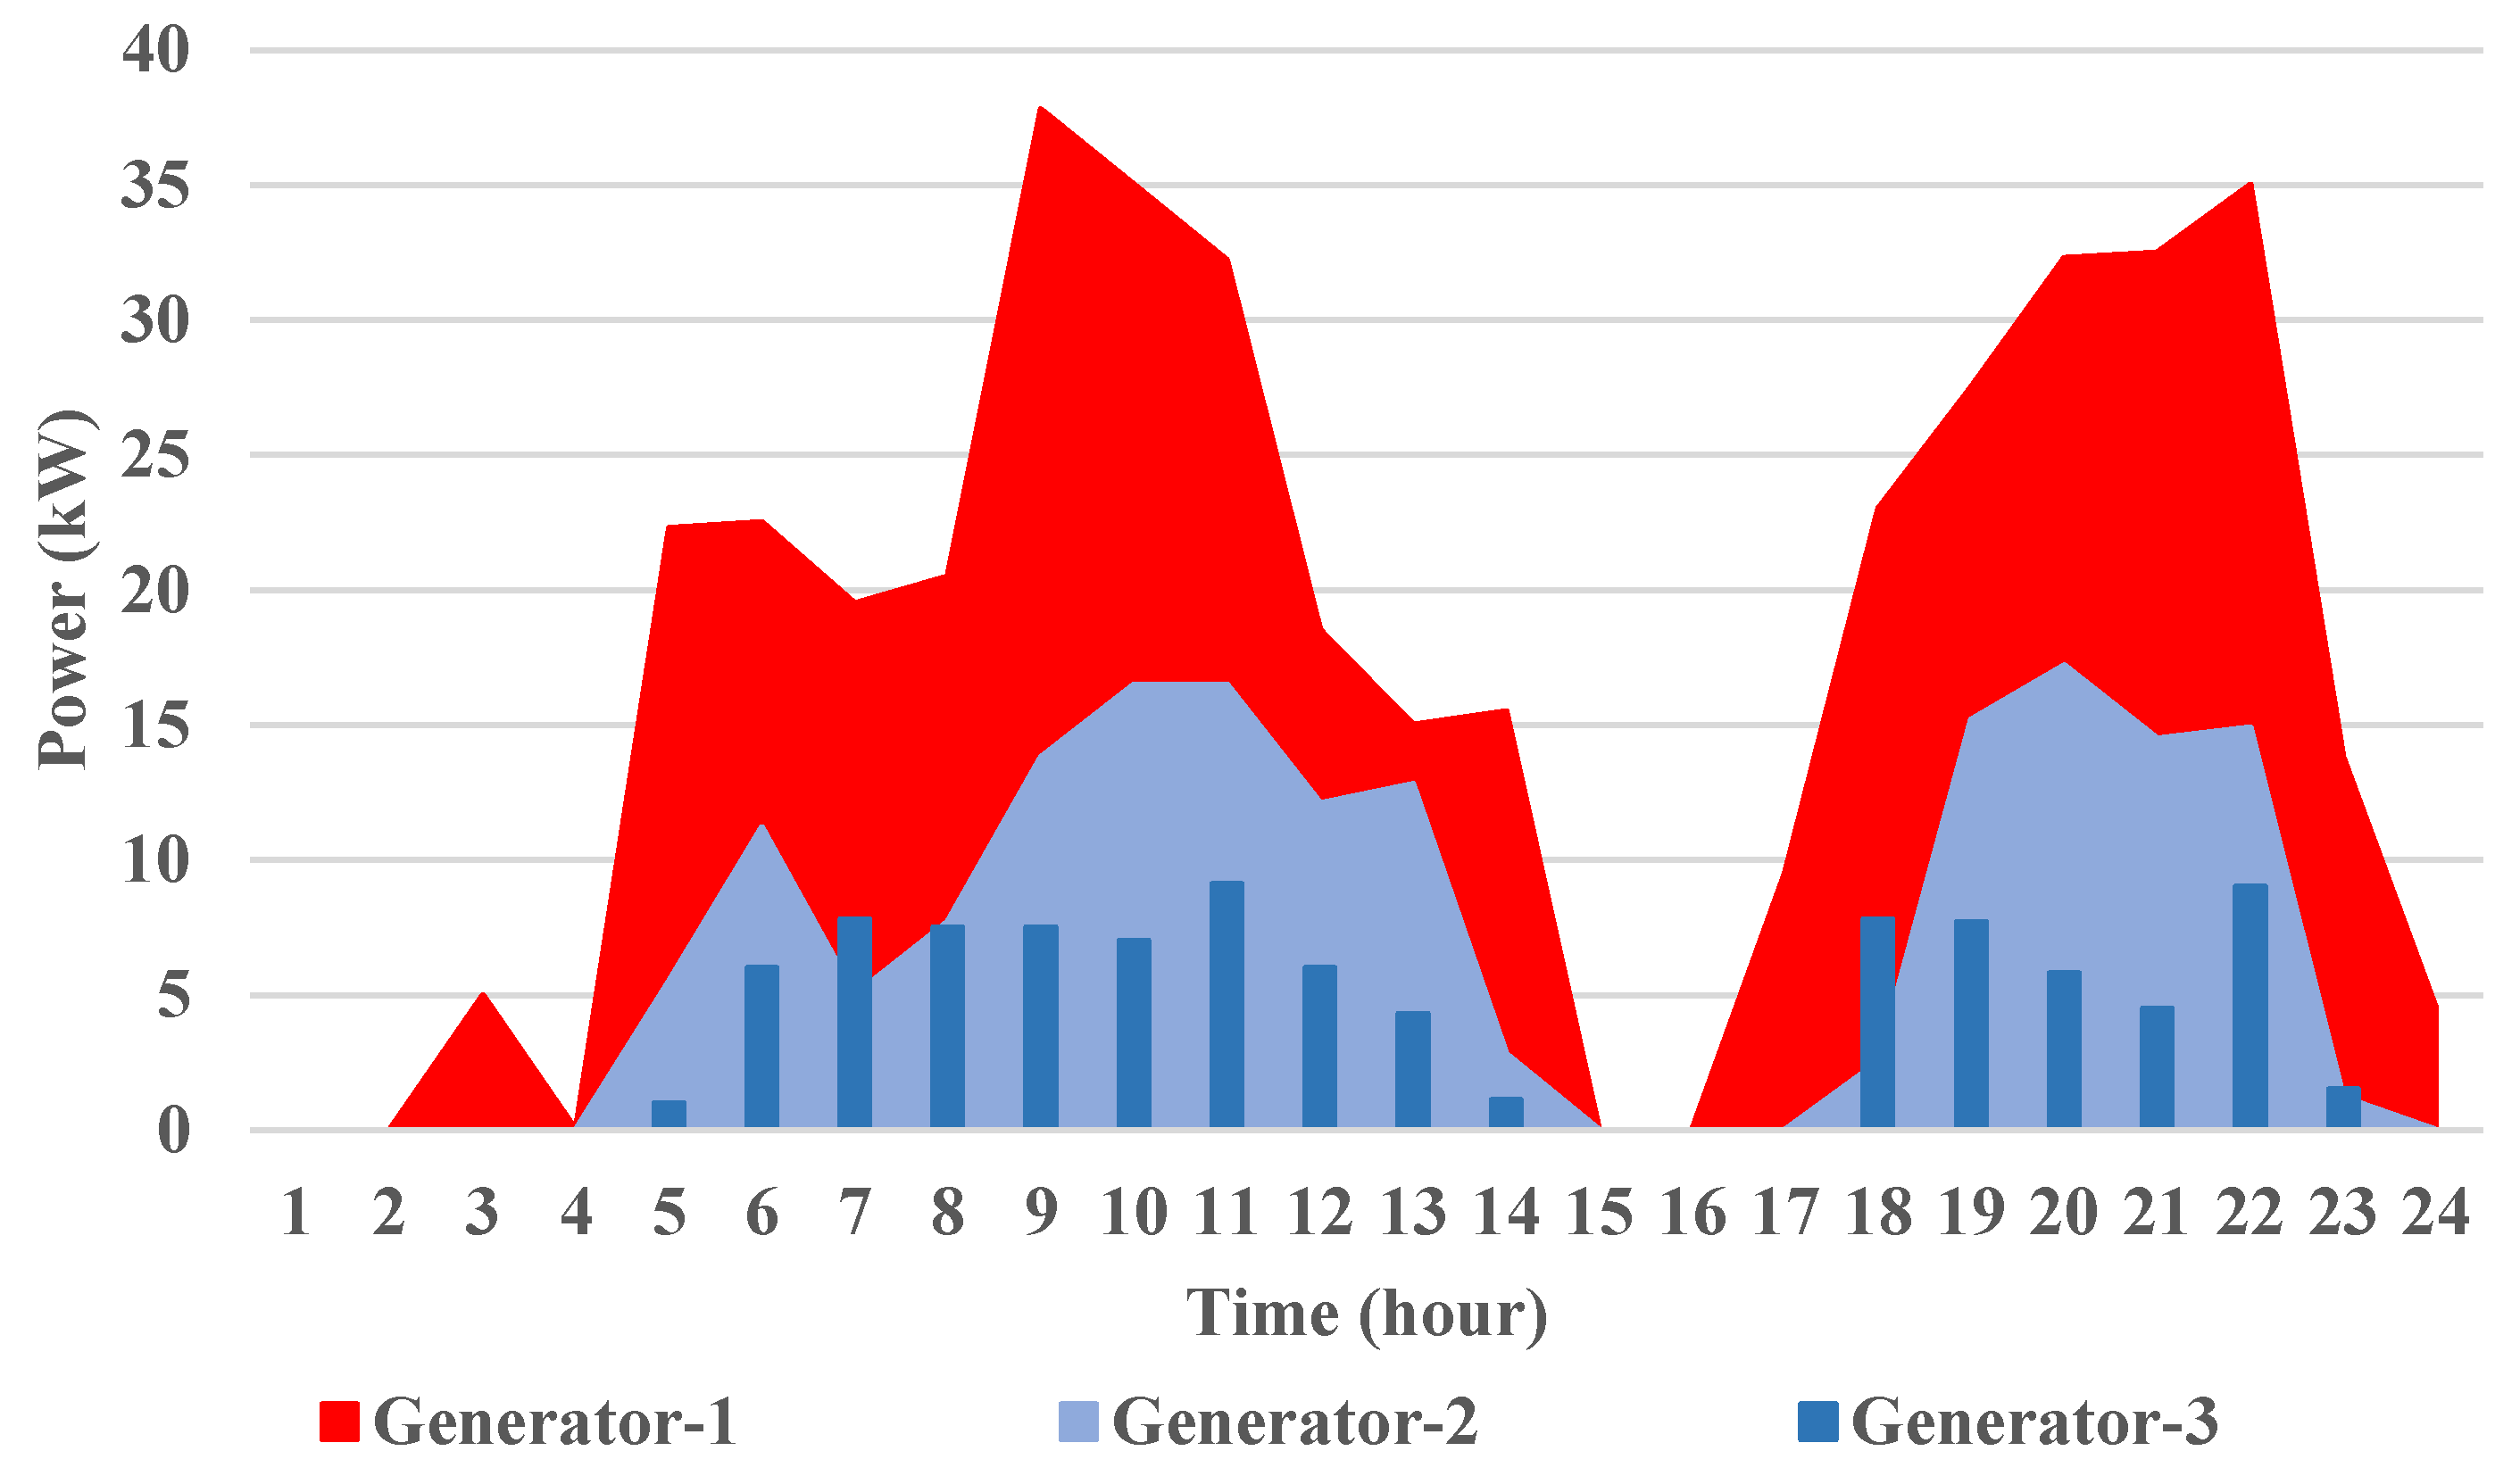
2.2. Generator Scheme
2.3. BESS Scheme
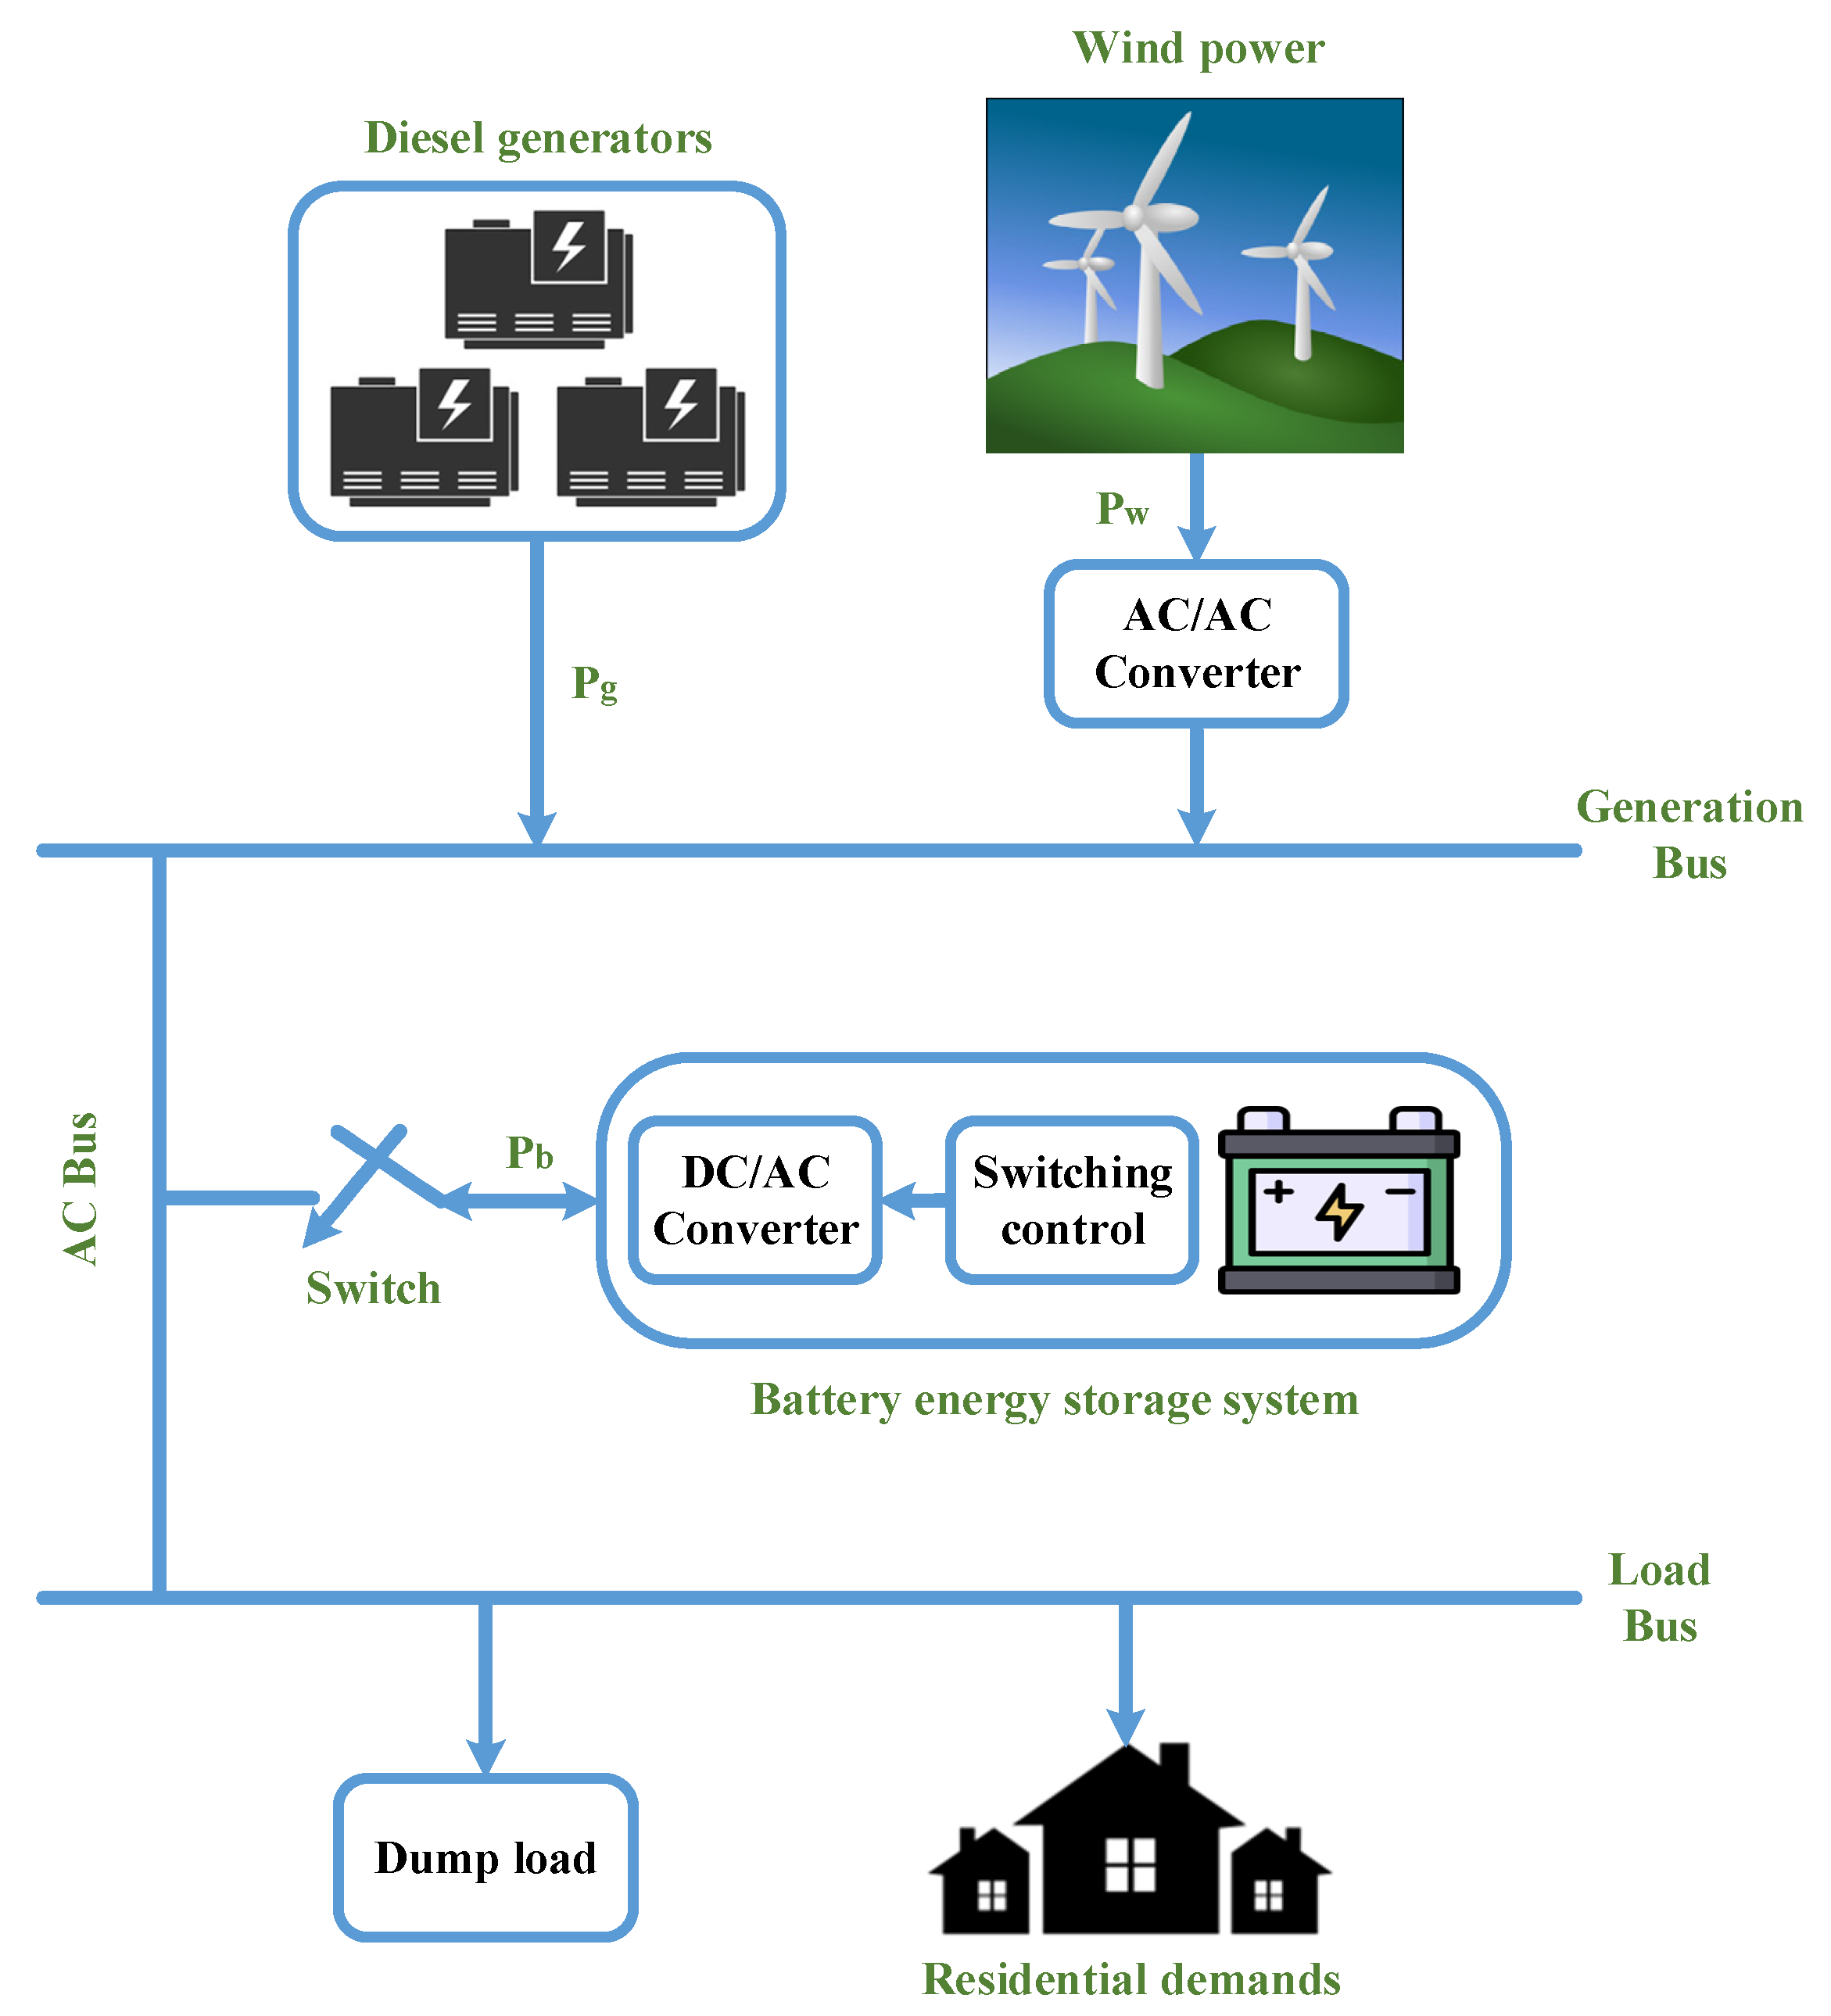
3. Proposed Layout
3.1. Objective Function
3.2. Limitations
3.2.1. Power Balance Limitation
3.2.2. Generator Limitation
3.2.3. BESS Limitation
3.3. Proposed Optimization Layout
4. BBOA
4.1. Basic BBOA
4.1.1. Initialization
4.1.2. Migration
4.1.3. Mutation
4.2. Improved BBOA
4.2.1. Mechanism of Adaptive Definition of Migration Rate
4.2.2. Dynamic Migration Scheme
5. Simulation Outcomes
| Algorithm 1: Suggested Algorithm to solve the optimization problem | |
| 1. | Defining the system variables, and initializing variables such as queest agents, number of generation units, dimention, cost function. |
| 2. | Specifing the population size, and generating the random population, and computing the cost function based on Equation (8) for the initial population. |
| 3. | Evaluating the habitat individuals, and eliminating the individuals that do not satisfy the constrains. |
| 4. | Sorting the remained habitat individuals in ascendant order and using them as the population. |
| 5. | Updating the parameters , and for every habitat in the population (Equation (21)). |
| 6. | Computing the migration according to Equation (22) by using the updated , and from previous step. |
| 7. | Specifing the mutation rate , determining the species probability for all habitat. Computing the cost function based on Equation (8). |
| 8. | If the iteration reach the maximum, go to next step, if not, go to step 3 for the next iteration. |
| 9. | Print the best answer. |
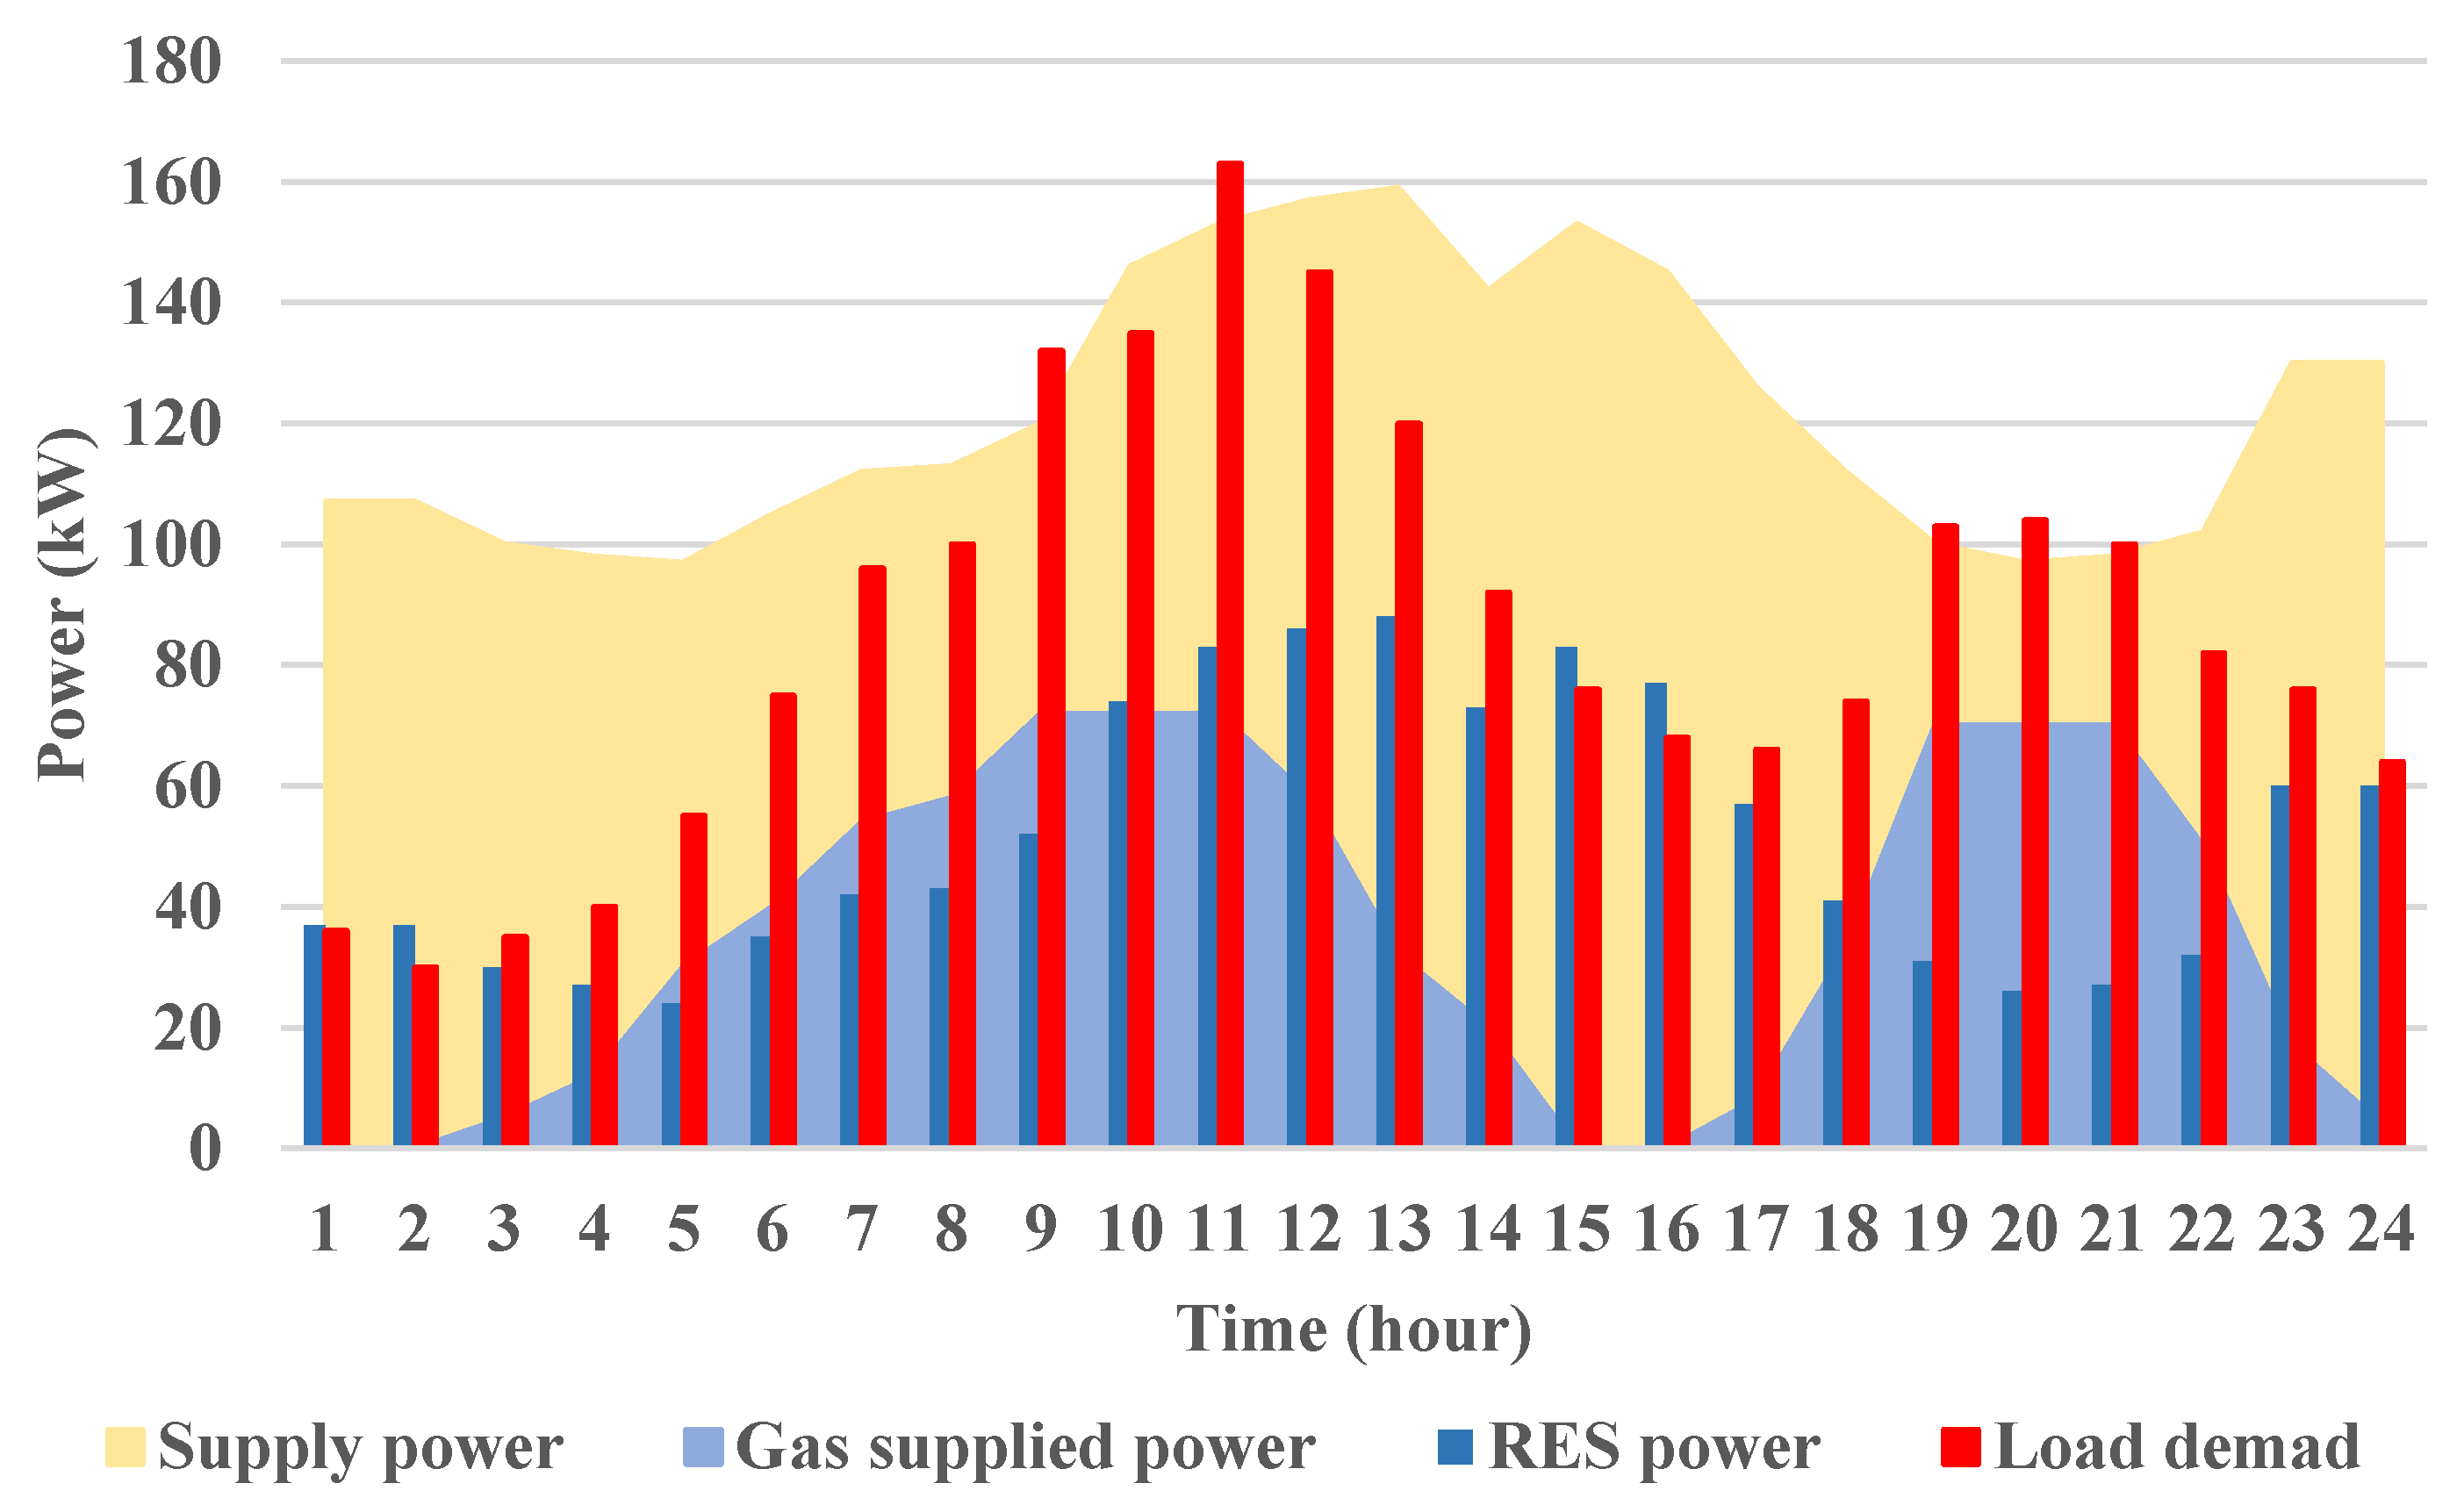
5.1. Scenario-1: BESS Disconnected Status
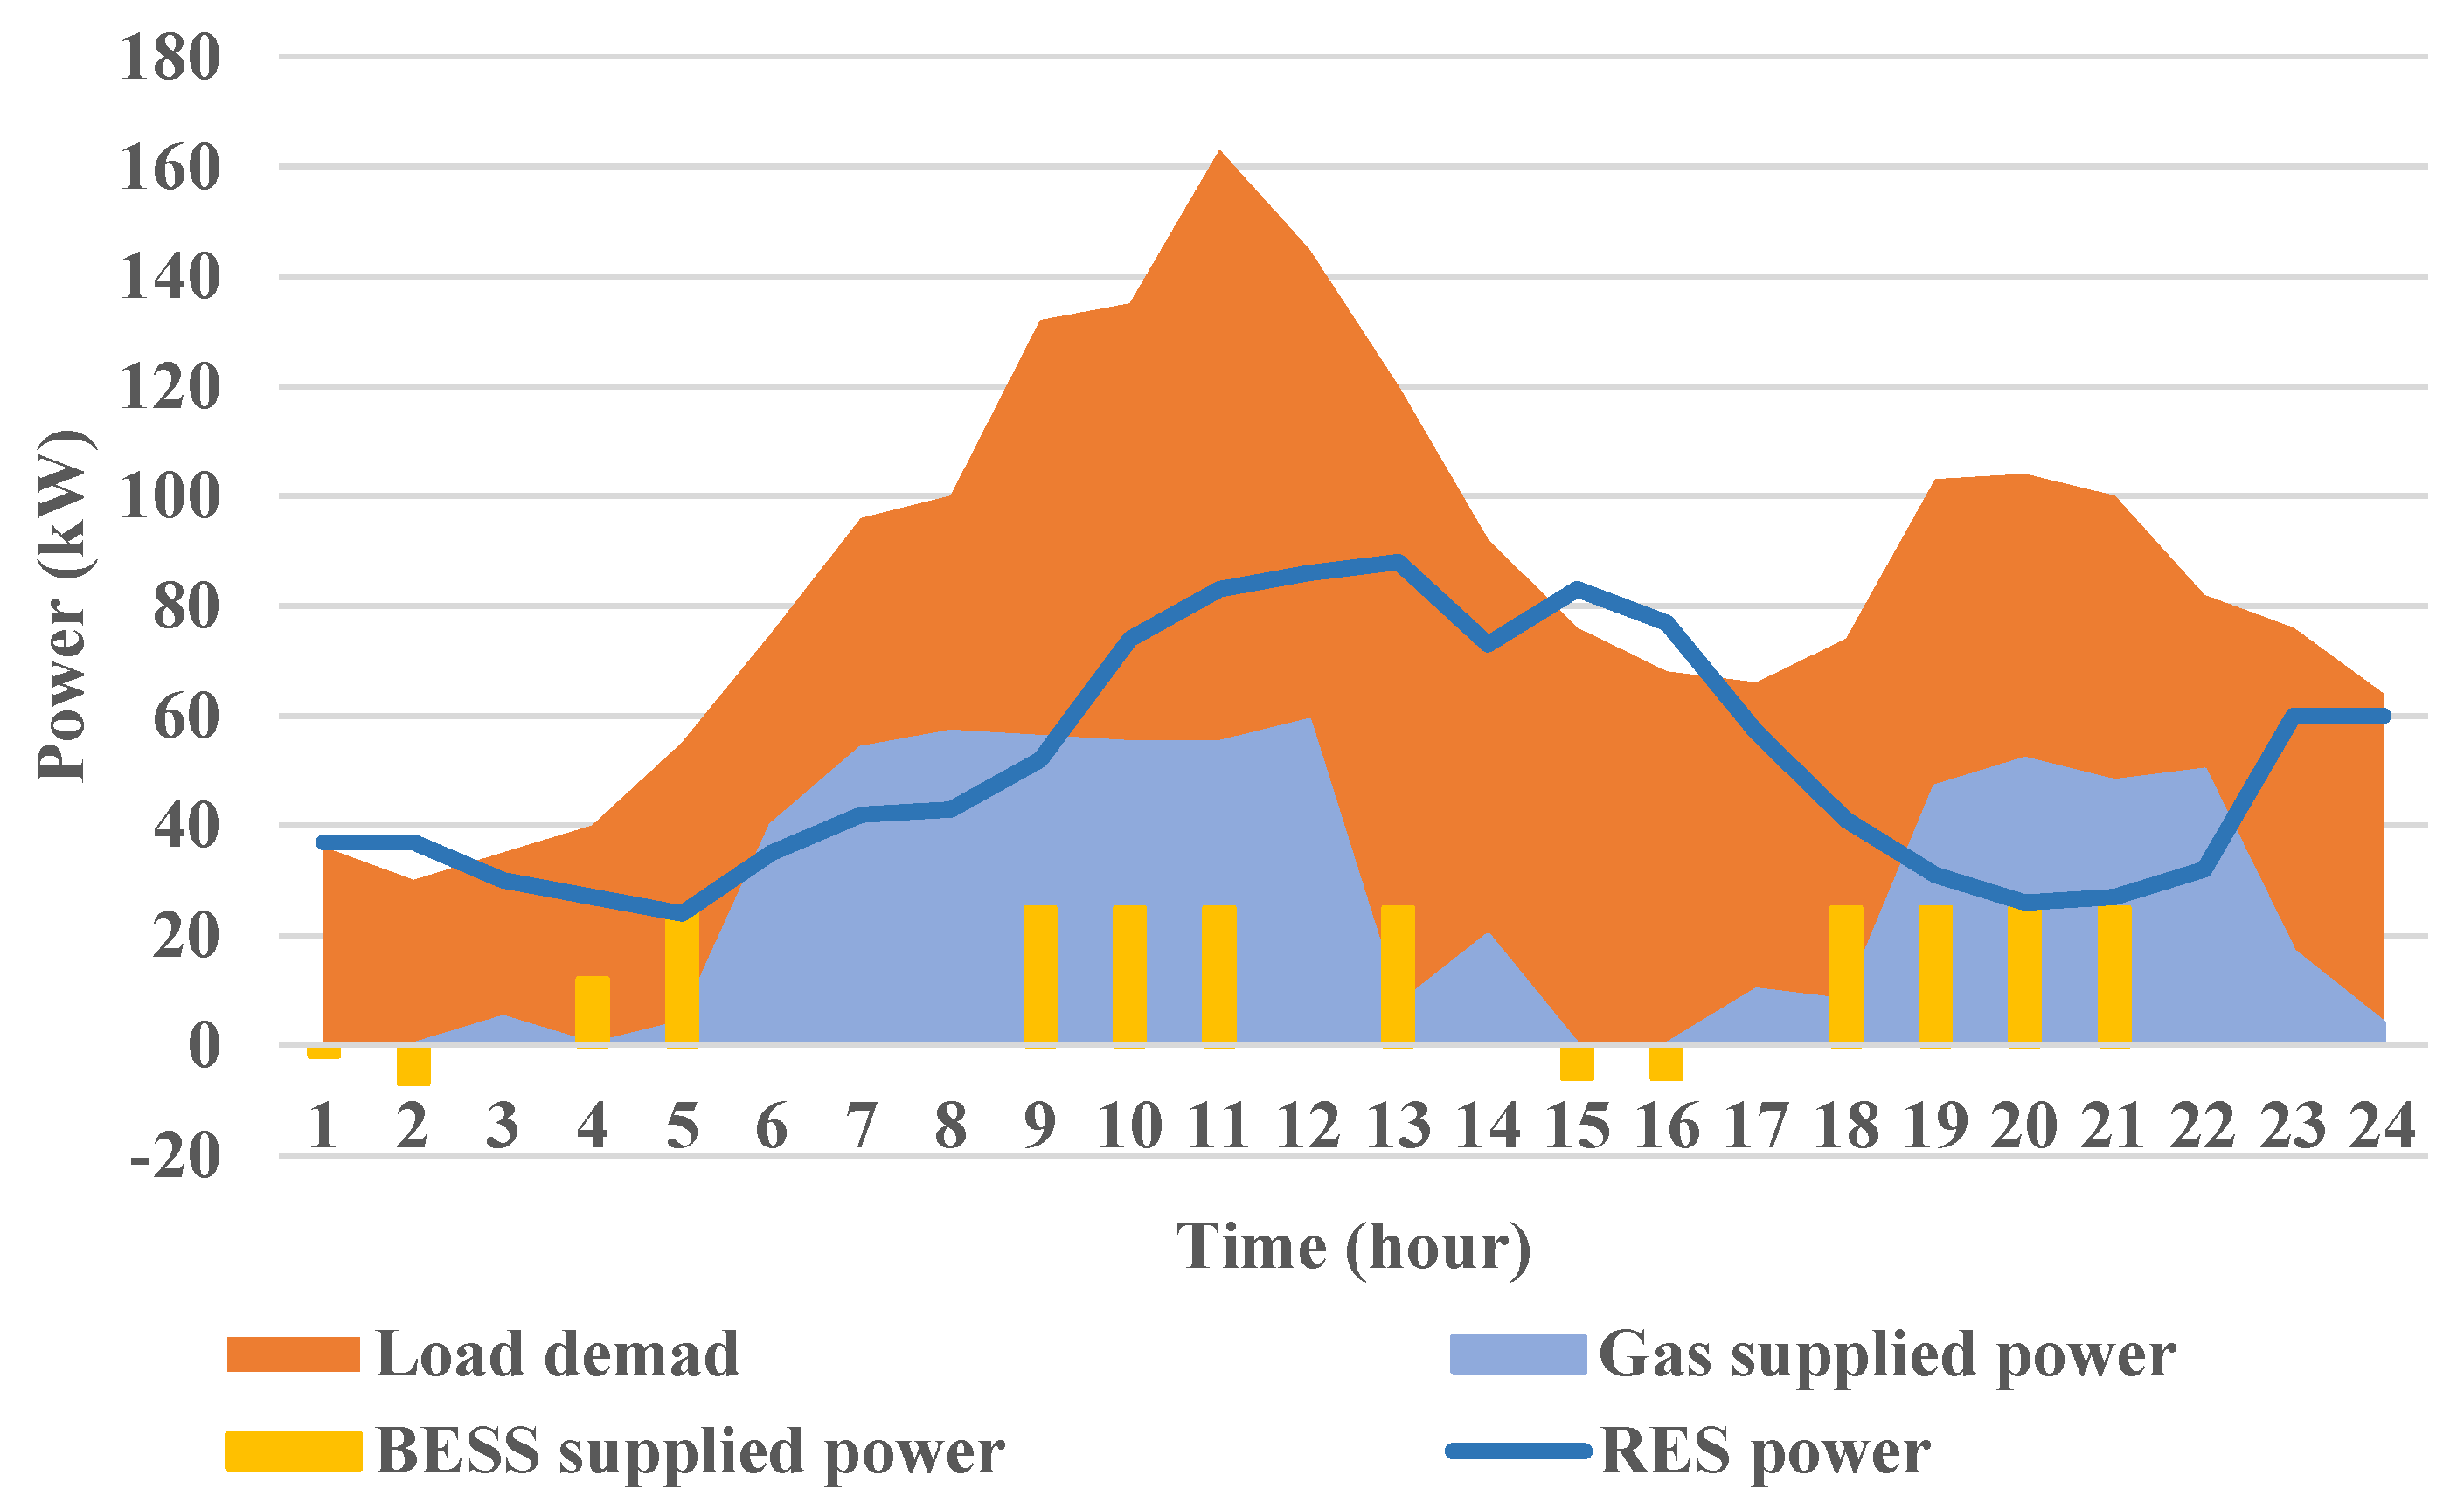
5.2. Scenario-2: BESS Linked Status, with a Firm Battery Size of 100 kWh
5.3. Scenario-3: BESS Connected Status with an Optimum Battery Capacity
6. Conclusions
Author Contributions
Funding
Data Availability Statement
Conflicts of Interest
References
- Oshnoei, A.; Kheradmandi, M.; Muyeen, S.M. Robust control scheme for distributed battery energy storage systems in load frequency control. IEEE Trans. Power Syst. 2020, 35, 4781–4791. [Google Scholar] [CrossRef]
- Apribowo, C.H.; Sarjiya, S.; Hadi, S.P.; Wijaya, F.D. Optimal Planning of Battery Energy Storage Systems by Considering Battery Degradation due to Ambient Temperature: A Review, Challenges, and New Perspective. Batteries 2022, 8, 290. [Google Scholar] [CrossRef]
- Boonluk, P.; Siritaratiwat, A.; Fuangfoo, P.; Khunkitti, S. Optimal siting and sizing of battery energy storage systems for distribution network of distribution system operators. Batteries 2020, 6, 56. [Google Scholar] [CrossRef]
- Dehghani, M.; Niknam, T.; Ghiasi, M.; Baghaee, H.R.; Blaabjerg, F.; Dragicevǐć, T.; Rashidi, M. Adaptive backstepping control for master-slave AC microgrid in smart island. Energy 2022, 246, 123282. [Google Scholar] [CrossRef]
- Grisales-Noreña, L.F.; Montoya, O.D.; Hernández, J.C. An Efficient EMS for BESS in Monopolar DC Networks with High Penetration of Renewable Generation: A Convex Approximation. Batteries 2023, 9, 84. [Google Scholar] [CrossRef]
- Ding, T.; Li, C.; Liu, X.; Xie, H.; Tang, Y.; Huang, C. Optimally allocating energy storage for active distribution networks to reduce the risk under N-1 contingencies. IEEE Syst. J. 2021, 15, 1518–1527. [Google Scholar] [CrossRef]
- Mohamad, F.; Teh, J.; Lai, C.M. Optimum allocation of battery energy storage systems for power grid enhanced with solar energy. Energy 2021, 223, 120105. [Google Scholar] [CrossRef]
- Khosravi, M.; Afsharnia, S.; Farhangi, S. Optimal sizing and technology selection of hybrid energy storage system with novel dispatching power for wind power integration. Int. J. Electr. Power Energy Syst. 2021, 127, 1106660. [Google Scholar] [CrossRef]
- Zarrilli, D.; Giannitrapani, A.; Paoletti, S.; Vicino, A. Energy storage operation for voltage control in distribution networks: A receding horizon approach. IEEE Trans. Control Syst. Technol. 2017, 26, 599–609. [Google Scholar] [CrossRef]
- Ghiasi, M.; Dehghani, M.; Niknam, T.; Baghaee, H.R.; Padmanaban, S.; Gharehpetian, G.B.; Aliev, H. Resiliency/cost-based optimal design of distribution network to maintain power system stability against physical attacks: A practical study case. IEEE Access 2021, 9, 43862–43875. [Google Scholar] [CrossRef]
- Karimi, H.; Niknam, T.; Aghaei, J.; GhasemiGarpachi, M.; Dehghani, M. Switches optimal placement of automated distribution networks with probability customer interruption cost model: A case study. Int. J. Electr. Power Energy Syst. 2021, 127, 106708. [Google Scholar] [CrossRef]
- Khan, H.; Nizami, I.F.; Qaisar, S.M.; Waqar, A.; Krichen, M.; Almaktoom, A.T. Analyzing optimal battery sizing in microgrids based on the feature selection and machine learning approaches. Energies 2022, 15, 7865. [Google Scholar] [CrossRef]
- Ramos, F.; Pinheiro, A.; Nascimento, R.; de Araujo Silva Junior, W.; Mohamed, M.A.; Annuk, A.; Marinho, M.H. Development of Operation Strategy for Battery Energy Storage System into Hybrid AC Microgrids. Sustainability 2022, 14, 13765. [Google Scholar] [CrossRef]
- Parmeshwarappa, P.; Gundlapalli, R.; Jayanti, S. Power and energy rating considerations in integration of flow battery with solar PV and residential load. Batteries 2021, 7, 62. [Google Scholar] [CrossRef]
- Ghiasi, M.; Niknam, T.; Dehghani, M.; Baghaee, H.R.; Wang, Z.; Ghanbarian, M.M.; Blaabjerg, F.; Dragicevic, T. Multipurpose FCS Model Predictive Control of VSC-Based Microgrids for Islanded and Grid-Connected Operation Modes. IEEE Syst. J. 2022, 1–12. [Google Scholar] [CrossRef]
- Garip, S.; Ozdemir, S. Optimization of PV and Battery Energy Storage Size in Grid-Connected Microgrid. Appl. Sci. 2022, 12, 8247. [Google Scholar] [CrossRef]
- Li, B.; Deng, H.; Wang, J. Optimal scheduling of microgrid considering the interruptible load shifting based on improved biogeography-based optimization algorithm. Symmetry 2021, 13, 1707. [Google Scholar] [CrossRef]
- Adetunji, K.E.; Hofsajer, I.W.; Abu-Mahfouz, A.M.; Cheng, L. Category-based multiobjective approach for optimal integration of distributed generation and energy storage systems in distribution networks. IEEE Access 2021, 9, 28237–28250. [Google Scholar] [CrossRef]
- Abdulgalil, M.A.; Khalid, M.; Alismail, F. Optimal sizing of battery energy storage for a grid-connected microgrid subjected to wind uncertainties. Energies 2019, 12, 2412. [Google Scholar] [CrossRef]
- Alawode, B.O.; Salman, U.T.; Khalid, M. A flexible operation and sizing of battery energy storage system based on butterfly optimization algorithm. Electronics 2022, 11, 109. [Google Scholar] [CrossRef]
- Elsir, M.T.; Abdulgalil, M.A.; Al-Awami, A.T.; Khalid, M. Sizing and allocation for solar energy storage system considering the cost optimization. In Proceedings of the 2019 8th International Conference on Renewable Energy Research and Applications (ICRERA), Brasov, Romania, 3–6 November 2019; pp. 407–412. [Google Scholar]
- Askari, M.; Dehghani, M.; Razmjoui, P.; GhasemiGarpachi, M.; Tahmasebi, D.; Ghasemi, S. A novel stochastic thermo-solar model for water demand supply using point estimate method. IET Renew. Power Gener. 2022, 16, 3559–3572. [Google Scholar] [CrossRef]
- Wong, L.A.; Ramachandaramurthy, V.K.; Walker, S.L.; Taylor, P.; Sanjari, M.J. Optimal placement and sizing of battery energy storage system for losses reduction using whale optimization algorithm. J. Energy Storage 2019, 26, 100892. [Google Scholar] [CrossRef]
- Nimma, K.S.; Al-Falahi, M.D.; Nguyen, H.D.; Jayasinghe, S.D.; Mahmoud, T.S.; Negnevitsky, M. Grey wolf optimization-based optimum energy-management and battery-sizing method for grid-connected microgrids. Energies 2018, 11, 847. [Google Scholar] [CrossRef]
- Simon, D. Biogeography-based optimization. IEEE Trans. Evol. Comput. 2008, 12, 702–713. [Google Scholar] [CrossRef]
- Sandelic, M.; Stroe, D.I.; Iov, F. Battery storage-based frequency containment reserves in large wind penetrated scenarios: A practical approach to sizing. Energies 2018, 11, 3065. [Google Scholar] [CrossRef]
- Zhang, N.; Yang, N.C.; Liu, J.H. Optimal Sizing of PV/Wind/Battery Hybrid Microgrids Considering Lifetime of Battery Banks. Energies 2021, 14, 6655. [Google Scholar] [CrossRef]
- Keleshteri, S.F.; Niknam, T.; Ghiasi, M.; Chabok, H. New optimal planning strategy for plug-in electric vehicles charging stations in a coupled power and transportation network. J. Eng. 2023, 2023, e12252. [Google Scholar] [CrossRef]
- Gomez, L.A.; Grilo, A.P.; Salles, M.B.; Sguarezi Filho, A.J. Combined control of DFIG-based wind turbine and battery energy storage system for frequency response in microgrids. Energies 2020, 13, 894. [Google Scholar] [CrossRef]
- Theiler, M.; Schneider, D.; Endisch, C. Experimental Investigation of State and Parameter Estimation within Reconfigurable Battery Systems. Batteries 2023, 9, 145. [Google Scholar] [CrossRef]
- Ghiasi, M. Detailed study, multi-objective optimization, and design of an AC-DC smart microgrid with hybrid renewable energy resources. Energy 2019, 169, 496–507. [Google Scholar] [CrossRef]
- Guo, W.; Chen, M.; Wang, L.; Mao, Y.; Wu, Q. A survey of biogeography-based optimization. Neural Comput. Appl. 2017, 28, 1909–1926. [Google Scholar] [CrossRef]


| DG | |||||
|---|---|---|---|---|---|
| 0 | 40 | 1 × 10⁻⁴ | .38 × 10−4 | 0.3 | |
| 0 | 20 | 1 × 10⁻⁴ | 4.79 × 10⁻⁴ | 0.5 | |
| 0 | 10 | 1 × 10⁻⁴ | 4.9 × 10⁻⁴ | 0.4 |
| Variable | Primary Capital Cost ($/kWh) | Round-Trip Efficiency (%) | Primary SOC (%) | (%) | (kW) |
|---|---|---|---|---|---|
| Value | 635 | 90 | 80 | 90 | 25 |
| Variable | Maintenance cost ($/kWh)/Year | Interest rate (%) | Lifetime (Year) | (%) | (kW) |
| Value | 25 | 6 | 3 | 10 | 10 |
| Method | Operational Costs ($) | Scheduling Costs ($) | ||||
|---|---|---|---|---|---|---|
| Best | Mean | Worst | Best | Mean | Worst | |
| IBBOA | 159.6 | 160.3 | 161.8 | 113.2 | 114.1 | 115.4 |
| BBOA | 198.4 | 206.7 | 215.3 | 161.7 | 168.5 | 177.1 |
| PSO | 226.8 | 231.2 | 235.6 | 184.9 | 188.7 | 195.0 |
| GA | 237.1 | 248.5 | 262.6 | 205.3 | 213.2 | 228.6 |
Disclaimer/Publisher’s Note: The statements, opinions and data contained in all publications are solely those of the individual author(s) and contributor(s) and not of MDPI and/or the editor(s). MDPI and/or the editor(s) disclaim responsibility for any injury to people or property resulting from any ideas, methods, instructions or products referred to in the content. |
© 2023 by the authors. Licensee MDPI, Basel, Switzerland. This article is an open access article distributed under the terms and conditions of the Creative Commons Attribution (CC BY) license (https://creativecommons.org/licenses/by/4.0/).
Share and Cite
Shi, Y.; Cheng, S.; Chen, C.; Luo, Y.; Zhao, J.; Ghiasi, M. Modified Biogeography Optimization Strategy for Optimal Sizing and Performance of Battery Energy Storage System in Microgrid Considering Wind Energy Penetration. Batteries 2023, 9, 254. https://doi.org/10.3390/batteries9050254
Shi Y, Cheng S, Chen C, Luo Y, Zhao J, Ghiasi M. Modified Biogeography Optimization Strategy for Optimal Sizing and Performance of Battery Energy Storage System in Microgrid Considering Wind Energy Penetration. Batteries. 2023; 9(5):254. https://doi.org/10.3390/batteries9050254
Chicago/Turabian StyleShi, Yingchun, Shu Cheng, Chunyang Chen, Yu Luo, Jundong Zhao, and Mohammad Ghiasi. 2023. "Modified Biogeography Optimization Strategy for Optimal Sizing and Performance of Battery Energy Storage System in Microgrid Considering Wind Energy Penetration" Batteries 9, no. 5: 254. https://doi.org/10.3390/batteries9050254