1. Introduction
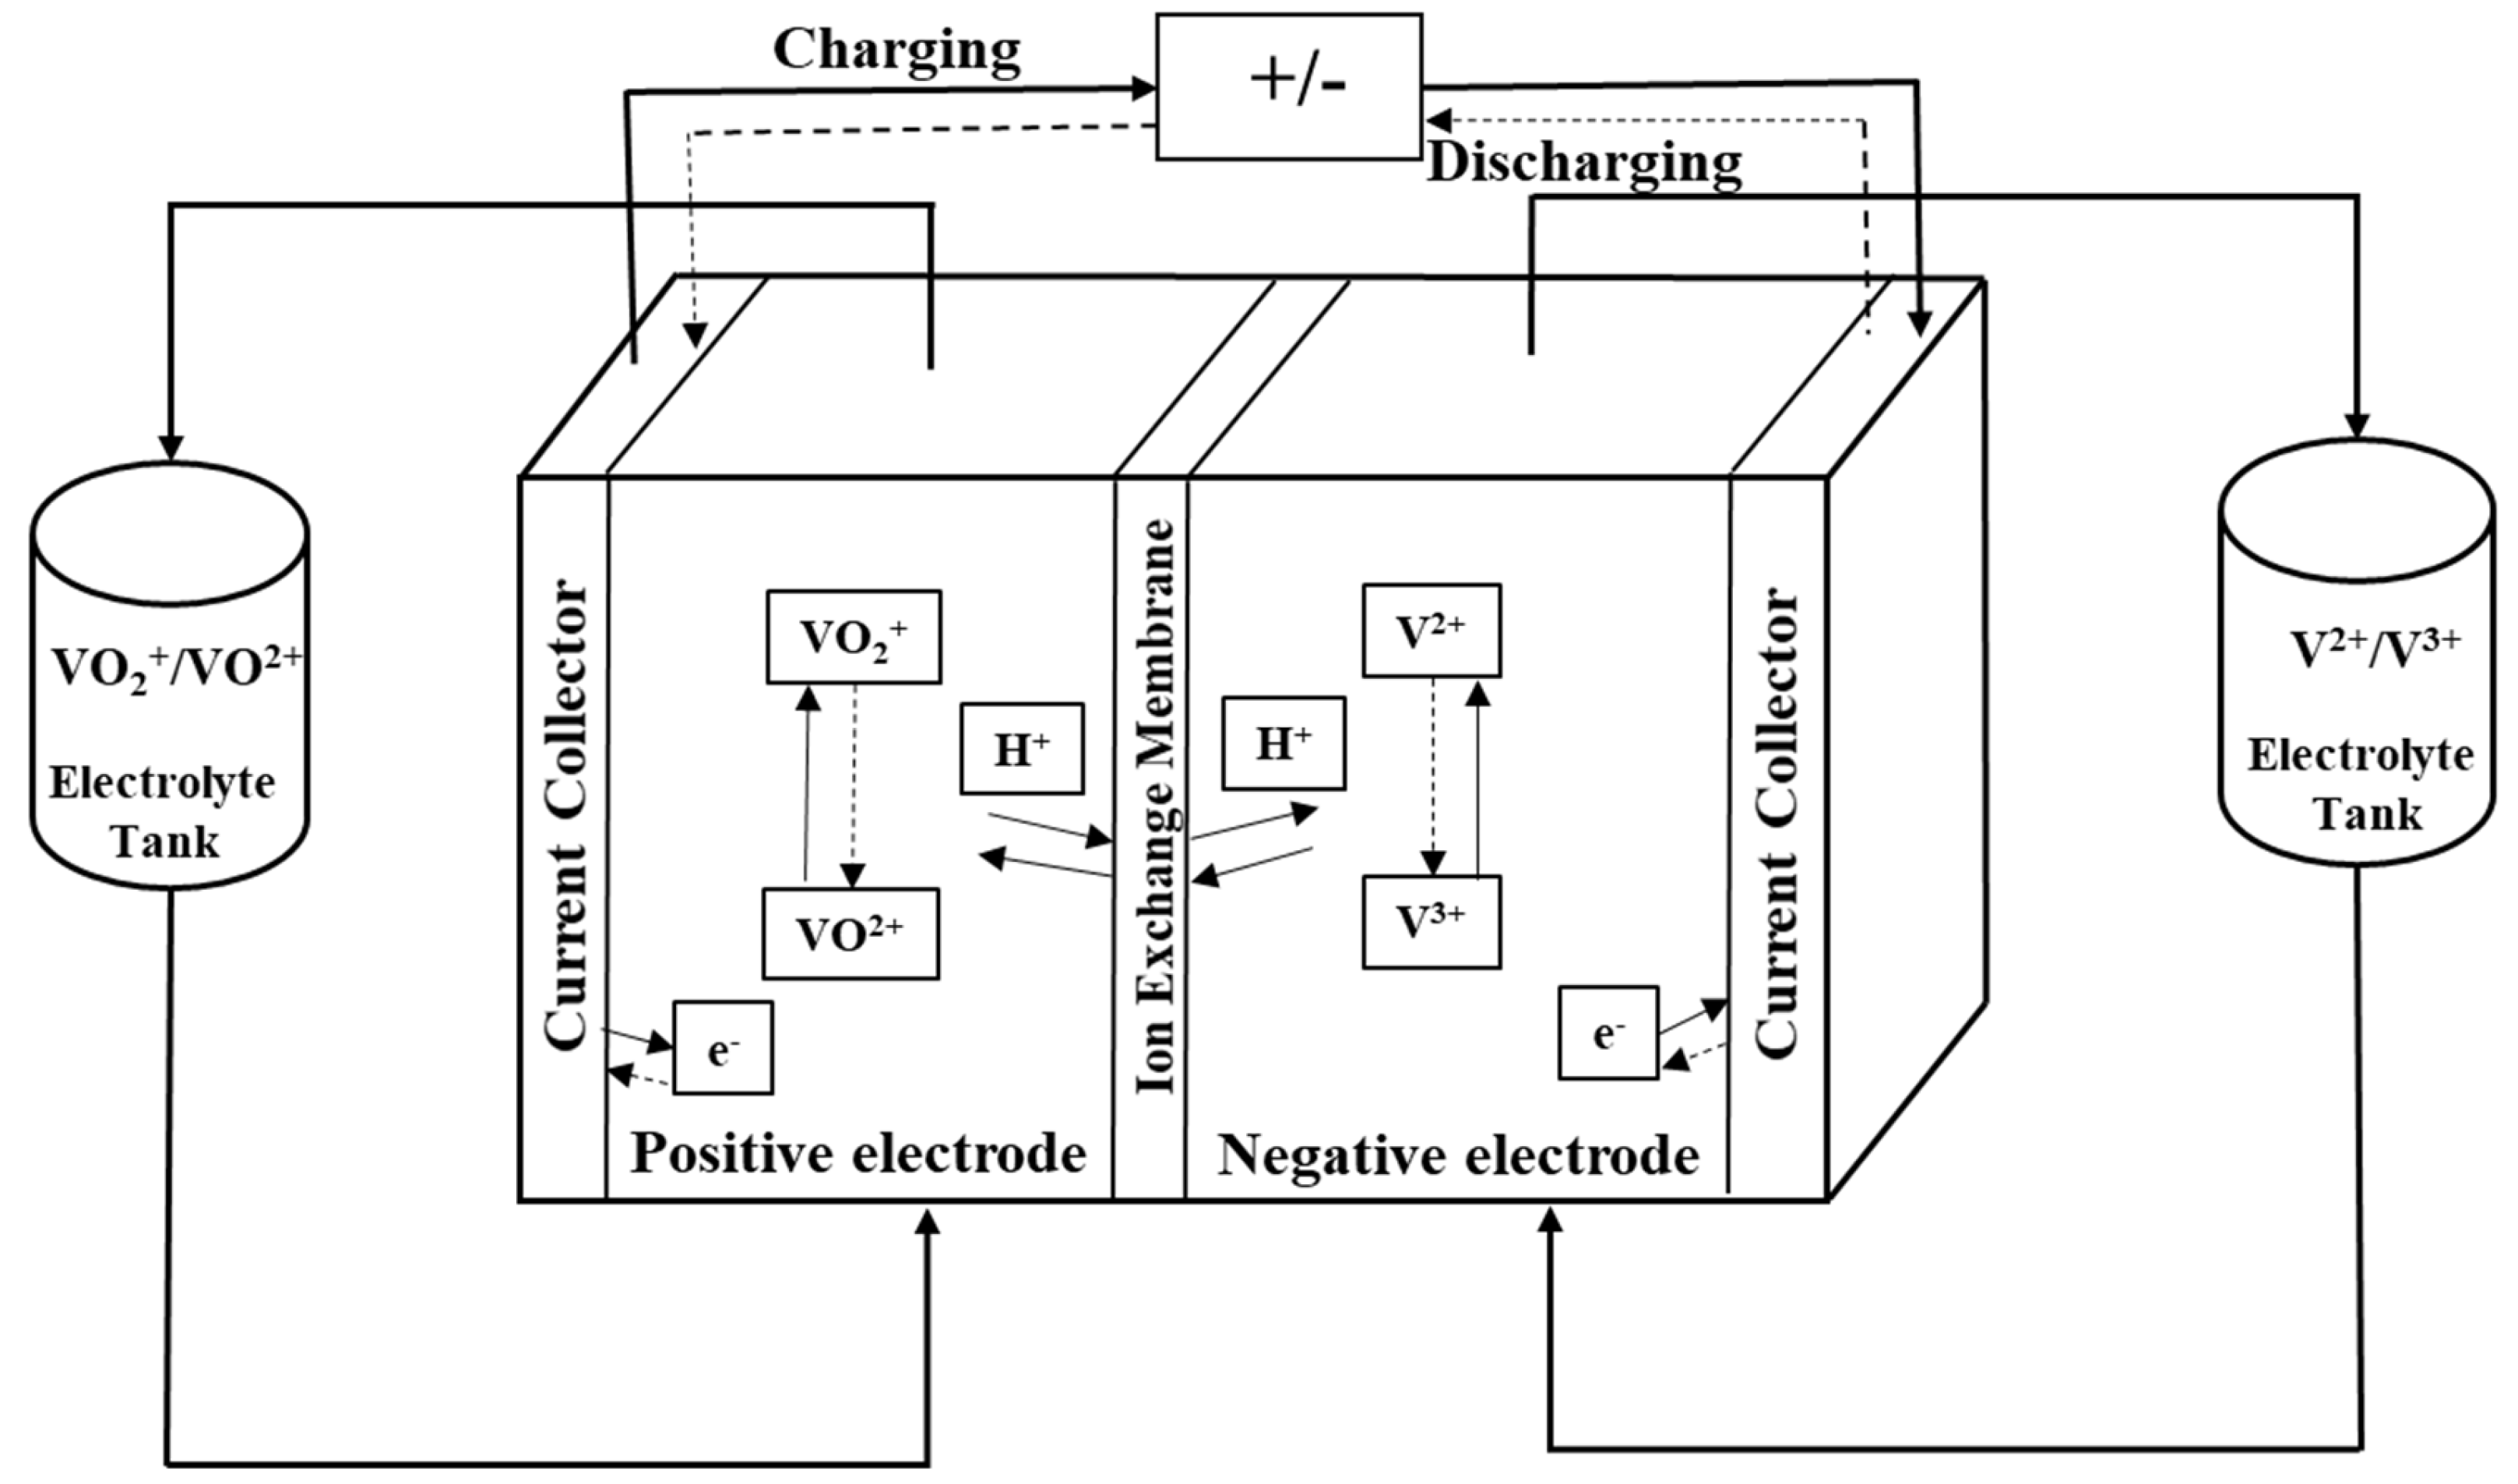
In flow batteries, electrical energy is stored in and retrieved from liquid electrolytes that are circulated through an electrochemical cell containing an anode, a cathode, an ionic conductor with a separator, and an external pathway for electrons to flow from positive electrodes to negative electrodes during charging and vice versa during discharging. The heterogeneous charge transfer reactions that occur on the fibers of an electronic conductor, typically without a catalyst, are responsible for the functioning of a flow battery. Vanadium redox flow batteries (VRFBs) are one example of redox flow batteries that have reached the stage of commercial deployment for grid-scale application. Extensive research has been carried out on several variants of VRFB over the past few decades. This battery was invented by Maria Skyllas-Kazacos and co-researchers at the University of New South Wales, Australia [
1] in the mid-1980s and features two tanks in which the positive and the negative electrolytes are stored. A schematic representation is given in
Figure 1. The positive electrolyte is a mixture of VO
2+ and VO
2+ ions in dilute sulfuric acid, and the negative electrolyte has a mixture of V
3+ and V
2+ ions in dilute sulfuric acid. During the discharge of the battery, V
2+ is transformed to V
3+ on the negative electrode and VO
2+ is transformed to VO
2+ on the positive electrode; the reverse reactions involving the same ions occur during charge, as listed below:
The all-liquid VRFB is particularly suited for large-scale energy storage applications due to safe operation. During the reactions, vanadium ions are reduced and oxidized in the liquid electrolytes; no solid deposition or dissolution is involved. However, there is crossover of vanadium species and water through the membranes, which results in self-discharge of the battery. Many studies on membranes of VRFB have focused on the reduction of cross-contamination by making the membrane as efficient a barrier layer to the vanadium species as possible [
4]. The relatively simple construction of the cell enables it to be scaled up to large cell sizes and stacks [
5,
6]. VRFB systems are expected to be cost-competitive with Li-ion batteries when deployed in GWh-scale storage systems [
7]. Large-scale systems are typically deployed in outdoor environments and are subject to climatic influences, especially in cases where there is no active temperature control system or when it fails to perform effectively because of non-availability of thermal energy. In such cases, the performance of the flow battery will be affected. Several studies [
8,
9,
10,
11] indicate that there can be a significant loss of battery performance in terms of both energy and power. A cold VRFB may not be able to be charged or deliver power at rated conditions, and its energy storage capacity may also be severely compromised. Zhang et al. [
8] highlight the contrary effect: they show, through their experimental study on a 5 cm
2 VRFB cell operated at 40 mA/cm
2, that significant gains in energy efficiency and peak power density can be obtained as the cell operating temperature is increased from 15 °C to 55 °C. Hence, the emphasis of this work is to develop a model that can predict the electrochemical performance of a VRFB cell at low operating temperatures.
The prediction of cell level performance of a VRFB using comprehensive one-, two- or three-dimensional models has been reported in the literature [
2,
12,
13]. Basic conservation laws and kinetic models of electrochemical reactions were used by Shah et al. [
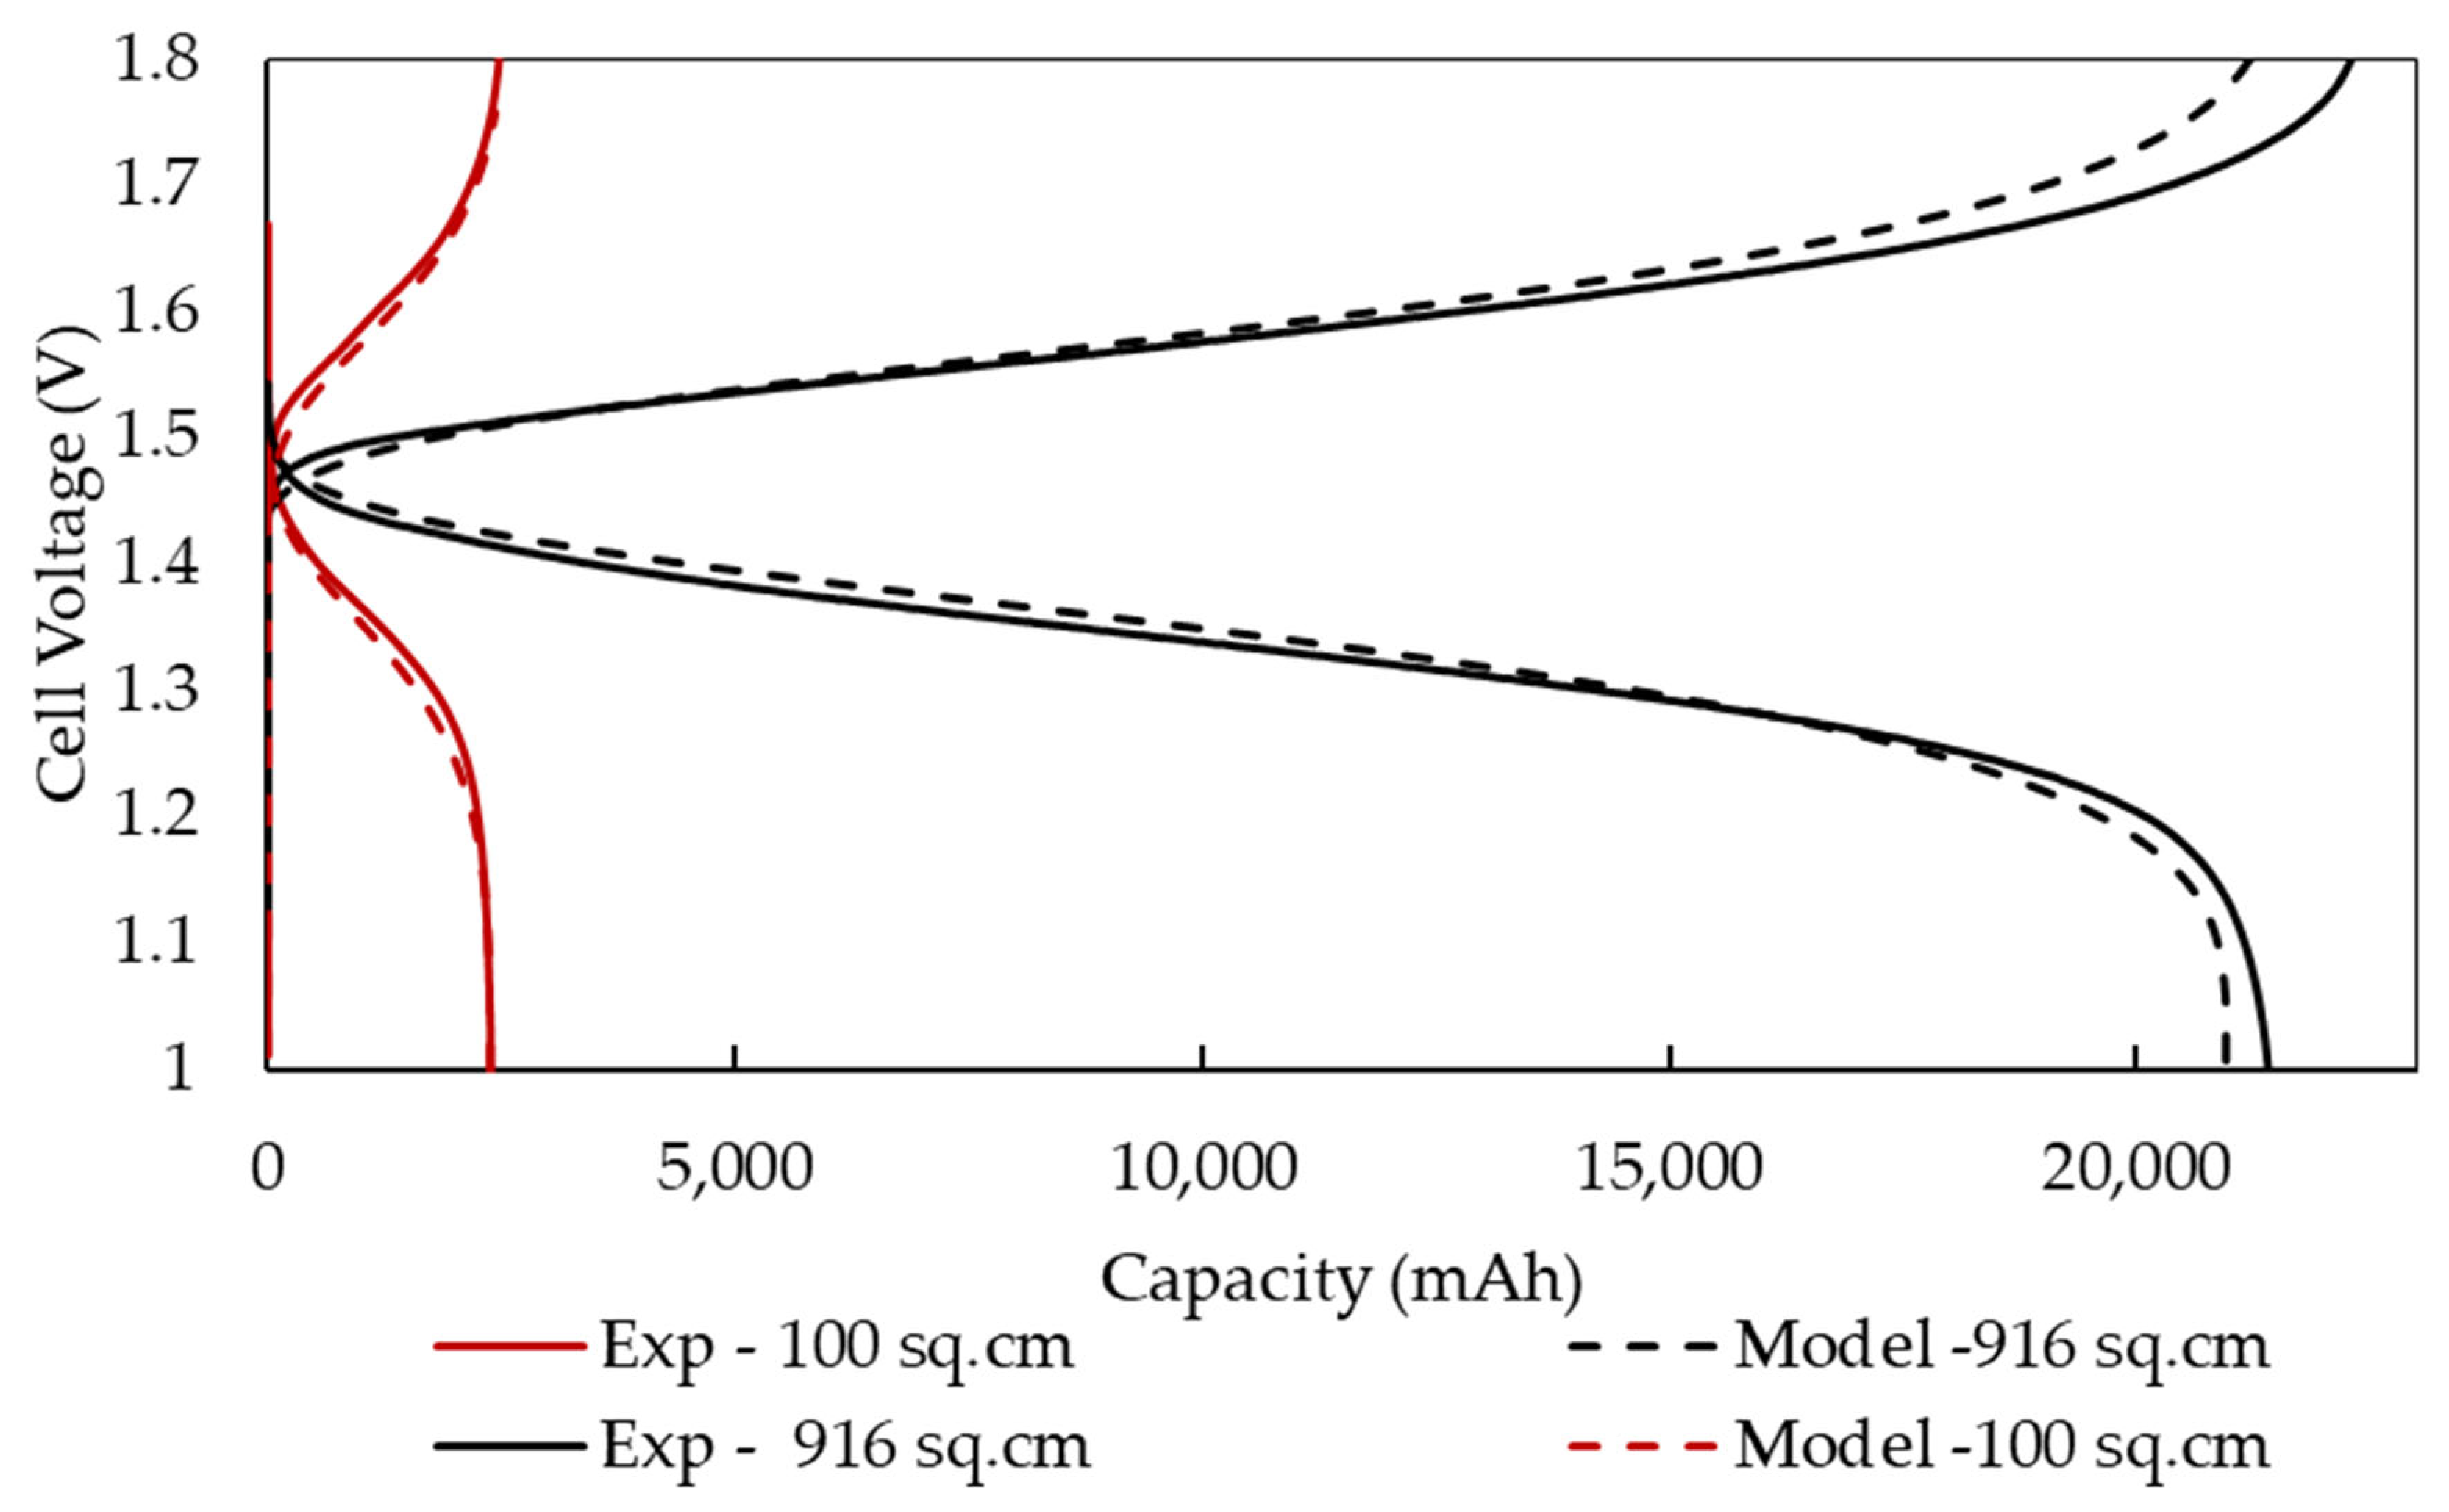
12] to create a simple mathematical model. This model predicted the relationship between cell voltage and electrolyte flow rate, concentration, and electrode porosity. Overpotential and water concentration results were displayed as contour plots. The experimental results from a 100 cm
2 active area cell at room temperature were used to validate the model predictions. You et al. [
2] developed a 2D static model of a VRFB single cell by combining reaction kinetics and conservation laws. The goal of this study is to ascertain the electrochemical performance of cells as a function of the current density and local mass transfer coefficient. Sathisha and Dalal [
13] used a 2D unsteady-state isothermal model to analyze the performance of the VRFB through numerical techniques. The results corresponding to changes in electrode porosity, current, concentration, and electrolyte flow rate were predicted using this model.
As may be expected, proper electrolyte circulation is one of the crucial factors in redox flow batteries. Apart from its effect on electrochemical performance, electrolyte circulation has a bearing on the system efficiency, as the energy used to pump the electrolytes adds to the cost. Several modelling studies can be found in the literature on optimization and control of electrolyte flow. Tang et al. [
14] used a concentration overpotential model to relate flow rate to the concentration overpotential, thereby determining the best flow rate to obtain maximum energy efficiency and the least pumping loss. Khazaeli et al. [
15] developed a 2D numerical model to investigate the effects of electrolyte flow rate on battery voltage, pressure loss, and depth of discharge of a six-cell stack of VRFBs. They discovered that increasing the flow velocity of electrolytes resulted in a 50 mV rise in cell voltage. Additionally, as the flow rate of the electrolytes increased, the maximum depth of discharge and pressure drop increased. In order to calculate the power losses of the VRFB stack, Wang et al. [
16] developed a transient model that estimates the overpotential as a function of the input current, electrolyte flow rate, and vanadium ion concentration. They developed a dynamic method to determine the optimal flow rate for the various discharge powers and states of charge (
SOC). Analytical formulas were used by Murthy et al. [
17] to evaluate the concentration overpotential in VRFB. By connecting the surface and bulk concentrations of vanadium species using the Nernst and Butler-Volmer equations, they could calculate the concentration overpotential. Experimental data were used to validate a dimensionless model that included derived equations for the mass transfer losses. The Butler–Volmer equation’s overpotential was twice as large as the Nernst equation’s overpotential. In order to increase a battery’s charge retention capacity and electrochemical performance, one must have a thorough understanding of the complex chemistry of the vanadium electrolyte. This is done by minimizing inhibitory actions such as self-discharge and promoting favorable processes at the electrode–electrolyte interfaces [
18].
In the literature, there has been much work done on the thermal modelling of VRFBs. This has a significant impact on battery management systems. The temperature in the stack must be kept at an appropriate level to prevent the precipitation of vanadium electrolytes. The majority of thermal modelling forecasts are conducted between 25 and 60 °C. A thermal model of VRFBs was presented by Tang et al. [
19], a utilizing mass transfer theory and thermodynamics. They performed battery simulations at various ambient temperatures and a constant electrolyte temperature. Their model was able to efficiently predict the variations of the stack temperature at different charge and discharge currents. Predictably, decreasing flow rate and increasing current resulted in a rise in the battery temperature. They recommended regulation of the values of thermal properties of reservoirs and surface area to optimize the heat flow and reduce overheating of the VRFB stack.
The experimental measurement of vanadium ion diffusivities for the temperature range of −10 °C to 60 °C was done first by Yin et al. [
10], who proposed empirical models for diffusivity and mobility of ions in the electrolytes. These were used to discuss the effect of temperature on the electrochemical performance of a VRFB as measured in terms of the coulombic efficiency, voltage efficiency, and energy efficiency of the cell at various temperatures. The outcomes of a 2D mathematical model for the VRFB stack were presented by Zhang et al. [
20]. They used the flow network equivalence method to determine the effect of non-uniform flow distribution of electrolytes in the flow-field. Simulation results comprising stack voltage and electrolyte reservoir temperature complied with the experimental data from the literature under various operation conditions. The results showed that temperature variation of the stack was around 10 °C at different current densities and flow rates.
The membrane, electrodes, and vanadium electrolyte are the three crucial parts of VRFB. A specified ratio of vanadium salt and aqueous sulfuric acid constitutes the electrolyte used in VRFB. The specific proportion of vanadium, sulfuric acid, and water (deionized) influences the solubility—and thereby the maximum energy density—and proton conductivity of the electrolyte. A porous carbon felt is used as an electrode to transport electrons, reactants, and products. An ion (proton) exchange membrane is maintained between the electrodes and serves to transport protons from the positive electrode to the negative electrode during charging, and vice versa. Typical proton exchange membranes used in VRFBs also allow water to cross over, which is necessary to maintain water balance in the cell. Cross-over of vanadium species also occurs across the membrane, although at a far slower rate. Effective transport of reactants and protons, both neutral and charged, is crucial for the efficient operation of the VRFB cell, and the mechanism of transport can be species-dependent. Since the transport coefficients of various species are temperature-dependent, the overall polarization characteristics of the cell are also temperature dependent. In this work, we propose a mathematical model that captures this temperature dependence using a physics-based approach that incorporates the known/derived influence of different overpotentials on temperature.
2. Description of the Model
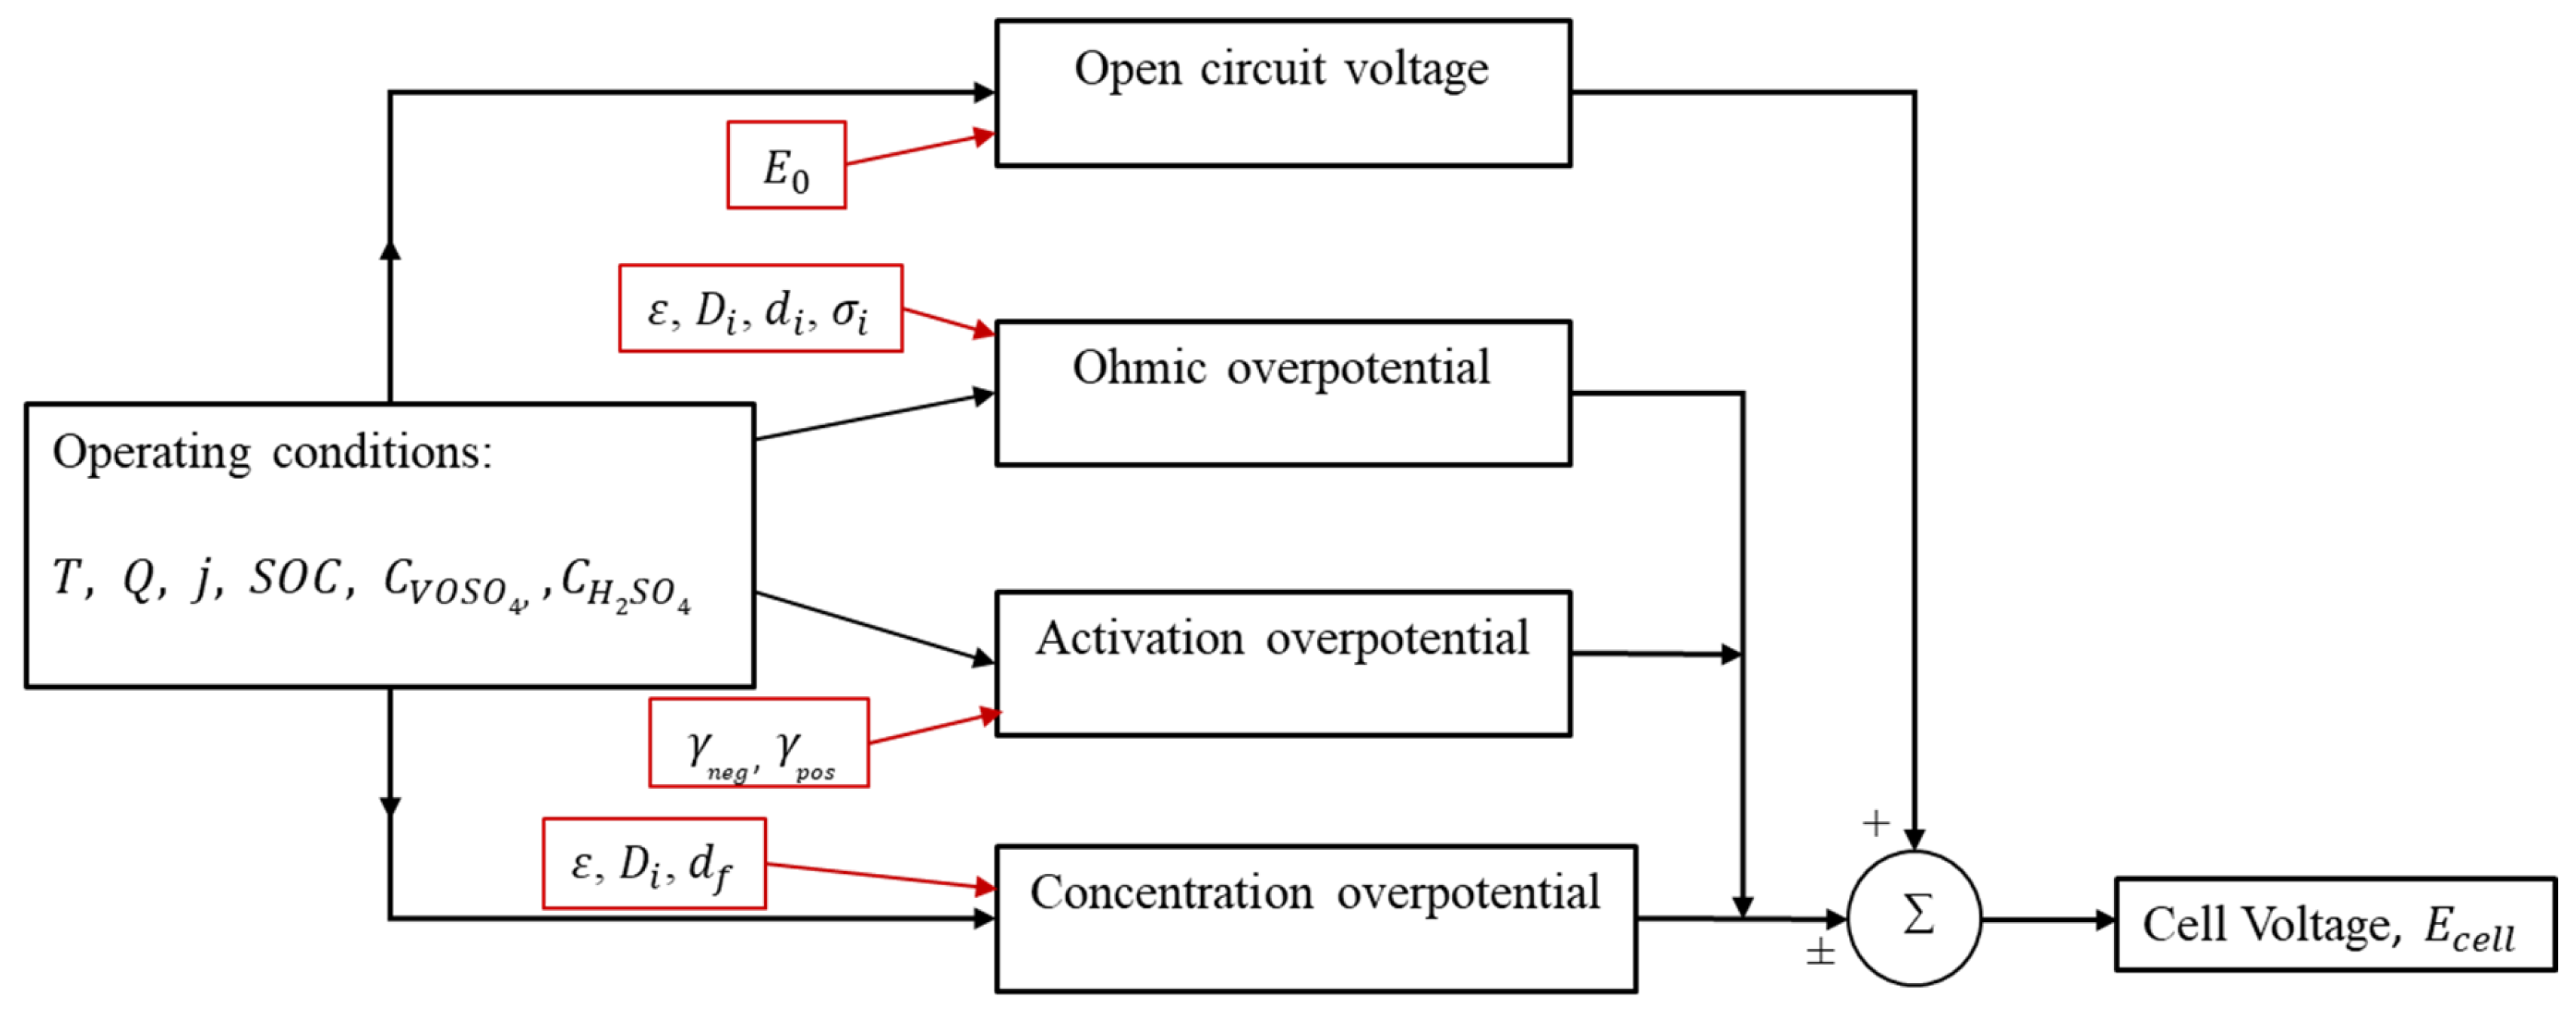
The voltage of the cell (
Ecell) is affected by the resistances offered by the electrode, membrane, and electrolyte. Overpotentials associated with reaction kinetics and mass transfer also affect cell voltage. The open circuit voltage (
OCV) itself is affected by a number of factors, including the operating temperature of the cell. Using the conventional division of overpotentials into ohmic overpotential (
ηOhmic), activation overpotential (
ηAct), and concentration overpotential (
ηConc), the cell voltage can be represented as
Here, the last two quantities on the right hand side (RHS) of the equation need to be evaluated separately for each electrode, and all four variables are typically expressed as functions of current density, flow rate, and electrolyte composition. Evaluation of each of these individually through physics-based sub-models allows temperature-related corrections to be incorporated at a fundamental level, thereby extending the prediction capability to low temperatures. Neglecting temperature variations within the cell, we develop additional data-driven correlations to evaluate each of these so that is made sensitive to the current density, temperature, and flow rates of electrolytes in addition to the composition of the cell. To simplify the model, the following assumptions are considered:
Electrolyte flow rate is uniform, and concentration variations over the cell are small and can be neglected.
The electrolyte is uniformly mixed, and the concentration of vanadium species is the same throughout.
Since vanadium ion cross-over and self-discharge of the battery are slow processes, these are neglected in the present study, and the membrane is assumed to be impermeable to vanadium ions.
Oxygen and hydrogen evolution is negligible, and no side reactions occur other than those listed in Equations (1)–(3).
The flow chart of the model used to determine the potential of VRFBs is shown in
Figure 2, which also identifies important parameters appearing in the model. Various parameters appearing in the model are given in
Table 1. The components of the model are given below.
2.1. Open Circuit Voltage (V)
The voltage across the battery at electrochemical equilibrium is called the open circuit voltage (
OCV). It depends primarily on the temperature and concentration of the reacting species. The Nernst equation is used to obtain the open circuit voltage of any electrochemical reaction:
where
E0 is the standard electrochemical potential in Volts (V);
R is the universal gas constant, having a value of 8.314 J/(mol K);
T is the temperature in Kelvin (K);
n is the charge;
F is Faraday’s constant, having a value of 96,486 A/(mol·s);
Cproducts and
Creactants are the concentration of products and reactants in mol/L, respectively [
21]. The Nernst equation for the overall reaction (Equation (3)) of the VRFB is given below.
It has been suggested [
21] that the above Nernst equation needs to be modified to account for the Donnan potential that exists across the membrane because of the non-uniform proton concentration in the anolyte and catholyte. Taking
and
as the proton concentration catholyte and anolyte, respectively, the modified Nernst equation is given by
The concentrations of the various ionic species appearing in Equation (7) can be related to the State of charge (
SOC), which is the ratio of remaining capacity in the battery to the maximum charge stored in the battery. For a VRFB system, in which charge transfer reactions are restricted to those involving the four vanadium species participating in Equations (1) and (2), the
SOC can be expressed as
In this study, we have considered that the electrolyte is prepared using vanadium oxysulphate crystals and sulfuric acid. The initial concentration of protons is estimated based on electrolyte preparation methods. The changes in proton concentration in the anode and cathode are given by Equations (9) and (10) [
21]:
where
CV is the initial concentration of vanadium in the electrolyte.
The reversible cell voltage
ET changes with temperature. At an arbitrary temperature
T ≠
T0, reversible cell voltage can be given by Equation (11) [
22]:
where Δs
o, the change in entropy of the overall reaction of VRFB at reference conditions, is equal to −121.7 J/mol K [
23]. At an arbitrary temperature
T ≠
T0, the Nernst equation must be modified to
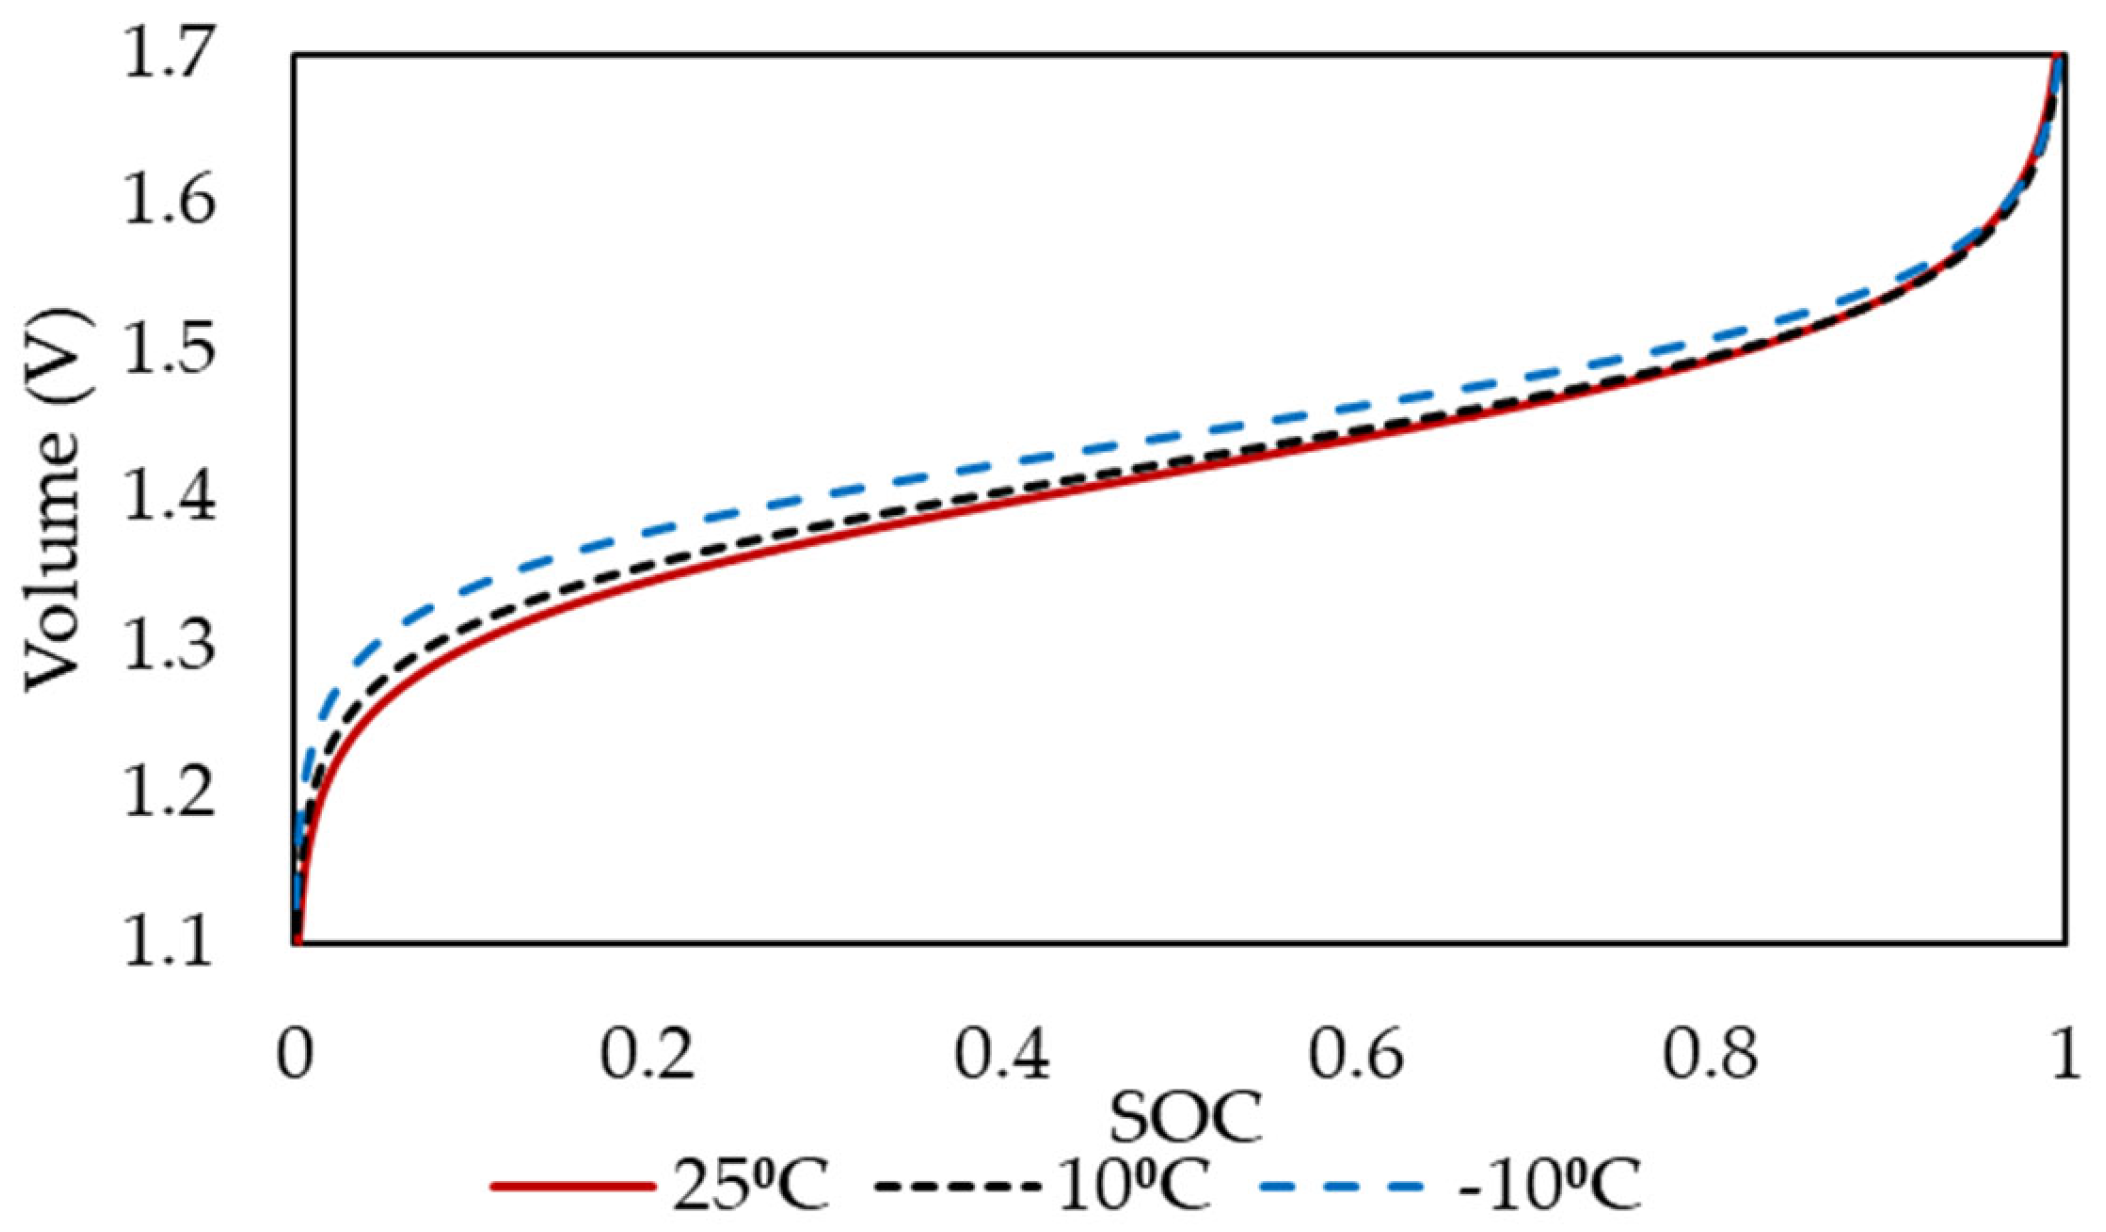
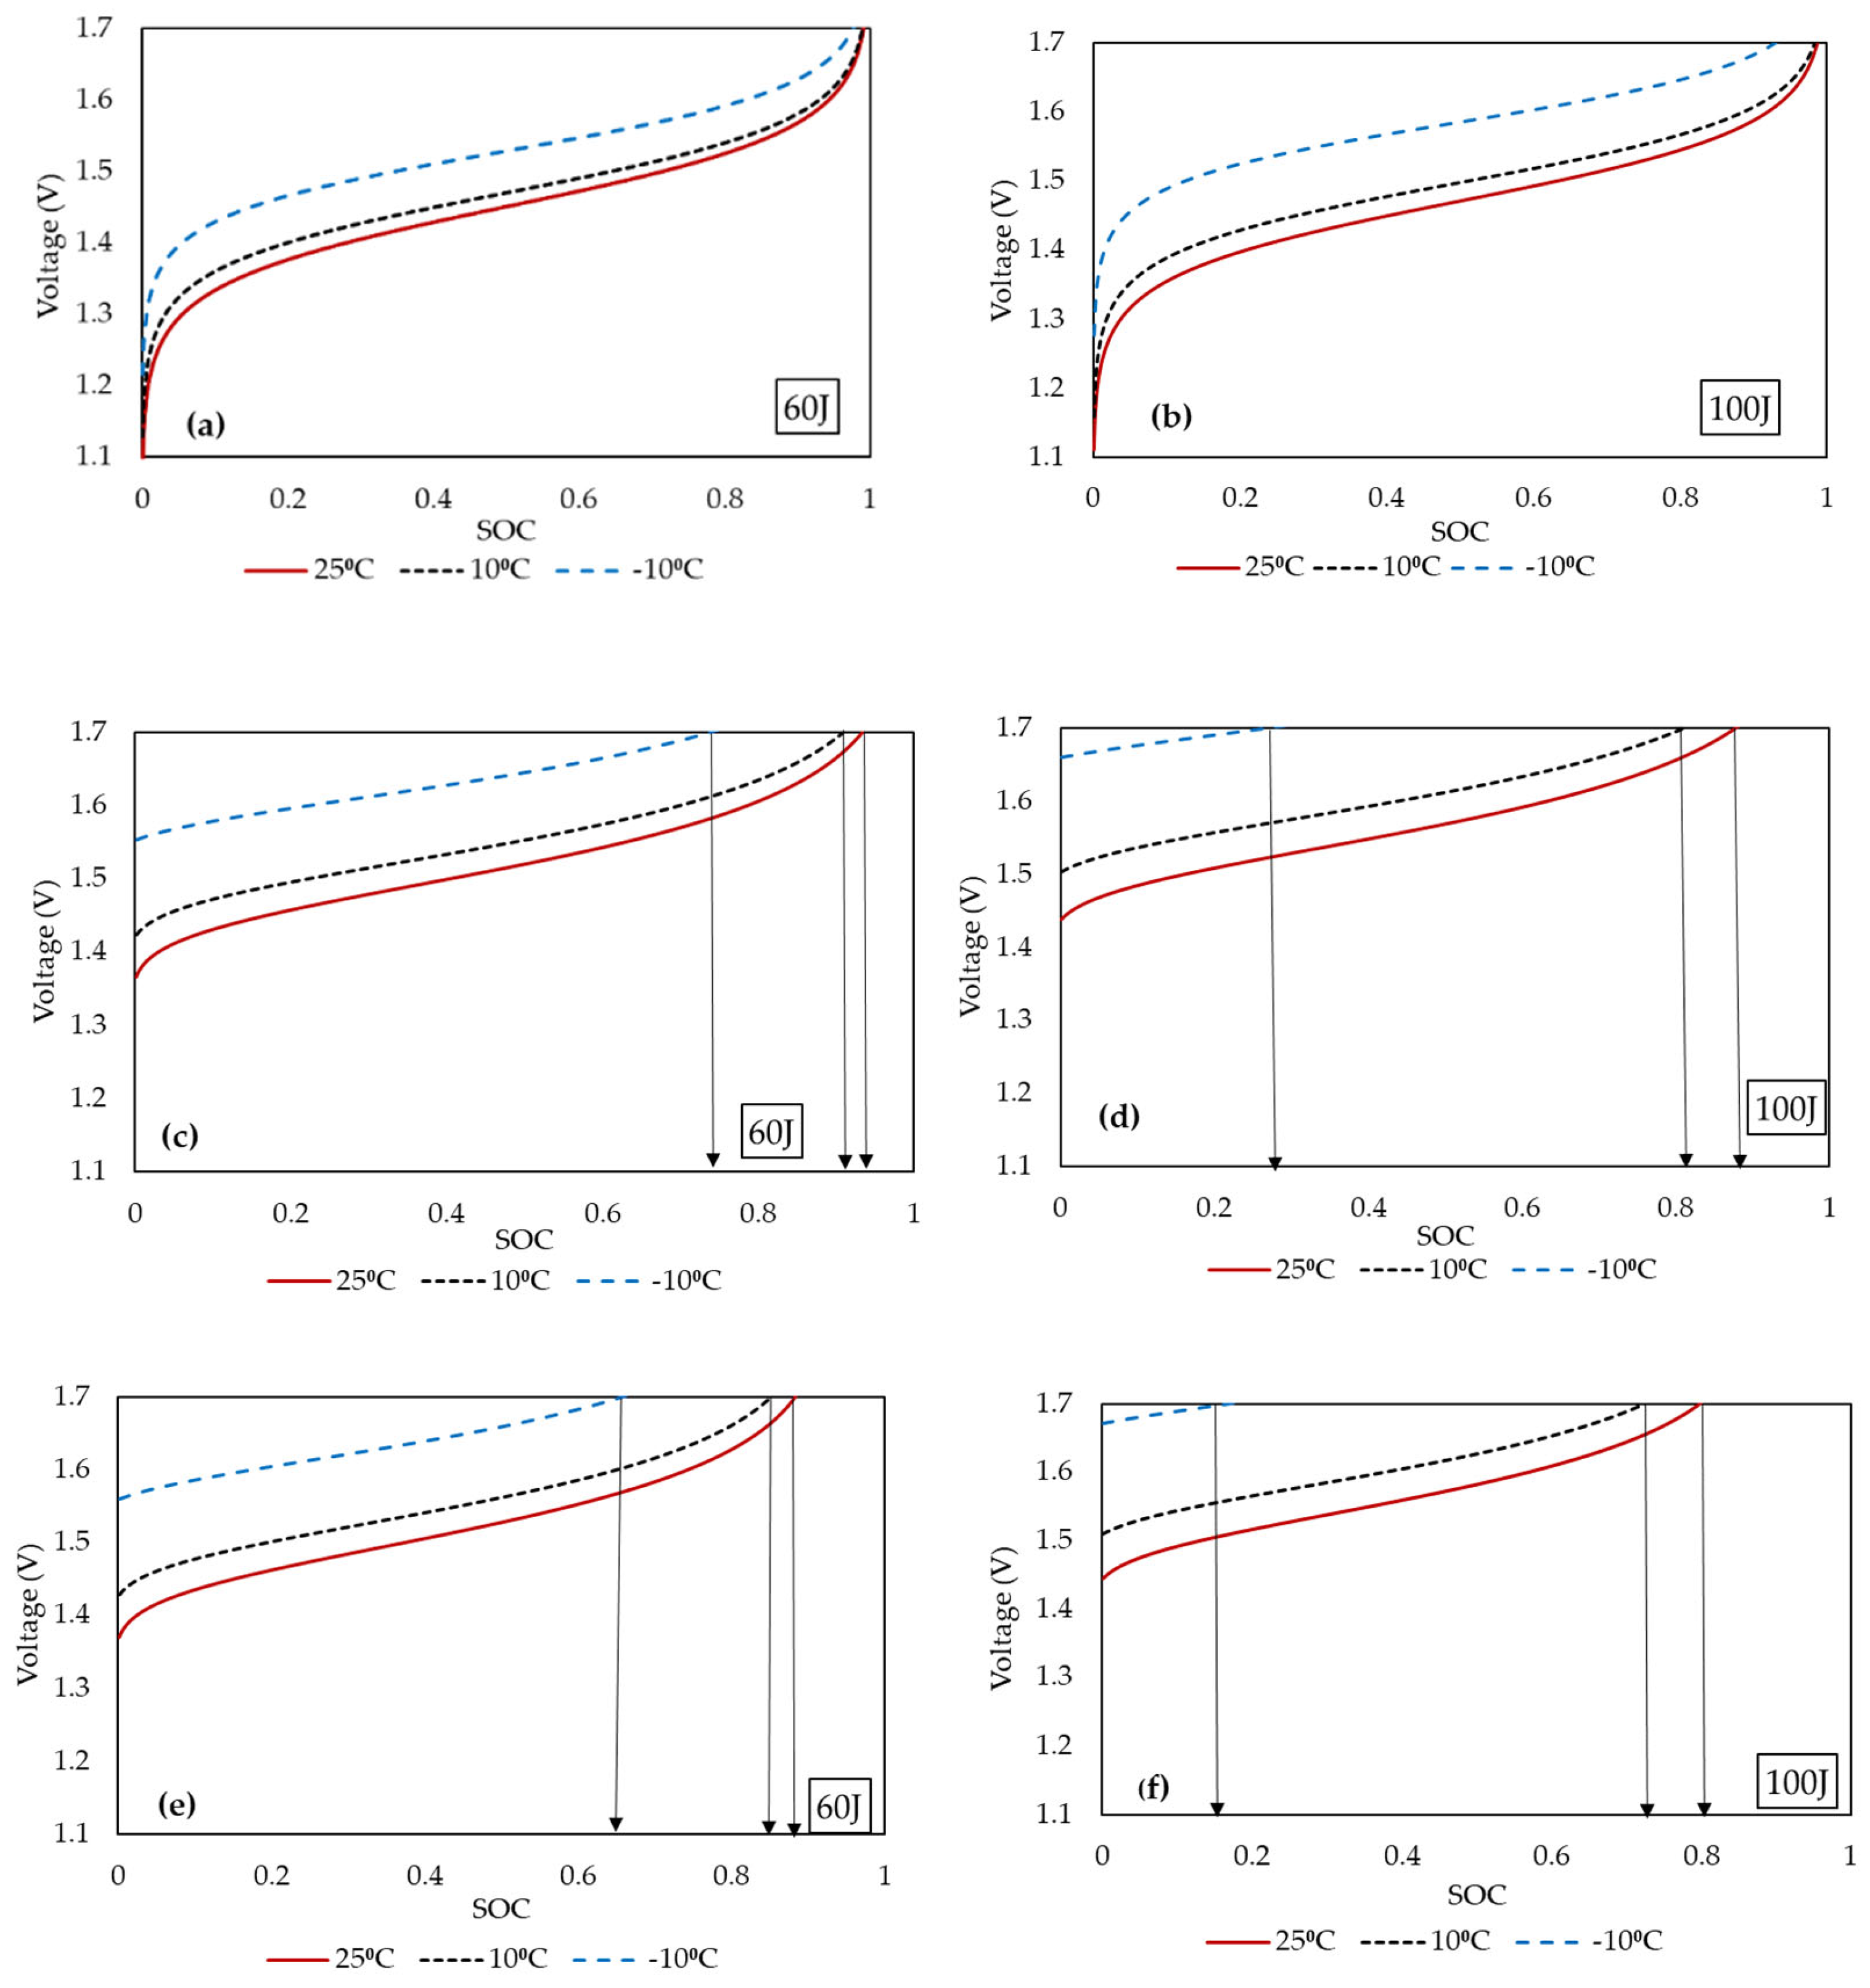
Using Equation (11), the reversible cell voltage was found to be 1.28 V and 1.303 V at 10 °C and −10 °C, respectively, using Equation (11). Thus, lower operating temperature increases the reversible cell voltage; however, poorer kinetics and higher ionic transport resistance lower the overall cell performance, as outlined below.
2.2. Ohmic Overpotential
Ohmic overpotential arises from the flow of charged species in the battery. It is determined by the sum of electrical resistances offered by the VRFB components for the flow of charged species that participate in the electrochemical reactions [
16]. In a VRFB, there is an ohmic overpotential contribution from the flow of electrons through the carbon felt, bipolar plate, and current collector on each side and in the external circuit. The proton movement through the electrodes and the membrane also contributes to the ohmic overpotential. The overall ohmic overpotential can be written as Equation (13) by taking only the important contributors:
where
j is the current density;
de is the thickness of the carbon felt electrode;
σe is the electronic conductivity of the carbon felt;
dm is the thickness of the membrane;
σm is the protonic conductivity of the membrane;
dgp is the thickness of the graphite plate;
σgp is the electronic conductivity of the graphite plate;
dcc is the thickness of the copper plate;
σcc is the electronic conductivity of the copper plate;
keff is the effective ionic conductivity of the vanadium electrolyte. The details of materials taken in the model and their properties are listed in
Table 1.
Of the various conductivities, the electrode conductivity depends on the geometric construction as well as on the materials of the electrode. It was determined empirically from in situ electrochemical impedance spectroscopy (EIS) studies, as explained later in
Section 3. Since vanadium ion cross-over is not considered in this study, the membrane conductivity of protons in the Nafion membrane is modeled as per the fuel cell literature and is explained in
Section 3. Conductivity of the electrolyte ions influences the total conductivity in the battery. For the VRFB system, the ions involved are
V2+,
V3+,
VO2+,
H+,
VO2+, and
HSO4−. Effective electrolyte conductivity is given [
12] by
where
is the effective diffusivity of ionic species
i, and
is its concentrations in the electrolyte.
The vanadium electrolyte is circulated in the VRFB using porous carbon felt, which allows the transport of ions through the pores. The ionic diffusivity of the electrolyte through the electrode is determined based on porosity using the Bruggemann correction factor [
12].
where
ε is the porosity of the electrode material, and
is the diffusivity of the electrolyte ions. It may be noted that the values of porosity and permeability vary with the compression of the electrode [
24,
25]. The diffusivity of the ions is estimated from the Stokes–Einstein equation, which relates diffusivity of ions in the electrolyte to the inverse of the electrolyte viscosity and the radius of the ion:
where
ri is the ionic radius,
μ is the electrolyte viscosity, and T is the temperature.
2.3. Activation Overpotential
Charge-transfer reactions occur on the surface of the electrode. The reaction kinetics are assumed to follow the Butler–Volmer equation. Assuming the electron transfer coefficient to be 0.5 at both electrodes, the activation overpotential in the anode and cathode is given by [
16]
where
γneg and
γpos are the rate constants of the negative and the positive electrode, respectively. Values of the rate constants are given in
Table 1.
2.4. Concentration Overpotential
Concentration overpotential arises due to the significant variation in electrolyte concentration at the bulk and at the electrode surface, which occurs when the current density is very high. Sustaining high currents requires high fluxes of reactant species; there can be a significant reduction in the surface concentration compared to the bulk concentration. When the bulk concentration itself is low, towards the end of charge/discharge, the surface concentration may become very low and lead to the situation where the reaction rate is limited by the diffusive flux, and the charge transfer process is controlled by mass-transfer. The concentration overpotential is expressed [
14] as
where
km is the local mass transfer coefficient,
V3+ and VO2+ concentrations are taken during charging, and
V2+ and VO2+ concentrations are taken during discharging the cell.
km is determined from the empirical formula developed for laminar flow over the fibers of the carbon felt [
26]:
where
Sh and
Re are the Sherwood number and Reynolds number, respectively.
where
df is the fiber diameter;
v is the superficial velocity;
ρ is the density of the electrolyte;
μ is the viscosity of the electrolyte. Thus, the calculation of the mass transfer coefficient is done as per Equation (21).
Thus, in the model, the operating cell voltage is determined using Equation (4) by evaluating the open-circuit voltage using Equation (12) and using Equations (13), and (17)–(19) to determine the overpotentials at the operating current density. All relevant properties are evaluated at the cell operating temperature.
3. Temperature Sensitivity of the Model Parameters
As can be expected, some of the model parameters are dependent on the operating temperature of the battery. Some, such as the kinetic constants in the activation potential and the electrode conductivity in the ohmic potential, depend on the cell construction and possibly on the temperature. Methods to determine the temperature-dependent parameters are discussed in this section.
Viscosity of the liquid electrolyte depends strongly on the temperature. In view of this, kinematic viscosity of the electrolyte made up of 1.6 M VO
2+/VO
2+ and 5 M H
2SO
4 was measured using an Ubbelhode viscometer at different temperatures. The absolute viscosity of the electrolyte was obtained from the measured density at the same temperatures. These data have then been fitted into the following correlation:
where
μ is in kg/m·s and
T is in °C. The diffusivity of various ions in the electrolyte calculated using Equations (16) and (22) at 10 °C and −10 °C is given in
Table 2. One can see a substantial decrease of diffusivity of all ions with a decrease in temperature; it is also noteworthy that the diffusivity of vanadium ions in the electrolyte is an order of magnitude less than that of the protons.
Proton conductivity of the Nafion membrane can be calculated at different temperatures using the following empirical equation [
27]:
where
T is in Kelvin and the proton conductivity is in S/m. Electrical (electronic) conductivities of the graphite flow-field and copper plate are very high, and their contribution to the ohmic resistance can be neglected.
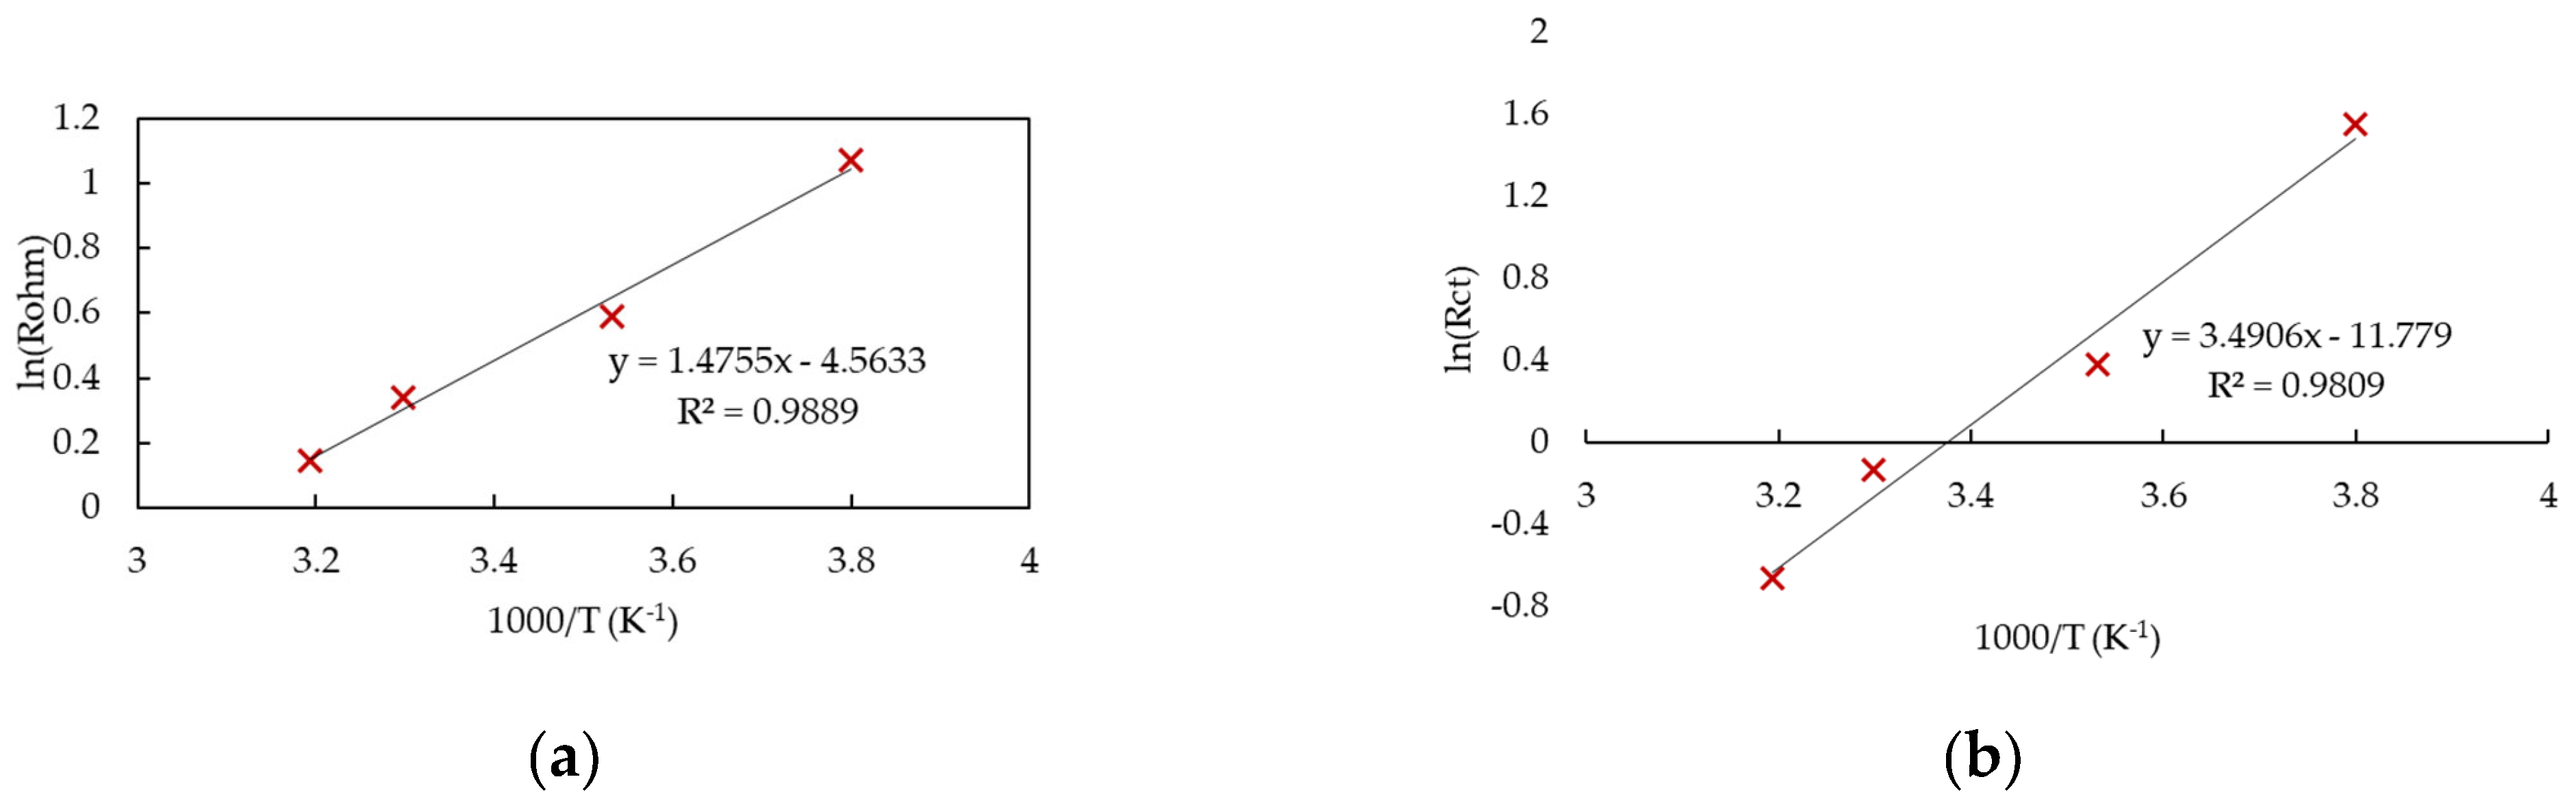
Electrochemical properties, namely, ohmic and activation overpotentials, of the electrode depend on a number of factors, and the temperature sensitivity of these properties cannot be predicted through modelling; however, the overall effect can be obtained through EIS measurements. In the present study, we use the EIS data of our previous studies [
11,
28] to develop empirical correlations for dependence of ohmic resistance and charge transfer resistance on temperature. Accordingly, the measured ohmic resistance obtained at 40, 30, 10, and −10 °C in a VRFB cell is used to develop the following correlation for the effective ohmic conductivity (
σe) as a function of inverse temperature:
where
is the pre-exponential factor for the electrode conductivity, and
Ea,e is the activation energy constant for the electrode conductivity.
Figure 3a represents the relation between ohmic resistance and temperature. The activation energy constant was found to be 12.27 kJ/kmol, which is calculated as the slope of the graph (
Figure 3a) times the universal gas constant.
Similarly, the charge transfer resistance obtained experimentally [
28] through EIS at the four temperatures was used to arrive at the temperature correction factor,
Rct, for the constant γ in Equations (17) and (18):
where
Ea,ct the activation energy, is obtained by the slope of the graph, which gives the relationship between charge transfer resistance (
Rct) and temperature (
Figure 3b). The value of the activation energy obtained is 29.02 kJ/kmol, which compares well with the values of 28.59 kJ/kmol and 21.9 kJ/kmol reported by Xiao et al. [
9] for the VO
2+/VO
2+ and the V
3+/V
2+ redox couples for a vanadium concentration of 1.6 M VOSO
4 and 2 M H
2SO
4. The value of
Ea is used in Equations (17) and (18) to obtain the rate constants at the required temperature.


