Abstract
Converting food waste into biofuel resources is considered a promising approach to address the rapid increase in energy demand, reduce dependence on fossil fuels, and decrease environmental hazards. In Egypt, large quantities of fried tilapia fish waste are produced in restaurants and households, posing challenges for proper waste management due to its decaying nature. The current study investigates the kinetic triplet and thermodynamic parameters of fried tilapia fish waste (FTFW) pyrolysis. Kinetic analysis was carried out using four iso-conversional models, Friedman, Kissinger–Akahira–Sunose (KAS), Flynn–Wall–Ozawa (FWO), and Starink, at heating rates of 10, 15, and 20 °C/min. The study findings indicate that FTFW decomposes within the temperature range of 382–407 °C. The estimated activation energy using the Friedman, FWO, KAS, and Starink methods ranged from 43.2 to 208.2, 31.3 to 148.3, 22.3 to 179.3, and 24.1 to 181.3 kJ/mol, respectively, with average values of 118.4, 96.7, 109.7, and 100.5 kJ/mol, respectively. The average enthalpy change determined using the Friedman, FWO, KAS, and Starink methods was 113.45, 91.78, 95.58, and 104.73 kJ/mol, respectively. The average values of Gibbs free energy change for the Friedman, KAS, FWO, and Starink, methods were 192.71, 171.04, 174.83, and 183.99 kJ/mol, respectively.
1. Introduction
The increasing demand for energy concerns about the depletion of natural resources and the impacts of global warming have obliged energy-consuming countries to explore alternative energy sources, particularly biofuels. Biofuels have generated increasing interest as a source of renewable energy due to their considerable environmental, social, and economic benefits [1,2]. Biofuels are produced through the conversion of different waste using different processes. The selection of proper techniques depends on different parameters, such as feedstock availability, energy output, economic levels, and environmental standards. Among the numerous types of waste used, food waste has emerged as an efficient and biodegradable source of biofuel. Food waste is primarily produced from sources like households, food processing plants, and catering industries, such as restaurants, cafeterias, hotels, and event facilities [3,4].
According to the Food and Agricultural Organization, more than 1.3 billion tons of food, including vegetables, fruits, dairy products, meat, and cereals, are wasted annually [5,6]. Without proper treatment, food waste can lead to severe environmental and health problems, such as harmful gas emissions, foul odors, virus transmission, and bacterial leaching [7,8]. Traditional food waste management techniques, such as animal feeding, anaerobic digestion, composting, and landfilling, are often inefficient and pose additional challenges, including low efficiency, extensive land use, hazardous gas emissions, and risks of virus transmission [9,10].
Fish waste, a by-product of fish-based food production, is another significant component of food waste. It is generated from restaurants, households, fish processing industries, and fish markets. Depending on the processing method, approximately 60% of a fish’s weight is discarded as waste. Common fish waste components include fins, bones (9–15%), skin (1–3%), scales (5%), head (9–12%), and viscera (12–18%) [11]. Improper disposal of fish waste contributes to considerable biological pollution, which is a topic of increasing international concern due to its environmental and economic impacts [12].
Traditional methods for utilizing fish waste, such as incineration, composting, and landfilling, are not economically viable and are discouraged because of associated health risks, environmental hazards, and unpleasant odors [13]. As a result, alternative methods have been developed to convert fish waste into valuable products, particularly biofuels. Fish waste can be converted into biofuel through various thermochemical processes, including combustion, liquefaction, gasification, and pyrolysis [14].
Pyrolysis is a highly effective thermochemical conversion technique that decomposes raw materials under high-temperature, oxygen-free conditions to produce liquid, gas, and solid fuels [15,16,17]. This method has proven to be a reliable approach for recycling various types of waste, including fish waste [18]. In addition to fish waste, other materials have been successfully used as pyrolysis feedstocks, such as plastic waste [19], sewage sludge [20,21], wood waste [22,23], healthcare waste [24], food waste [25,26], and agro-industrial waste [27].
The efficient design and operation of waste pyrolysis requires a thorough analysis of the pyrolysis kinetics and thermodynamics. Proper characterization of the feedstock’s kinetics and thermodynamic properties is essential for reactor design and the optimal utilization of pyrolysis feedstock [28]. Thermogravimetric analysis (TGA) is a beneficial technique for studying the decomposition behavior and chemical kinetics of materials during thermal decomposition. By combining TGA data with kinetic modeling, both thermodynamic and kinetic triplet parameters can be accurately estimated, providing critical insights into the thermal decomposition process [29,30]. TGA can be performed under isothermal or non-isothermal conditions, with non-isothermal conditions receiving more attention due to their ability to study material behavior over a range of temperatures while minimizing variations in physical and chemical properties. Additionally, TGA is characterized by its high reproducibility, reliability, sensitivity, and straightforward data acquisition [31,32,33]. Kinetic models used in TGA analysis are generally categorized into two types: model-free (or iso-conversional) methods and model-fitting methods. Model-free methods are particularly advantageous due to their precision and time-saving attributes [34]. Pyrolysis kinetics have been studied for various types of feedstocks, including freshwater algae Spirogyra [35], mustard stalk [36], watermelon seeds [30], cascabel, Delonix regia, and Manilkara zapota seeds [37], as well as coal [38].
In Egypt, Nile tilapia (Oreochromis niloticus) is one of the most consumed freshwater fish species, accounting for approximately 65.15% of fish production [39]. Its rapid farming cycle and low production costs make it the primary species for aquaculture in the region. Fried tilapia is a staple meal in many Egyptian households, providing an affordable source of protein. However, the widespread consumption of tilapia generates significant amounts of waste, including viscera, heads, scales, skin, and bones, with approximately 60–70% of the fish body being discarded. These wastes, produced in large quantities by restaurants and hotels, pose serious environmental and health challenges. Unlike other fish waste, fried tilapia waste contains residual frying oils and additives used during the frying process, which can influence the pyrolysis process. Therefore, analyzing the thermochemical behavior of fried tilapia waste and understanding its pyrolysis potential is essential for its effective conversion into biofuels.
Compared to other types of waste, limited studies have focused on fish waste pyrolysis. Yusof et al. [40] employed TGA to investigate the kinetics of Sardinella fimbriata fish waste. Three model-free models were used to estimate the pre-exponential factors and activation energies. The mean activation energy and pre-exponential factor were 84–124 kJ/mol and between 102 and 1011 s−1, respectively. The kinetic and thermodynamic factors of the Sardinella fimbriata fish waste were determined. The findings of this study provide insights into the possibility of using pyrolysis to produce fish waste as a biofuel source. In another study, Reza et al. [41] analyzed the thermochemical properties and pyrolysis behavior of fish processing waste. Their results showed that fish waste has a higher heating value of 21.53 MJ/kg, highlighting its suitability for biofuel production. TGA and derivative thermogravimetry (DTG) analyses revealed a maximum weight loss rate of 4.57 wt.%/min at 352 °C. The pyrolysis was conducted at a heating rate of 25 °C/min at different pyrolysis temperatures. The percentage of bio-oil, biogas, and biochar was 29.34, 23.46, and 33.96% at 400 °C; 49.32, 33.87, and 47.72% at 500 °C; and 21.34, 42.37, and 18.32% at 600 °C. Abdelrahman et al. [42] studied the production of bio-oil and activated carbon (AC) from fish waste. De-oiled fish pyrolysis was carried out under varying particle sizes, residence times, and temperatures. The highest bio-oil yield of 57.13% was achieved at a particle diameter of 0.25 mm, a pyrolysis time of 60 min, and a temperature of 500 °C. The properties of the produced bio-oil closely resembled those of bio-oils reported in previous studies, demonstrating its comparability as a bioenergy source. Activated carbon was generated from biochar using steam activation. The optimal activated carbon sample was produced at an activation temperature of 500 °C, with a particle size of 60 mesh and an activation time of 60 min. In a related study, Takwa et al. [43] examined the fats derived from fish waste pyrolysis at a canned tuna factory. Their evaluation of bio-oil properties at 500 °C revealed the presence of numerous organic compounds, which hold potential as sustainable and valuable chemical resources. The bio-oil exhibited a high heating value of 9391 kcal/kg, along with viscosity and acidity values of 7 cst and 103 mg KOH/g, respectively. The study demonstrated that the generated bio-oil could potentially be used as engine fuel when blended with fossil fuels.
Although a lot of research studies concern the pyrolysis of food waste, few studies have been conducted on fried fish waste. This type of waste differs significantly from other food waste because of its high content of lipids and exposition to thermal processing. The recent studies on fish waste pyrolysis primarily concern raw fish waste, ignoring the impact of using frying oils and other additives on decomposition and kinetics. This study aims to fill this gap by studying the kinetic triplet and thermodynamic parameters of FTFW pyrolysis, presenting new insights into its potential as a biofuel source. The kinetic triplet parameters were calculated, including activation energy (Ea), pre-exponential factor (A), and reaction model (f(α)). The FTFW is a unique food waste generated in large quantities in Egypt, which poses significant environmental and health challenges due to improper disposal. FTFW has higher contents of lipid and protein compared to other protein-rich waste and lignocellulosic biomass, resulting in a distinct pyrolysis pathway with improved quality and yield of bio-oil. The exitance of frying oil and other additives affects thermal degradation behavior and potentially promotes the heating value of the generated bio-oil.
Triplet kinetic parameters are critical for understanding the thermal decomposition process and optimizing reactor design. Using TGA and four iso-conversional models, this study determined the kinetic triplet parameters and thermodynamic properties to provide a comprehensive understanding of the pyrolysis process of FTFW as a sustainable biomass resource. The four selected iso-conversional models, Friedman, Kissinger–Akahira–Sunose (KAS), Starink, and Flynn–Wall–Ozawa (FWO), and the heating rates of 10, 15, and 20 °C/min, as presented in Table 1, were chosen due to their extensive applications in biomass and food waste kinetic analyses, ensuring accurate and reliable results. Employing multiple iso-conversional models minimizes the influence of reaction mechanisms and experimental conditions, offering deeper insights into the complex thermal behavior of lipid-rich wastes. The results demonstrate that FTFW is a sustainable feedstock for pyrolysis, yielding valuable bio-oil, gas, and char, and contributing to waste valorization and renewable energy applications. This work highlights the importance of kinetic modeling in optimizing pyrolysis processes for effective waste management and energy recovery.

Table 1.
Summary of previous kinetic triplet parameters for different biomass and waste food.
2. Materials and Method
2.1. Sample Preparation
The selected sample utilized in this study was fried tilapia fish waste (FTFW), which consisted of fried oil, bones, fish heads, skin, and other additives introduced in the frying of fish. The absorbed frying oil during the cooking process may influence the pyrolysis reaction by affecting the pathways of FTFW thermal decomposition and increasing bio-oil yield due to the frying oil’s lipid-rich composition. Using the frying oil can result in the release of light volatiles at lower temperatures because of low molecular weight compounds and the evaporation of absorbed oil. Frying oil may lead to excessive reaction pathways during pyrolysis, like hydrocarbon chain reforming and cracking. These reactions can clearly influence the kinetics and degradation of fish waste. The sample was obtained from household residuals. Before the pyrolysis process, the samples were dried under sunlight at an ambient temperature of 30–38 °C for 10 days to remove moisture. Fish waste samples were crushed and sieved to achieve a uniform particle size of <1 mm, as shown in Figure 1.
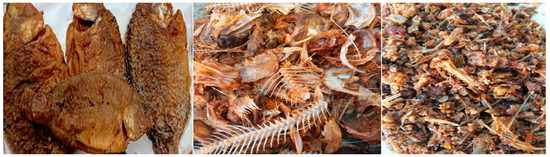
Figure 1.
Photo of fried Tilapia fish samples used in this study.
2.2. Thermogravimetric Experiment
The TGA and DTG analyses were used to assess the FTFW decomposition behavior. A thermogravimetric analyzer (TGA Q50 V20.13 Build 39) was used to conduct both analyses. The TGA experiments were carried out under pyrolysis conditions, starting from an ambient temperature and increasing to a maximum temperature of 700 °C, at different heating rates. As shown in Table 1, a temperature of 700 °C or higher was selected to ensure the complete decomposition of FTFW, which can optimize the yields of pyrolysis products and is consistent with standard practices in the pyrolysis field. The selected heating rates are widely selected in TGA studies of pyrolysis of different feedstocks, which can ensure the variation of decomposition behavior under a range of conditions. Additionally, the selected heating rates are commonly used in both laboratory and pilot-scale pyrolysis systems, which elucidates the applicability of the obtained results to real-world applications. The decomposition of the samples was tested under a nitrogen carrier gas to create an inert atmosphere. To achieve reliability and repeatability of experiments, every test was repeated 3–5 times. For each experimental run, the sample weight was maintained at 10–30 mg ± 0.5 µg, with a weighing precision of ±0.01%. Platinum crucibles were utilized to achieve optimal heat transfer between the thermocouples and crucibles, with a temperature accuracy of ±1 °C.
3. Kinetic Analysis
The TGA and DTG test results were utilized to determine the kinetic triplet parameters. Additionally, these data were also employed to calculate thermodynamic parameters, including enthalpy change (ΔH), Gibbs free energy change (ΔG), and entropy change (ΔS). These parameters were derived by analyzing the mass loss of the sample as a function of temperature. The mechanism of FTFW pyrolysis involving numerous reactions together could be a single-step or an n-order step reaction; however, it generally follows the following reaction:
The reaction of solid-state at a certain heating rate for non-isothermal conditions is given by the equation of kinetics known as the Arrhenius equation:
Regarding Equation (2), K(T) is known as the temperature-dependent constant, f(α) is the reaction model function, which describes the decomposition mechanism, and α is the extent of conversion and represents the fractional change in the mass of a solid sample by a thermal decomposition process, defined as:
where minital, mt, and mfinal are the initial sample mass, the mass at a specific time, and the mass after the heating process (char mass), respectively. Equation (2) includes the global reaction rate constant (K(T)), which is a temperature-dependent constant, defined as follows:
where A is a pre-exponential factor (min−1), that represents the number of effective molecular collisions resulting in decomposition, Ea is the apparent activation energy, which is the energy required to begin the reaction and decomposition of material under pyrolysis conditions, T is the sample temperature, and R is the universal gas constant (8.314 J/K. mol) [55,56]. By substituting Equations (2) and (4), the Arrhenius equation can be expressed as follows:
According to Equation (5), the relationship between the time dependence on temperature is the constant heating rate (β) °C/min:
Combining Equations (5) and (6) yields:
Rearranging Equation (7) gives:
Equation (7) is known as the fundamental differential equation for evaluation of the kinetic triplet parameters (Ea, f(α), and A), which are obtained from TGA data. By integrating both of its sides to obtain g(α), the following equation results:
where the integrated form of reaction model function f(α) is g(α), and the integral temperature function is π(X), where X = Eα⁄RT. π(X) is in integral form and does not have an exact solution, but it has several suggested approximations [44,57,58,59]. Also, Ti represents the initial temperature, and Tf refers to the final temperature, where the sample reaches 700 °C. The kinetic parameters, identified as the kinetic triplet parameters in Equation (8), were determined for the non-isothermal decomposition of wastes using both the model-fitting and model-free methods. The model-fitting method relies on the assumption of a specific reaction order. In contrast, the model-free method, also known as the iso-conversional method, can effectively describe the complex reaction mechanisms by analyzing the degree of conversion at various heating rates [60,61,62,63].
3.1. Determination of the Activation Energy
The kinetic triplet parameters describe the reaction rate of the pyrolysis of materials as a function of temperature at a certain conversion. This study employed four methods (Friedman, Starink, Kissinger–Akahira–Sunose, and Flynn–Wall–Ozawa) to determine the activation energy of FTFW. The selected methods are widely used to estimate the pyrolysis of different feedstocks, as listed in Table 1. These models do not require a predefined reaction model, making them appropriate for complex feedstock pyrolysis. They are applicable for activation energy estimation across various conversion levels, which gives deeper insight into the decomposition behavior of various feedstock fractions. The widespread use of these models in kinetic studies of different materials demonstrates their reliability in estimating kinetic parameters. The Friedman method [64] calculates Eₐ differentially based on α values for a single β. It is widely utilized as a differential method because no assumptions regarding the reaction mechanism are required [65]. The other three methods, Starink, KAS, and FWO, are integral methods and are extensively applied due to their accuracy and versatility across a wide range of conditions. A concise summary of the governing equations for each method is provided in Table 2. The activation energy was determined from the slope of the y-axis plotted against the x-axis.
Table 2.
Summary of different methods utilizing in the current study to obtain activation energy.
3.2. Determination of the Reaction Mechanism
Determining the reaction mechanism f(α) is essential for estimating the kinetic behavior of a reaction, classifying it as accelerated, decelerated, or sigma-based, based on the shape of the conversion–temperature (α–T) curves. Accurate reaction models for solid-state reactions are described by Criado et al. [73] using the Z(α) and y(α) master plot methods. The Šesták–Berggren (S*) method [74,75], shown in Equation (14), offers a versatile experimental approach for representing sigma interaction patterns using different sets of parameters (m, n, and P). The adaptability of the Šesták–Berggren (S*) model makes it a valuable framework for understanding and predicting the behavior of a wide range of thermal decomposition processes.
The autocatalytic reaction mode f(α) F* by Snegirev [76,77,78] describes the kinetics of reactions where the presence of its products accelerates the reaction rate. The general form of the autocatalytic model according to Snegirev is as follows:
where n and m are reaction order parameters, and α* is a parameter representing the autocatalytic effect. This model helps to describe complex reactions that involve autocatalytic behavior, in which the reaction rate initially increases as more products are formed, leading to a peak in the reaction rate before it starts to decline as the reactants are consumed. Z(α) is define as the following [75]:
For comparison between the experimental kinetic curves and the models in the graph curves in Table S1, both Z(α) and Z(0.5) were divided.
The special function y(α) is defined as a function of α corresponding mostly used kinetic models, as listed in Table S1, which is illustrated in the master plots method of y(α):
where T(α) and dα⁄dt are measured at different heating temperatures by comparing the experimental data with the normalized function in Equation (19) [75,79]
3.3. Pre-Exponential Factor Estimation
The pre-exponential factor represents the frequency of successful molecular collisions leading to decomposition, reflecting the reaction rate regardless of temperature. A higher A value indicates a higher tendency for bond scission [80]. There is a reliance between a pre-exponential factor and activation energy, and there is a compensating manner in which they could correlate together. This compensation effect is utilized to distinguish the reliance of Ea and A on the conversion degree [81], where a linear correlation is considered depending on the following relationship:
where a and b are the compensation factors for the kinetic process at a given heating rate.
3.4. Thermodynamic Parameters
After calculating the activation energy and pre-exponential factor using different models, the thermodynamic properties, including ∆H, ∆G, and ∆S, were calculated via Equations (21), (22), and (23), respectively. These calculations provide a comprehensive understanding of the reaction kinetics and thermodynamics and provide information on the energy demands and stability of the reaction [36,40,82].
where BBol is the Boltzmann constant (1.3819 × 10⁻²³ J/K), Pplank is the Plank constant (6.6269 × 10⁻³⁴ J s), and Tpeak is the maximum temperature calculated from derivative mass losses from DTG.
4. Results and Discussions
4.1. TGA and DTG Results Discussions
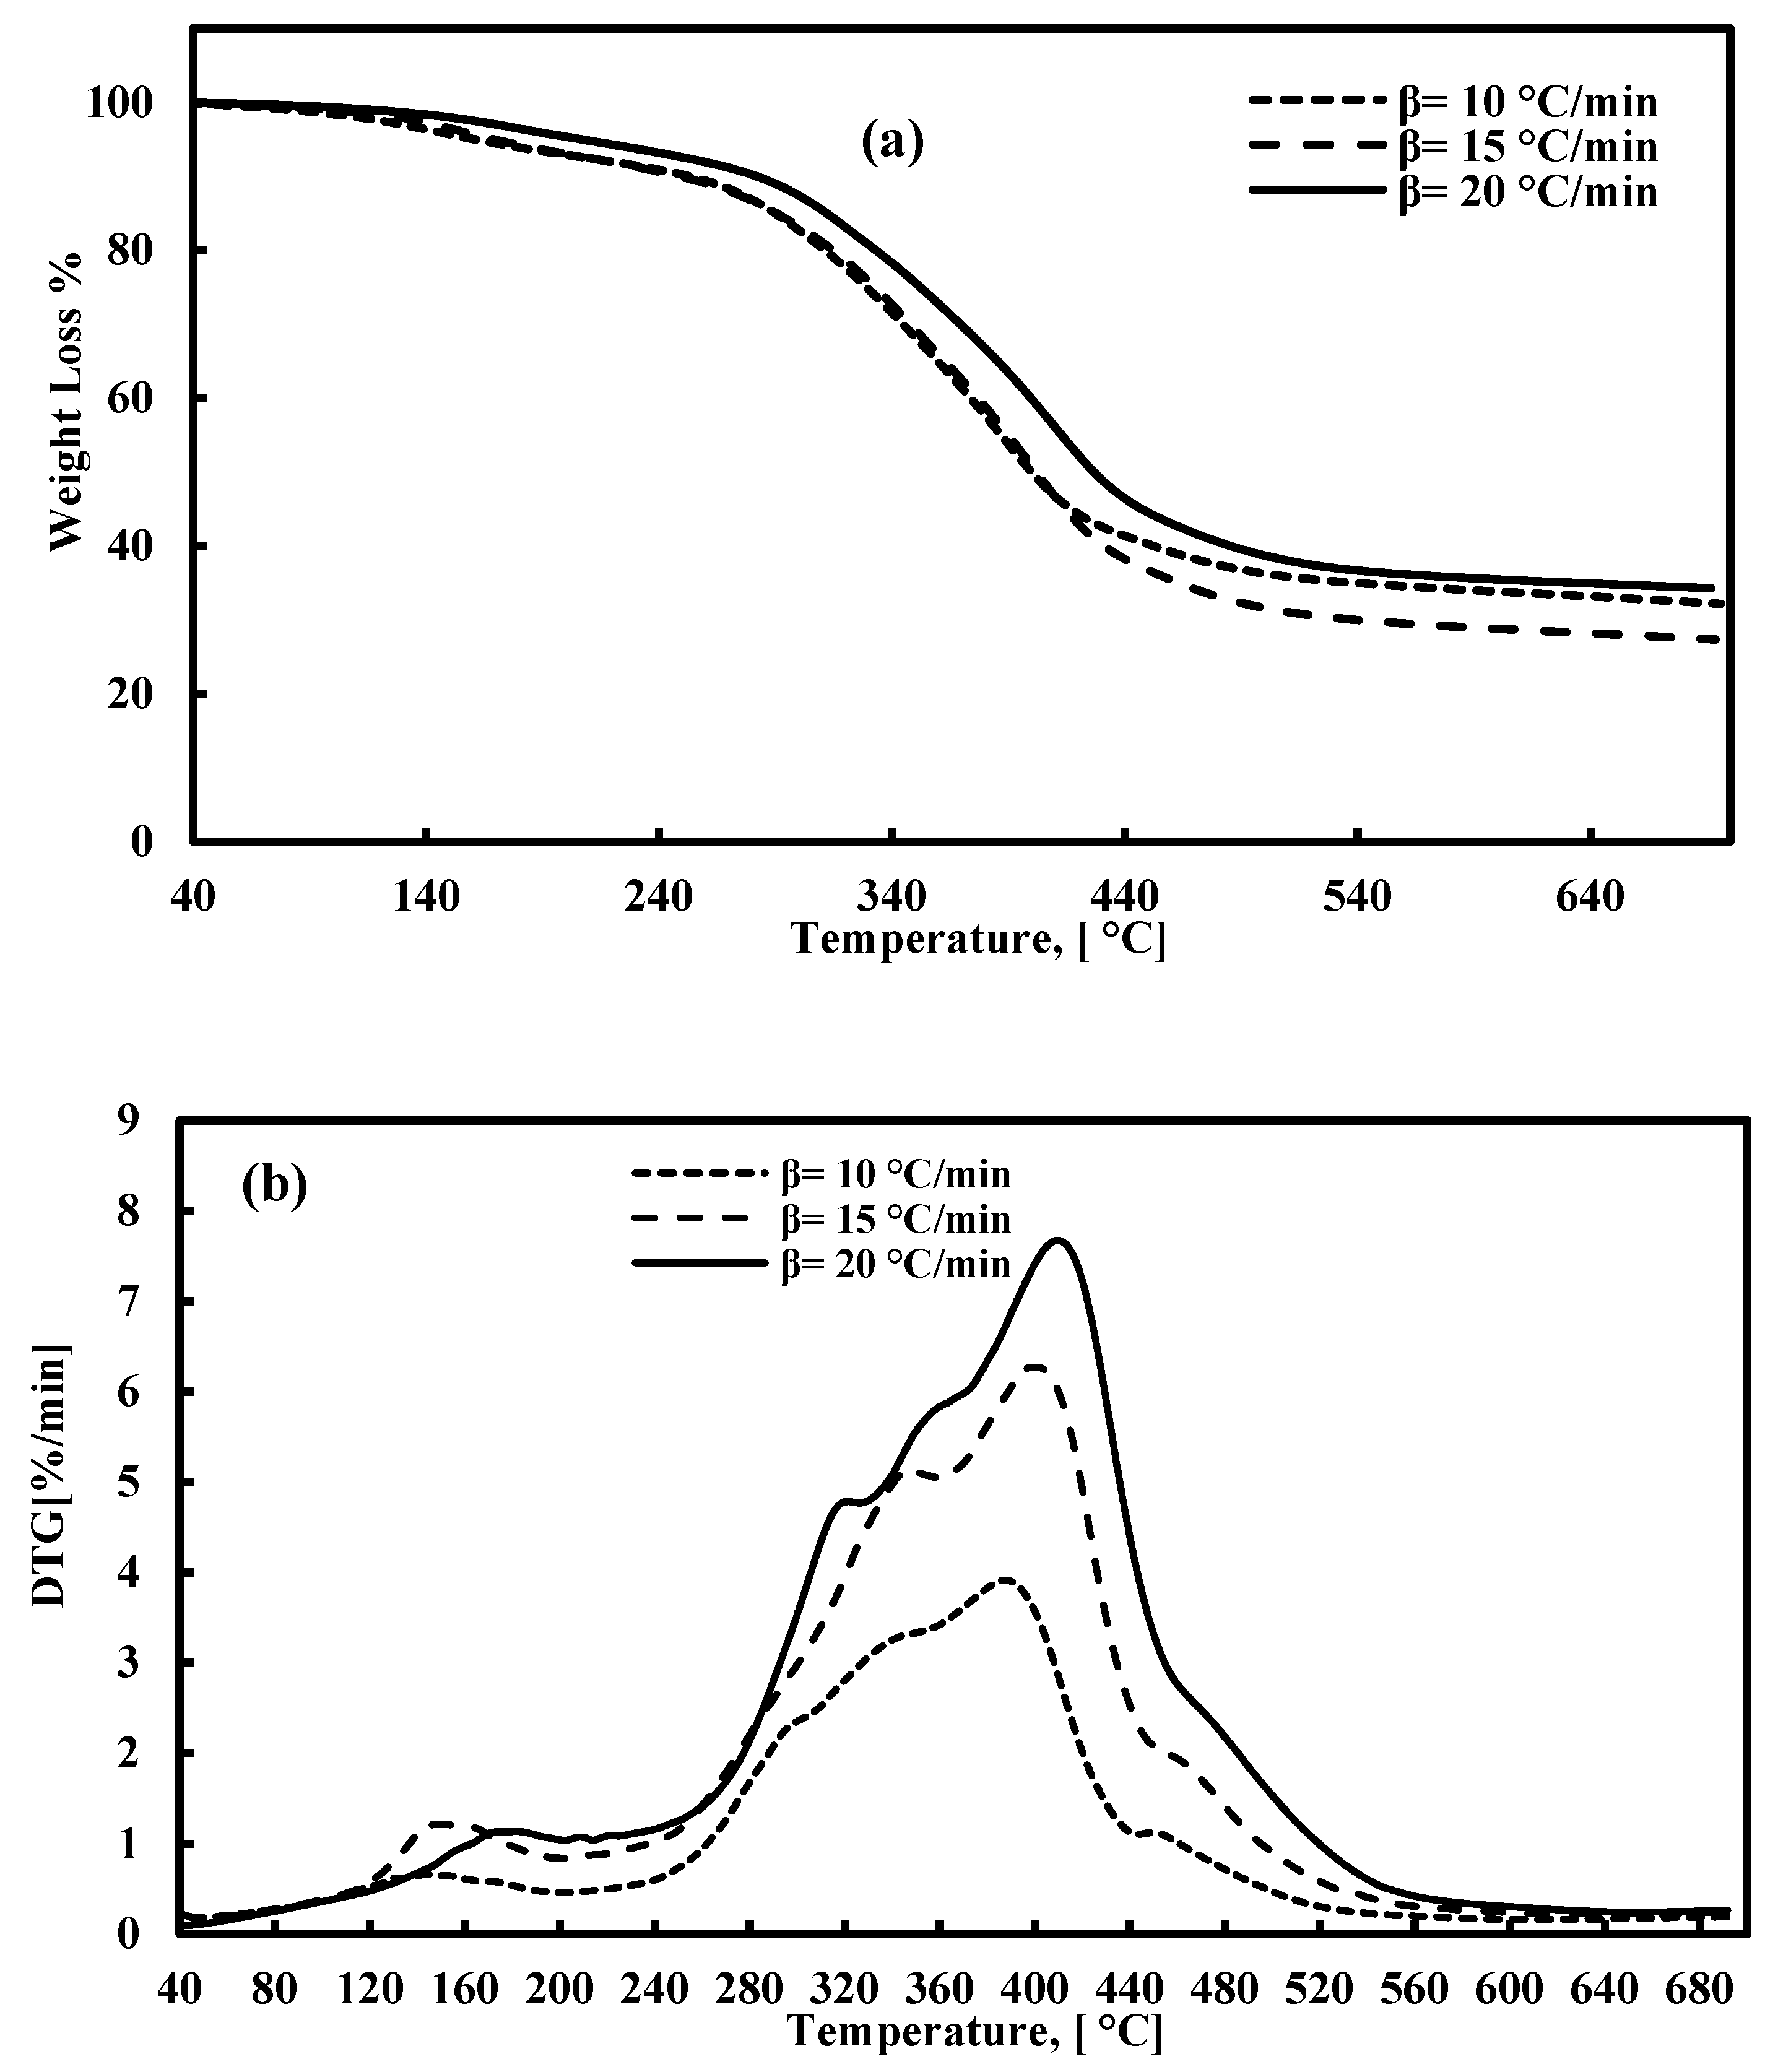
The TGA and DTG plots for FTFW pyrolysis at various heating rates at a temperature range of 40–700 °C are presented in Figure 2a,b. According to Figure 2a, the decomposition of fish waste has three stages of reaction, the characterization of which is presented in Table 3. The first stage occurs between 40 °C and around 205 °C, and the weight loss is around 8%. The lower percentage of moisture released is due to the drying process prior to the TGA tests. This stage takes place under 205 °C and is attributed to the release of light volatiles due to the oil absorbed during the frying process. At this stage, the peak derivative mass loss occurs at approximately 147 °C, signifying the release of moisture and some light volatiles. The second stage is the most significant phase in waste decomposition, beginning immediately after the first stage and continuing up to about 540 °C across all three heating rates. The peak temperature during this stage falls within the range of 382–407 °C, corresponding to the decomposition of carbohydrates, proteins, and fats with the most stable structures. The broad width of this stage and the appearance of a secondary peak, lower than the primary peak, within the 205–540°C range, results from the overlapping decomposition of carbohydrates and proteins, as noted in previous studies [40,83,84]. The effect of heating rates on the decomposition of raw materials is significant, as higher heating rates lead to increased volatility, which, in turn, influences residence time and weight loss. Specifically, there is an inverse relationship between heating rates and residence time: as the heating rate increases, the residence time decreases. Consequently, the peak temperature shifts to a higher value during the second stage of decomposition. The third stage represents the conclusion of the pyrolysis process, where the continued formation of char results in a slight weight loss. Figure 3 depicts the relationship between temperature and the extent of conversion at various heating rates. The figure shows that the extent of conversion consistently increases with rising temperatures across all heating rates.
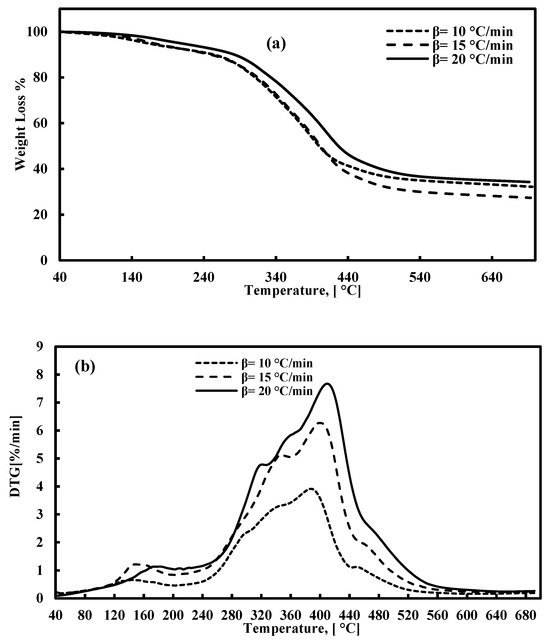
Figure 2.
(a) TGA and (b) DTG for FTFW pyrolysis at various heating rates.
Table 3.
TGA/DTG measurements of FTFW at different heating rates.
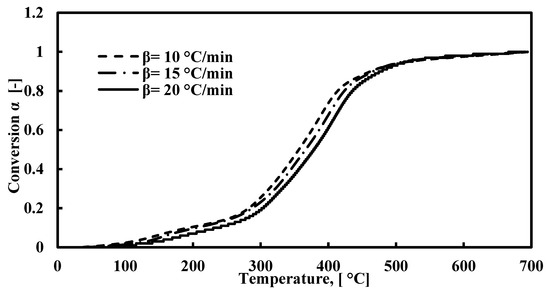
Figure 3.
Extent of conversion curves for the decomposition of FTFW at different heating rates.
4.2. Kinetic Triplet Parameters Calculations
4.2.1. Activation Energy (Ea)
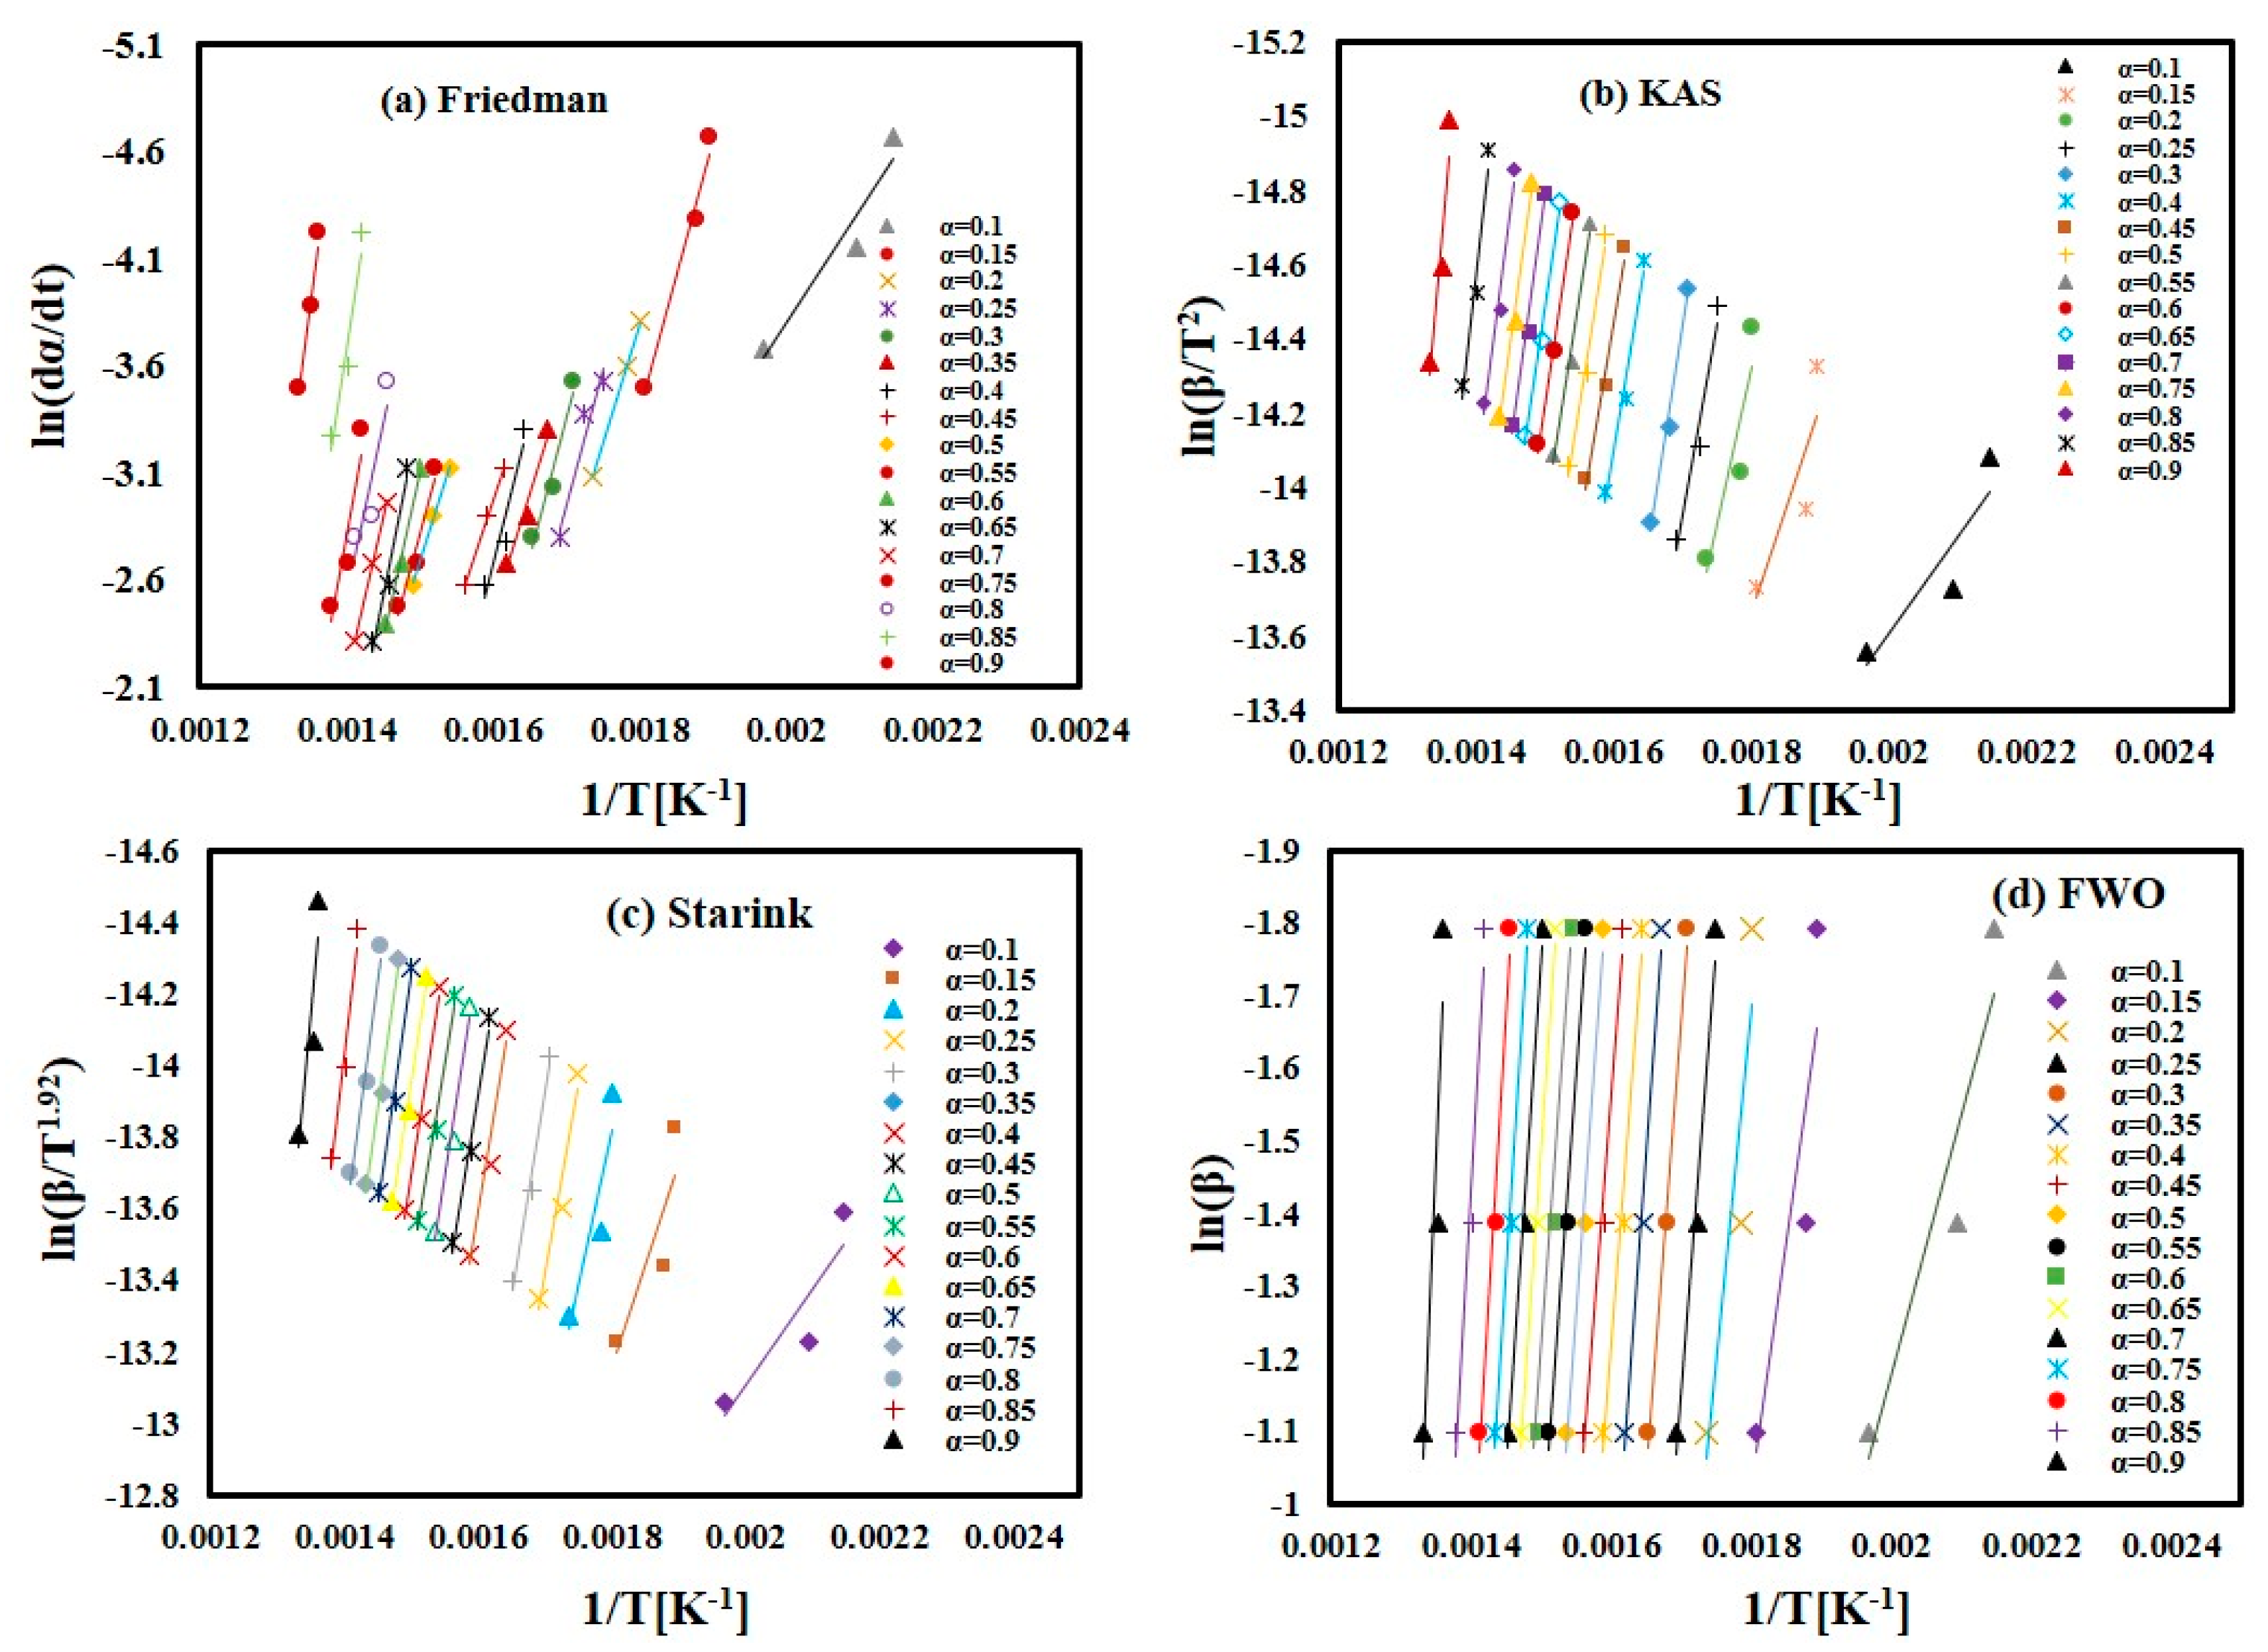
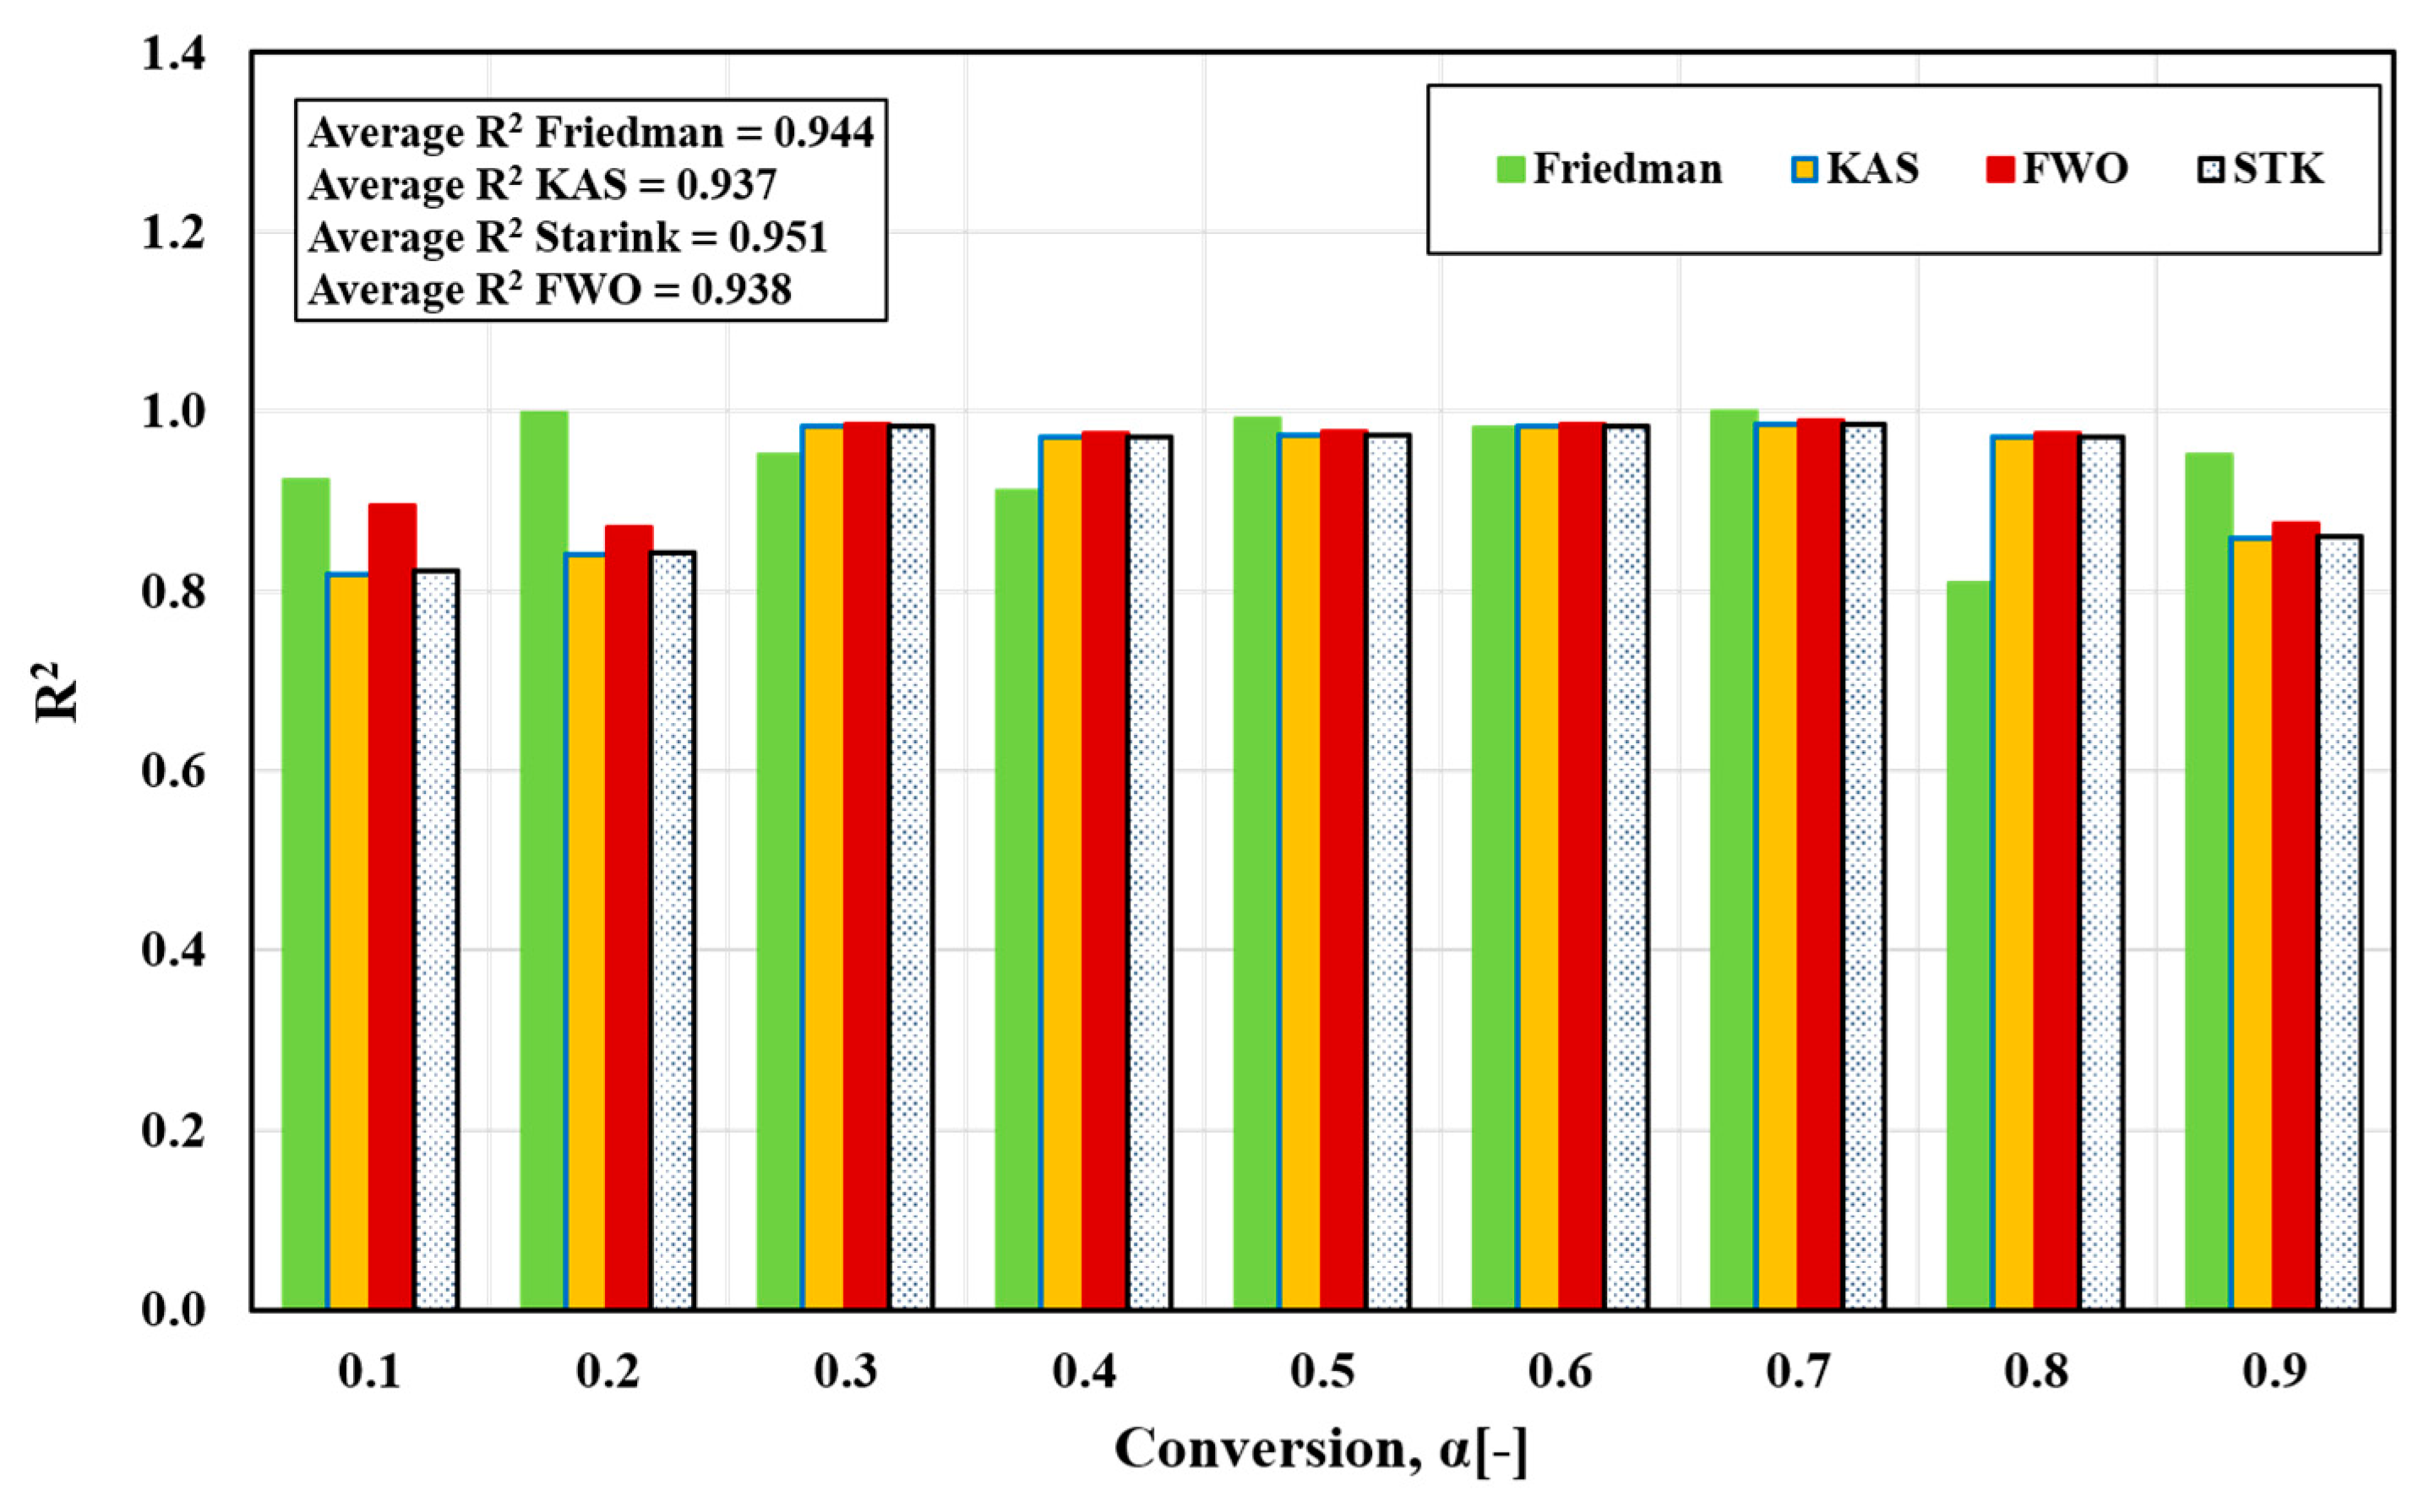
In the present study, four iso-conversion methods were employed: the Friedman, FWO, Starink, and KAS methods. Figure 4a–d displays the iso-conversion plots for each method separately, showcasing the behavior of FTFW at various heating rates with a conversion degree (α) ranging from 0.1 to 0.9 in steps of 0.05. The plots demonstrate an excellent linear relationship, with correlation coefficients R2 exceeding 0.85, as depicted in Figure 5. By calculating the appropriate slope for each α value across the four methods, as outlined in Table 2, the activation energy values were determined from the slope of the linear regression line at each specific conversion level for the different heating rates.
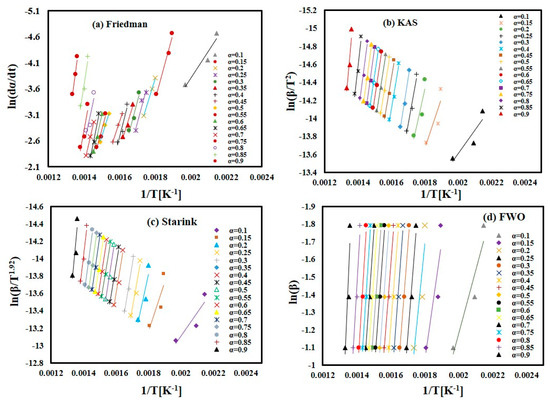
Figure 4.
The linear fitting for FTFW for conversion (α) = 0.1–0.9. (a) Friedman method. (b) KAS method. (c) Starink method. (d) FWO method.

Figure 5.
Correlation coefficient, R2, for activated energy variation with conversion α for different iso-conversion methods.
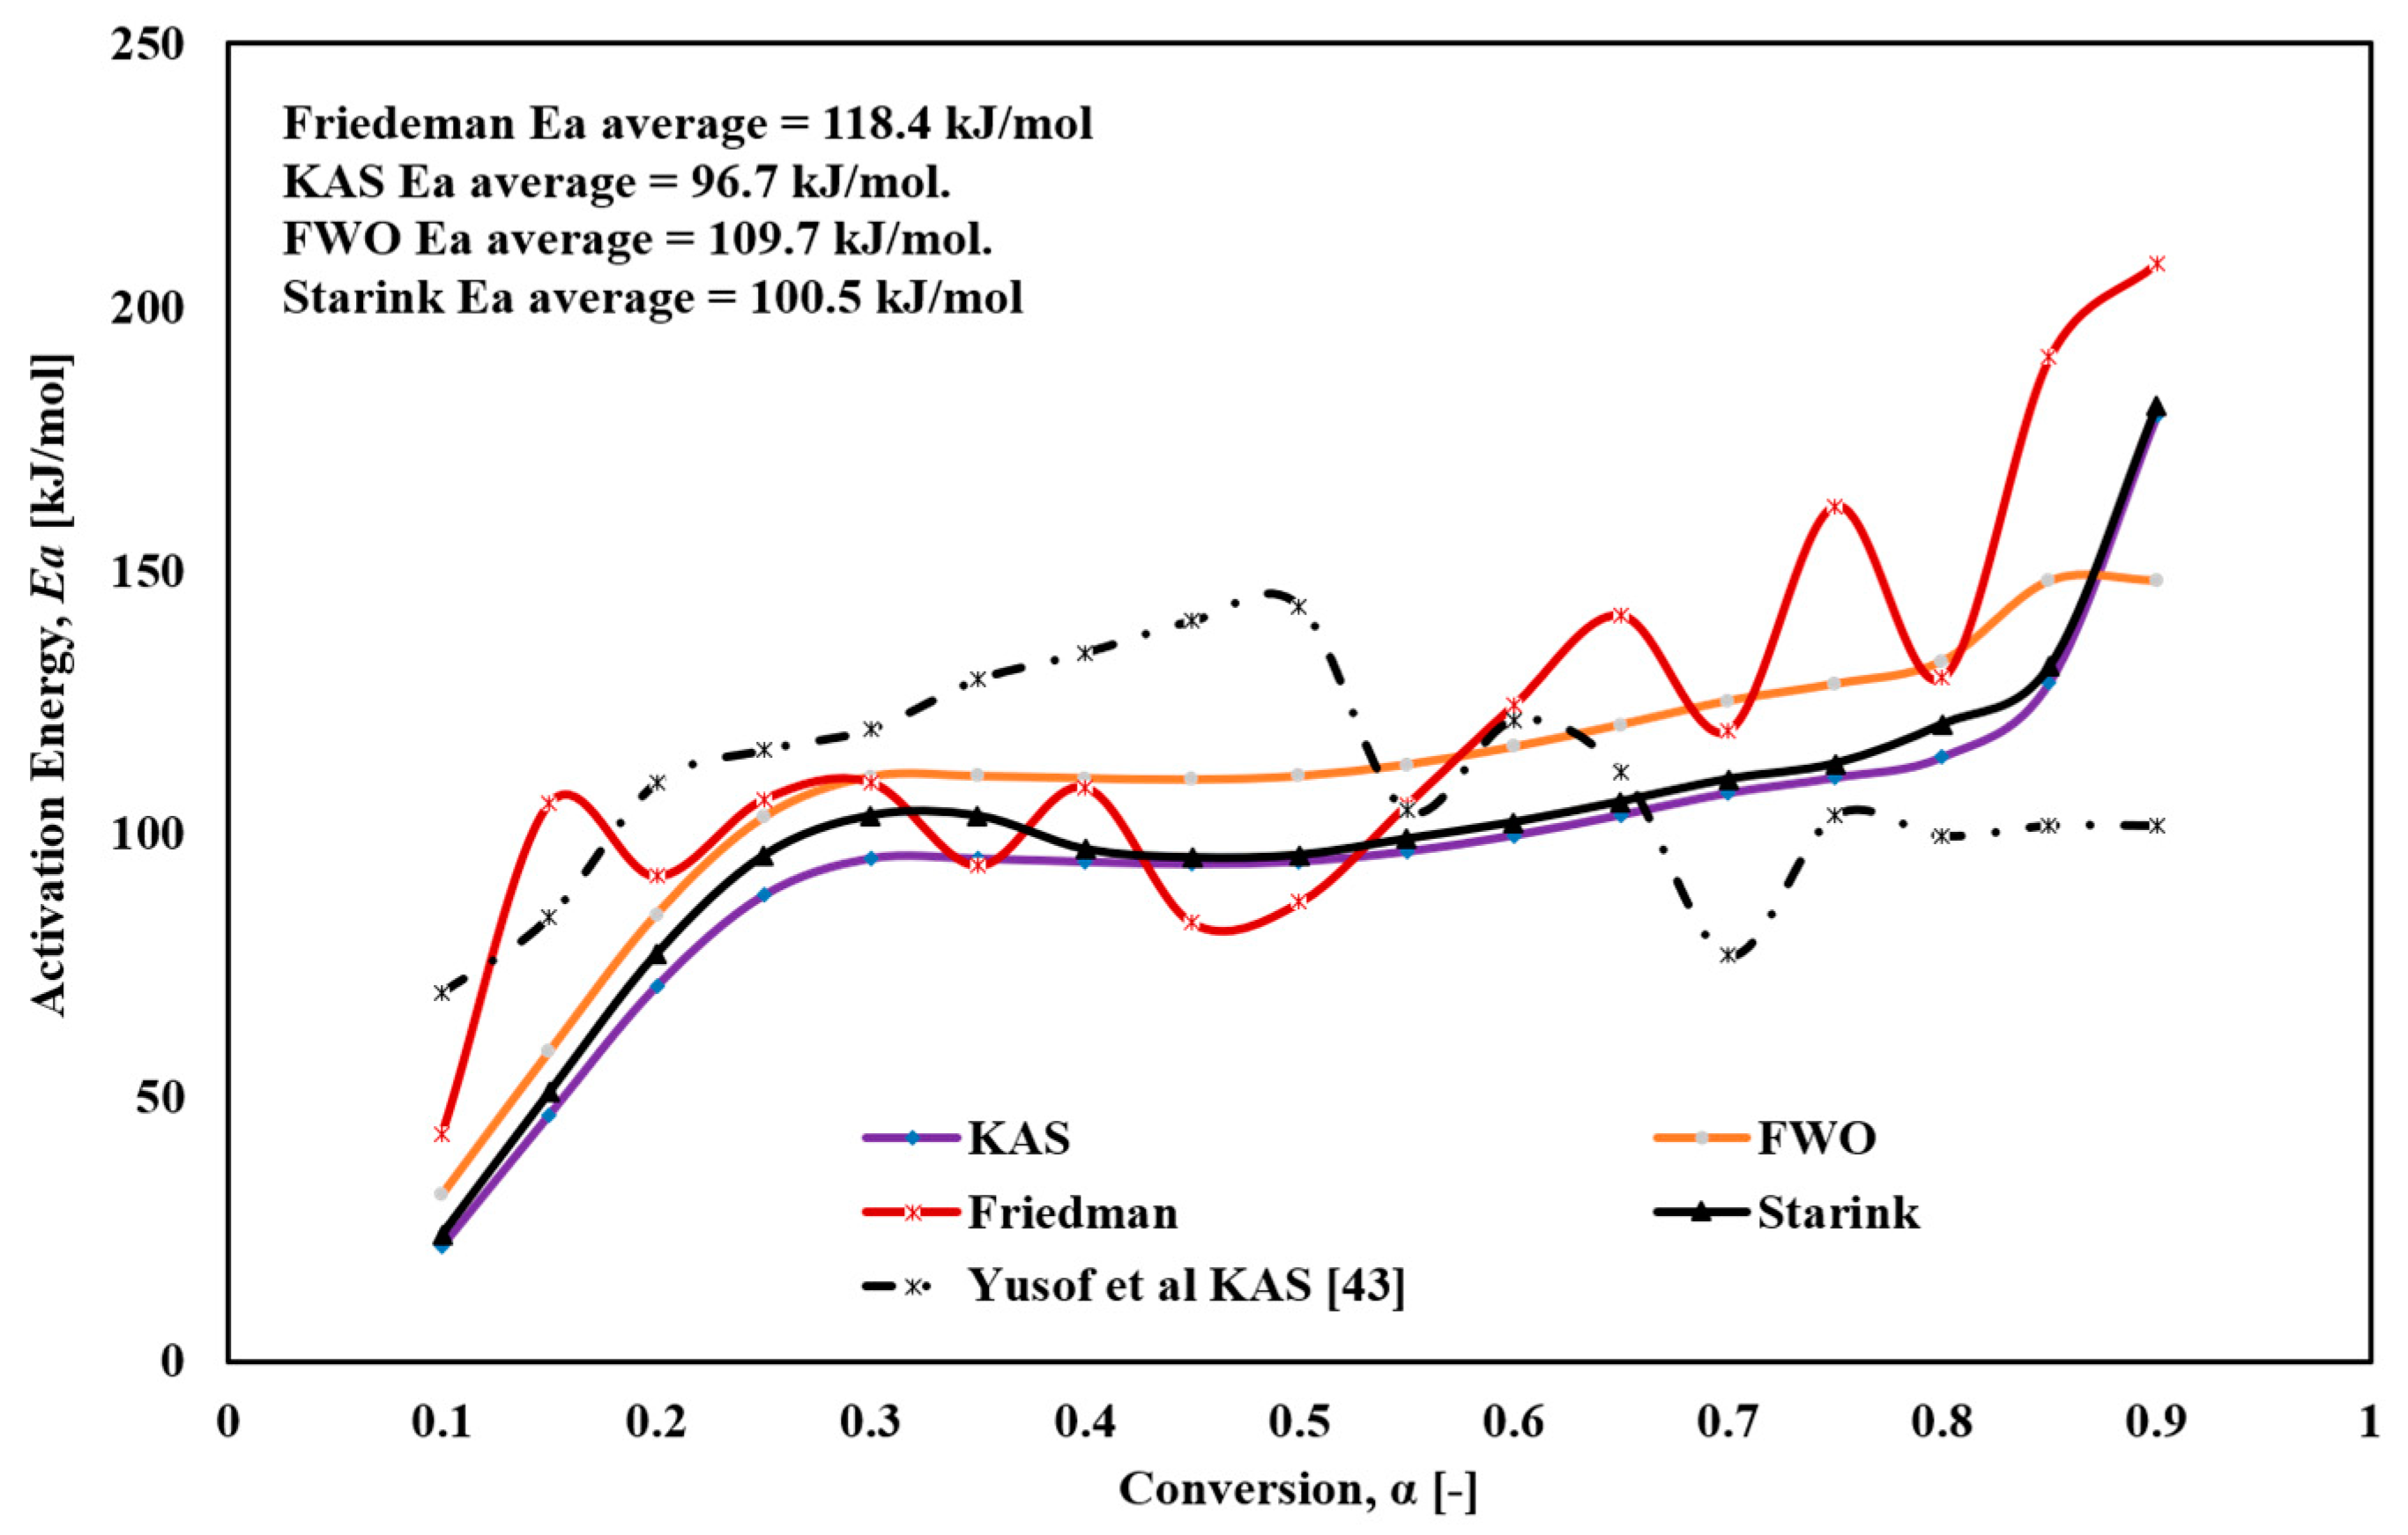
Figure 6 illustrates the variation of activation energy with conversion degree for the different models. The Friedmann method revealed significant fluctuations in Ea, ranging from 43.2 to 208.2 kJ/mol, which could be attributed to the complex multi-step reactions, such as parallel and continuous reactions, occurring during thermal decomposition. The sensitivity of the Friedmann method, which relies on the differential derivatives of experimental mass-change or conversion data as functions of time or temperature, allows it to detect subtle changes in activation energy along the reaction path. However, this high sensitivity also makes it susceptible to noise and random fluctuations, resulting in challenges in distinguishing true changes in Ea from random noise. The FWO method showed an increase in Ea from 31.3 to 148.3 kJ/mol, with an average of 109.7 kJ/mol. For the KAS method, Ea increased from 22.3 to 179.3 kJ/mol, with an average value of 96.6 kJ/mol. For the Starink method, Ea increased from 24.1 to 181.3 kJ/mol, with an average value of 100.5 kJ/mol.
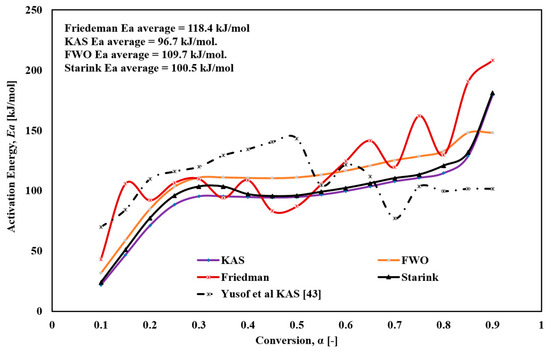
Figure 6.
The variation of Ea versus global conversion (α) for FTFW derived by the different iso-conversional methods.
Regarding the conversion values α, the thermal decomposition of FTFW as modeled by KAS, FWO, and Starink is challenging to describe as a single-stage reaction. At the onset of decomposition (α = 0.1), minimal heat is required to remove moisture, some fried oil, and light volatile substances from the fish waste samples. Following this, Ea increases rapidly, peaking at α = 0.3, consistent with the initiation of the thermal decomposition of the main components in the fried fish waste samples, as shown in Figure 4. A stabilization phase follows during α = 0.3−0.65, after which Ea steadily increases until α = 0.9, corresponding to the decomposition and char formation processes.
Overall, the methods used in this study demonstrated a significant reduction in activation energy, underscoring the economic importance of this type of waste as it requires minimal energy input for pyrolysis. While the activation energy values obtained using the four methods were generally consistent, slight differences were observed. The Ea values determined by the Friedmann method were slightly higher than those obtained using KAS, FWO, and Starink. This discrepancy arises from the numerous approximations and assumptions inherent to the latter methods, whereas the Friedmann method, as a differential approach, does not rely on such assumptions and approximations.
The activated energy values determined using the different integral methods were compared with those of other feedstocks reported in the literature, as shown in Table 4. The results showed that the activation energy of FTFW was lower than that of Sardinella fimbriata fish waste. This can be attributed to the differences in the fish type and frying process of FTFW, which can enhance and accelerate the decomposition of fish waste. The calculated value of the activation energy was close to that of the other feedstocks, indicating competition for pyrolysis. Furthermore, the lower value of activation energy demonstrates the ability to use FTFW as a promising pyrolysis feedstock, as it requires low input heat for reaction initiation.
Table 4.
Comparison of activation energy of the present study with other feedstocks.
The change in activation energy calculated in this study is attributed to the heterogeneous composition of FTFW. The existence of lipid-rich residues from frying oil promotes a decrease in the activation energy at lower conversion stages (α < 0.3) because lipids are highly volatile and decompose more easily than minerals and proteins. In contrast, protein-rich fractions, such as fish bones and connective tissues, need higher activation energy for decomposition, which leads to fluctuations of activation energy at higher conversion extents. This observation agrees with previous studies related to the pyrolysis of raw fish waste, where higher ash content and protein resulted in increasing the activation energy. As indicated in Table 4, the average values of Ea for FTFW (96.7–109.7 kJ/mol) are lower than those for Sardinella fimbriata fish waste (83.75–123.75 kJ/mol). This difference demonstrates the effect of frying oil in promoting the decomposition kinetics and lowering the energy requirement. The presence of frying oil residual in FTFW distinguishes it from other raw fish wastes, likely improving bio-oil yield and declining the required energy for thermal degradation. In addition, other additives used during the frying process, like salt and flour, can affect the thermal decomposition behavior of FTFW, as these additives can introduce additional pathways of the reaction or catalyze certain decomposition steps, resulting in Ea fluctuations.
4.2.2. Reaction Mechanism F(α)
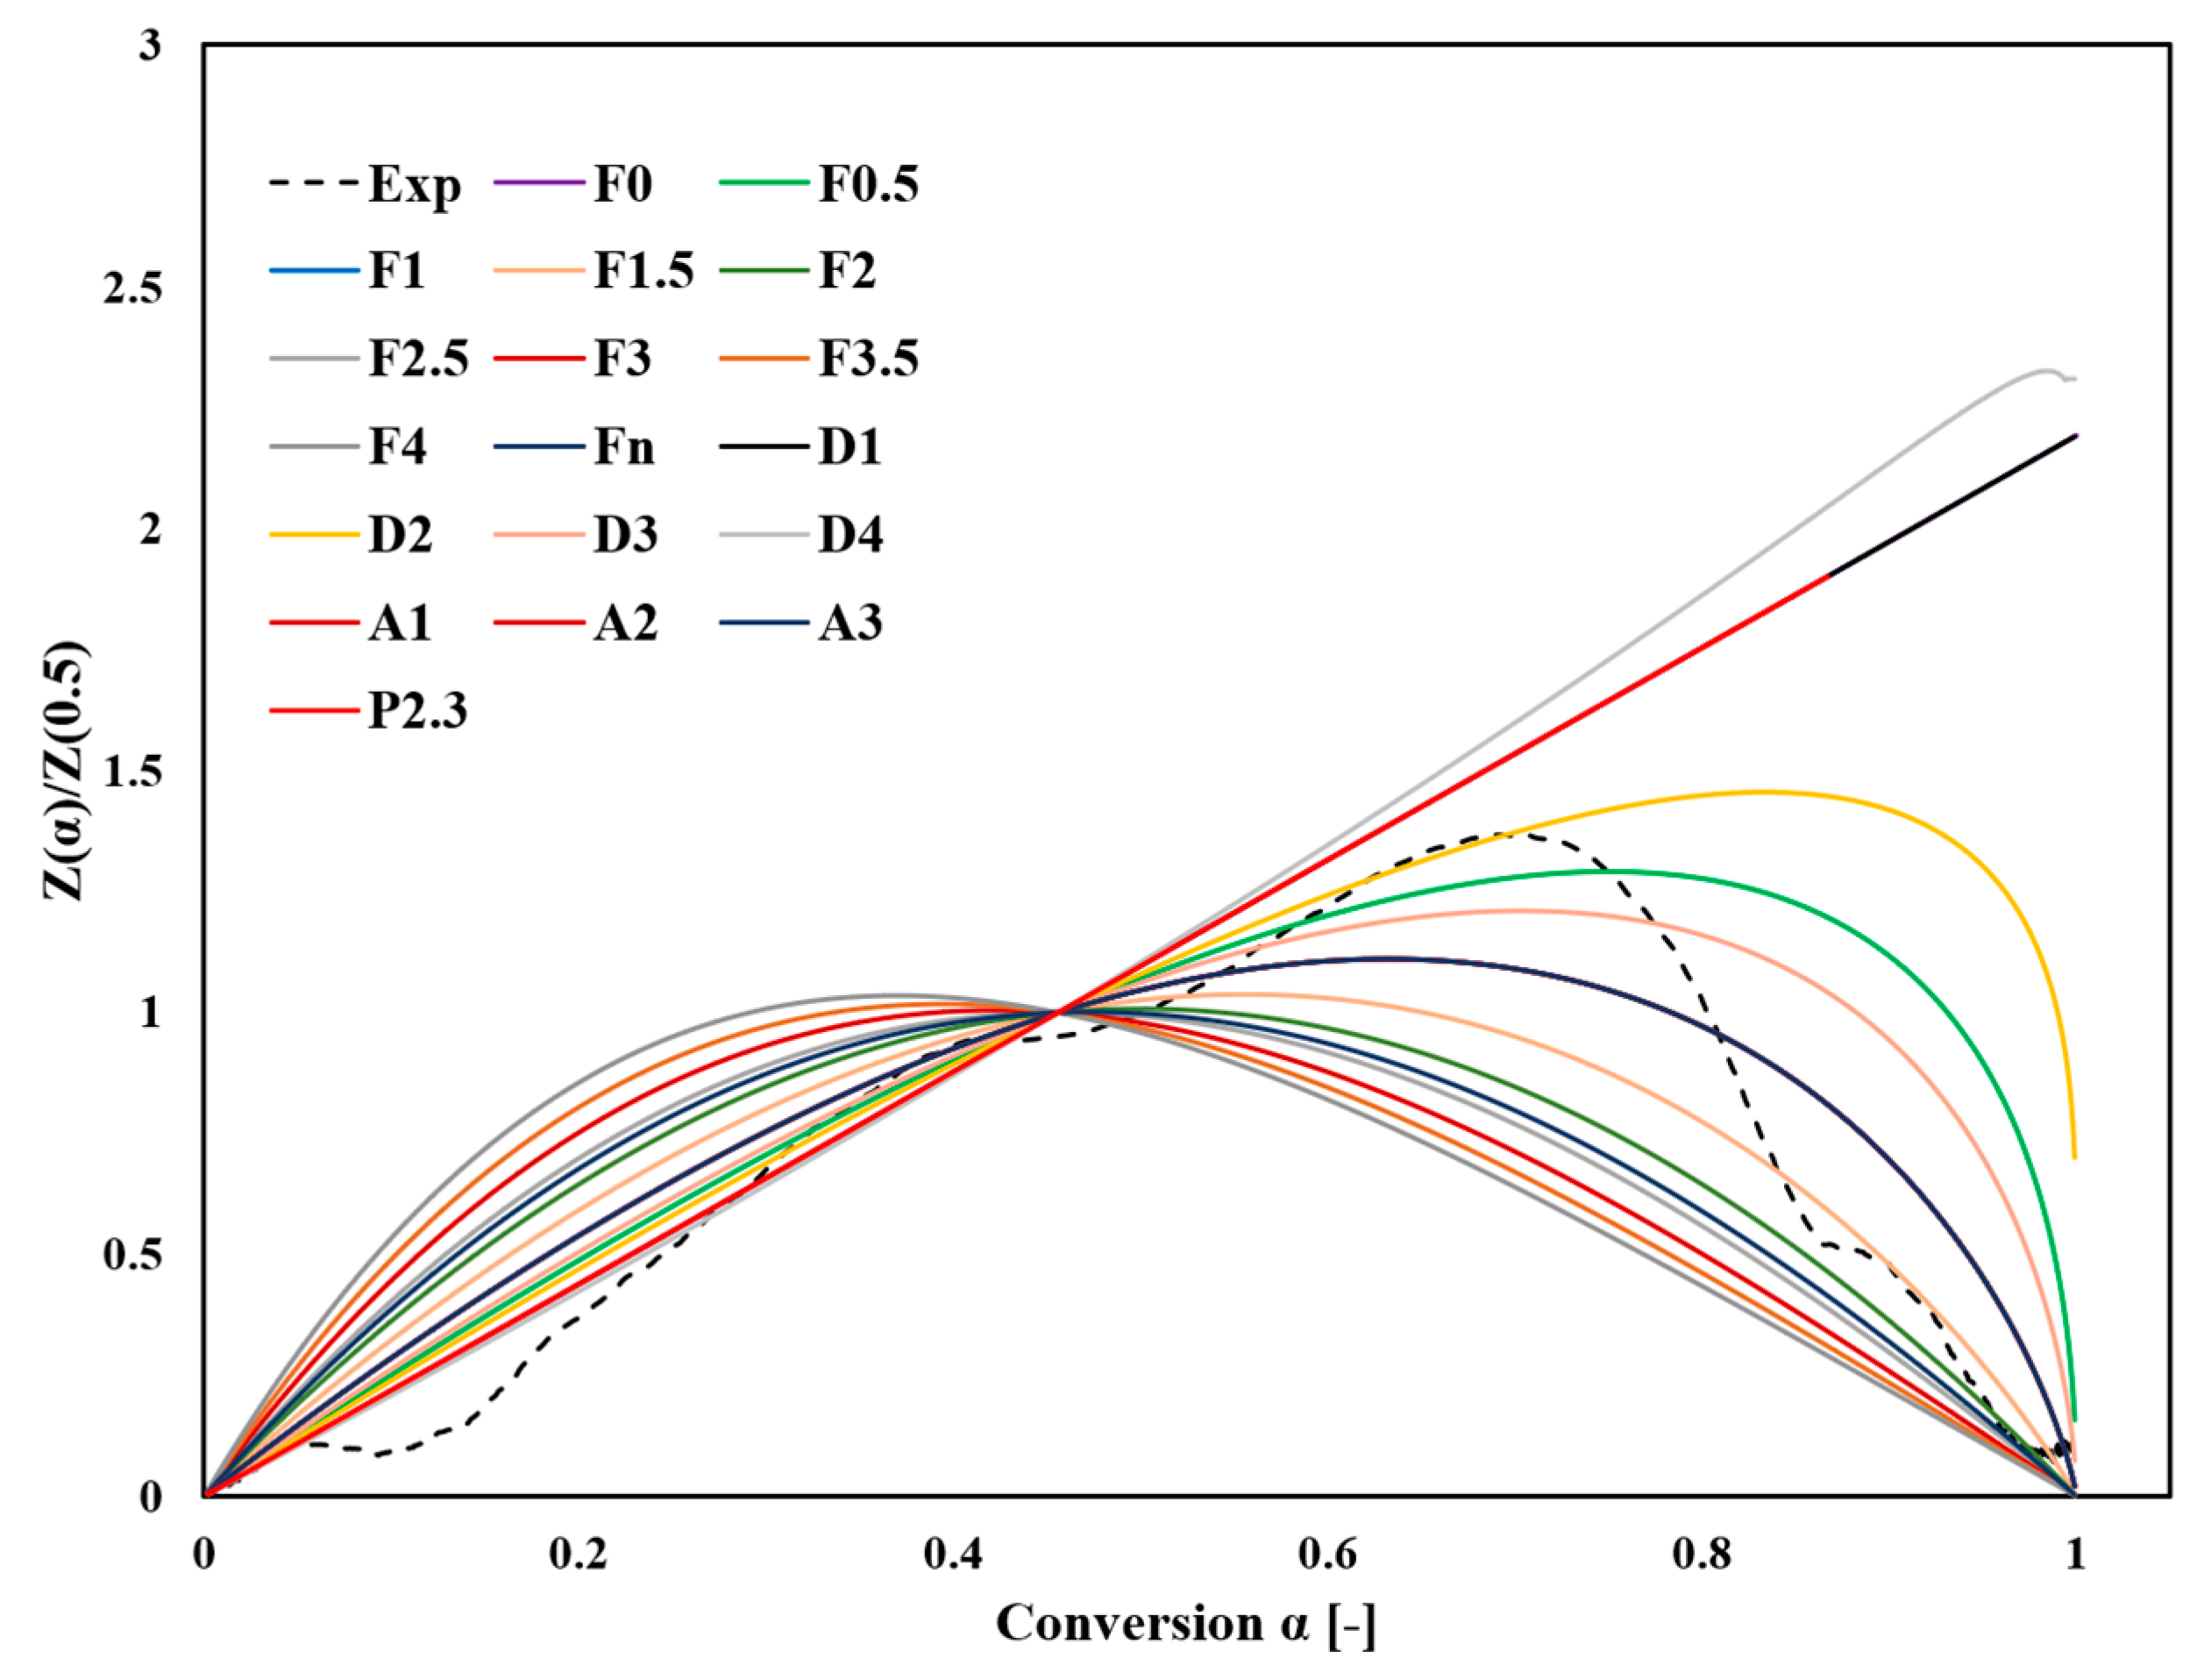
Figure 7 and Figure 8 provide a detailed comparison of the main plots of Z(α)/Z(0.5) and y(α)/y(0.5) between experimental measurements at a heating rate of 10 °C/min and several ideal reaction models presented in Table S1. The comparison was based on shape similarity rather than the exact accuracy of the fitting because these curves exhibited uniform properties.
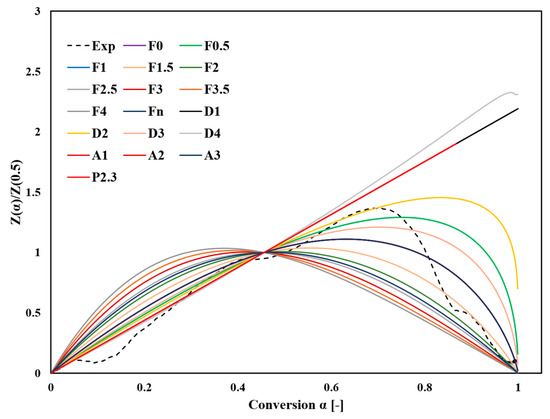
Figure 7.
Comparison between the experimental and theoretical master plot curves of normalized Z(α)/Z(0.5) constructed from the kinetic models in Table S1.
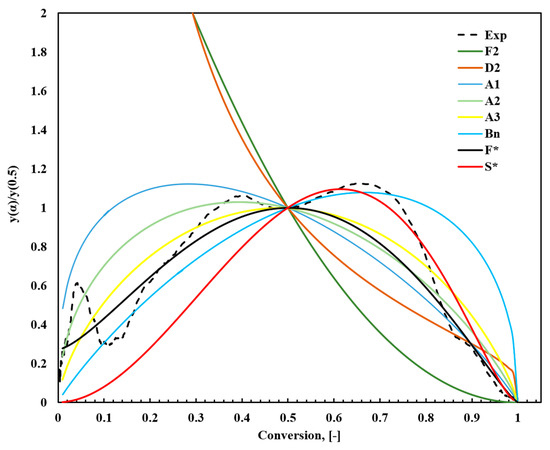
Figure 8.
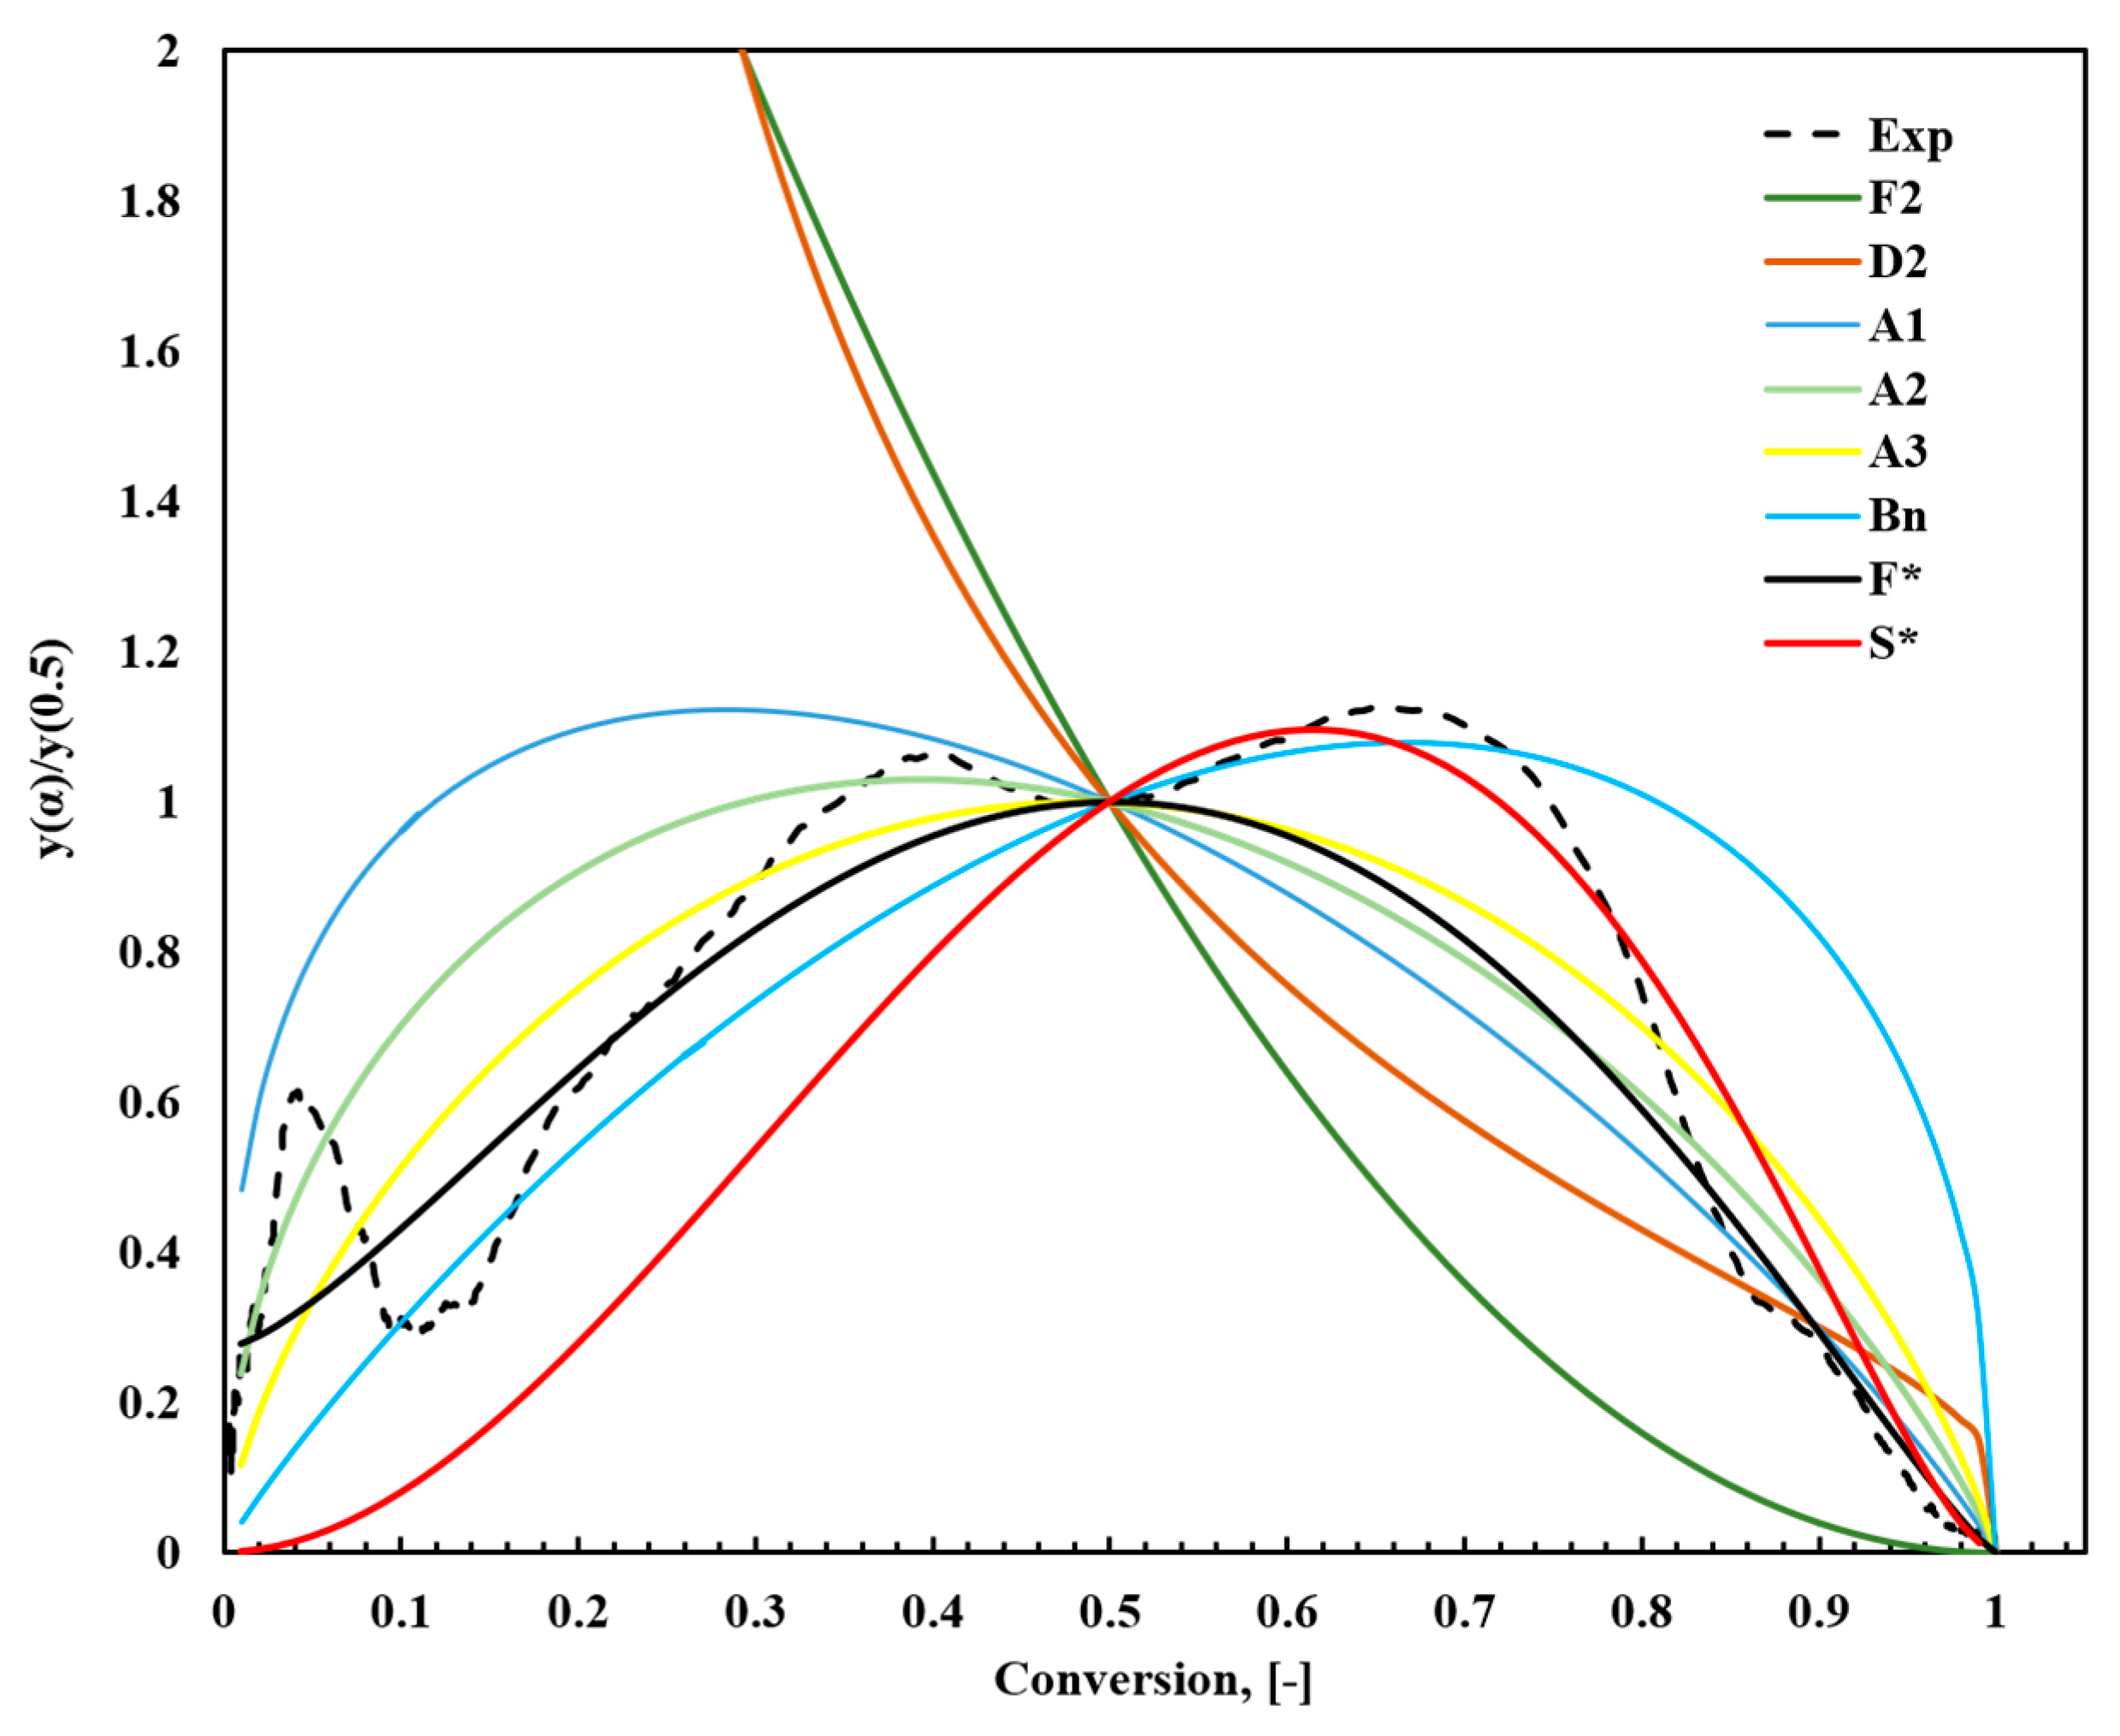
Comparison between the theoretical and experimental results of normalized y(α)/y(0.5) constructed from the kinetic models in Table S1.
The y(α)/y(0.5) comparison facilitates evaluating experimental approaches that are challenging to directly compare with Z(α)/Z(0.5). By normalizing the transformation curves at the midpoint α = 0.5, differences in reaction mechanisms and corresponding model fits become more distinguishable. Figure 7 shows that the bell-shaped symmetry of the experimental curve up to a fractional transformation of 0.7 suggests the relevance of the second-order F2 and D2 diffusion models. This finding implies that reaction kinetics are significantly influenced by the rapid decomposition processes in the initial stage, particularly for α > 0.1 at temperatures below 193 °C. This stage is critical, as it determines the activation energy Ea.
Experimental data were further analyzed using the Šesták–Berggren model (Equation (14)), and the autocatalytic reaction model proposed by Snegirev (Equation (15)). The Šesták–Berggren model, with its flexible combination of parameters (m, n, and p), effectively represents various reaction mechanisms and is particularly useful for capturing complex sigmoidal reaction patterns. In contrast, the Snegirev model targets autocatalytic reactions, where n and m define the reaction order, and α* represents the autocatalytic effect. These models were systematically compared with the experimental y(α) plot to identify the best-fitting reaction mechanisms. Notably, the experimental analysis of fish waste does not match any predefined models because the pyrolysis process involves complex conversion chemistry. Owing to its complex nature, it is difficult to relate FTFW pyrolysis to a single-conversion model.
The analysis revealed that for α < 0.5, the experimental data closely aligned with the Šesták–Berggren model [74], reflecting the complexity and multistep nature of the initial reaction stages. For α > 0.5, the autocatalytic reaction model by Snegirev [76] provided the strongest agreement, likely due to the impact of reaction products on the reaction rate during later stages. Table 5 summarizes the comprehensive comparison and detailed parameter fitting, highlighting how each model aligns with different reaction stages. This multifaceted analysis emphasizes the importance of using a suite of models to accurately describe the kinetics of complex thermal decomposition processes.
Table 5.
Analysis of the most suitable model validity from the results of the y(α) master plot.
In conclusion, the Snegirev autocatalytic and Šesták–Berggren models offered the best fits for the experiment. The Šesták–Berggren model is efficient for describing the initial stages of decomposition (α < 0.5) due to its flexible combination of parameters (m, n, and p), which allow the model to describe a wide range of reaction mechanisms, such as sigmoidal patterns that characterize the complex reactions involving multiple steps. On the other hand, the Snegirev autocatalytic model considers an autocatalytic effect, represented by the parameter α*, which is responsible for the acceleration of the reaction as more products are formed.
4.2.3. Pre-Exponential Factor
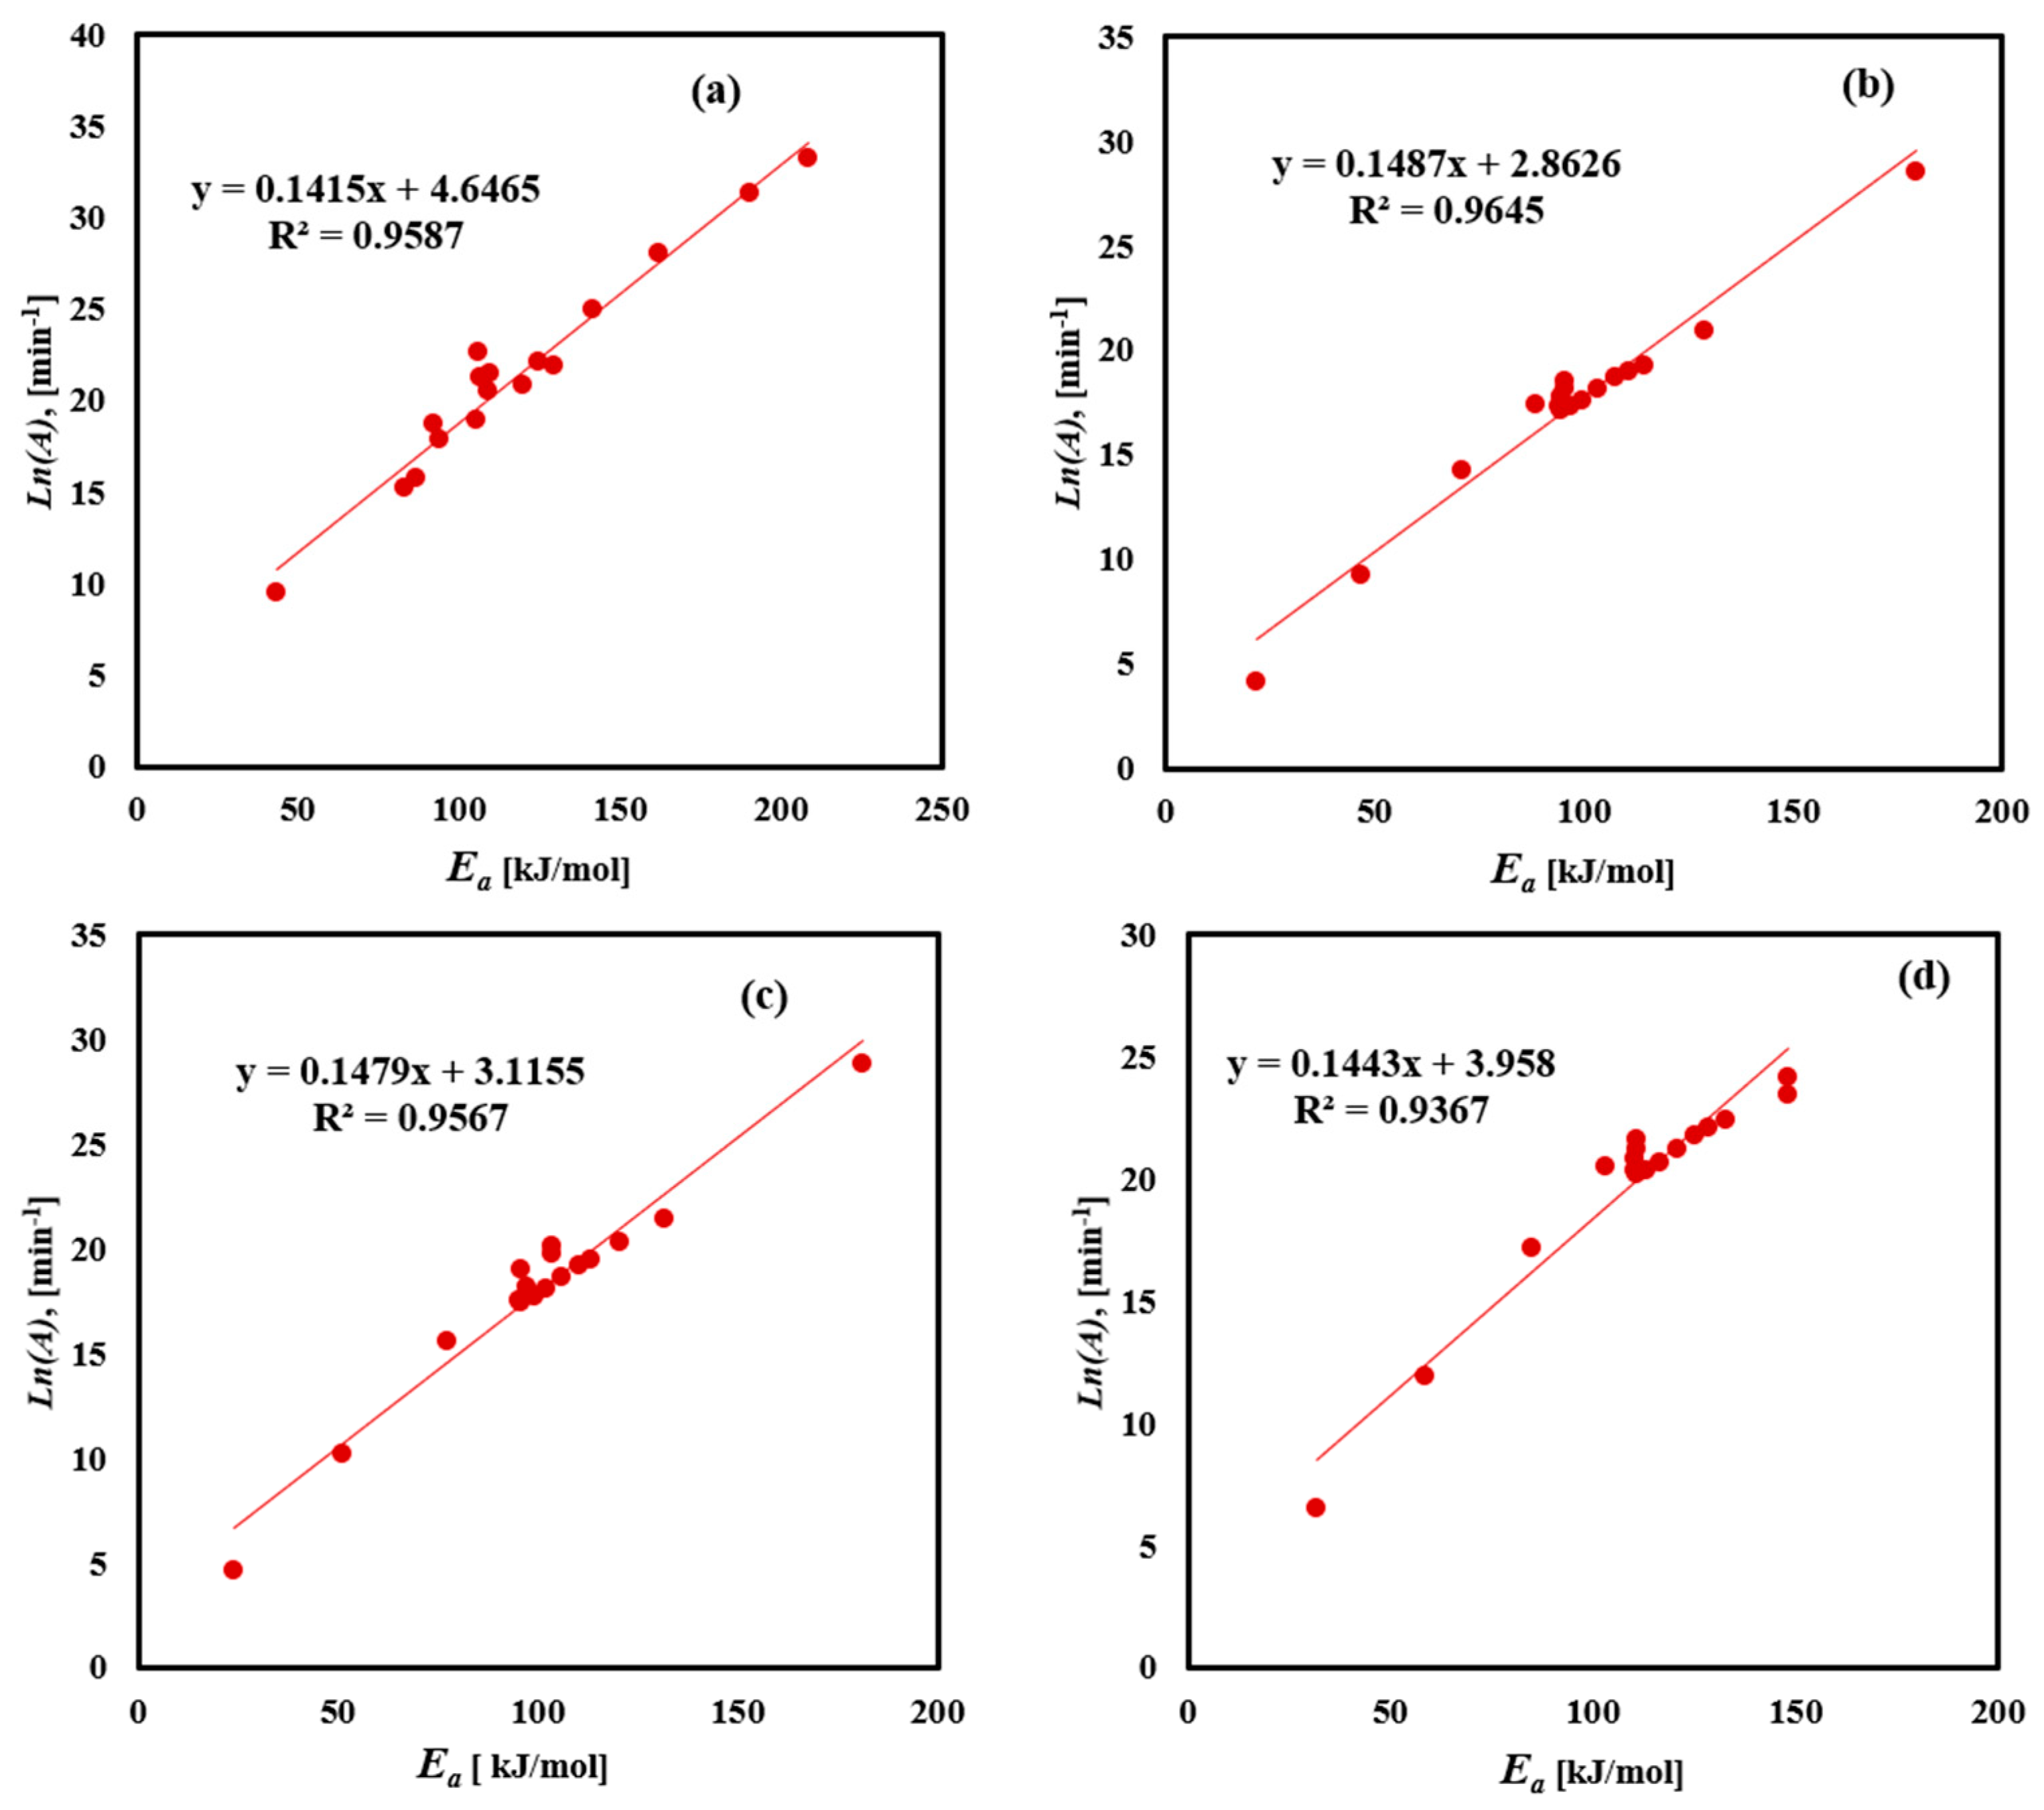
The pre-exponential factor (A) physically represents the molecules’ vibration frequency found in the reaction. Figure 9 and Table 6 illustrate the linear relationship between Ea and ln A, for the decomposition of FTFW using four methods. The data show a clear linear trend with high accuracy of fit, confirming the compensation effect. As temperature increases, the molecular vibrations intensify, leading to greater bending and stretching of molecules. This affects the compensation effect found in the data points, particularly from medium to high conversion values, as indicated by an excellent fit factor in Table 6. The variability in pre-exponential factor values obtained using the Friedman method ranging from 1.29 × 10⁴ to 2.64 × 10¹⁴, with an average of 1.78 × 10¹³ min−1, reflects the activation energy fluctuations during conversion, attributed to noise in the results and the complexity of FTFW decomposition. The KAS method showed pre-exponential factor values ranging from 6.09 × 10² to 2.38 × 10¹³, with an average of 1.4 × 10¹¹ min−1. The FWO method’s pre-exponential factor values ranged from 6.93 × 10² to 3.02 × 10¹⁰, with an average of 3.95 × 10⁹ min−1, while the Starink method had an average pre-exponential factor value of 1.92 × 10⁹ min−1. A low value of pre-exponential factor (lower than 109) indicates closed complex formation, whereas a higher value suggests the formation of a simpler complex during the thermal decomposition process. The consistent linear relationship between Ea and ln A across the different methods underscores the validity of the compensation effect in analyzing the FTFW decomposition. The change in pre-exponential factor values ranging from 109 to 1013 min⁻1 across different models indicates the complex multi-step nature of FTFW pyrolysis, affected by the thermal breakdown of proteins, carbohydrates, and fats. This illustrates the need to optimize the heating rates in reactor design for maximum bio-oil production.
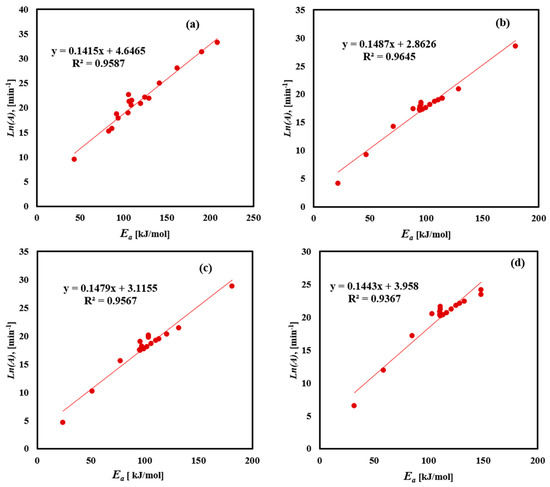
Figure 9.
Linear fitting correlation between Ea and ln(A) for FTFW derived by the (a) Friedman, (b) KAS, (c) Starink, and (d) FWO iso-conversional methods.
Table 6.
The variation and linear fitting equations of Ea and ln(A) for FTFW obtained by Friedman, KAS, Starink, and FWO methods.
4.3. Thermodynamic Analysis Results
The thermodynamic properties are critical for the design, expansion, and optimization of pyrolysis reactors and their operational parameters. These properties provide valuable insights into the energy dynamics and spontaneity of the reactions within the reactor, helping assess the feasibility, nature, and efficiency of the pyrolysis process. Accurate thermodynamic data enable the prediction of system behavior under varying conditions, ensuring that the reactor is designed and operated to maximize yield and energy efficiency [87]. The thermodynamic evaluations in this study relied on kinetic data derived from activation energy estimates obtained using four methods: Friedman, KAS, FWO, and Starink.
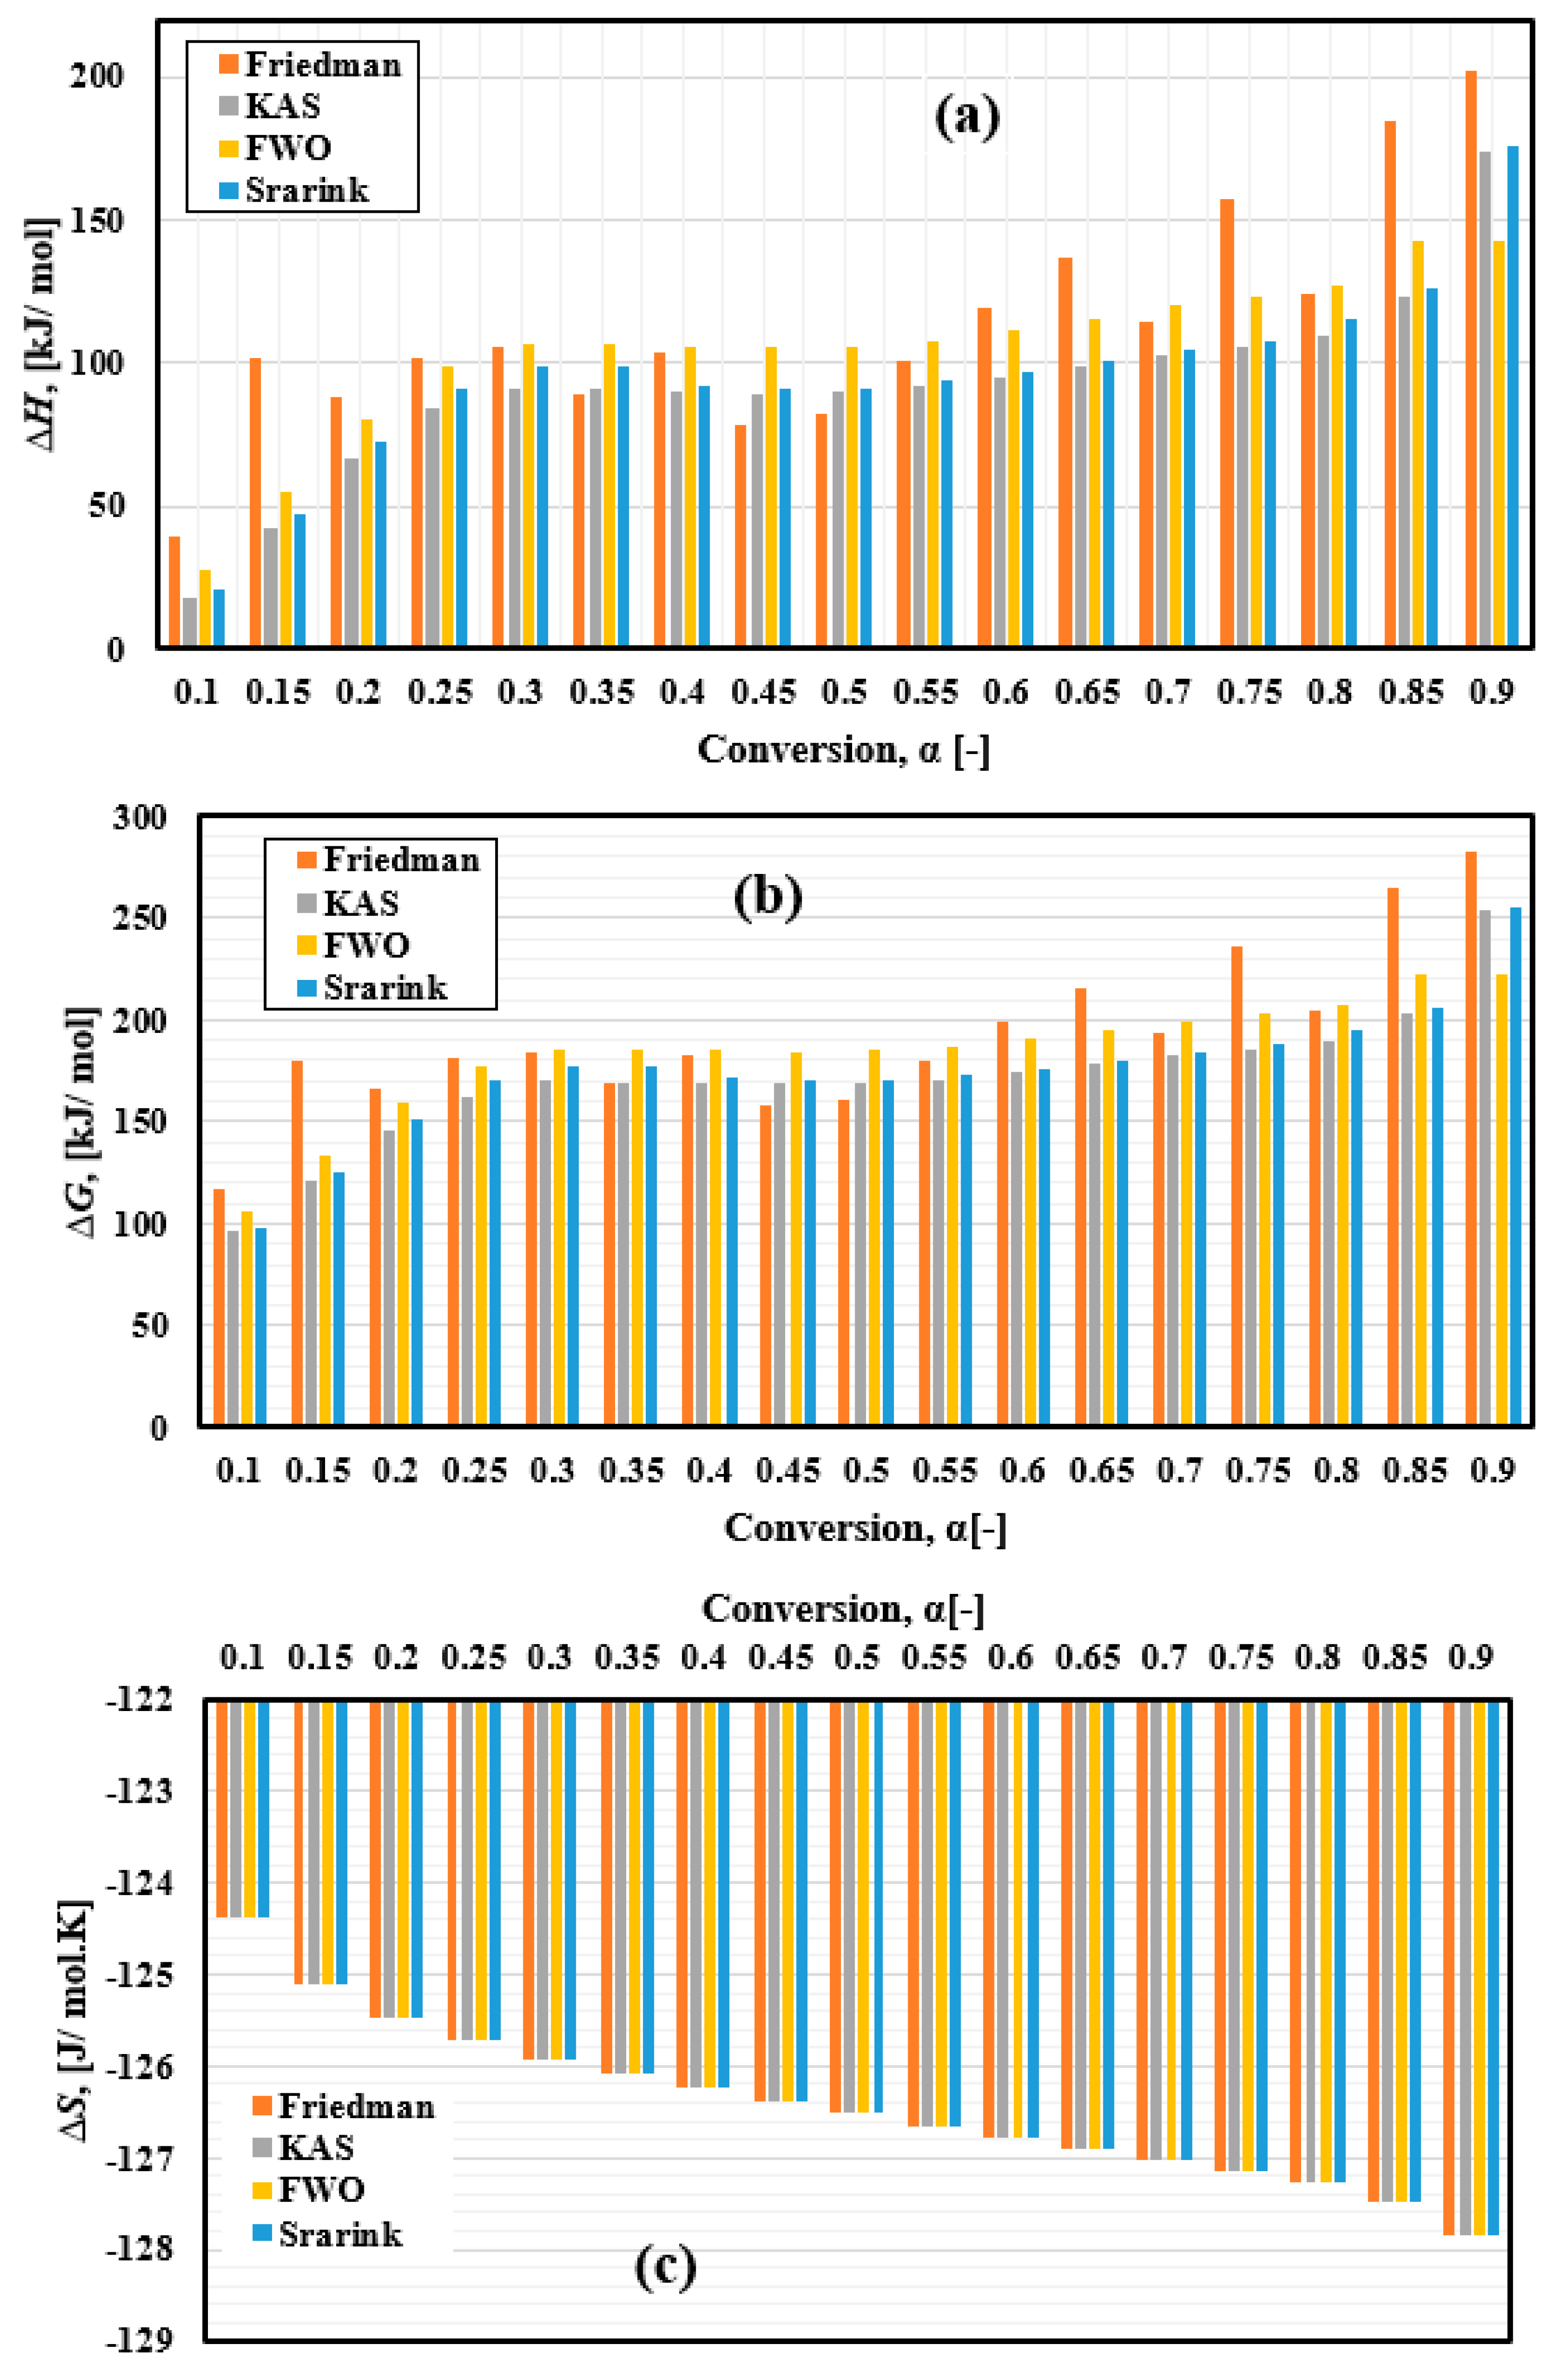
One of the primary thermodynamic properties analyzed was the enthalpy change ΔH, which reflects the energy required for the thermal decomposition of FTFW. It represents the energy difference between the initial raw material and its conversion into various bioproducts, as illustrated in Figure 10a. This property is fundamental for understanding the energy demands of the decomposition process. The enthalpy change depends on activation energy, as lower enthalpy changes facilitate the formation of an activated complex [88,89]. The calculated ΔH range for FTFW thermal decomposition varied by method: 39.56–202.32 kJ/mol for the Friedman method, 18.03–173.46 kJ/mol for the KAS model, 20.9–175.35 kJ/mol for the Starink model, and 27.94–142.59 kJ/mol for the FWO model.
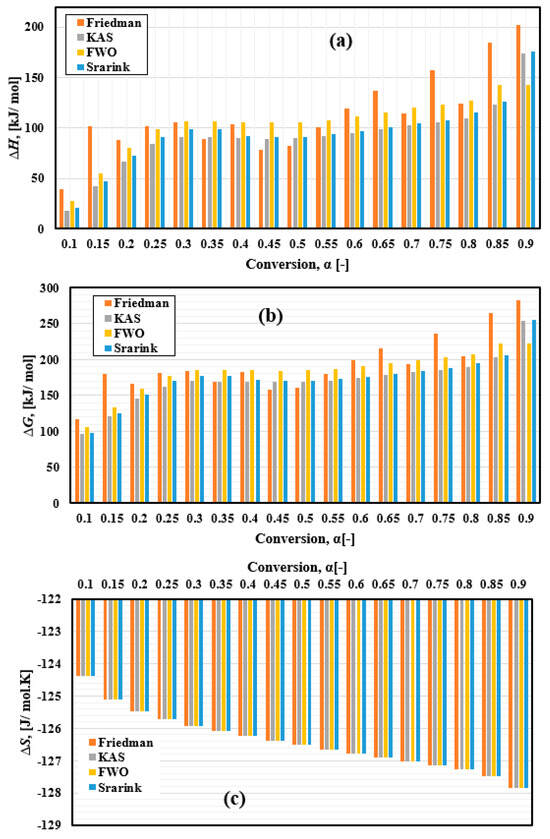
Figure 10.
Thermodynamic parameters of FTFW pyrolysis variation with conversion α derived by different iso-conversional methods. (a) ∆H, (b) ∆G, and (c) ∆S.
The second parameter is ∆G, a fundamental parameter in thermodynamics that determines the amount of energy available in FTFW for chemical transformation and generation of the activated compound. Gibbs free energy accounts for changes in enthalpy and entropy. The ∆G was estimated at a heating rate of 10 °C/min, and the results are presented in Figure 10b and Table 6. The average values of ∆G using the Friedman, KAS, Starink, and FWO methods were 192.71, 171.04, 183.99, and 174.83 kJ/mol, respectively. In comparison, most of the Gibbs free energy values calculated by the four methods are high, indicating the presence of sufficient useful energy to make them sources of biofuel production compared to different types of solid biofuels. The ∆G always showed positive values throughout the process, indicating that the FTFW pyrolysis is a non-spontaneous reaction, which means that it needs an external thermal energy source. It can be seen from Figure 10a,b that both ∆G and ∆H depend on the activation energy results, raising at the start of the process and then staying almost constant within the conversion extent, ranging from 0.2 to 0.75 and rapidly increasing towards the end. The char produced during the reaction may result in a decrease in mass transfer in the final stages of the reaction, which can decrease the process feasibility, as can be seen in the reference [56]. Notably, the effect of fluctuations in the activation energy resulting from the Friedmann method dramatically affects the results of both ∆G and ∆H. As the activation energy is the largest in the Friedmann method, higher values of ∆G and ∆H were also introduced. The current results are compared with previous results in Table 7.
Table 7.
Average values of thermodynamic parameters computed by the current study and those from literature.
The variation in entropy, as shown in Figure 10c, illustrates the disorder occurring in the system during the thermal decomposition of the FTFW. The negative values of ΔS demonstrated that the product’s disorder degree was lower than that of the reactant. This shows that the results of the decomposition of processes, such as bio-oil, char, and gas, are more organized than those of fish waste samples.
5. Error Analysis
The application of iso-conversional methods to determine the triplet kinetic and thermodynamic parameters may contain errors. The sources of error involving the selected models include the following:
- ▪
- Assumption of a single reaction mechanism while the FTFW pyrolysis consists of multiple overlapping reactions (degradation of lipids, proteins, and residual carbohydrates).
- ▪
- Uncertainties in TGA experiments, including heating rate changes, mass loss fluctuations, and instrumental sensitivity.
- ▪
- The linear regression model’s limitation, which supposes an ideal reaction pathway without considering the impact of heat and mass transfer.
6. Economic or Feasibility Study
There are various key parameters, such as availability, input energy, feedstock characterizations, and waste valorization, that affect the economic feasibility of the pyrolysis system. As a consequence of the high consumption of Nile tilapia in Egypt, there is abundant fish waste, which ensures the FTFW availability. The high heating value (about 24–28 MJ/kg) of FTFW, along with high lipid and energy contents, makes FTFW more favoravle than biomass-based biofuels (18–25 MJ/kg) and comparable to traditional fuels like diesel (about 42–45 MJ/kg) [41]. The high heating value of FTFW signifies its capability to generate large amounts of high-energy bio-oil, which can be subsequently used in various applications as efficient liquid fuels. On the other side, FTFW had lower activation energy (100–120 kJ/mol) compared to other biomass materials, giving it a significant advantage. This implies that the FTFW pyrolysis requires low energy for its decomposition, potentially offering low initial energy costs and making it economically viable. By converting FTFW into biofuel, the costs of waste management can be minimized, solving both economic and environmental problems. The recovery of valuable by-products from pyrolysis, such as biochar, which can be used for soil amendment as well as syngas, which is used for industrial heating, promotes the overall economic viability of the FTFW pyrolysis process. An economically viable return on using FTFW as biofuel can be achieved depending on the costs of processing, transportation, and waste gathering [26]. Compared to traditional biofuel feedstocks, FTFW provides an economically viable option, such as vegetable oils or algae, because it is primarily produced in restaurants and households. Pyrolysis of food waste has been scientifically proven to be more effective for waste management than disposing of it in landfills, reducing the environmental impact. The industrial viability of pyrolysis of fish waste depends on a reliable supply chain, waste collection, and pretreatment, such as drying to optimize the pyrolysis of high-fat FTFW to produce a rich bio-oil, but this may require refining. Integrating the process with waste-to-energy systems or decentralized units in the fishery industry aims to improve economic viability and enhance the recovery of products such as biochar and biogas.
7. Conclusions
Fish waste, like other wastes, can serve as an energy source through the pyrolysis process. The evaluation of kinetic triplet parameters achieves optimal mass reduction and provides valuable insights into the pyrolysis process. Fried tilapia is a staple meal in Egypt, leading to significant waste generation from restaurants, hotels, and households. This waste cannot be recycled and is discarded as garbage, causing health and environmental problems. This study presents a detailed kinetic analysis of fried tilapia fish waste (FTFW) pyrolysis. The decomposition of FTFW was examined using TGA and DTG over a temperature range of 35–700 °C. The kinetic triplet parameters, including activation energy (Ea), reaction mechanism (f(α)), and pre-exponential factor (A), along with thermodynamic parameters such as enthalpy change (∆H), Gibbs free energy change (∆G), and entropy change (∆S), were calculated. Four iso-conversional methods, Friedman, KAS, Starink, and FWO, were employed for the kinetic analysis. The significant outcomes of this study are highlighted as follows.
The decomposition of FTFW occurred within a temperature range of 205–540 °C.
- ▪
- The average activation energy values calculated by the Friedman, KAS, Starink, and FWO methods were 118.4, 96.7, 109.7, and 100.5 kJ/mol, respectively.
- ▪
- The low activation energy of FTFW, compared to other feedstocks, highlights its potential as a promising candidate for the pyrolysis process.
- ▪
- The pre-exponential factor values obtained by the Friedman, KAS, Starink, and FWO methods were 1.78 × 10¹³, 1.4 × 10¹¹, 3.95 × 10⁹, and 1.92 × 10⁹ min⁻1, respectively.
- ▪
- The average enthalpy changes estimated using the Friedman, FWO, KAS, and Starink methods were 113.45, 91.78, 95.58, and 104.73 kJ/mol, respectively.
- ▪
- The average Gibbs free energy values for the Friedman, KAS, Starink, and FWO methods were 192.71, 171.04, 183.99, and 174.83 kJ/mol, respectively.
- ▪
- The results of this study offer essential information needed in the efficient design of pyrolysis reactors, indicating the need for optimizing pyrolysis conditions. The results guide the design of efficient pyrolysis reactors, which are useful for waste-to-energy applications, and thus will enhance sustainable biofuel production and improve the valorization strategies for waste.
Other research areas should be considered, including experimental pyrolysis, bio-oil and biochar characterization, and techno-economic aspects for large-scale feasibility, investigating the catalytic and co-pyrolysis techniques to improve bio-oil productivity, quality, and stability. The impact of other frying conditions, such as oil type, frying temperature, and duration, on thermal degradation should also be considered.
Supplementary Materials
The following supporting information can be downloaded at: https://www.mdpi.com/article/10.3390/recycling10020061/s1, Table S1: The kinetic models with symbols, f(α), and g(α).
Author Contributions
Conceptualization, I.-T.I. and G.W.L.; Methodology, H.M.A.; Validation, H.M.A.; Formal analysis, M.K.M.H.; Investigation, M.K.M.H.; Writing—original draft, M.K.M.H. and H.M.A.; Writing—review and editing, I.-T.I.; Supervision, I.-T.I. and G.W.L.; Project administration, H.M.A.; Funding acquisition, G.W.L. All authors have read and agreed to the published version of the manuscript.
Funding
This research received no external funding.
Institutional Review Board Statement
Not applicable.
Informed Consent Statement
Not applicable.
Data Availability Statement
The original contributions presented in this study are included in the article/Supplementary Material. Further inquiries can be directed to the corresponding author.
Conflicts of Interest
The authors declare no conflict of interest.
References
- Cabrera-Jiménez, R.; Mateo-Sanz, J.M.; Gavaldà, J.; Jiménez, L.; Pozo, C. Comparing biofuels through the lens of sustainability: A data envelopment analysis approach. Appl. Energy 2022, 307, 118201. [Google Scholar] [CrossRef]
- Amigun, B.; Musango, J.K.; Stafford, W. Biofuels and sustainability in Africa. Renew. Sustain. Energy Rev. 2011, 15, 1360–1372. [Google Scholar] [CrossRef]
- Brennan, L.; Langley, S.; Verghese, K.; Lockrey, S.; Ryder, M.; Francis, C.; Phan-Le, N.T.; Hill, A. The role of packaging in fighting food waste: A systematised review of consumer perceptions of packaging. J. Clean. Prod. 2021, 281, 125276. [Google Scholar] [CrossRef]
- Gustafsson, U.; Wills, W.; Draper, A. Food and Public Health: Contemporary Issues and Future Directions; Routledge: London, UK, 2015; pp. 1–9. [Google Scholar] [CrossRef]
- Lorenz, B.A.S.; Hartmann, M.; Langen, N. What makes people leave their food? The interaction of personal and situational factors leading to plate leftovers in canteens. Appetite 2017, 116, 45–56. [Google Scholar] [CrossRef]
- Xu, Z.; Zhang, Z.; Liu, H.; Zhong, F.; Bai, J.; Cheng, S. Food-away-from-home plate waste in China: Preference for variety and quantity. Food Policy 2020, 97, 101918. [Google Scholar] [CrossRef]
- Yin, Y.; Liu, Y.J.; Meng, S.J.; Kiran, E.U.; Liu, Y. Enzymatic pretreatment of activated sludge, food waste and their mixture for enhanced bioenergy recovery and waste volume reduction via anaerobic digestion. Appl. Energy 2016, 179, 1131–1137. [Google Scholar] [CrossRef]
- Yong, Z.; Dong, Y.; Zhang, X.; Tan, T. Anaerobic co-digestion of food waste and straw for biogas production. Renew. Energy 2015, 78, 527–530. [Google Scholar] [CrossRef]
- Su, G.; Ong, H.C.; Fattah, I.M.R.; Ok, Y.S.; Jang, J.H.; Wang, C.T. State-of-the-art of the pyrolysis and co-pyrolysis of food waste: Progress and challenges. Sci. Total Environ. 2022, 809, 151170. [Google Scholar] [CrossRef]
- Koraiem Handawy, M.; Yu Snegirev, A.; Stepanov, V.V.; Talalov, V.A. Energy recovery strategies as a sustainable solutions for municipal solid waste in Egypt. IOP Conf. Ser.: Mater. Sci. Eng. 2021, 1100, 012052. [Google Scholar] [CrossRef]
- FAO. The State of World Fisheries and Aquaculture. Towards Blue Transformation; FAO: Rome, Italy, 2022. [Google Scholar]
- Alfio, V.G.; Manzo, C.; Micillo, R. From Fish Waste to Value: An Overview of the Sustainable Recovery of Omega-3 for Food Supplements. Molecules 2021, 26, 1002. [Google Scholar] [CrossRef]
- Ferraz De Arruda, L.; Borghesi, R.; Oetterer, M. Use of fish waste as silage: A review. Braz. Arch. Biol. Technol. 2007, 50, 879–886. [Google Scholar] [CrossRef]
- Salah, S.I.; Eltaweel, M.; Abeykoon, C. Towards a sustainable energy future for Egypt: A systematic review of renewable energy sources, technologies, challenges, and recommendations. Clean. Eng. Technol. 2022, 8, 100497. [Google Scholar] [CrossRef]
- Bu, Q.; Chen, K.; Morgan, H.M.; Liang, J.; Zhang, X.; Yan, L.; Mao, H. Thermal Behavior and Kinetic Study of the Effects of Zinc-Modified Biochar Catalyst on Lignin and Low-Density Polyethylene (LDPE) Co-Pyrolysis. Trans. ASABE 2018, 61, 1783–1793. [Google Scholar] [CrossRef]
- Qiu, L.; Li, C.; Zhang, S.; Wang, S.; Li, B.; Cui, Z.; Tang, Y.; Hu, X. Distinct property of biochar from pyrolysis of poplar wood, bark, and leaves of the same origin. Ind. Crops Prod. 2023, 202, 117001. [Google Scholar] [CrossRef]
- Jing, Y.; Zhang, Y.; Han, I.; Wang, P.; Mei, Q.; Huang, Y. Effects of different straw biochars on soil organic carbon, nitrogen, available phosphorus, and enzyme activity in paddy soil. Sci. Rep. 2020, 10, 8837. [Google Scholar] [CrossRef]
- Park, Y.K.; Lee, B.; Lee, H.W.; Watanabe, A.; Jae, J.; Tsang, Y.F.; Kim, Y.M. Co-feeding effect of waste plastic films on the catalytic pyrolysis of Quercus variabilis over microporous HZSM-5 and HY catalysts. Chem. Eng. J. 2019, 378, 122151. [Google Scholar] [CrossRef]
- Wang, X.; Ma, D.; Jin, Q.; Deng, S.; Stančin, H.; Tan, H.; Mikulčić, H. Synergistic effects of biomass and polyurethane co-pyrolysis on the yield, reactivity, and heating value of biochar at high temperatures. Fuel Process. Technol. 2019, 194, 106127. [Google Scholar] [CrossRef]
- Xue, Y.; Wang, C.; Hu, Z.; Zhou, Y.; Xiao, Y.; Wang, T. Pyrolysis of sewage sludge by electromagnetic induction: Biochar properties and application in adsorption removal of Pb(II), Cd(II) from aqueous solution. Waste Manag. 2019, 89, 48–56. [Google Scholar] [CrossRef]
- Frišták, V.; Pipíška, M.; Soja, G. Pyrolysis treatment of sewage sludge: A promising way to produce phosphorus fertilizer. J. Clean. Prod. 2018, 172, 1772–1778. [Google Scholar] [CrossRef]
- Sobek, S.; Werle, S. Kinetic modelling of waste wood devolatilization during pyrolysis based on thermogravimetric data and solar pyrolysis reactor performance. Fuel 2020, 261, 116459. [Google Scholar] [CrossRef]
- Mishra, R.K.; Mohanty, K. Pyrolysis of three waste biomass: Effect of biomass bed thickness and distance between successive beds on pyrolytic products yield and properties. Renew. Energy 2019, 141, 549–558. [Google Scholar] [CrossRef]
- Mohseni-Bandpei, A.; Majlesi, M.; Rafiee, M.; Nojavan, S.; Nowrouz, P.; Zolfagharpour, H. Polycyclic aromatic hydrocarbons (PAHs) formation during the fast pyrolysis of hazardous health-care waste. Chemosphere 2019, 227, 277–288. [Google Scholar] [CrossRef]
- Kadlimatti, H.M.; Raj Mohan, B.; Saidutta, M.B. Bio-oil from microwave assisted pyrolysis of food waste-optimization using response surface methodology. Biomass Bioenergy 2019, 123, 25–33. [Google Scholar] [CrossRef]
- Elkhalifa, S.; Al-Ansari, T.; Mackey, H.R.; McKay, G. Food waste to biochars through pyrolysis: A review. Resour. Conserv. Recycl. 2019, 144, 310–320. [Google Scholar] [CrossRef]
- Fernandez, A.; Román, C.; Mazza, G.; Rodriguez, R. Determination of effective moisture diffusivity and thermodynamic properties variation of regional wastes under different atmospheres. Case Stud. Therm. Eng. 2018, 12, 248–257. [Google Scholar] [CrossRef]
- Alves, J.L.F.; Da Silva, J.C.G.; da Silva Filho, V.F.; Alves, R.F.; Ahmad, M.S.; Ahmad, M.S.; de Araujo Galdino, W.V.; De Sena, R.F. Bioenergy potential of red macroalgae Gelidium floridanum by pyrolysis: Evaluation of kinetic triplet and thermodynamics parameters. Bioresour. Technol. 2019, 291, 121892. [Google Scholar] [CrossRef]
- Tahir, M.H.; Zhao, Z.; Ren, J.; Rasool, T.; Naqvi, S.R. Thermo-kinetics and gaseous product analysis of banana peel pyrolysis for its bioenergy potential. Biomass Bioenergy 2019, 122, 193–201. [Google Scholar] [CrossRef]
- Gözke, G. Kinetic and thermodynamic analyses based on thermogravimetric pyrolysis of watermelon seed by isoconversional and master plots methods. Renew. Energy 2022, 201, 916–927. [Google Scholar] [CrossRef]
- White, J.E.; Catallo, W.J.; Legendre, B.L. Biomass pyrolysis kinetics: A comparative critical review with relevant agricultural residue case studies. J. Anal. Appl. Pyrolysis 2011, 91, 1–33. [Google Scholar] [CrossRef]
- Gašparovič, L.; Labovský, J.; Markoš, J.; Jelemenský, L. Calculation of Kinetic Parameters of the Thermal Decomposition of Wood by Distributed Activation Energy Model (DAEM). Chem. Biochem. Eng. Q 2012, 26, 45–53. [Google Scholar]
- Caballero, J.A.; Conesa, J.A. Mathematical considerations for nonisothermal kinetics in thermal decomposition. J. Anal. Appl. Pyrolysis 2005, 73, 85–100. [Google Scholar] [CrossRef]
- Chandrasekaran, A.; Ramachandran, S.; Subbiah, S. Determination of kinetic parameters in the pyrolysis operation and thermal behavior of Prosopis juliflora using thermogravimetric analysis. Bioresour. Technol. 2017, 233, 413–422. [Google Scholar] [CrossRef] [PubMed]
- Badshah, S.L.; Shah, Z.; Francisco Alves, J.L.; Gomes da Silva, J.C.; Iqbal, A. Pyrolysis of the freshwater macroalgae Spirogyra crassa: Evaluating its bioenergy potential using kinetic triplet and thermodynamic parameters. Renew. Energy 2021, 179, 1169–1178. [Google Scholar] [CrossRef]
- Patidar, K.; Singathia, A.; Vashishtha, M.; Kumar Sangal, V.; Upadhyaya, S. Investigation of kinetic and thermodynamic parameters approaches to non-isothermal pyrolysis of mustard stalk using model-free and master plots methods. Mater. Sci. Energy Technol. 2022, 5, 6–14. [Google Scholar] [CrossRef]
- Kumar Mishra, R.; Mohanty, K. Kinetic analysis and pyrolysis behavior of low-value waste lignocellulosic biomass for its bioenergy potential using thermogravimetric analyzer. Mater. Sci. Energy Technol. 2021, 4, 136–147. [Google Scholar] [CrossRef]
- Yan, J.; Yang, Q.; Zhang, L.; Lei, Z.; Li, Z.; Wang, Z.; Ren, S.; Kang, S.; Shui, H. Investigation of kinetic and thermodynamic parameters of coal pyrolysis with model-free fitting methods. Carbon Resour. Convers. 2020, 3, 173–181. [Google Scholar] [CrossRef]
- Clement, S.; Lovell, R.T. Comparison of processing yield and nutrient composition of cultured Nile tilapia (Oreochromis niloticus) and channel catfish (Ictalurus punctatus). Aquaculture 1994, 119, 299–310. [Google Scholar] [CrossRef]
- Iffah Farhah Mohd Yusof, N.; Aqilah Shamsuddin, N.; Aini Zakaria, H.; Farizan Munajat, N. Exploring the potential of fish waste (Sardinella fimbriata) through pyrolysis: A study of kinetics and thermodynamics using isoconversional methods. Mater. Sci. Energy Technol. 2023, 6, 460–471. [Google Scholar] [CrossRef]
- Reza, M.S.; Azad, A.K.; Bakar, M.S.A.; Karim, M.R.; Sharifpur, M.; Taweekun, J. Evaluation of Thermochemical Characteristics and Pyrolysis of Fish Processing Waste for Renewable Energy Feedstock. Sustainability 2022, 14, 1203. [Google Scholar] [CrossRef]
- Fadhil, A.B.; Ahmed, A.I.; Salih, H.A. Production of liquid fuels and activated carbons from fish waste. Fuel 2017, 187, 435–445. [Google Scholar] [CrossRef]
- Kraiem, T.; Ben Hassen-Trabelsi, A.; Naoui, S.; Belayouni, H.; Jeguirim, M. Characterization of the liquid products obtained from Tunisian waste fish fats using the pyrolysis process. Fuel Process. Technol. 2015, 138, 404–412. [Google Scholar] [CrossRef]
- Ahmed, G.; Annapureddy, P.K.R.; Kishore, N. Study on non-isothermal pyrolysis of Azadirachta Indica for kinetic triplets and thermodynamics evaluation. Bioresour. Technol. Rep. 2024, 25, 101794. [Google Scholar] [CrossRef]
- Li, Y.; Wang, Y.; Chai, M.; Li, C.; Yellezuome, D.; Liu, R. Pyrolysis kinetics and thermodynamic parameters of bamboo residues and its three main components using thermogravimetric analysis. Biomass Bioenergy 2023, 170, 106705. [Google Scholar] [CrossRef]
- Wang, K.; Shan, T.; Li, B.; Zheng, Y.; Xu, H.; Wang, C.; Tian, X. Study on pyrolysis characteristics, kinetics and thermodynamics of waste tires catalytic pyrolysis with low-cost catalysts. Fuel 2024, 356, 129644. [Google Scholar] [CrossRef]
- Wang, Y.; Yang, S.; Bao, G.; Wang, H. Investigation on prospective bioenergy from pyrolysis of macadamia nut shell waste using multicomponent Fraser-Suzuki kinetic model, kinetic triplet and thermodynamic parameters. J. Energy Inst. 2024, 114, 101611. [Google Scholar] [CrossRef]
- Jo, J.H.; Kim, S.S.; Shim, J.W.; Lee, Y.E.; Yoo, Y.S. Pyrolysis Characteristics and Kinetics of Food Wastes. Energies 2017, 10, 1191. [Google Scholar] [CrossRef]
- Norisham, S.F.; Munajat, N.F. Torrefaction of fish waste (Sardinella fimbriata) in a fixed bed reactor: Yields and biochar characterization. IOP. Conf. Ser. Earth Environ. Sci. 2021, 765, 012022. [Google Scholar] [CrossRef]
- Ming, X.; Xu, F.; Jiang, Y.; Zong, P.; Wang, B.; Li, J.; Qiao, Y.; Tian, Y. Thermal degradation of food waste by TG-FTIR and Py-GC/MS: Pyrolysis behaviors, products, kinetic and thermodynamic analysis. J. Clean. Prod. 2020, 244, 118713. [Google Scholar] [CrossRef]
- Nyambura, S.M.; Jufei, W.; Hua, L.; Xuebin, F.; Xingjia, P.; Bohong, L.; Ahmad, R.; Jialiang, X.; Bertrand, G.V.; Ndiithi, J.; et al. Microwave co-pyrolysis of kitchen food waste and rice straw for waste reduction and sustainable biohydrogen production: Thermo-kinetic analysis and evolved gas analysis. Sustain. Energy Technol. Assess. 2022, 52, 102072. [Google Scholar] [CrossRef]
- Zhao, J.; Wang, Z.; Li, J.; Yan, B.; Chen, G. Pyrolysis of food waste and food waste solid digestate: A comparative investigation. Bioresour. Technol. 2022, 354, 127191. [Google Scholar] [CrossRef]
- Ben Abdallah, A.; Ben Hassen Trabelsi, A.; Navarro, M.V.; Veses, A.; García, T.; Mihoubi, D. Pyrolysis of tea and coffee wastes: Effect of physicochemical properties on kinetic and thermodynamic characteristics. J. Therm. Anal. Calorim. 2023, 148, 2501–2515. [Google Scholar] [CrossRef] [PubMed]
- Embaye, T.M.; Ahmed, M.B.; Deng, N.; Cui, W.; Bukhsh, K.; Zhang, L.; Zhu, L.; Wang, X. Co-pyrolysis behavior of municipal solid waste and food waste residue: A thermogravimetric study to discern synergistic effect. Process Saf. Environ. Prot. 2024, 189, 1274–1284. [Google Scholar] [CrossRef]
- Alves, J.L.F.; da Silva, J.C.G.; Mumbach, G.D.; Arias, S.; Pacheco, J.G.A.; Di Domenico, M.; Marangoni, C. Valorization of royal palm tree agroindustrial waste via pyrolysis with a focus on physicochemical properties, kinetic triplet, thermodynamic parameters, and volatile products. Biomass Bioenergy 2023, 177, 106937. [Google Scholar] [CrossRef]
- Gupta, S.; Gupta, G.K.; Mondal, M.K. Thermal degradation characteristics, kinetics, thermodynamic, and reaction mechanism analysis of pistachio shell pyrolysis for its bioenergy potentia. Biomass Convers. Biorefinery 2022, 12, 4847–4861. [Google Scholar] [CrossRef]
- Mumbach, G.D.; Alves, J.L.F.; da Silva, J.C.G.; Di Domenico, M.; Marangoni, C.; Machado, R.A.F.; Bolzan, A. Investigation on prospective bioenergy from pyrolysis of butia seed waste using TGA-FTIR: Assessment of kinetic triplet, thermodynamic parameters and evolved volatiles. Renew. Energy 2022, 191, 238–250. [Google Scholar] [CrossRef]
- Rasam, S.; Moshfegh Haghighi, A.; Azizi, K.; Soria-Verdugo, A.; Keshavarz Moraveji, M. Thermal behavior, thermodynamics and kinetics of co-pyrolysis of binary and ternary mixtures of biomass through thermogravimetric analysis. Fuel 2020, 280, 118665. [Google Scholar] [CrossRef]
- Açıkalın, K.; Gözke, G. Thermogravimetric pyrolysis of onion skins: Determination of kinetic and thermodynamic parameters for devolatilization stages using the combinations of isoconversional and master plot methods. Bioresour. Technol. 2021, 342, 125936. [Google Scholar] [CrossRef]
- Vyazovkin, S.; Burnham, A.K.; Criado, J.M.; Pérez-Maqueda, L.A.; Popescu, C.; Sbirrazzuoli, N. ICTAC Kinetics Committee recommendations for performing kinetic computations on thermal analysis data. Thermochim. Acta 2011, 520, 1–19. [Google Scholar] [CrossRef]
- da Silva, J.C.G.; de Albuquerque, J.G.; de Araujo Galdino, W.V.; de Sena, R.F.; Andersen, S.L.F. Single-step and multi-step thermokinetic study—Deconvolution method as a simple pathway for describe properly the biomass pyrolysis for energy conversion. Energy Convers. Manag. 2020, 209, 112653. [Google Scholar] [CrossRef]
- da Silva, J.C.G.; Alves, J.L.F.; de Araujo Galdino, W.V.; Andersen, S.L.F.; de Sena, R.F. Pyrolysis kinetic evaluation by single-step for waste wood from reforestation. Waste Manag. 2018, 72, 265–273. [Google Scholar] [CrossRef]
- Badshah, S.L.; Shah, Z.; Alves, J.L.F.; da Silva, J.C.G.; Noreen, N.; Iqbal, A. Kinetic and thermodynamics study of the pyrolytic process of the freshwater macroalga, Chara vulgaris. J. Appl. Phycol. 2021, 33, 2511–2521. [Google Scholar] [CrossRef]
- Friedman, H.L. Kinetics of thermal degradation of char-forming plastics from thermogravimetry. Application to a phenolic plastic. J. Polym. Sci. Part C Polym. Symp. 1964, 6, 183–195. [Google Scholar] [CrossRef]
- Handawy, M.K.M.; Im, I.T.; Abdelmotalib, H.M. Thermal degradation kinetics and reaction mechanisms of HDPE and PS plastic wastes using a micro combustion calorimeter. J. Mech. Sci. Technol. 2024, 38, 7007–7018. [Google Scholar] [CrossRef]
- Kissinger, H.E. Reaction Kinetics in Differential Thermal Analysis. Anal. Chem. 1957, 29, 1702–1706. [Google Scholar] [CrossRef]
- Akahira, T. Trans Joint convention of four electrical institutes. Res. Rep. Chiba Inst. Technol. 1971, 16, 22–31. [Google Scholar] [CrossRef]
- Hu, Y.; Wang, Z.; Cheng, X.; Ma, C. Non-isothermal TGA study on the combustion reaction kinetics and mechanism of low-rank coal char. RSC Adv. 2018, 8, 22909–22916. [Google Scholar] [CrossRef] [PubMed]
- Starink, M.J. The determination of activation energy from linear heating rate experiments: A comparison of the accuracy of isoconversion methods. Thermochim. Acta 2003, 404, 163–176. [Google Scholar] [CrossRef]
- Starink, M.J. A new method for the derivation of activation energies from experiments performed at constant heating rate. Thermochim. Acta 1996, 288, 97–104. [Google Scholar] [CrossRef]
- Flynn, J.H.; Wall, L.A. A quick, direct method for the determination of activation energy from thermogravimetric data. J. Polym. Sci. B 1966, 4, 323–328. [Google Scholar] [CrossRef]
- Takeo, O. A new method of analyzing thermogravimetric Data. Bull. Chem. Soc. Jpn. 1965, 38, 1881–1886. [Google Scholar] [CrossRef]
- Criado, J.M.; Málek, J.; Ortega, A. Applicability of the master plots in kinetic analysis of non-isothermal data. Thermochim. Acta 1989, 147, 377–385. [Google Scholar] [CrossRef]
- Šesták, J.; Berggren, G. Study of the kinetics of the mechanism of solid-state reactions at increasing temperatures. Thermochim. Acta 1971, 3, 1–12. [Google Scholar] [CrossRef]
- Vasudev, V.; Ku, X.; Lin, J. Pyrolysis of algal biomass: Determination of the kinetic triplet and thermodynamic analysis. Bioresour. Technol. 2020, 317, 124007. [Google Scholar] [CrossRef]
- Snegirev, A.Y. Generalized approach to model pyrolysis of flammable materials. Thermochim. Acta 2014, 590, 242–250. [Google Scholar] [CrossRef]
- Snegirev, A.; Talalov, V.; Stepanov, V.; Harris, J. Formal kinetics of polymer pyrolysis for modeling of ignition and burning in fire tests. In Proceedings of the 13th International Conference Interflam, Nr Windsor, UK, 24–26 June 2013; pp. 755–768. [Google Scholar]
- Snegirev, A.Y.; Talalov, V.A.; Stepanov, V.V.; Korobeinichev, O.P.; Gerasimov, I.E.; Shmakov, A.G. Autocatalysis in thermal decomposition of polymers. Polym. Degrad. Stab. 2017, 137, 151–161. [Google Scholar] [CrossRef]
- Agrawal, A.; Chakraborty, S. A kinetic study of pyrolysis and combustion of microalgae Chlorella vulgaris using thermo-gravimetric analysis. Bioresour. Technol. 2013, 128, 72–80. [Google Scholar] [CrossRef]
- Coker, A.K. Industrial and Laboratory Reactors—Chemical Reaction Hazards and Process Integration of Reactors, Ludwig’s Applied Process Design for Chemical and Petrochemical Plants; Gulf Professional Publishing: Oxford, UK, 2015; pp. 1095–1208. [Google Scholar] [CrossRef]
- Sbirrazzuoli, N. Determination of pre-exponential factors and of the mathematical functions f(α) or G(α) that describe the reaction mechanism in a model-free way. Thermochim. Acta 2013, 564, 59–69. [Google Scholar] [CrossRef]
- Kumar, M.; Shukla, S.K.; Upadhyay, S.N.; Mishra, P.K. Analysis of thermal degradation of banana (Musa balbisiana) trunk biomass waste using iso-conversional models. Bioresour. Technol. 2020, 310, 123393. [Google Scholar] [CrossRef]
- Sahoo, A.; Kumar, S.; Kumar, J.; Bhaskar, T. A detailed assessment of pyrolysis kinetics of invasive lignocellulosic biomasses (Prosopis juliflora and Lantana camara) by thermogravimetric analysis. Bioresour. Technol. 2021, 319, 124060. [Google Scholar] [CrossRef]
- Al-Rumaihi, A.; Parthasarathy, P.; Fernandez, A.; Al-Ansari, T.; Mackey, H.R.; Rodriguez, R.; Mazza, G.; McKay, G. Thermal degradation characteristics and kinetic study of camel manure pyrolysis. J. Environ. Chem. Eng. 2021, 9, 106071. [Google Scholar] [CrossRef]
- Ahmad, M.S.; Mehmood, M.A.; Al Ayed, O.S.; Ye, G.; Luo, H.; Ibrahim, M.; Rashid, U.; Arbi Nehdi, I.; Qadir, G. Kinetic analyses and pyrolytic behavior of Para grass (Urochloa mutica) for its bioenergy potential. Bioresour. Technol. 2017, 224, 708–713. [Google Scholar] [CrossRef]
- Mohammed, H.I.; Garba, K.; Ahmed, S.I.; Abubakar, L.G. Thermodynamics and kinetics of Doum (Hyphaene thebaica) shell using thermogravimetric analysis: A study on pyrolysis pathway to produce bioenergy. Renew. Energy 2022, 200, 1275–1285. [Google Scholar] [CrossRef]
- Florentino-Madiedo, L.; Vega, M.F.; Díaz-Faes, E.; Barriocanal, C. Evaluation of synergy during co-pyrolysis of torrefied sawdust, coal and paraffin. A kinetic and thermodynamic study. Fuel 2021, 292, 120305. [Google Scholar] [CrossRef]
- Chen, F.; Zhang, F.; Yang, S.; Liu, H.; Wang, H.; Hu, J. Investigation of pyrolysis kinetics, thermodynamics, product characteristics and reaction mechanism of rubber seed oil. Energy Convers. Manag. 2021, 244, 114535. [Google Scholar] [CrossRef]
- Varma, A.K.; Lal, N.; Rathore, A.K.; Katiyar, R.; Thakur, L.S.; Shankar, R.; Mondal, P. Thermal, kinetic and thermodynamic study for co-pyrolysis of pine needles and styrofoam using thermogravimetric analysis. Energy 2021, 218, 119404. [Google Scholar] [CrossRef]
- Müsellim, E.; Tahir, M.H.; Ahmad, M.S.; Ceylan, S. Thermokinetic and TG/DSC-FTIR study of pea waste biomass pyrolysis. Appl. Therm. Eng. 2018, 137, 54–61. [Google Scholar] [CrossRef]
- Kumar, M.; Mishra, P.K.; Upadhyay, S.N. Thermal degradation of rice husk: Effect of pre-treatment on kinetic and thermodynamic parameters. Fuel 2020, 268, 117164. [Google Scholar] [CrossRef]
- Xu, X.; Chen, R.; Pan, R.; Zhang, D. Pyrolysis Kinetics, Thermodynamics, and Volatiles of Representative Pine Wood with Thermogravimetry–Fourier Transform Infrared Analysis. Energy Fuels 2020, 34, 1859–1869. [Google Scholar] [CrossRef]
- Tahir, M.H.; Çakman, G.; Goldfarb, J.L.; Topcu, Y.; Naqvi, S.R.; Ceylan, S. Demonstrating the suitability of canola residue biomass to biofuel conversion via pyrolysis through reaction kinetics, thermodynamics and evolved gas analyses. Bioresour. Technol. 2019, 279, 67–73. [Google Scholar] [CrossRef]


Disclaimer/Publisher’s Note: The statements, opinions and data contained in all publications are solely those of the individual author(s) and contributor(s) and not of MDPI and/or the editor(s). MDPI and/or the editor(s) disclaim responsibility for any injury to people or property resulting from any ideas, methods, instructions or products referred to in the content. |
© 2025 by the authors. Licensee MDPI, Basel, Switzerland. This article is an open access article distributed under the terms and conditions of the Creative Commons Attribution (CC BY) license (https://creativecommons.org/licenses/by/4.0/).