Article

Upgrading and Characterization of Glass Recovered from MSWI Bottom Ashes from Fluidized Bed Combustion

1
Christian Doppler Laboratory for a Recycling-Based Circular Economy, Institute of Chemical, Environmental and Bioscience Engineering, TU Wien, Getreidemarkt 9/166, 1060 Vienna, Austria
2
Chair of Waste Processing Technology and Waste Management, Montanuniversität Leoben, Franz Josef-Straße 18, 8700 Leoben, Austria
*
Author to whom correspondence should be addressed.
Recycling 2025, 10(2), 63; https://doi.org/10.3390/recycling10020063
Submission received: 25 February 2025 / Revised: 19 March 2025 / Accepted: 1 April 2025 / Published: 7 April 2025

Abstract

:
Glass in mixed municipal solid waste (MSW) is often lost for recycling. Glass recovery from incineration bottom ash (IBA) after MSW incineration (MSWI) is technically feasible by sensor-based sorting, but rarely applied. Especially IBAs from fluidized bed combustion contain high recoverable glass amounts, but upgrading this glass is required for recycling in the packaging glass industry. This study examines different upgrading setups based on sensor-based sorting to improve the glass quality from two Austrian fluidized bed IBAs. Sensor-based sorting removed extraneous material like ceramic, stones, porcelain, metals, and lead glass. The fractions produced were characterized by manual sorting and X-ray fluorescence analysis. The glass fractions before upgrading contained 85–89% glass, of which 67% and 83% could be recovered after four sorting steps. Previous sieving caused high glass losses and is therefore not recommended. By sensor-based sorting, the extraneous material contents were lowered from 13% and 9% in the two IBAs to below 2.2%. Four-step upgrading could even ensure extraneous material contents <0.11% and Pb contents <200 mg/kg. Although limit values for packaging glass recycling were still exceeded, this study shows that upgrading of glass recovered from fluidized bed IBAs suggests a novel opportunity to enhance closed-loop glass recycling, thereby reducing the amount of landfilled glass.

1. Introduction

Glass is a versatile and durable material, widely used in applications ranging from packaging to construction [1]. Although primary glass production is very material- and energy-intense, the ecological advantage of glass lies in its infinite recyclability without quality loss [2,3]. Several recycling options for waste glass, including both closed- and open-loop processes, are available and investigated in the literature [4,5]. For example, glass cullet can be used in foam glass production [6,7,8] or in other fields of the construction sector [9,10,11,12,13]. Yet, closed-loop recycling in the packaging glass industry is seen as the most desirable recycling path, since this saves raw materials and energy, and the material can be utilized as such [14]. Using 10% crushed glass (cullet) in packaging glass recycling allows for 2.0–3.0% energy savings in the process [15,16,17]. To ensure high quality and avoid process disturbances, recycling in the packaging glass industry requires strict quality standards regarding the content of extraneous material, like ceramic, stones, porcelain, and other non-glass mineral-based material (CSP) or metal pieces and heavy metals [1,18]. Therefore, waste glass cullet has to be processed in multi-stage treatment, including color sorting, sieving, and removal of extraneous material [19]. Whereas sensor-based sorting using the visible light spectrum (VIS) is applied for the distinction between different colors and extraneous material, lead glass can be removed by utilization of ultraviolet (UV) light or X-ray fluorescence (XRF) [20,21,22].
The foundation for high-grade recycling is the separate collection of waste glass, which is well-developed in the European Union (EU) [14,23]. This already secured the required recycling rate for packaging glass above 75% in 2022 in the EU, which is the value set as a recycling target as of 2030 [24,25]. Yet, 20% of the glass was not collected separately in the EU in 2022 [26]. In single EU countries like Hungary, Greece, or Portugal, the packaging glass collection rates were significantly lower, accounting for 22–51% [26]. Globally, high landfill rates and clearly lower recycling rates, around 35%, are reported for container glass [27,28]. This also counts for highly industrialized countries like the United States or Japan [28,29].
Glass that is not collected separately is primarily disposed of in mixed municipal solid waste (MSW). Besides the improvement of separate collection, glass recovery from mixed MSW is a measure to make glass still available for recycling [2,30]. This can be realized by mechanical biological treatment plants, but this process is only applied to portions of the mixed MSW in single countries [31,32,33]. Usually, mixed MSW is predominantly either landfilled or incinerated in the EU [34]. After MSW incineration (MSWI), glass remains as a solid residue in the mineral fraction of the incineration bottom ash (IBA) [35,36,37]. Depending on factors like the state of separate collection in a country, varying glass shares of 5–30% contained in IBA from grate incineration, which is the predominant MSWI technology, are reported [38,39,40,41]. Even higher glass amounts (up to 47%) were determined in IBA from fluidized bed combustion, which is a subordinate MSWI technology but highly used in single countries, such as Austria [37]. In contrast to metals, which are recovered from IBA to a substantial amount, thereby contributing to higher metal recycling rates, glass in mixed MSW is usually not recovered from IBAs [42,43]. The glass in IBAs is landfilled to a large extent or, in the case of recycling of the mineral fraction of IBAs, utilized as mineral material, for example in the construction sector [44,45]. In both cases, the glass is lost for closed-loop recycling.
Nevertheless, glass recovery from IBA is technically possible by sensor-based sorting, as shown in studies by Makari [46] and Mühl et al. [47]. Whereas Makari [46] only examined glass from grate IBA and did not delve into detail regarding recoverable amounts, glass quality, or utilization paths, Mühl et al. [47] investigated pilot-scale glass recovery from three different IBAs from grate incineration and from three others from fluidized bed incineration. The latter study found that comparatively low amounts of glass not suitable for glass recycling can be recovered from grate IBA. Significantly higher glass amounts in better quality could be recovered on a pilot scale from the fluidized bed IBAs (FB-IBAs) investigated. Based on these findings, an industrial Austrian IBA treatment plant was expanded and equipped with a sensor-based glass sorter. Additional work by Mühl et al. [48] showed that this glass sorter is capable of industrially recovering high glass amounts from FB-IBA, amounting to 300 kg of pure glass per ton of IBA input, but no glass from grate IBA could be recovered industrially. However, the requirements of the packaging glass industry were not met by the glass recovered from FB-IBA in both studies, and further upgrading of the glass fraction was suggested but not investigated by the authors. Additionally, the detailed composition of glass fractions from FB-IBAs has not been thoroughly investigated yet, and no data is available on the chemical composition of glass cullet derived from IBA. Hence, it remains unclear which glass quality can be achieved after upgrading and whether upgraded glass from FB-IBA is suitable for closed-loop recycling.
To close this research gap, glass fractions industrially recovered from FB-IBAs were upgraded by additional sensor-based sorting in different upgrading setups. The performance of the upgrading processes was evaluated and it was examined whether the produced glass fractions could meet the requirements of the packaging glass industry. Therefore, material fractions produced from the upgrading processes were characterized by determining their macroscopic composition and heavy metal content, focusing especially on the Pb content. Thereby, this work strives to answer the following research questions:
  • Which quality can be achieved by different upgrading setups of glass fractions recovered from FB-IBA?
  • Do the glass fractions after upgrading meet the requirements for recycling in the packaging glass industry?
  • Can lead glass be successfully removed by upgrading?
By answering these questions, this study aims to identify new opportunities for closed-loop glass recycling, simultaneously reducing the amount of landfilled glass. Most of these examinations are assessed and published for the first time since hardly any data about glass from MSWI, particularly from fluidized bed combustion, is available.

2. Materials and Methods

2.1. Glass Fractions Used for Upgrading

Two glass fractions from FB-IBAs from two different fluidized bed MSWI plants in Austria were used to address the research issues. The glass fractions were generated by industrial IBA treatment at the Austrian treatment plant of the Brantner Österreich GmbH (Austria) company. This plant has already been investigated several times and includes wet treatment in a jig and multiple metal separation steps [40,49]. After examinations by Mühl et al. [47], the Brantner treatment plant was expanded in 2021, as described and illustrated with a treatment scheme in Mühl et al. [48]. By now, glass fractions can also be recovered from FB-IBAs on an industrial scale. The plant extension includes additional metal separation and glass removal. The glass separator in operation is a Mogensen MSort AX type for sensor-based glass sorting of wet cullet using optical light. The two glass fractions investigated are referred to as FB-IBA B and C, according to the FB-IBAs, which they are recovered from in analogy to Mühl et al. [47], where these FB-IBAs were already examined. Information on the MSWI plants, where these IBAs stem from, is given by Mühl et al. [47]. These two FB-IBAs were chosen for the experiment to determine possible differences in the glass fractions, for instance, caused by varying MSWI input and incineration temperature. Whereas FB-IBA C derives from an MSWI plant where pretreated MSW is incinerated almost solely, in the plant producing FB-IBA B also mixed MSW, industrial, commercial, and bulky waste is used as a fuel [47]. Furthermore, the MSWI plant of FB-IBA C works with a comparatively low incineration temperature, which will be discussed further below in Section 3.4 [1] (personal communication, 2024). Pictures of the two glass fractions before upgrading are given in the Supplementary Material (Figure S1).
Sampling of the glass fraction FB-IBA C was conducted in the course of the industrial-scale treatment experiment described by Mühl et al. [48]. In this work, one IBA from fluidized bed combustion was industrially treated, thereby also producing a glass fraction, accounting for 35% of the total IBA amount treated. 47 samples of this glass fraction were collected during a treatment time of more than eight hours. For sampling, a large tarp (1 m × 1.5 m) was held under the falling material stream in accordance with Gerlach and Nocerino [50]. Thereby, 440 kg of sample mass was collected for this study.
The second glass fraction from FB-IBA B was generated analogously to FB-IBA C in a separate industrial treatment and sampling run. Since this treatment run was not investigated in such detail, the share of glass fraction produced relative to the IBA treated is not known in this case. The same procedure as for FB-IBA C was used to obtain samples of the glass fraction, but sampling was carried out within 100 min. 33 samples, accounting for 330 kg, were taken during this time.

2.2. Upgrading of the Glass Fractions

The glass fractions FB-IBA B and C from the industrial treatment, which are primarily of particle size >9 mm [48], were further upgraded to determine if the requirements of the packaging glass industry could be met thereafter. For the upgrading, sensor-based glass sorting was applied using the VIS- and UV-based sorter CLARITY by Binder + Co AG (Gleisdorf, Austria), which is shown in the Supplementary Material (Figure S2). This sorting machine can simultaneously remove various types of extraneous material from the glass cullet. In only one sorting step metals, CSP, lead glass and heat-resistant glass can be detected based on sensor-fusion and ejected from the glass cullet by compressed air [46,51]. Thereby, each sorting step produces a fraction enriched in glass, referred to as GL fractions, and one fraction containing extraneous material, referred to as EM fractions. Two different upgrading setups were used and compared. For these setups, the glass fractions from industrial treatment were split into halves, and one half was used for each of them. In the first upgrading setup, referred to as US_I–IV, glass separation was applied consecutively in multiple upgrading steps to the unsieved glass fractions. In the second upgrading setup, US_8–16, the aim was to examine the effect of previous sieving of the glass fraction before applying a single glass separation step. The upgrading setups are described in the following section and are shown in Figure 1.

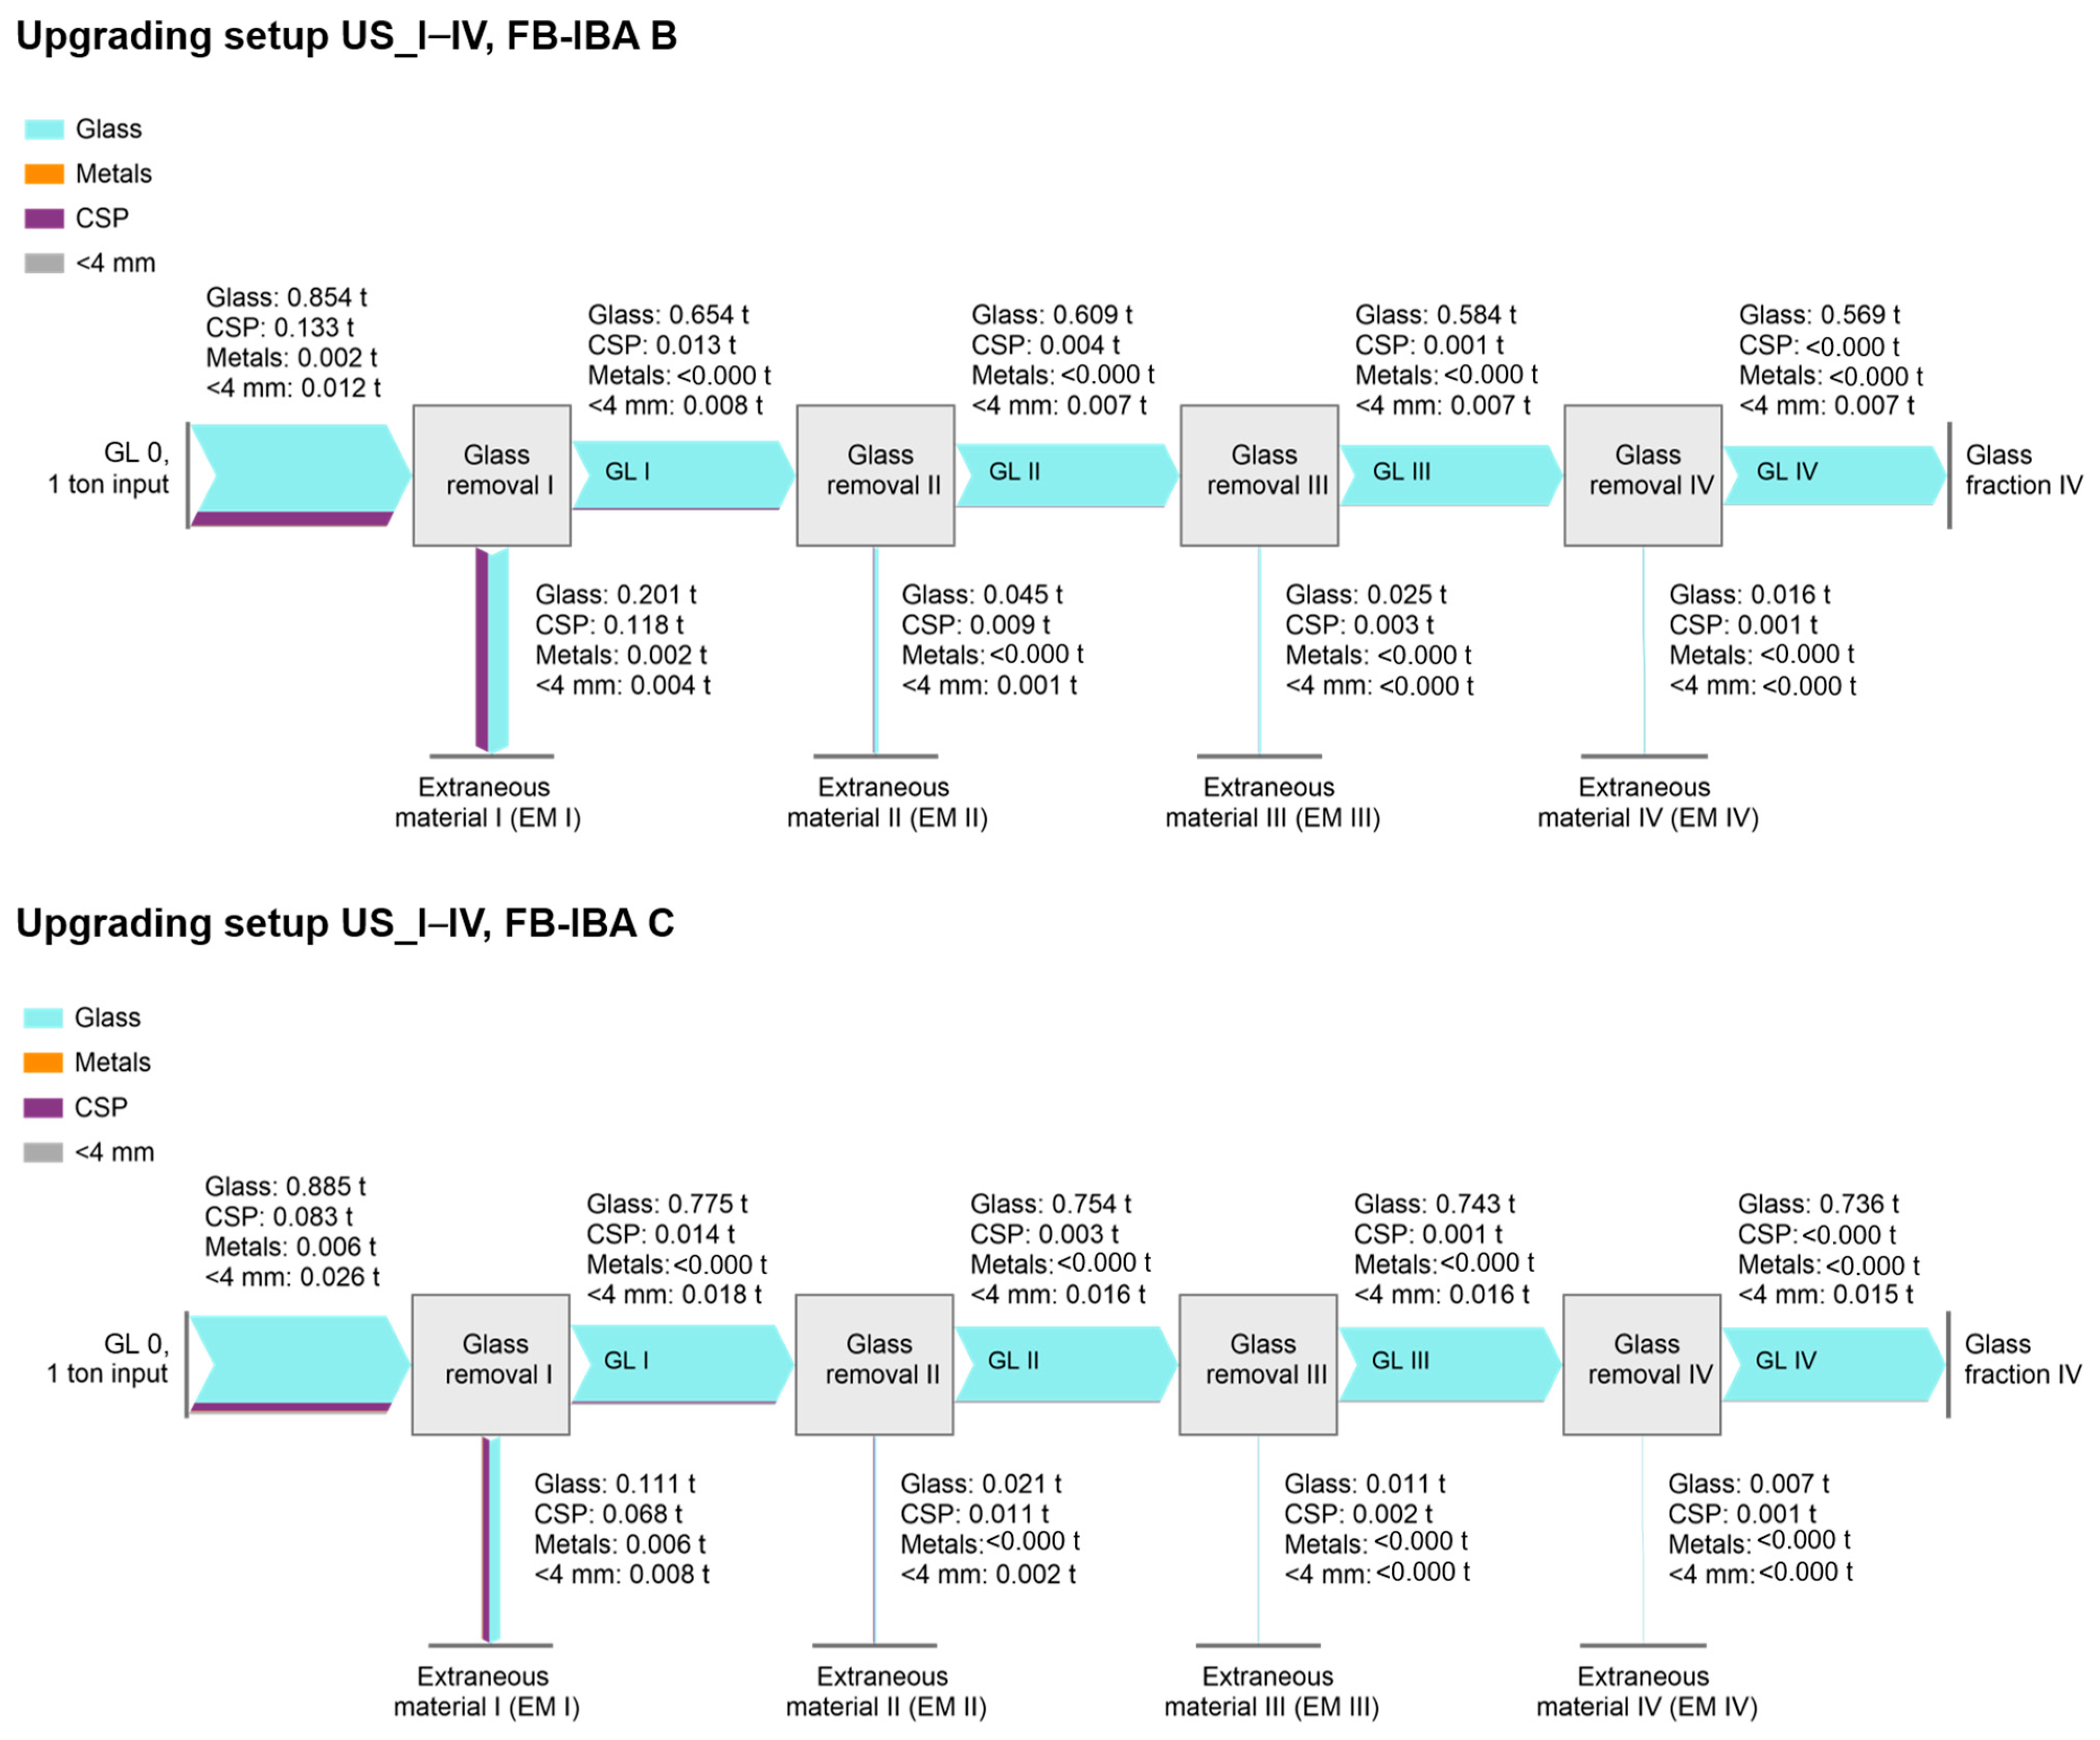
2.2.1. Upgrading Setup US_I–IV: Multi-Step Upgrading of Unsieved Glass Fractions

In experiment US_I–IV the glass fractions from industrial IBA treatment were consecutively fed four times into sensor-based sorting to eject extraneous material. The extraneous material removed from the glass fraction by negative sorting was collected and weighed. The glass fraction was weighed and fed into the glass sorter again.
As it was the aim of this experimental setup to produce a glass fraction complying with the requirements of the packaging glass industry, the expected number of upgrading runs necessary was determined in advance. From reference data by Mühl et al. [47], who reported up to 13% CSP and 1% metals in the glass fractions generated by pilot-scale treatment, it was assumed that the strict regulations for packaging glass require more than one additional sorting step. To estimate the number n of upgrading steps necessary for meeting the limit values, the following Equation (1) was used:
log RC L V E M = n
In this equation, RC is the residual content of extraneous material after each sorting step. In this case, it was assumed that each upgrading run reduces the content of extraneous material by 90%, thereby resulting in RC being 0.1 (10%). LV stands for the limit value given in Bundesverband Glasindustrie e.V. et al. [18] for CSP and metals (0.002% for CSP, 0.0003% for non-ferrous metals, and 0.0002% for ferrous metals). EM is the content of extraneous material reported by Mühl et al. [47]. The highest value determined for n was 3.6, which was calculated for FB-IBA B with 8.8% of CSP (EM), compared to the limit value of 0.002% (LV). Therefore, four additional upgrading runs were applied to the glass in the present study.
After the first glass removal step, the glass fraction was split to obtain a reference sample to characterize the glass composition. Glass fractions produced in this upgrading setup are referred to as GL I–IV, according to the number of upgrading runs and extraneous material fractions are denoted as EM I–IV accordingly. The extraneous material from every sorting step as well as the glass fractions from the fourth and the first sorting step after splitting were used for characterization.

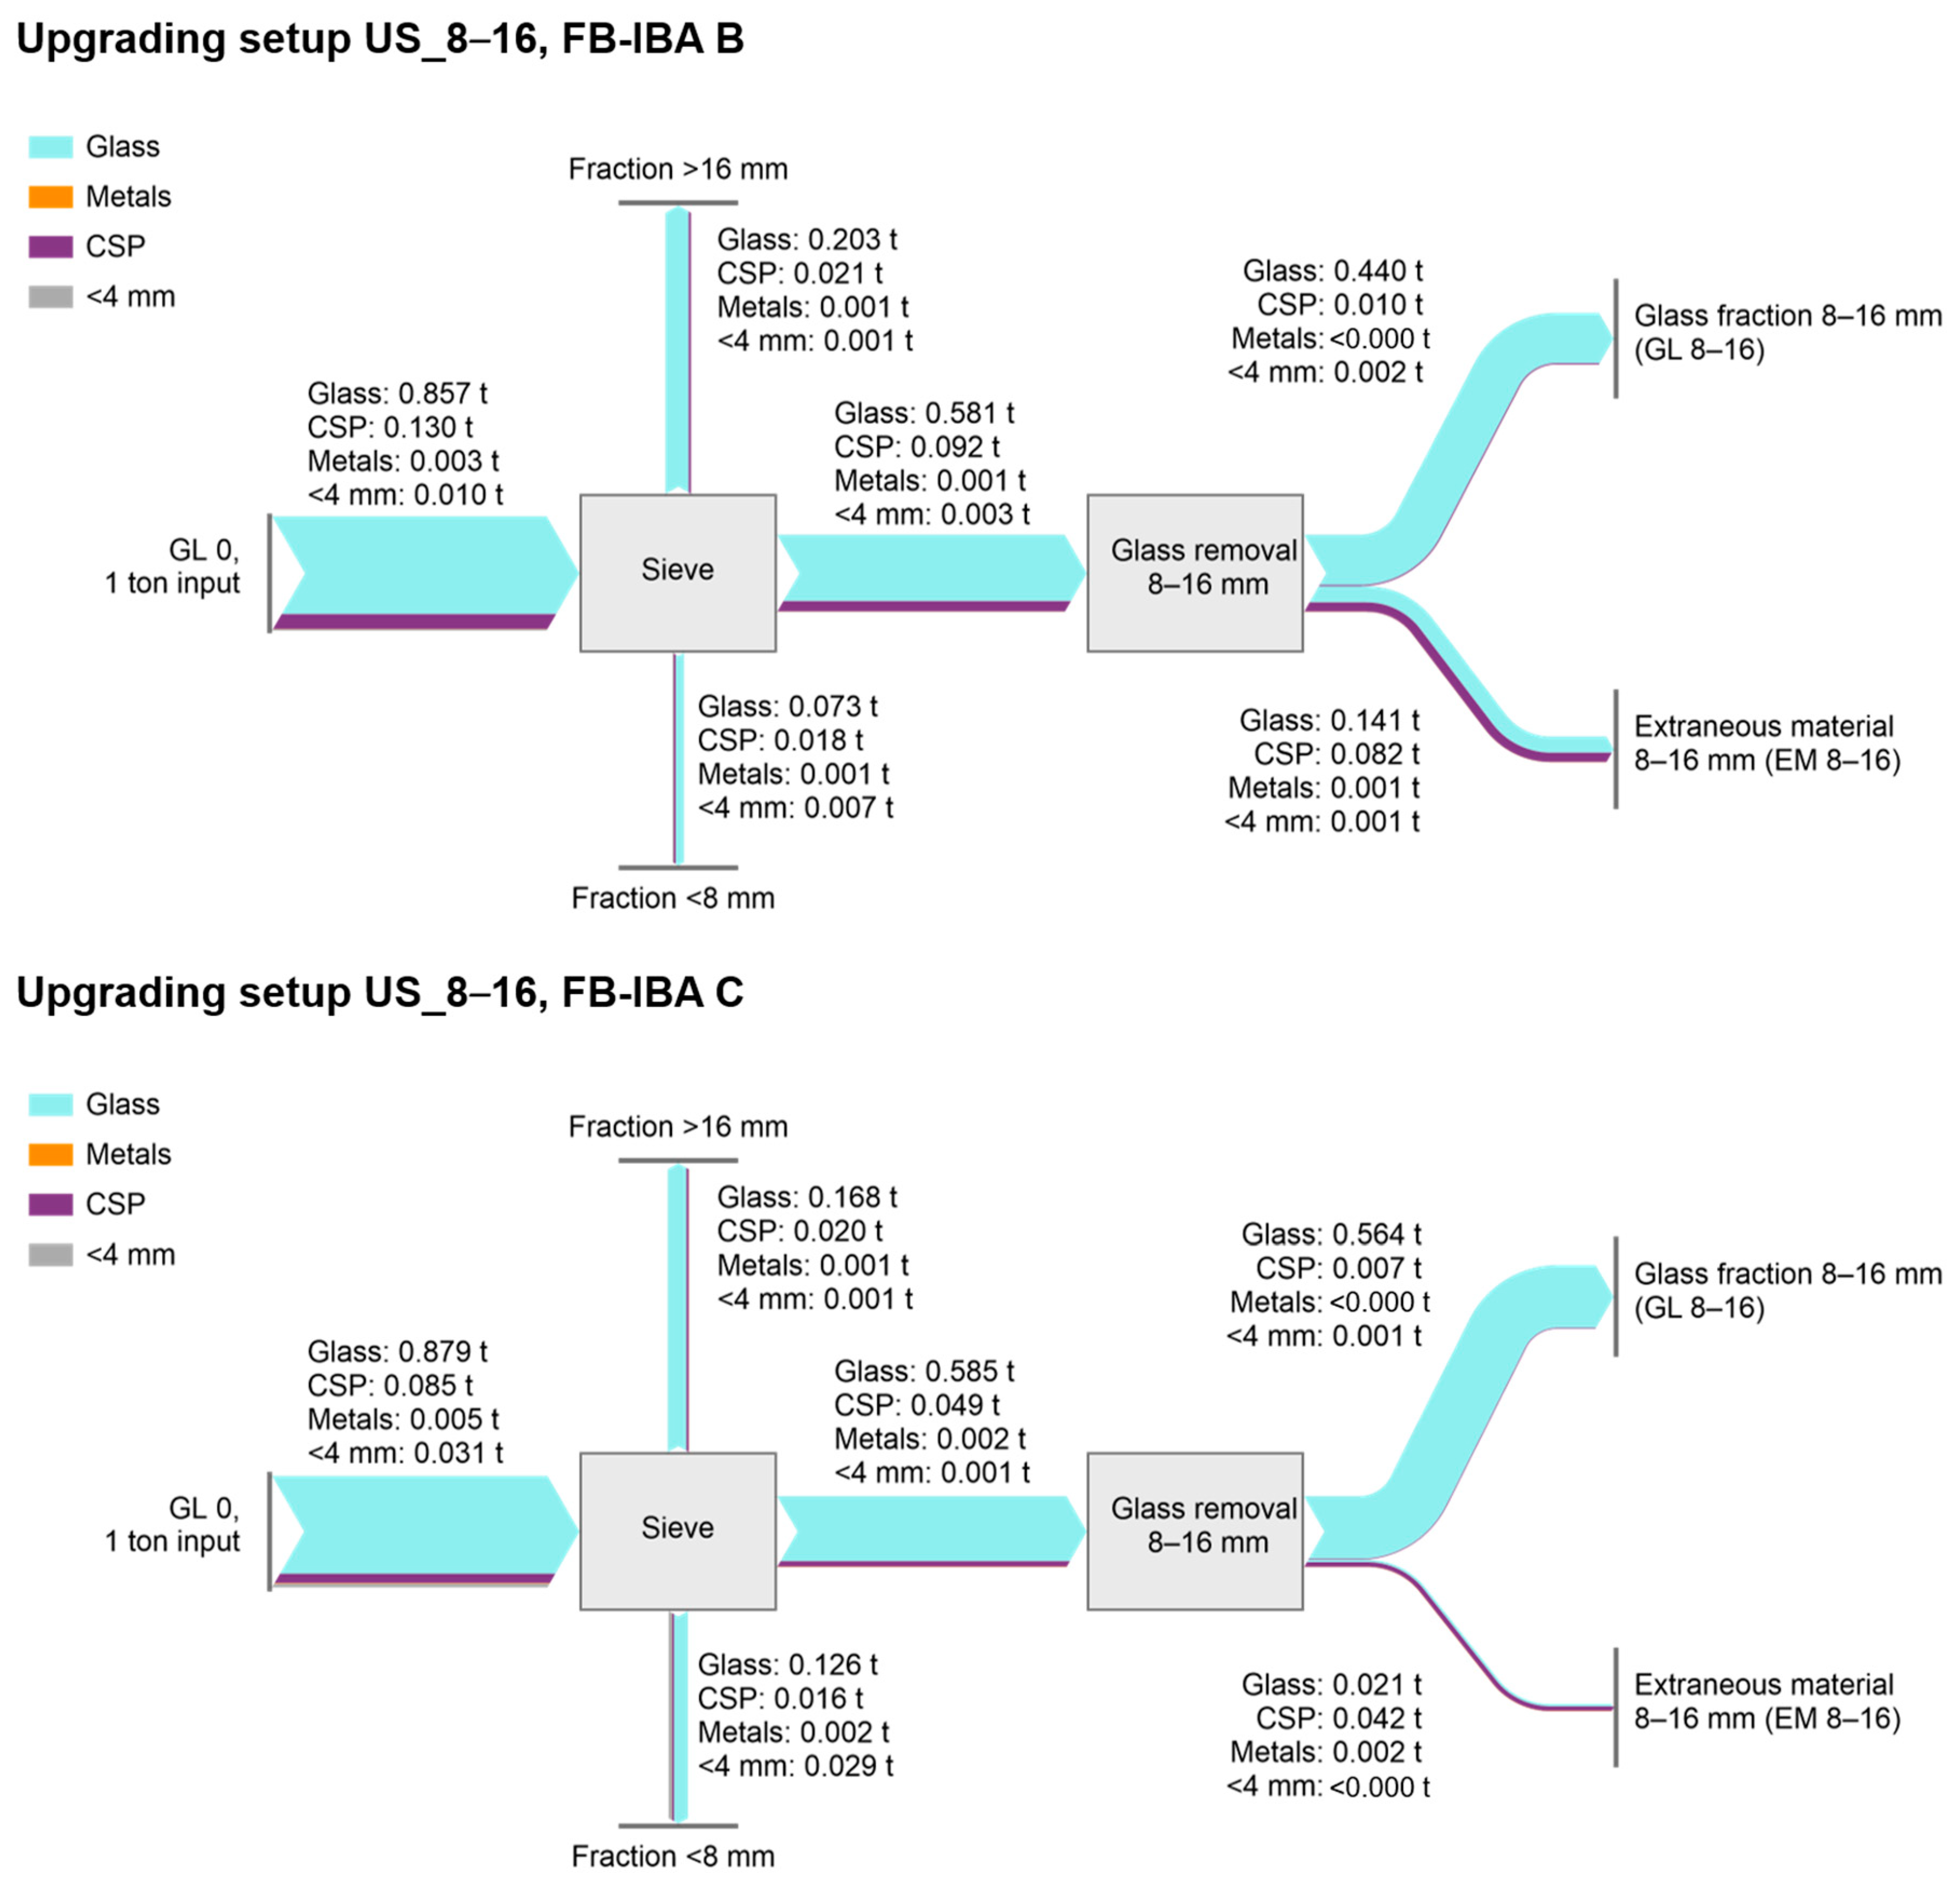
2.2.2. Upgrading Setup US_8–16: Single-Step Upgrading of Sieved Glass Fractions 8–16 mm

As reported by Šyc et al. [40], processing of narrower particle size fractions of IBA is more efficient and, therefore, shows better results. According to Peukert et al. [51] and Wotruba and Harbeck [52], the largest particles should not exceed three times the size of the smallest particles. Since the glass fractions from industrial IBA treatment mainly contain particles of 8–35 mm, this requirement is not fulfilled. To evaluate the benefits of sensor-based glass sorting from a narrower particle size fraction, upgrading of sieved glass fractions was also examined. Therefore, the industrially produced glass fractions from FB-IBA B and C were sieved with a vibrating screen (FleXiever mini screener, SMO LLC). First, a 16 mm sieve deck was used. Subsequently, the material <16 mm was sieved with an 8 mm sieve deck. All particle size fractions produced, i.e., <8 mm, >16 mm, and 8–16 mm, were collected and weighed. The particle size fraction 8–16 mm was used for comparative single-step upgrading with the sensor-based glass sorter since this fraction contains the highest glass shares [37]. The outputs of the sorter, GL 8–16 and EM 8–16, were weighed and used for characterization.

2.3. Fractions’ Compositions and Material Flows

The compositions of the fractions of both upgrading setups were either determined by manual sorting of the material >4 mm or calculated using material flow analysis based on Brunner and Rechberger [53].

2.3.1. Manual Sorting

For the manual sorting of the glass fractions, the standard EN 933-11 [54] recommends manually sorting of at least 1000 particles of each fraction. Depending on the particle size fractions, this corresponds to 0.5 kg (fraction < 8 mm), 2 kg (8–16 mm), and 10 kg (16–32 mm) of sample mass. These masses were obtained by sieving with a HAVER EML 450 digital plus N test sieve shaker, using 4, 8, and 16 mm meshes, followed by fractional shoveling to reduce sample masses. If the masses available for sorting were below the masses required by the standard, the total sample mass available was used for sorting. Fractions from upgrading setup US_8–16 were only sieved with a 4 mm mesh to remove fine material and dust before sorting, as they were already sieved before glass removal. According to their visual appearance, the particles > 4 mm were sorted into glass of different colors (clear, green, amber); other glass, including glass of other colors, molten glass agglomerates or highly tarnished glass; metals; and non-glass mineral-based material (CSP), which contains ceramic, stones, porcelain, building material (e.g., concrete, brick), and molten agglomerates. Throughout this work, non-glass mineral-based extraneous material is summarized as CSP.

2.3.2. Material Flow Analysis

During the course of the upgrading setups, all fractions were weighed to create material flow analyses, which allowed for an evaluation of the upgrading processes. Additionally, the compositions of fractions that were not sorted manually could be calculated, using the software STAN, version 2.6.801. This was applied to the input glass fractions before upgrading and to the fractions GL II and GL III of US_I–IV. Through material flow analysis, the Pb content in the glass input (GL 0) could also be calculated after XRF analysis.

2.4. Chemical Analysis of the Fractions

2.4.1. XRF and Cr(VI) Analysis

To determine the elemental composition of the fractions produced, XRF analysis was used. This is important to detect heavy metals like Pb, Cd and Hg, which are restricted in glass cullet in the packaging glass industry [18]. For the XRF analysis, subsamples were comminuted to <500 µm by crushing and milling, which is detailed in the Supplementary Material (Section S1.3.1). The powder < 500 µm was pressed into pellets and analyzed with a hand-held XRF analyzer, type ThermoScientific Niton XL3t GOLDD+ with Portable Test Stand (testing mode “TestAll Geo”). Each sample was measured four times, and the results were averaged. The share of the tableting aid, which dilutes the analytes, was considered by dividing the results by 0.8. For results below the detection limit, the measurement value was assumed to be the standard deviation.
The three milled glass fractions of each FB-IBA (GL I, GL IV, and GL 8–16) were also analyzed for their content of Cr(VI) by total digestion in accordance with the standards EN 13656:2002-12 [54] and DIN 38405-52 [55], as this parameter is requested by the packaging glass industry.

2.4.2. Determination of Lead Glass by UV-C Light

To estimate if lead glass contributes substantially to the Pb content in the glass fractions, the share of lead glass shards in the glass fractions was determined. Thereby, it could be approximated which Pb concentration results from the lead glass. This concentration was compared to the results of the XRF analysis. Detection of lead glass shards was done using a UV-C lamp with a wavelength of 254 nm (type analytikjena UVS-26P), as lead glass shines purple when exposed to this light [56,57]. A picture of this effect is shown in the Supplementary Material (Figure S5). Only the clear glass fractions after manual sorting were investigated since lead glass is typically clear. The mass of lead glass detected in each fraction i (mLG,i) was weighed. It was estimated that lead glass contains 15–25% of Pb [4,58]. Thereby, an expectated range of the Pb concentration cPb,i in each glass fraction i could be calculated using the masses of the total glass fractions (mGF,i) and Equation (2), where x is the share of Pb in lead glass (estimation range 0.15–0.25):
c P b , i = x m L G , i m G F , i
The concentration range calculated was further compared to the Pb results determined by XRF analysis.

3. Results and Discussion

The following sections present and discuss the major results regarding material flows, fractions’ compositions, and chemical analysis. Additional and related values can be found in the Supplementary Material (Section S2).

3.1. Material Flows of the Upgrading Setups

In the following, the material flows of the upgrading setups US_I–IV and US_8–16 are shown as Sankey diagrams. Figure 2 presents the material flows of the four-step upgrading of glass conducted in setup US_I–IV. The results are normalized to 1 ton of input material.
Figure 2 shows that 85% (FB-IBA B) and 89% (FB-IBA C) per ton of glass fraction fed into the upgrading are glass. After four consecutive glass removal steps, very clean glass fractions could be produced, containing almost no extraneous material or metals. However, per ton of input, 0.29 t (FB-IBA B) and 0.15 t (FB-IBA C), which account for 34% and 17% of the glass contained in the glass fractions, are lost in the extraneous material fractions after the four-step upgrading. In total, 57% (FB-IBA B) and 74% (FB-IBA C) of the total material input fed into the upgrading could be obtained as pure glass. More than 99% of CSP and metals were separated into extraneous material fractions.
The material flows of the single-step upgrading with previous sieving of the glass fractions (US_8–16) are given in Figure 3.
In setup US_8–16, similar glass shares were determined in the input material as in US_I–IV (86% and 88%). Per ton of input, 0.440 t (44% of the input) and 0.56 t (56% of the input) of glass could be enriched in the upgraded glass fraction 8–16 mm (GL 8–16) in the case of the FB-IBA B and C, respectively. Since FB-IBA B contains 86% and FB-IBA C 88% of glass, this accounts for 51% (FB-IBA B) and 64% (FB-IBA C) of the total glass fed into the sieving and glass removal. Through sieving of 1 t of glass fraction, 276 kg of glass in FB-IBA B were lost in the fractions >16 mm and <8 mm, as these particle size fractions also contain glass. Additionally, 141 kg of glass were missorted into the extraneous material 8–16 mm (EM 8–16). In total, 417 kg, which account for 49% of the glass, were lost during the upgrading of FB-IBA B. Regarding the upgrading of one ton of glass fraction from FB-IBA C, 294 kg of glass were lost in the sieved fractions. Together with 21 kg removed with the extraneous fraction 8–16 mm, 315 kg of glass, which corresponds to 36% of the glass input, are no longer available in the produced glass fraction 8–16 mm of FB-IBA C.
Regarding sieving of the input material before glass removal, approximately a third of the glass (32% of FB-IBA B and 33% of FB-IBA C) was separated into the sieved fractions >16 mm and <8 mm in both cases. Hence, sieving causes a substantial loss of glass if glass is not removed from the other particle size fractions as well. Concerning extraneous material in US_8–16, only 10 kg and 7 kg of CSP were found in the glass fractions 8–16 mm (GL 8–16) of FB-IBA B and C, respectively. In both cases, 92% of the extraneous material were removed from the glass fraction 8–16 mm by sieving and glass separation.

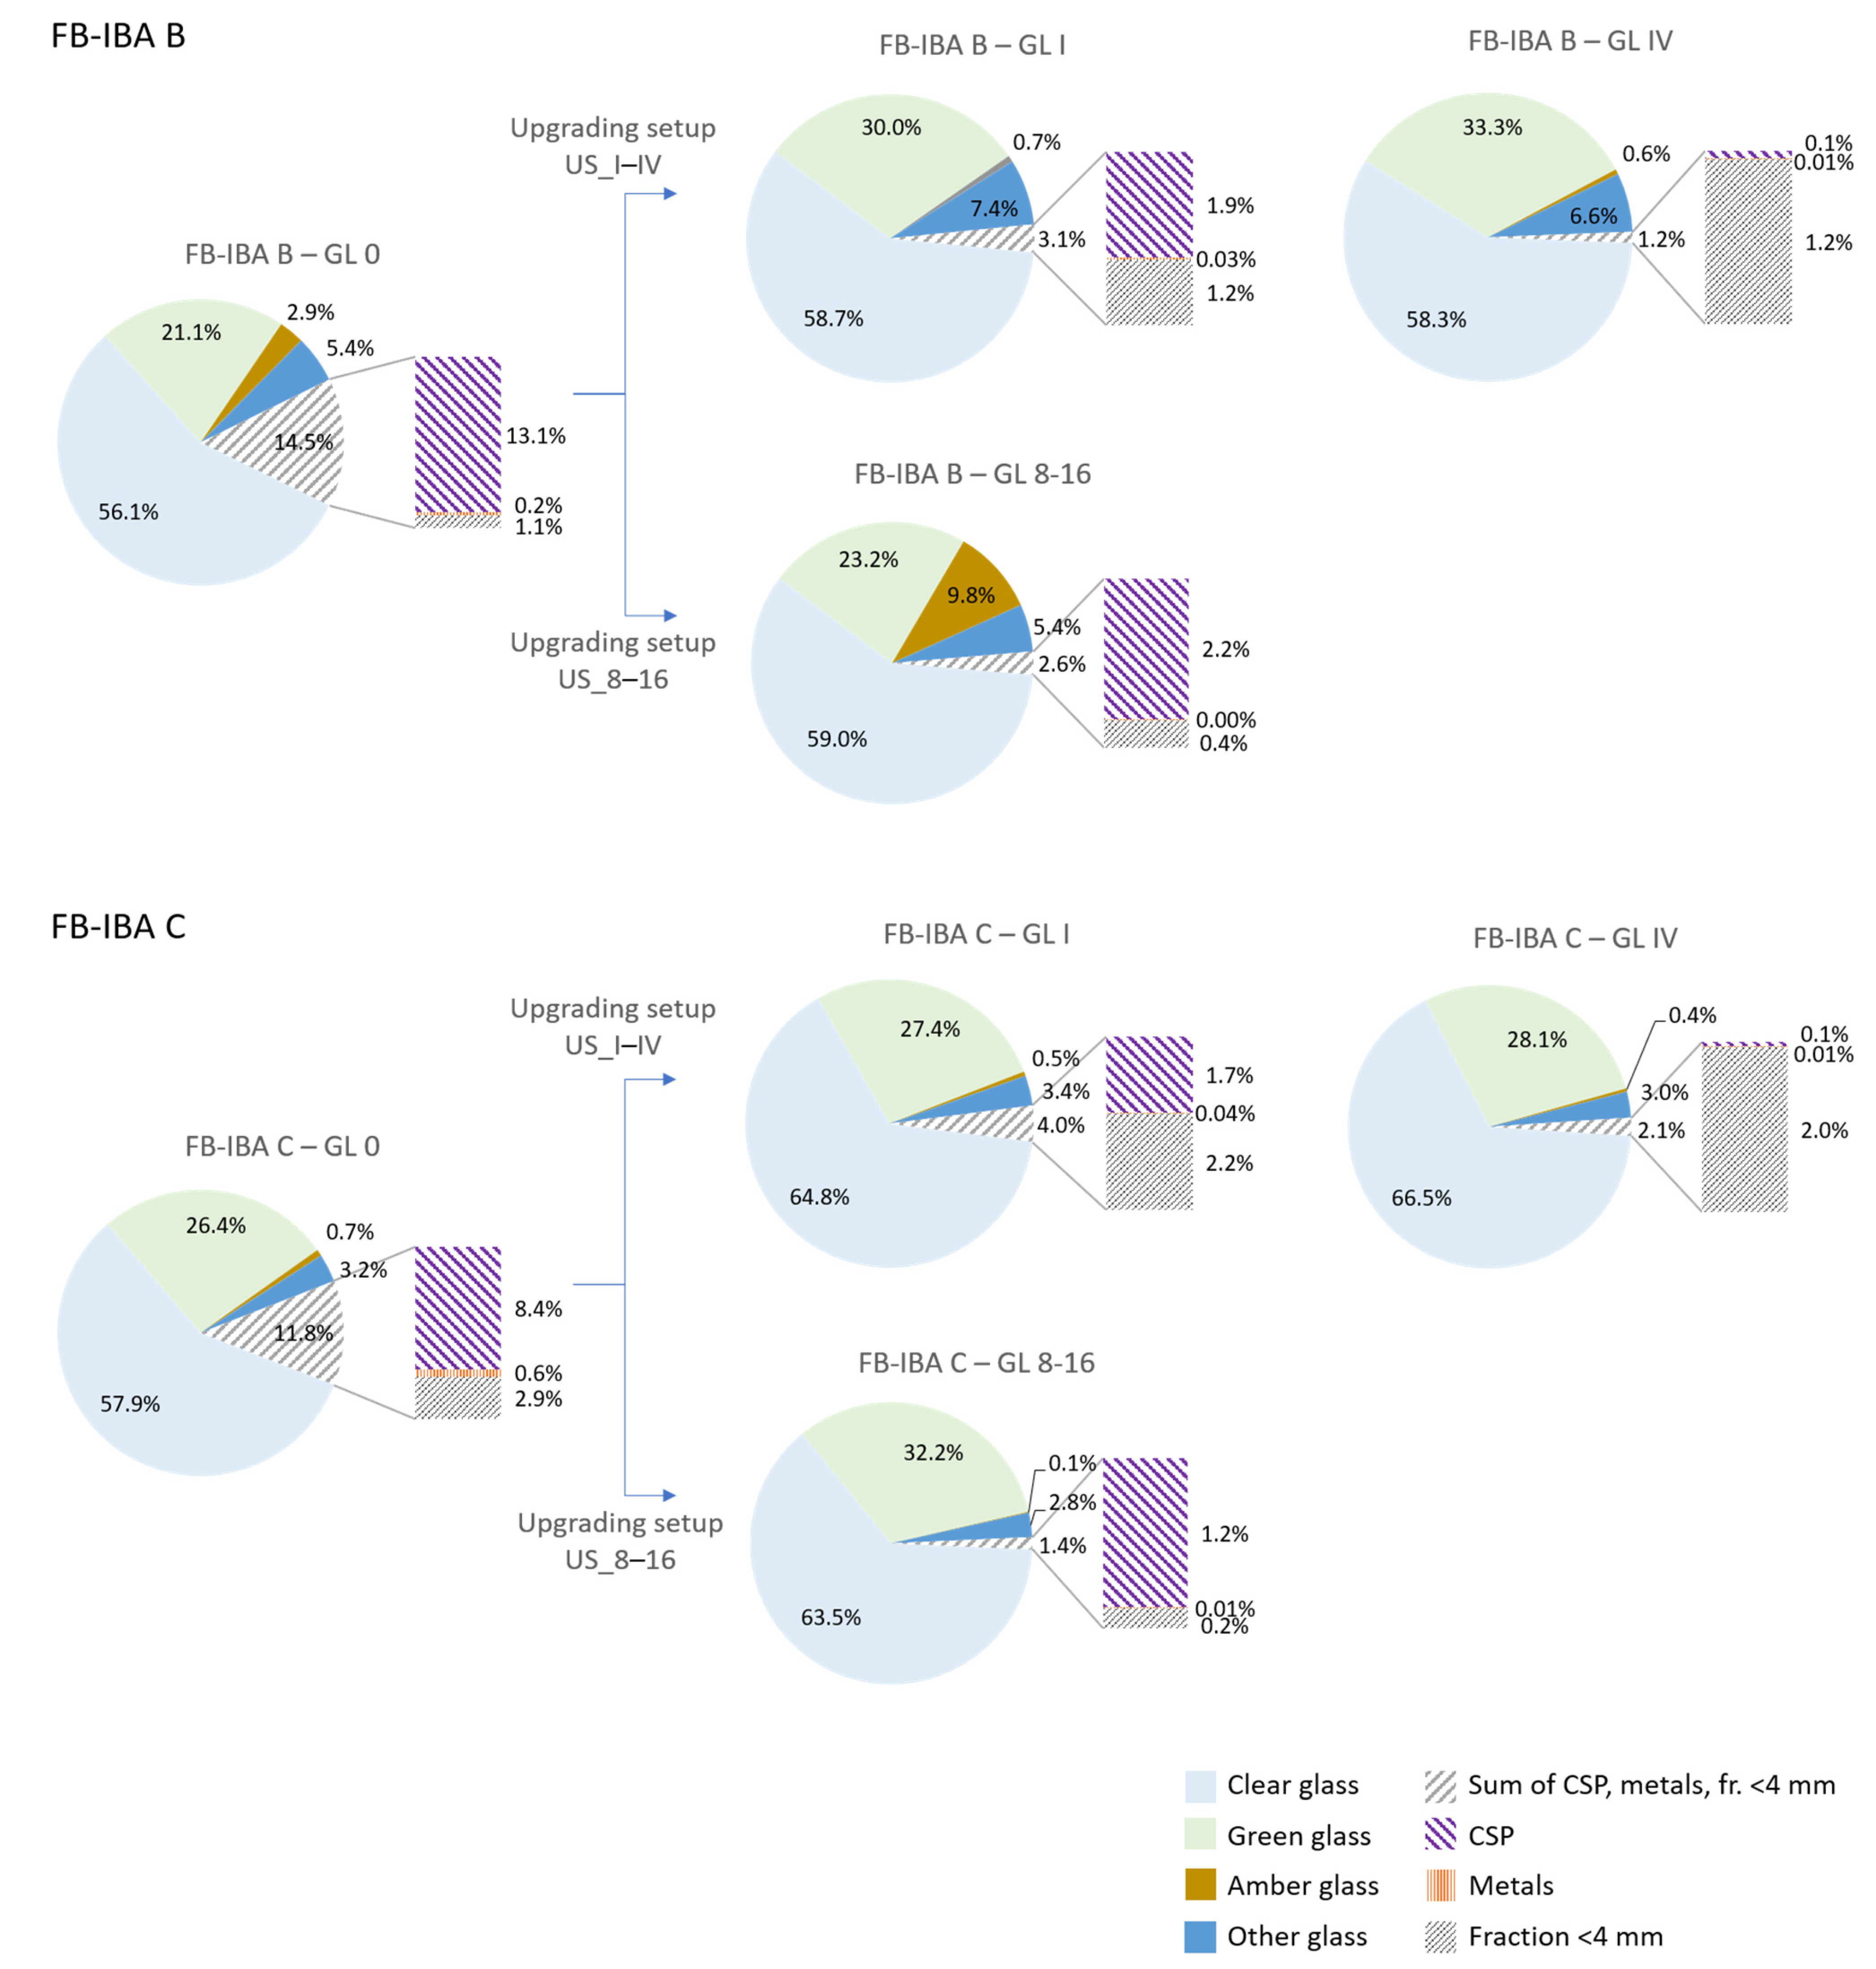
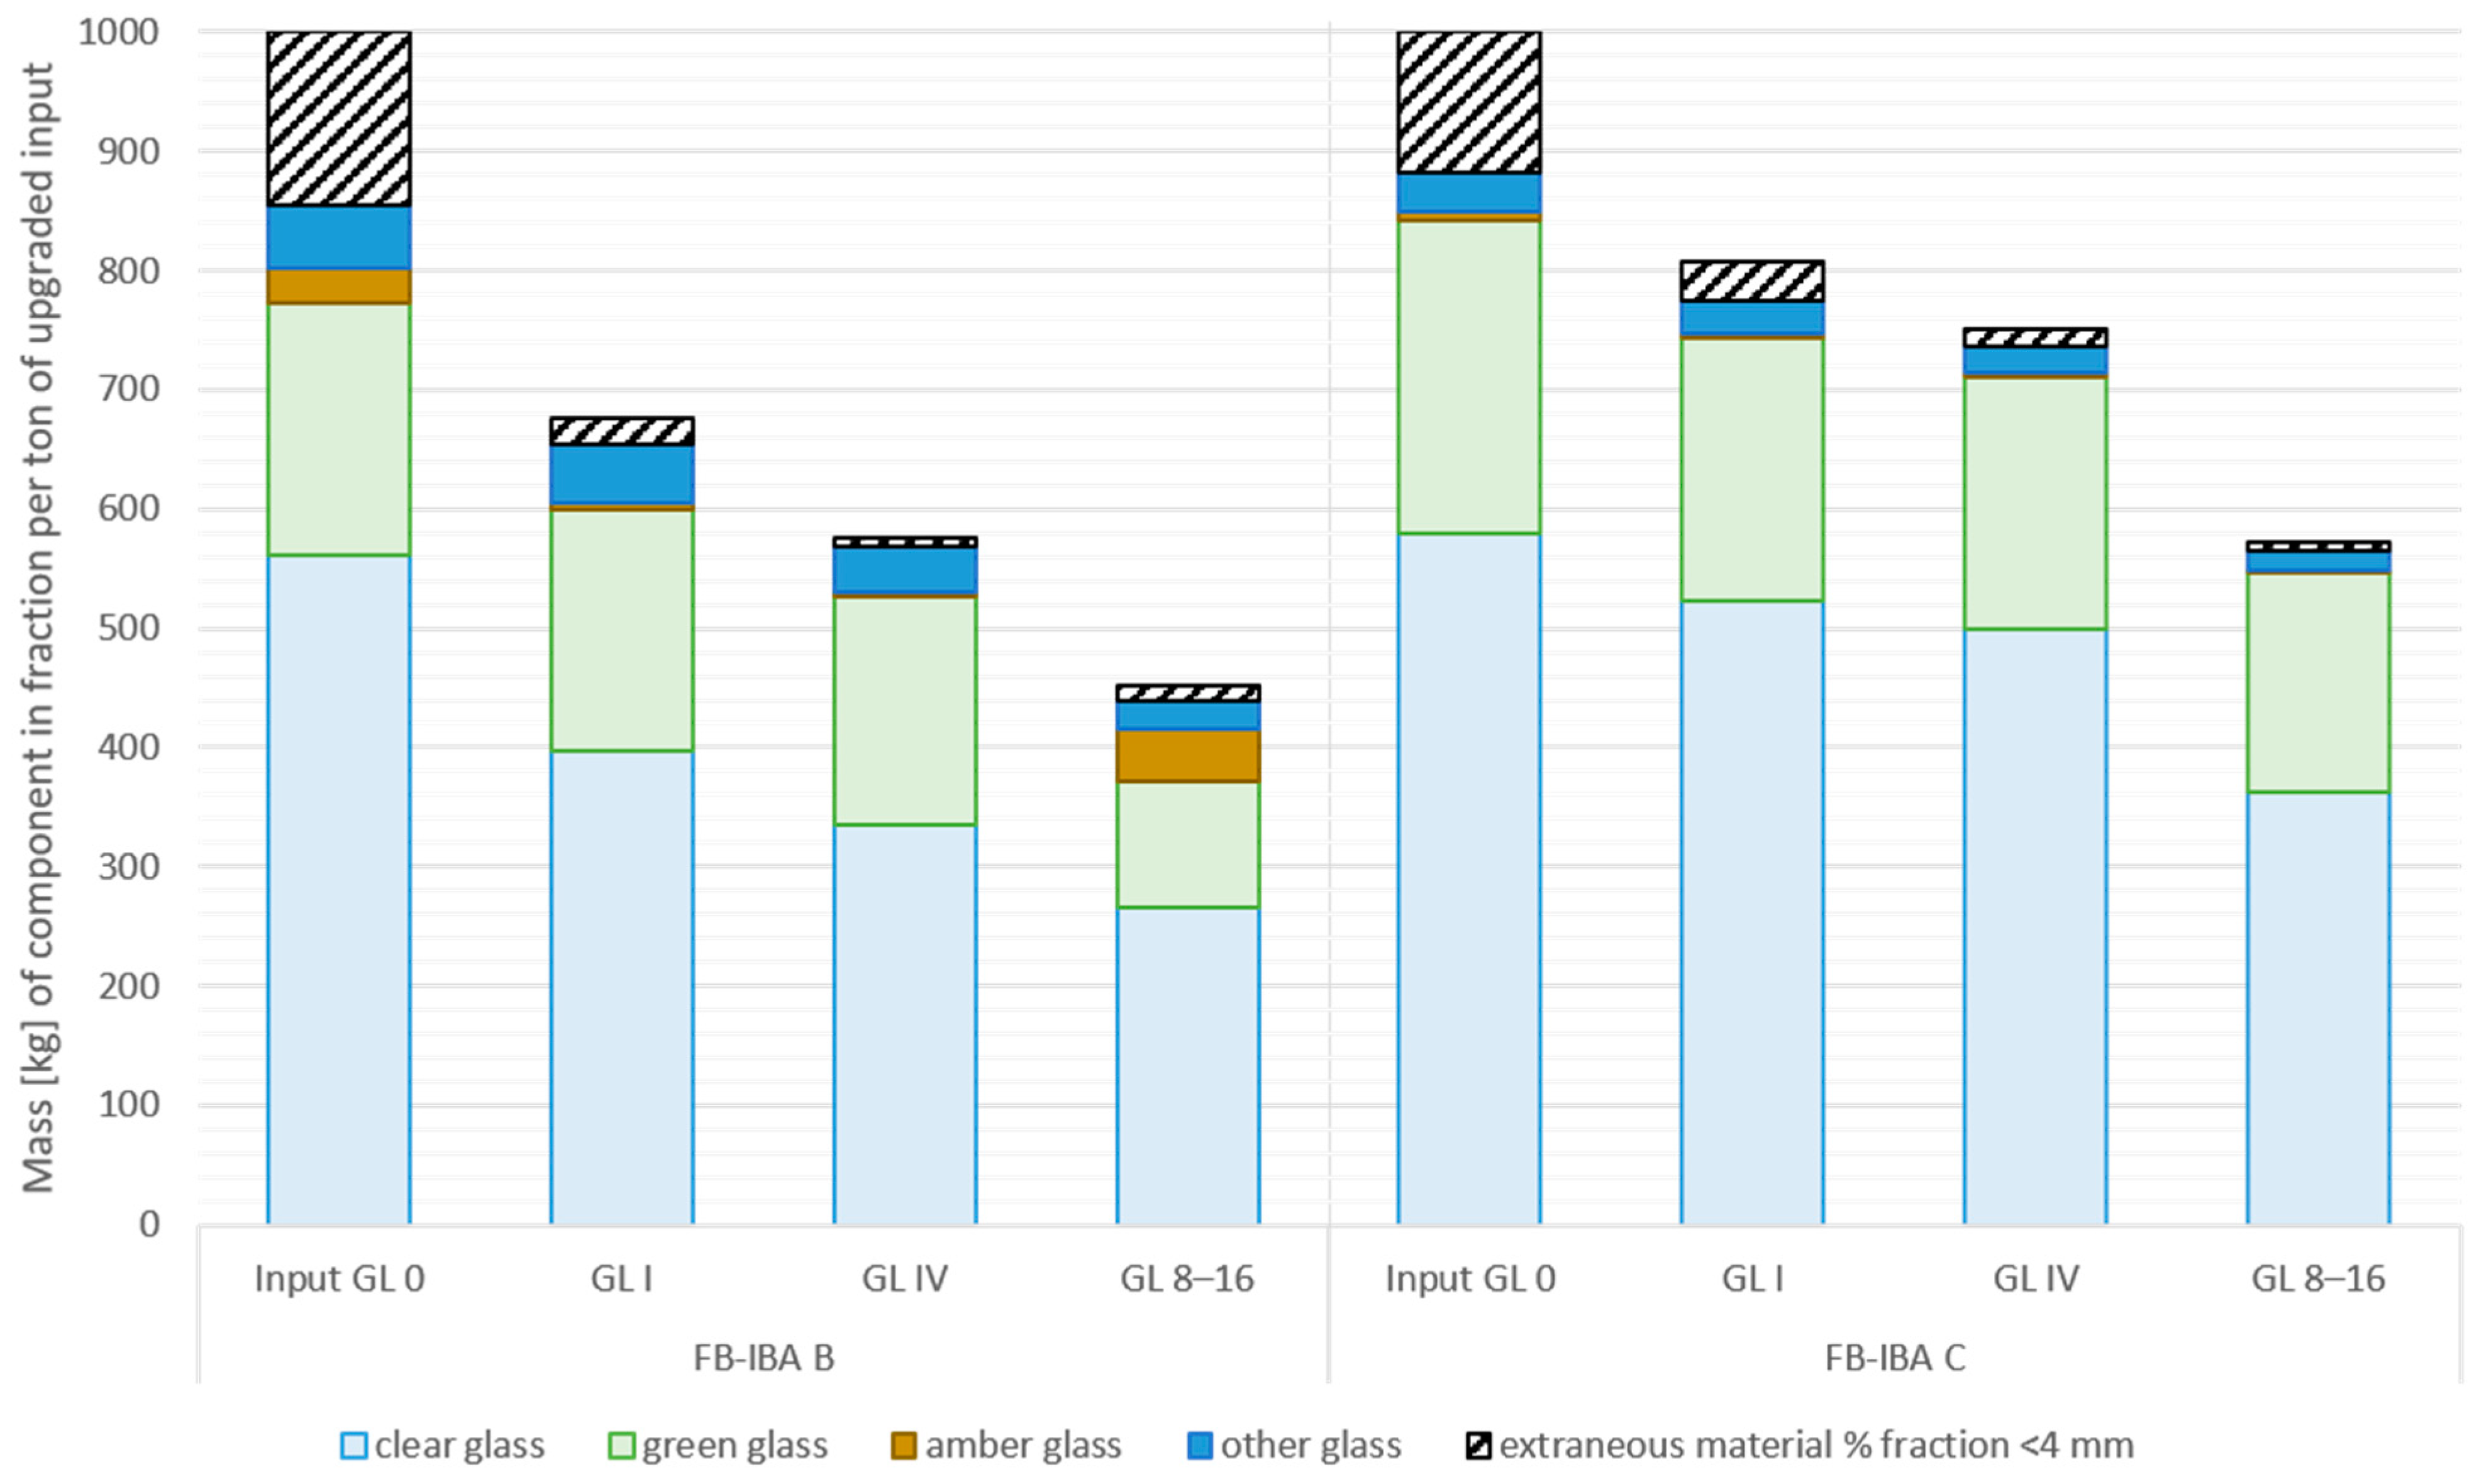
3.2. Compositions of the Glass Fractions

Figure 4 presents the compositions of the glass fractions produced in the two upgrading setups. Further data on the composition of particle size fractions or extraneous material fractions, respective numerical values and pictures of the manually sorted material are given in the Supplementary Material (Section S2).
On the left side in Figure 4 the compositions of the glass fractions before upgrading are depicted, which are referred to as “GL 0” therein. These values are the mean value of the compositions calculated from both upgrading setups. The input fractions GL 0 contain mostly clear glass (56–58%), followed by green glass (21–26%). The content of amber glass does not exceed 3%, which can be traced back to the fact that amber glass in Austria is primarily used for beer bottles, which are predominantly part of a deposit refund system and therefore not disposed of in MSW. A total of 3–5% of “other glass” was found in the glass fractions. FB-IBA B contains more “other glass” and CSP than FB-IBA C. Extraneous material (CSP and metals) made up 13% (FB-IBA B) and 9% (FB-IBA C) in total before upgrading. After upgrading, the lowest CSP content determined was 0.1% for both IBAs after four-step upgrading. The metal contents were in the range of 0.004–0.04% after upgrading with the lowest content achieved in single-step upgrading of US_8–16.
The fraction residues < 4 mm is given in all results but is not further examined, as it can be expected that this fraction can be easily removed by sieving or appropriate dust extraction during an industrial upgrading process.

3.3. Results of Chemical Analysis of the Fractions

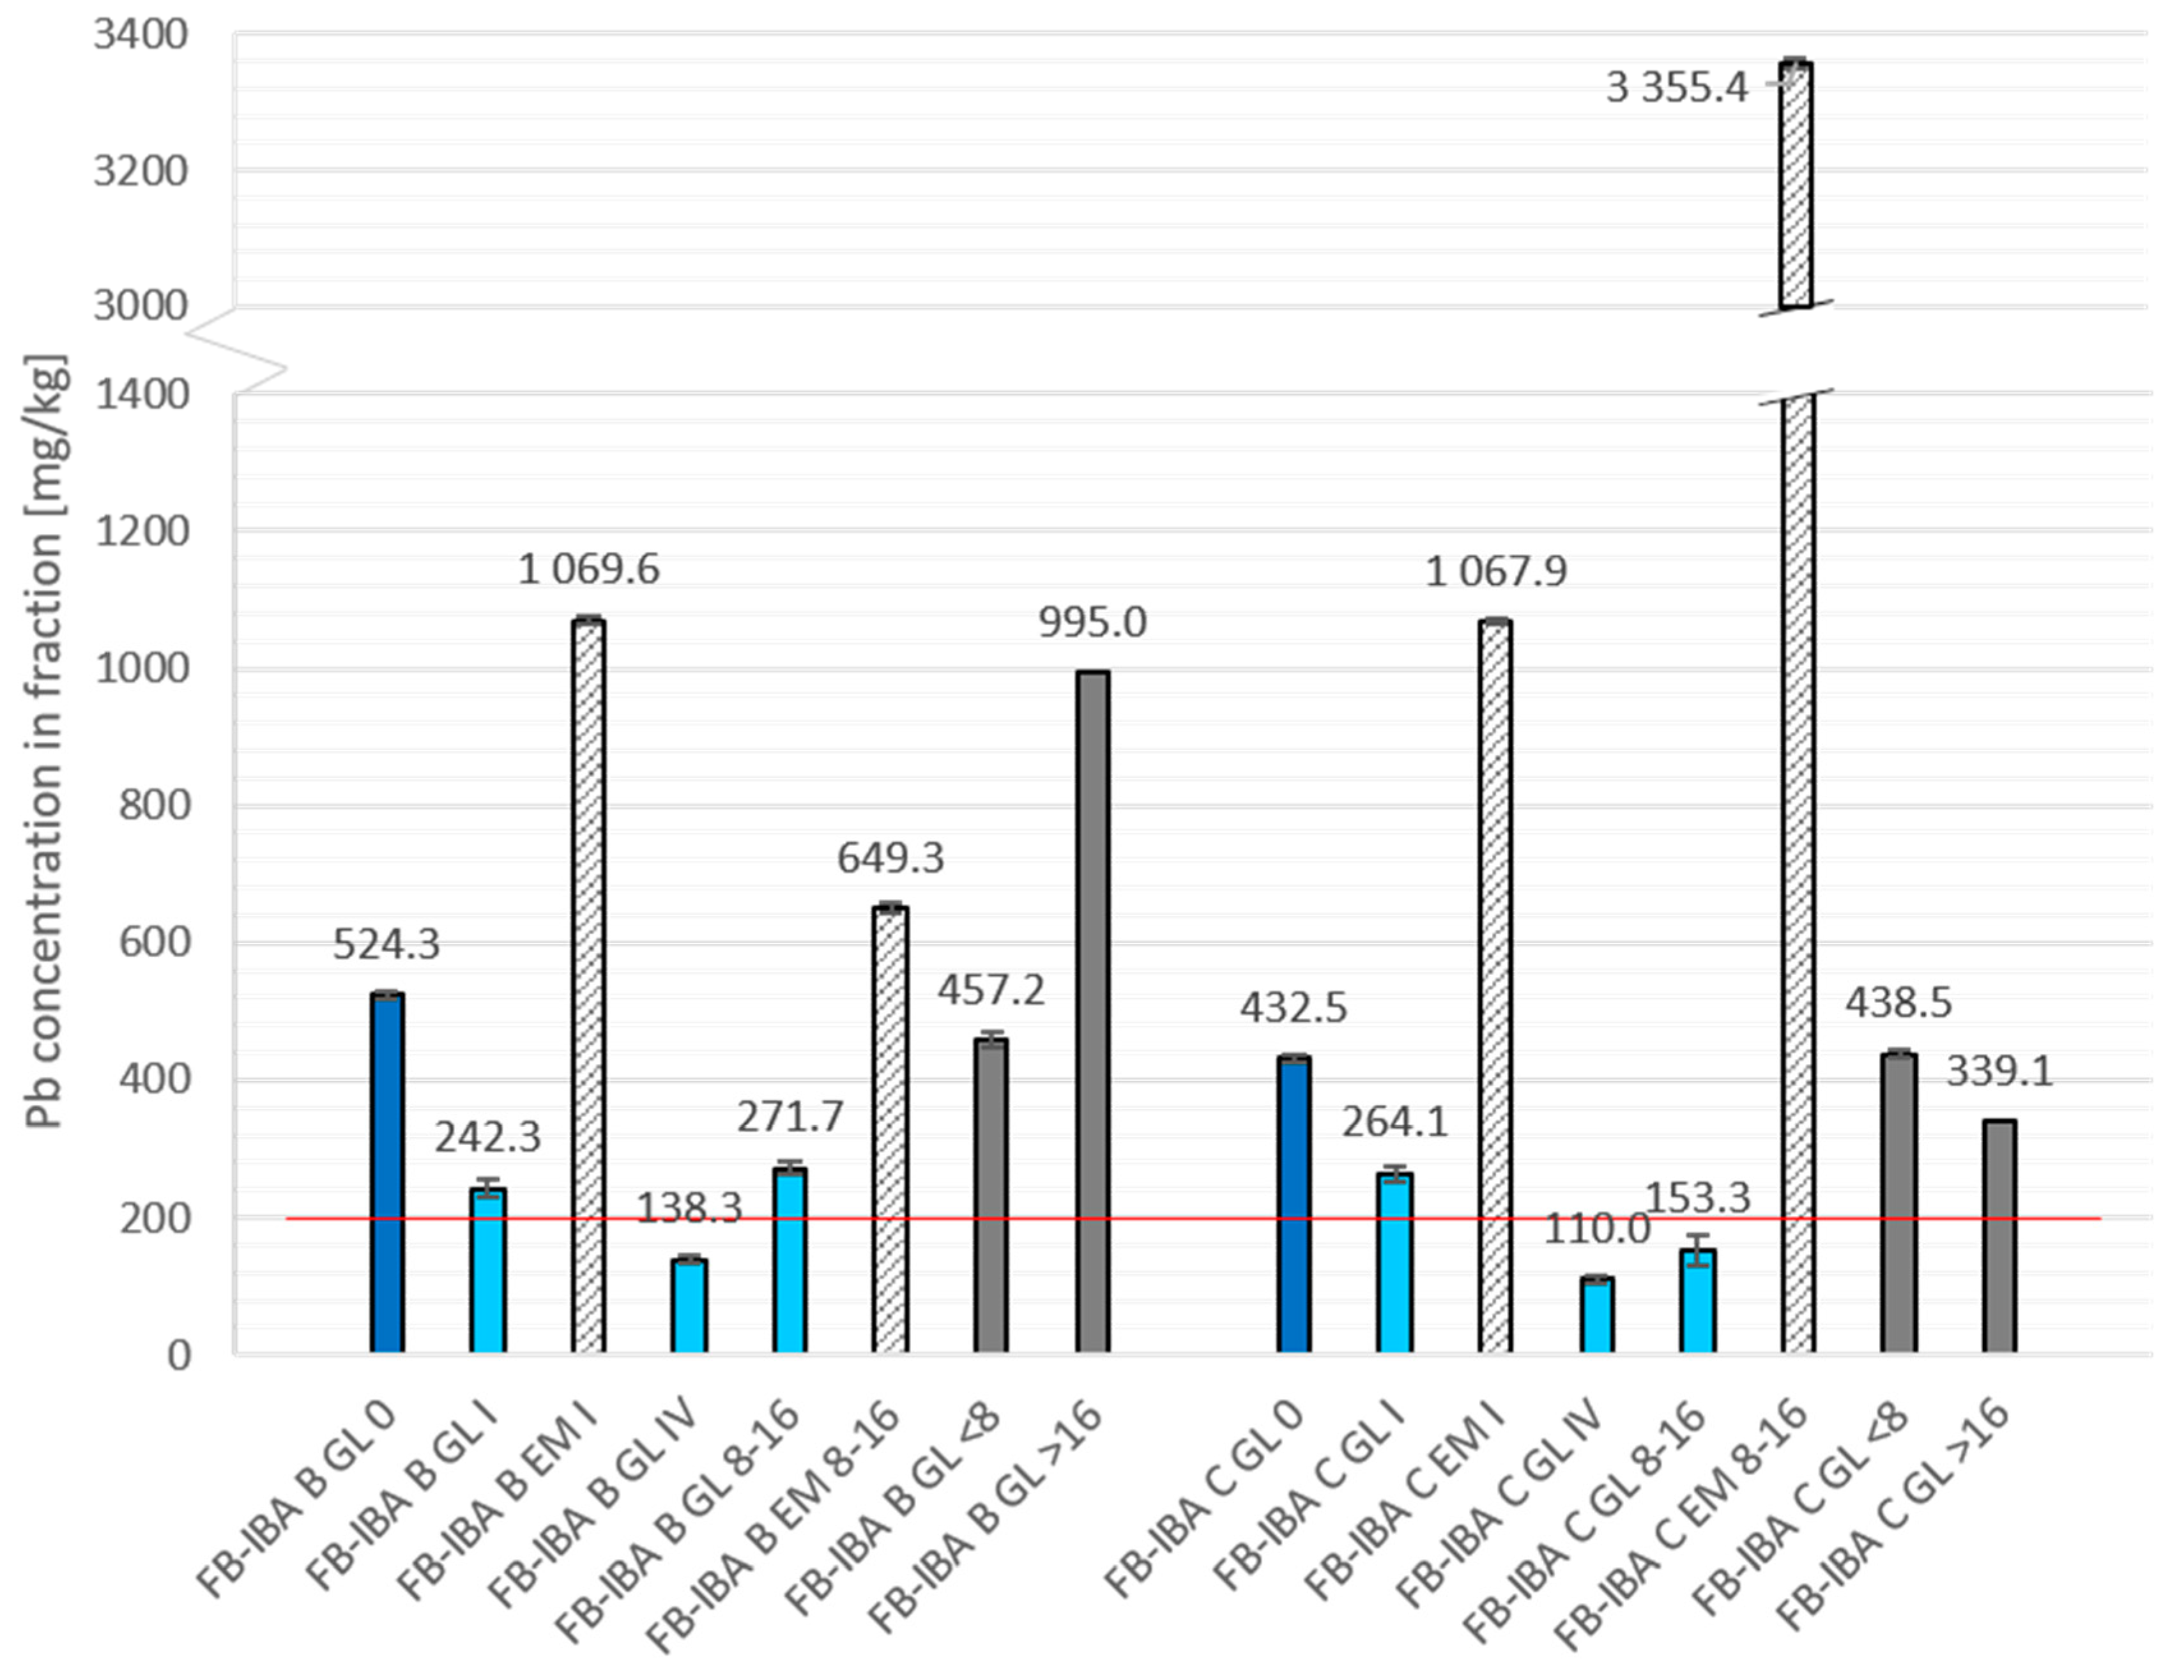
3.3.1. Results of XRF and Cr(VI) Analysis

Pb, Cd, Hg, and Cr(VI) are limited to 200 mg/kg in the packaging glass industry and were therefore analyzed [18]. The results can be found in the Supplementary Material (Table S6). For Cd, Hg and Cr(VI) all measurements were determined to be below the detection limits, which correspond to 15 mg/kg (Cd), 13 mg/kg (Hg), and 2 mg/kg (Cr(VI)), respectively. For Cd and Hg the detection limit was calculated by three times the standard deviation [59]. Only in the case of Pb were relevant concentrations measured, which are depicted in Figure 5. Therefore, Pb is the only critical parameter to meet the limit value of the packaging glass industry. In the glass fractions after upgrading, Pb concentrations are in the range of 110–272 mg/kg.
The content of Pb in the input glass fractions (GL 0) could be calculated by a material flow analysis on the basis of Pb, which is shown in the Supplementary Material (Tables S7 and S8). Consistent results were determined in both upgrading setups. The Pb content of FB-IBA B was calculated as 511 mg/kg (US_I–IV) and 538 mg/kg (US_8–16) and those of FB-IBA C to 419 mg/kg (US_I–IV) and 446 mg/kg (US_8–16), resulting in the mean values given in Figure 5.
A comparison of the glass and extraneous material fractions demonstrates that Pb can be enriched in the latter by upgrading. The glass sorter is able to detect and remove ceramics and lead glass, which both contain higher amounts of Pb than waste glass, according to the literature: Götze et al. [60] reported Pb concentrations around 200 mg/kg in waste glass [60]. Investigations by Turner [61] presented color-dependent Pb concentrations in glass in the range of 46–202 mg/kg. Significantly higher Pb concentrations of 900–2000 mg/kg were reported in ceramics [58] and particularly in lead glass with 180,000–270,000 mg/kg PbO [4]. Mika et al. [62] and Blasenbauer et al. [37] provide reference data for the glass fraction of FB-IBA C. Mika et al. [62] determined 370 mg/kg of Pb by total digestion and inductively coupled plasma optical emission spectrometry (ICP-OES) of the glass fraction industrially recovered. This is slightly below the value determined in this study (433 mg/kg) but lies within a plausible range. Blasenbauer et al. [37] detected higher Pb contents of 630 mg/kg in glass manually sorted from untreated IBA. A possible reason for the lower value in the present study is that lead glass might also be depleted in the glass fraction by IBA treatment. For example, the heavy material fraction separated by their sinking speed in the jig also contains high glass amounts [48]. Regarding Cd contents, which were below the detection limit in the present work, Mika et al. [62] reported 8.6 mg/kg. Cd concentrations in various glass fractions analyzed by Turner [61] and in glass from IBA analyzed by Blasenbauer et al. [37] did not surpass 22 mg/kg. Hence, this parameter is clearly less decisive for compliance with the limit value of the packaging glass industry compared to Pb.
Results of the XRF analysis of further parameters are given in the Supplementary Material (Table S9). Therein, also the mass share of manually sorted metals during sample preparation before XRF analysis is shown, which lay between 0.01% and 3.88%.

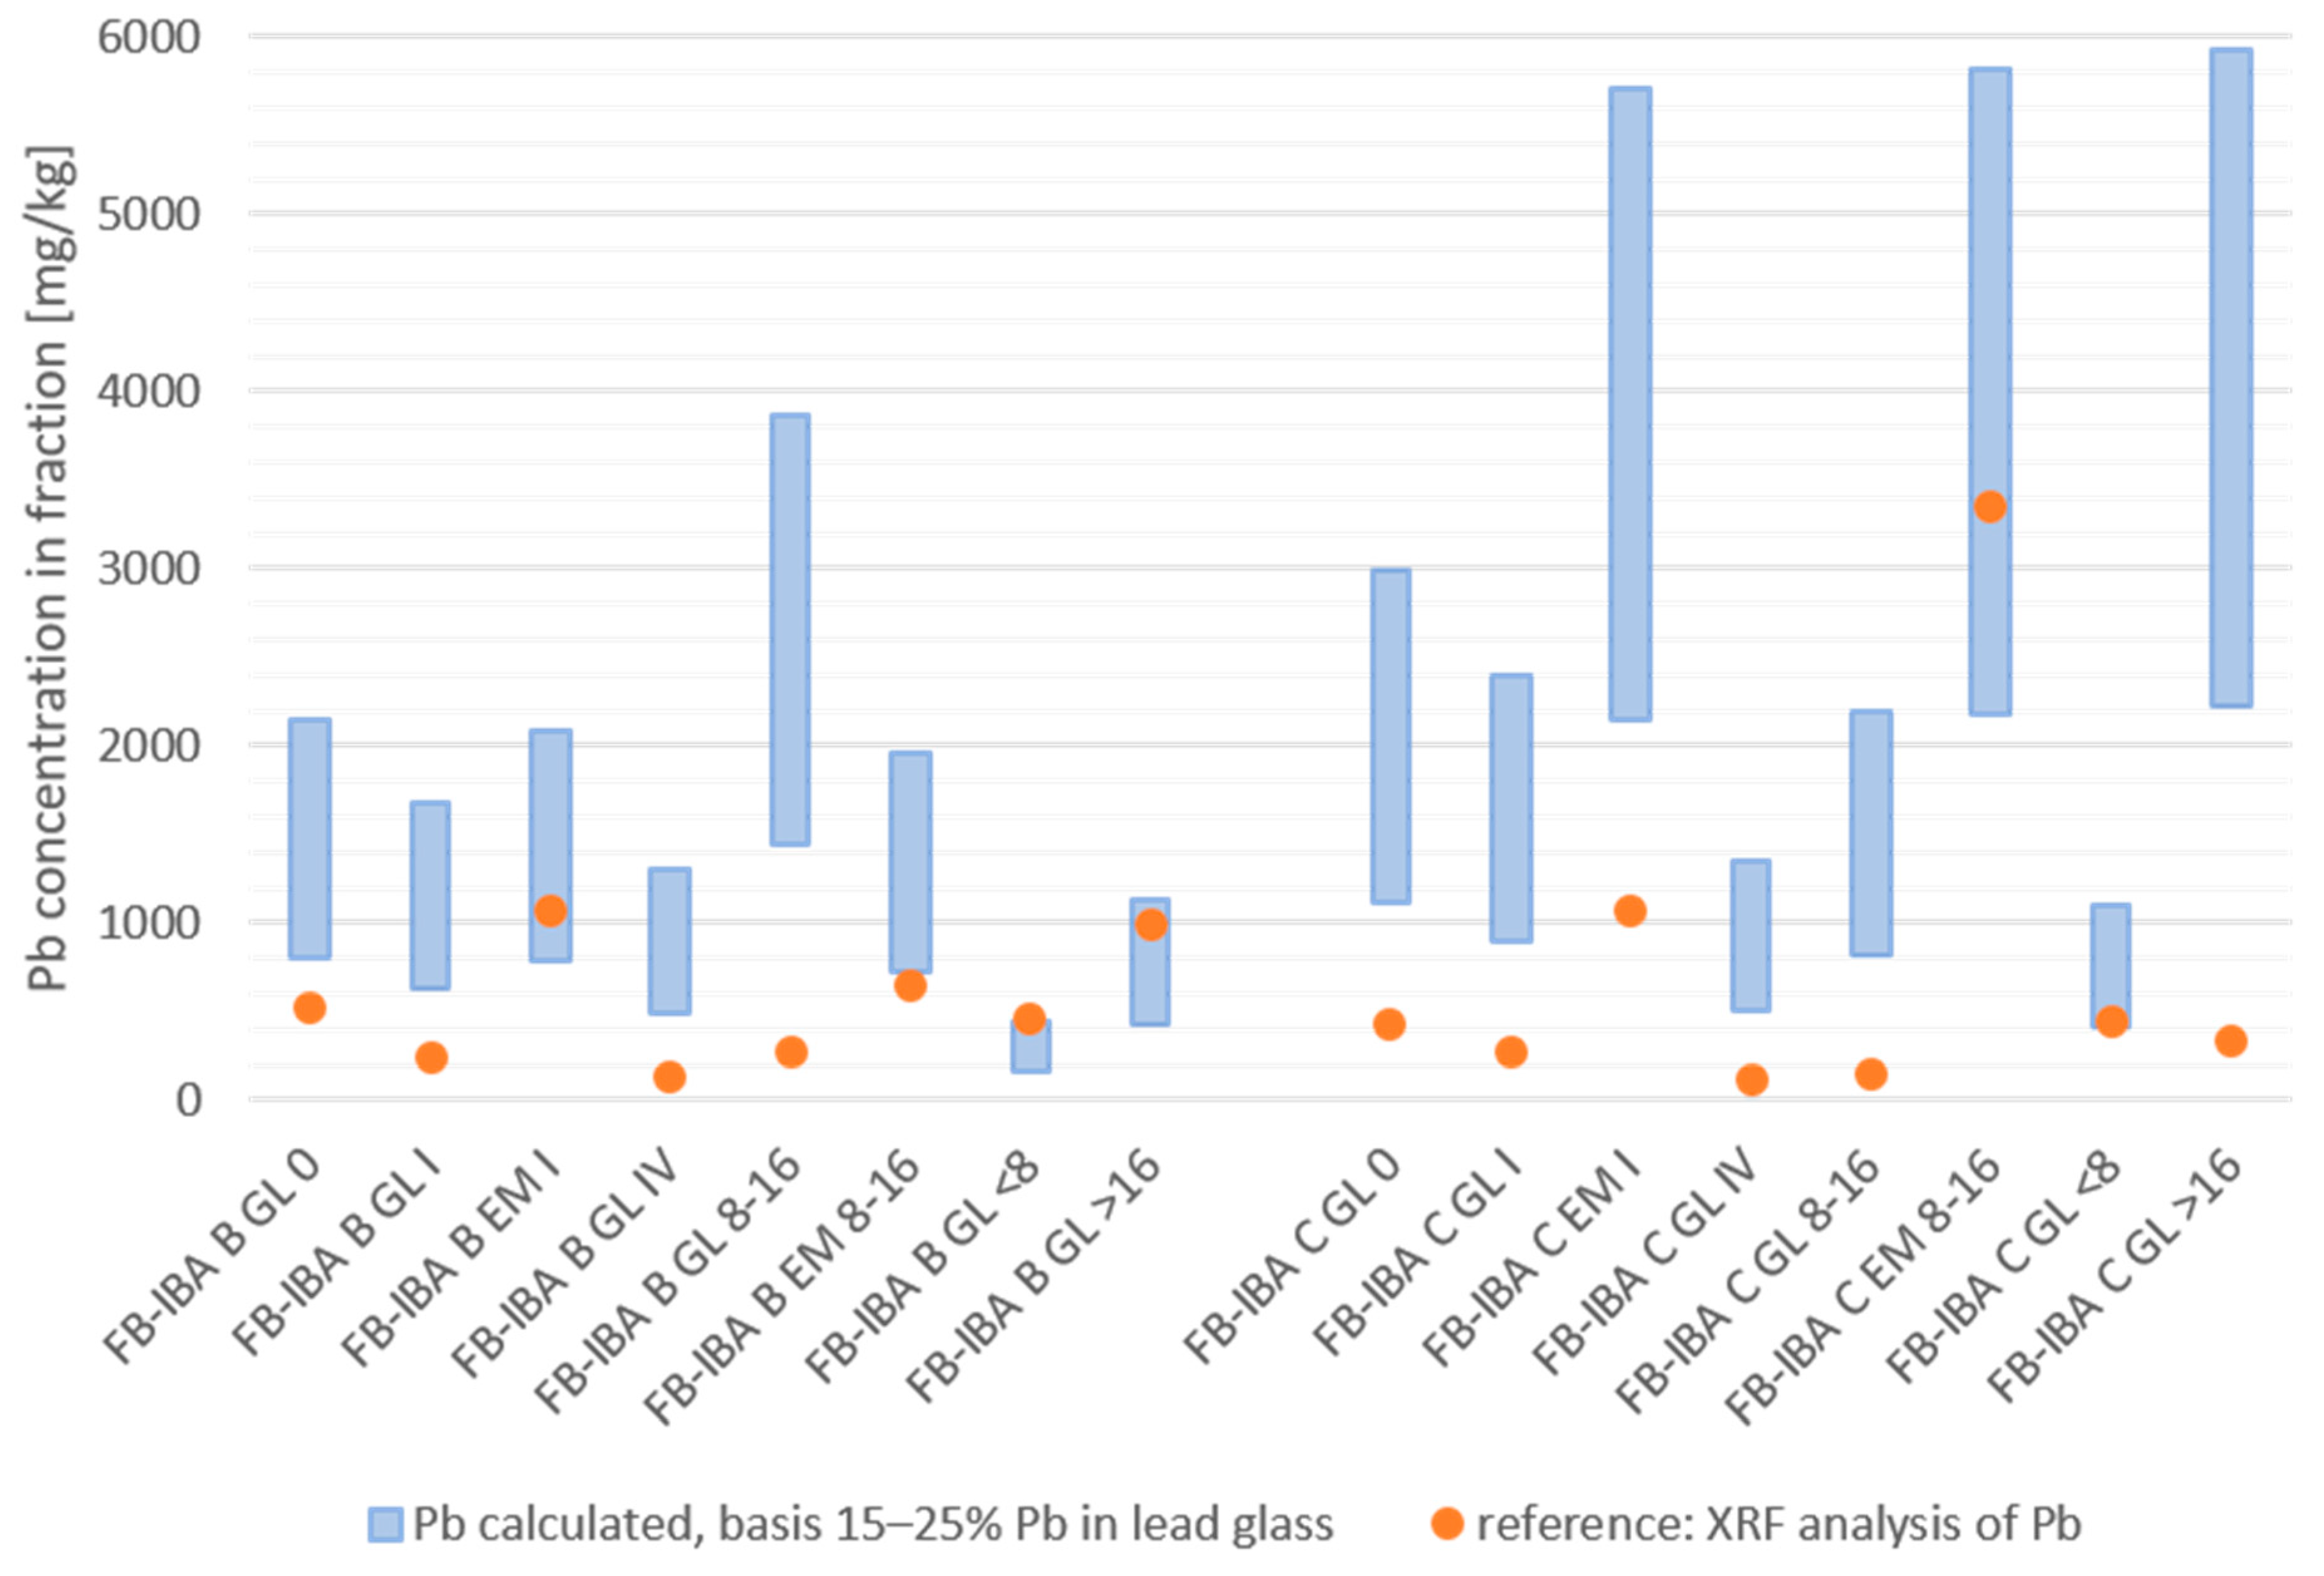
3.3.2. Results of Determination of Lead Glass by UV-C Light

The results from manual lead glass sorting using a UV-C lamp are given in the Supplementary Material (Table S10). The mass share of lead glass shards in each glass fraction did not exceed 1.5%. Only extraneous material fractions produced from further processing showed higher lead glass shares of up to 3.2%, which confirms the success of the lead glass removal by sensor-based sorting. The calculation of the Pb content in each fraction, based on the mass share of lead glass, is shown in Figure 6. These values are compared to the Pb concentrations measured by XRF.
From these results, it can be seen that the UV-C lamp can only be used for a tentative estimation of lead glass and is not suitable for an exact determination of Pb. Pb concentrations calculated from the mass of lead glass were considerably higher than the XRF values. However, this suggests that lead glass shards are a predominant Pb carrier in the FB-IBA glass fractions. Accordingly, the Pb concentration in waste glass can be reduced by the removal of lead glass.

3.4. Evaluation of the Upgrading Setups

A comparison of the recoverable glass from the upgrading setups is shown in Figure 7. Respective numerical values can be found in the Supplementary Material (Tables S11 and S12). This is important, as not only the quality but also the quantity of the glass is decisive for the feasibility of the glass recovery.
From Figure 7 it becomes clear that upgrading of the glass fractions causes material losses. In particular, sieving of the glass fractions in US_8–16 resulted in high glass losses of about a third of the glass if only the glass fraction 8–16 mm is further upgraded, as described in Section 3.1. Comparison of the first sensor-based sorting step of both upgrading setups shows that in US_I–IV 76% (FB-IBA B) and 88% (FB-IBA C) of the glass in the input fraction (GL 0) were still available in the fraction GL I, accounting for 654 kg and 774 kg. On the other hand, in GL 8–16 of US_8–16 only 51% or 440 kg (FB-IBA B) and 64% or 564 kg (FB-IBA C), respectively, of the glass in GL 0 were present, which amounts to 440 kg (FB-IBA B) and 564 kg (FB-IBA C). Since the glass fractions produced by this first sorting step show similar shares of contaminants after sieving (GL 8–16) compared to the single-step upgrading of unsieved glass fractions (GL I), the upgrading of unsieved glass fractions in upgrading setup US_I–IV turns out to be more advantageous. Only the metal removal from the narrower particle size in US_8–16 showed notably better results. The necessary effort for sieving is not considered to be reasonable. This might be even more relevant for IBAs where glass is not predominantly concentrated in one particle size fraction, which is the case in the study by Del Valle-Zermeño et al. [41], since more glass would be lost in the other particle size fractions through sieving.
Yet, an adapted upgrading setup, where glass is also recovered from the sieved fractions could make a difference and reduce glass losses. In upgrading setup US_8–16, the sieved fractions contain a third of the glass, thereof 24% (FB-IBA B) and 19% (FB-IBA C), respectively, in the particle size fraction >16 mm. If the glass is additionally recovered from this coarser fraction, the glass potential could be clearly increased. Also glass recovery from the fraction <8 mm should be examined, but the fine fraction 0–4 mm needs to be sieved beforehand, as it possibly impedes the process [63].
In addition to sieve losses, imperfection of sensor-based sorting can always cause falsely ejected glass into extraneous material fractions. This can, for example, be caused by overlapping particles, large particle size differences, or fine particles in the material [63]. Tarnished glass, which has a less translucent surface, can also impede glass detection, since the glass might falsely be detected as mineral material. Therefore, more glass is missorted into extraneous material fractions. In this study, higher contents of tarnished glass occurred in FB-IBA B, as can be seen in the pictures of the glass fractions in the Supplementary Material (Section S2.2). This presumably leads to the notable difference between FB-IBA B and C regarding the recovered glass amounts in both upgrading setups. Although both FB-IBAs contain similar amounts of glass in the input, clearly higher amounts of all glass fractions could be produced from FB-IBA C. The higher content of tarnished glass is presumably caused by the higher incineration temperature in the MSWI plant where FB-IBA B originates from [1]. At higher temperatures, melt reactions occur on the surface of the glass shards, while the sand in the fluidized bed causes abrasion on the softened glass. This indicates that glass upgrading is highly dependent on the actual material and cannot be generalized for all FB-IBAs.
Evaluating the multi-step upgrading setup US_I–IV, Figure 4 shows that the purest glass fractions are produced after the four-step glass removal. GL IV consists of 99.9% of glass in the case of both FB-IBAs. Furthermore, Pb can be successfully depleted by multi-step upgrading, as shown in Figure 5. Nevertheless, glass is lost in each sorting step of the upgrading by wrong ejection into extraneous material fractions. As determined in Section 3.1, 67% (FB-IBA B) and 83% (FB-IBA C) of the total glass in the input were recovered after four treatment runs. GL I of US_I–IV contained 76% (FB-IBA B) and 88% (FB-IBA C) of the total glass but contained nearly 2% of extraneous material in both cases.
It could be seen from this study that the success of the glass recovery is highly dependent on the configuration of the upgrading. Therefore, a more suitable upgrading constellation can possibly be found, especially if the compositions of the glass fractions are considered. According to the authors’ experiences, the order of negative or positive sorting and the content of extraneous material in the original glass fraction strongly influence the recovery outcome. Chen et al. [63] also report that depending on the target of the sorting step (i.e., high yields or high purity) different sorting settings have to be applied.

3.5. Suitability of the Glass Fractions in the Packaging Glass Industry

To utilize glass cullet in a glass melting furnace, specific requirements must be met. Besides humidity and the content of organic material, which can be easily met by glass from incineration residues, the contents of CSP and metals are also limited. The CSP content in the glass cullet must not exceed 20 mg/kg (0.002%); for ferrous and non-ferrous metal pieces, the threshold is 2 mg/kg and 3 mg/kg, respectively, which equals 0.0002% and 0.0003% [18]. Also, the sum of the heavy metals Pb, Cd, Cr(VI) and Hg has to be below 200 mg/kg. Despite very low shares of extraneous material, especially after the four-step upgrading, the study’s outcome suggests that multi-step upgrading is insufficient for meeting the requirements of the packaging glass industry, since minimum CSP contents of 0.1% were determined. In general, these highly stringent thresholds for CSP and metals are challenging to verify. For example, a small metal piece in several hundred kilograms of glass can lead to rejection of the material. Aldrian et al. [64] reported, though, that these limit values are exceeded even by one of the largest Austrian waste glass treatment plants, where ferrous and non-ferrous metal contents up to 0.3% and 0.7%, respectively, were assessed. Additionally, studies from other countries report lower quality requirements for glass, e.g., 98% purity in Portugal [31] or 96% purity in the UK [30]. Therefore, dialogues with local glass producers can also be suggested to inquire the respective specifications.
Regarding the heavy metal content examined in Section 3.3.1, the present study found that Pb is primarily relevant to the corresponding threshold. Only the glass fractions after four-step upgrading and one glass fraction 8–16 mm met the 200 mg/kg limit, which implies that multiple lead glass separation steps are necessary to comply with the requirements safely. To evaluate whether limit values can, in principle, be achieved through optimized treatment, investigations into further upgrading and adapted treatment configurations are necessary.
An issue that must be addressed concerning the recycling of glass from mixed MSW in FB-IBAs is that, by definition, only specific glass types should be disposed of in mixed MSW in Austria. This means that special glasses, e.g., lead glass or heat-resistant glass, are supposed to be enriched in mixed MSW and, therefore, in the FB-IBAs. Consequently, undesirable glass types for the packaging glass industry are concentrated in MSW. Yet, data from Austria indicate that the abundant amount of glass in mixed MSW is packaging glass that is not disposed of correctly in the separate glass waste collection [65]. Moreover, almost 20% of the packaging glass in Austria is not collected separately and is therefore lost for recycling if not recovered from FB-IBAs [33]. Nevertheless, since the glass recycling target of the EU, which is set to 75% as of 2030, has already been attained in Austria, there is no regulative incentive to improve the amount of glass recycled [24]. Furthermore, it has to be considered that the ecological benefit of glass recycling is highly dependent on the transport distance and the processing effort [66,67]. These factors are also critical for the economic feasibility of the upgrading scenarios. Each processing step consumes energy, with the utilization of compressed air being one of the most relevant cost factors in the case of sensor-based sorting [20]. Therefore, the environmental footprint and financial aspects of glass recovery from FB-IBAs should also be determined when developing a specific upgrading scenario in the future. Additionally, further recycling options, including open-loop recycling, should be assessed for glass from IBA as this might reduce the necessary upgrading effort [68,69,70]. It must also be mentioned that the practical feasibility of glass upgrading from FB-IBA is strongly dependent on the respective local market where it is applied. Factors like the disposal costs for landfilling or transport distances between the MSWI plant, the IBA treatment plant and the packaging glass industry strongly influence environmental and financial practicability. Furthermore, local collection rates and available amounts of glass cullet from separate MSW collection affect the demand for recovered glass from IBA and consequentially the market price.

3.6. Limitations

Regarding the upgrading setups conducted, some uncertainties must be considered when evaluating the results. As is the case for waste characterization in general, heterogeneity of the material is a crucial issue. This also counts for IBAs and the glass therein. Therefore, the general validity of the present results cannot be ensured by a single experiment, as the IBA composition depends on seasonal and regional factors, such as the extent of separate collection [71,72]. Moreover, the composition of Austrian IBAs strongly depends on the incinerated waste stream, which can include sewage sludge, industrial waste, or other materials, but also on the incineration conditions [47]. Further uncertainties arise from the sampling and manual sorting procedures. Although special attention was paid to representative sampling by a high number of increments and incremental shoveling to reduce sample masses, only limited amounts of the fractions could be sorted manually, especially in the case of some extraneous material fractions. Due to the strict limit values (e.g., 2 mg/kg of ferrous metals), more material should have been sorted. According to Bunge and Bunge [73], even dozens of tons would have been necessary to obtain valid results and a general conclusion about whether the packaging glass requirements can be met. This is not feasible in scientific research concerning personnel, time and money resources. However, the present results report the composition of glass from FB-IBAs for the first time in scientific literature and show the potential of glass recovery from IBA. Further assessments with expanded sample sizes and the implementation of statistical models can help to improve the reliability of future findings.
A practical issue that occurred at the Brantner treatment plant and deteriorated the glass quality reported is the fact that some valves of the glass sorting device at the Brantner plant, which eject extraneous material, were not working during the sampling campaign. This was only identified weeks after the sampling campaigns. It cannot be assumed to what extent this impaired the investigated glass fractions. Repaired valves could lead to improved results.

4. Conclusions

The present work shows that high amounts of glass are contained in FB-IBAs from MSWI, which can be removed technically by sensor-based sorting. The glass fraction produced from FB-IBAs primarily contains clear glass, followed by green glass; but also, extraneous material, such as CSP or metals, was found in the range of up to 13%. For high-grade recycling in the packaging glass industry, the content of extraneous material has to be reduced by upgrading. In this study, it was found that glass fractions with >99% purity can be produced by upgrading steps. Despite this high value, the stringent regulations of the packaging glass industry could not be met in the experimental setting. To further improve the glass quality, adapted upgrading should be investigated. Moreover, other recycling paths for the glass should be assessed, e.g., foam glass or expanded glass. Therefore, the landfilling of this secondary resource could be reduced. Nevertheless, the recovery and purification of glass from FB-IBAs is not only limited economically, but the ecological feasibility also depends on the processing effort and the transport distance. Since Austria is seen as a forerunner regarding waste management [34,74], the amount of glass that can potentially be recovered from mixed MSW is comparably low. Regarding other European countries with lower collection rates, however, considerably more glass might be found in IBAs from MSWI, which could make the present approach more relevant [75]. Glass recovery from MSW IBA can also be advantageous compared to recovery from mixed MSW since organic contaminants are destroyed and the mass of the MSW is reduced by incineration. Therefore, potential economic and ecological benefits should be examined more closely. In general, fluidized bed combustion for MSW should be investigated in more detail. The potential of glass in FB-IBAs contributes to the advantages of FB-IBAs compared to G-IBAs, which were demonstrated in several Austrian studies hitherto [37,47,48,62]. Additionally, the pretreatment of MSW before fluidized bed combustion could have positive ecological effects, as more recyclable material can be recovered [33]. A holistic approach would be required to determine if fluidized bed combustion of MSW is generally advantageous, also considering the downsides of this incineration technology, like higher amounts of fly ash.

Supplementary Materials

The following supporting information can be downloaded at: https://www.mdpi.com/article/10.3390/recycling10020063/s1, Figure S1: Pictures of glass fractions of FB-IBAs before upgrading; Figure S2: Sensor-based glass sorter used for the upgrading steps; Figure S3: Crushed glass <2 mm after crushing and sieving; Figure S4: Pelleting of glass powder for XRF analysis; Figure S5: Fluorescence of lead glass through UV-C radiation; Table S1: FB-IBA B: Compositions of glass fractions produced in the upgrading setups; Table S2: Composition of extraneous material fractions produced in the upgrading setups; Table S3: FB-IBA B: Compositions of particle size fractions of upgrading setup US_I-IV determined by manual sorting of the sieved fractions; Table S4: FB-IBA C: Compositions of particle size fractions of upgrading setup US_I-IV determined by manual sorting of the sieved fractions; Table S5: Compositions of fractions of upgrading setup US_8-16 determined by manual sorting; Figure S6: Pictures of the glass fractions GL 0 of FB-IBA before upgrading; Figure S7: Pictures of the glass fractions GL IV from upgrading setup US_I-IV; Figure S8: Manually sorted compounds of the fraction GL 8-16 from FB-IBA C; Figure S9: Manually sorted compounds of the fraction EM 8-16 from FB-IBA B; Table S6: Results of XRF analysis for Pb, Cd, Hg and Cr(VI) in different fractions; Table S7: Calculation of the Pb contents in the input glass fractions; Table S8: Calculation of the Pb contents in the input glass fractions (GL 0) by means of material flow analysis of upgrading setup US_8-16; Table S9: Results of the XRF analysis for additional elements; Table S10: Results of manual lead glass sorting using UV-C light; Table S11: FB-IBA B: Compositions of glass fractions produced in the upgrading setups; Table S12: FB-IBA C: Compositions of glass fractions produced in the upgrading setups.

Author Contributions

Conceptualization, J.M. and J.L.; methodology, J.M., S.M., A.T.-A. and J.L.; validation, J.M.; formal analysis, J.M.; investigation, J.M., S.M. and A.T.-A.; resources, A.T.-A.; writing—original draft preparation, J.M.; writing—review and editing, J.M., S.M. and J.L.; visualization, J.M.; supervision, J.M. and J.L.; project administration, J.L.; funding acquisition, J.L. All authors have read and agreed to the published version of the manuscript.

Funding

This research was funded by the Austrian Federal Ministry of Labour and Economy, the National Foundation for Research, Technology and Development and the Christian Doppler Research Association. Open Access Funding by TU Wien Bibliothek.

Data Availability Statement

The original contributions presented in this study are included in the article/Supplementary Material. Further inquiries can be directed to the corresponding author.

Acknowledgments

The financial support by the Austrian Federal Ministry of Labour and Economy, the National Foundation for Research, Technology and Development and the Christian Doppler Research Association is gratefully acknowledged. Furthermore, we thankfully acknowledge the financial and non-financial support of our company partners, which are, in alphabetical order: Abfallbehandlung Ahrental GmbH, Altstoff Recycling Austria AG, Brantner Österreich GmbH, Holding Graz Kommunale Dienstleistungen GmbH, Lenzing Aktiengesellschaft, Linz Service GmbH, MM Board & Paper, Wien Energie GmbH, and Wopfinger Transportbeton Ges.m.b.H. In addition, we thank Magistratsabteilung MA 48, the public Waste Management provider of Vienna, for its non-financial support, Binder + Co., Ltd. AG for their experimental support and all student assistants involved for their hard work and persevering hand sorting. The TU Wien Bibliothek is thanked for financial support through its Open Access Funding Program.

Conflicts of Interest

The authors declare no conflicts of interest. The funders had no role in the design of the study; in the collection, analyses, or interpretation of data; in the writing of the manuscript; or in the decision to publish the results.

Abbreviations

The following abbreviations are used in this manuscript:
CSPCeramic, stones, porcelain and other non-glass mineral-based extraneous material
EUEuropean Union
FB-IBAFluidized bed incineration bottom ash
IBAIncineration bottom ash
ICP-OESinductively coupled plasma optical emission spectrometry
MSWMunicipal solid waste
MSWIMunicipal solid waste incineration
UVUltraviolet
VISVisible (spectrum)
XRFX-ray fluorescence

References

  1. Scalet, B.M.; Garcia Munoz, M.; Sissa, A.Q.; Roudier, S.; Delgado Sancho, L. Best Available Techniques (BAT) Reference Document for The Manufacture of Glass: Industrial Emissions Directive 2010/75/EU Integrated Pollution Prevention and Control. EUR 25786 EN, Luxemburg. 2013. Available online: https://eippcb.jrc.ec.europa.eu/sites/default/files/2019-11/GLS_Adopted_03_2012_0.pdf (accessed on 14 January 2022).
  2. Larsen, A.W.; Merrild, H.; Christensen, T.H. Recycling of glass: Accounting of greenhouse gases and global warming contributions. Waste Manag. Res. 2009, 27, 754–762. [Google Scholar] [CrossRef] [PubMed]
  3. Testa, M.; Malandrino, O.; Sessa, M.; Supino, S.; Sica, D. Long-Term Sustainability from the Perspective of Cullet Recycling in the Container Glass Industry: Evidence from Italy. Sustainability 2017, 9, 1752. [Google Scholar] [CrossRef]
  4. Dhir, R.K.; de Brito, J.; Ghataora, G.S.; Lye, C.Q. Sustainable Construction Materials: Glass Cullet; Woodhead Publishing: Duxford, UK, 2018; ISBN 978-0-08-100984-0. [Google Scholar]
  5. Dyer, T.D. Glass. In Handbook of Recycling; Elsevier: Amsterdam, The Netherlands, 2024; pp. 445–461. ISBN 9780323855143. [Google Scholar]
  6. Abdel Alim, D.; El-Haggar, S.M. Innovation in the Glass Industry: Upcycle of Glass Waste: Foam Glass. In Sustainability and Innovation; El-Haggar, S.M., Anderson, L., Eds.; American University in Cairo Press: Cairo, Egypt, 2016; pp. 171–228. ISBN 9789774166471. [Google Scholar]
  7. Arulrajah, A.; Disfani, M.M.; Maghoolpilehrood, F.; Horpibulsuk, S.; Udonchai, A.; Imteaz, M.; Du, Y.-J. Engineering and environmental properties of foamed recycled glass as a lightweight engineering material. J. Clean. Prod. 2015, 94, 369–375. [Google Scholar] [CrossRef]
  8. da Costa, F.P.; da Silva Morais, C.R.; Rodrigues, A.M. Sustainable glass-ceramic foams manufactured from waste glass bottles and bentonite. Ceram. Int. 2020, 46, 17957–17961. [Google Scholar] [CrossRef]
  9. Mohajerani, A.; Vajna, J.; Cheung, T.H.H.; Kurmus, H.; Arulrajah, A.; Horpibulsuk, S. Practical recycling applications of crushed waste glass in construction materials: A review. Constr. Build. Mater. 2017, 156, 443–467. [Google Scholar] [CrossRef]
  10. Kazmi, D.; Williams, D.J.; Serati, M. Waste glass in civil engineering applications—A review. Int. J. Appl. Ceram. Technol. 2020, 17, 529–554. [Google Scholar] [CrossRef]
  11. Dong, W.; Li, W.; Tao, Z. A comprehensive review on performance of cementitious and geopolymeric concretes with recycled waste glass as powder, sand or cullet. Resour. Conserv. Recycl. 2021, 172, 105664. [Google Scholar] [CrossRef]
  12. Jani, Y.; Hogland, W. Waste glass in the production of cement and concrete—A review. J. Environ. Chem. Eng. 2014, 2, 1767–1775. [Google Scholar] [CrossRef]
  13. Disfani, M.M.; Arulrajah, A.; Bo, M.W.; Sivakugan, N. Environmental risks of using recycled crushed glass in road applications. J. Clean. Prod. 2012, 20, 170–179. [Google Scholar] [CrossRef]
  14. Delbari, S.A.; Hof, L.A. Glass waste circular economy—Advancing to high-value glass sheets recovery using industry 4.0 and 5.0 technologies. J. Clean. Prod. 2024, 462, 142629. [Google Scholar] [CrossRef]
  15. Vinci, G.; D’Ascenzo, F.; Esposito, A.; Musarra, M.; Rapa, M.; Rocchi, A. A sustainable innovation in the Italian glass production: LCA and Eco-Care matrix evaluation. J. Clean. Prod. 2019, 223, 587–595. [Google Scholar] [CrossRef]
  16. Gallucci, T.; Lagioia, G.; Piccinno, P.; Lacalamita, A.; Pontrandolfo, A.; Paiano, A. Environmental performance scenarios in the production of hollow glass containers for food packaging: An LCA approach. Int. J. Life Cycle Assess. 2021, 26, 785–798. [Google Scholar] [CrossRef]
  17. Adekomaya, O.; Majozi, T. Mitigating environmental impact of waste glass materials: Review of the existing reclamation options and future outlook. Environ. Sci. Pollut. Res. Int. 2021, 28, 10488–10502. [Google Scholar] [CrossRef]
  18. Bundesverband Glasindustrie e.V.; BDE Bundesverband der Deutschen Entsorgungs-, Wasser- und Rohstoffwirtschaft e.V.; bvse-Bundesverband Sekundärrohstoffe und Entsorgung e.V. Leitlinie Qualitätsanforderungen an Glasscherben zum Einsatz in der Behälterglasindustrie: Standardblatt T 120 [Guideline Quality Requirements for Glass Cullet for the Use in the Packaging Glass Industry, 2014]. Available online: https://ec.europa.eu/eurostat/cache/metadata/en/cei_wm020_esmsip2.htm (accessed on 2 December 2024).
  19. Bristogianni, T.; Oikonomopoulou, F. Glass up-casting: A review on the current challenges in glass recycling and a novel approach for recycling “as-is” glass waste into volumetric glass components. Glass Struct. Eng. 2023, 8, 255–302. [Google Scholar] [CrossRef]
  20. Maier, G.; Gruna, R.; Längle, T.; Beyerer, J. A Survey of the State of the Art in Sensor-Based Sorting Technology and Research. IEEE Access 2024, 12, 6473–6493. [Google Scholar] [CrossRef]
  21. Gundupalli, S.P.; Hait, S.; Thakur, A. A review on automated sorting of source-separated municipal solid waste for recycling. Waste Manag. 2017, 60, 56–74. [Google Scholar] [CrossRef]
  22. Geueke, B.; Groh, K.; Muncke, J. Food packaging in the circular economy: Overview of chemical safety aspects for commonly used materials. J. Clean. Prod. 2018, 193, 491–505. [Google Scholar] [CrossRef]
  23. Barbato, P.M.; Olsson, E.; Rigamonti, L. Quality degradation in glass recycling: Substitutability model proposal. Waste Manag. 2024, 182, 124–131. [Google Scholar] [CrossRef]
  24. European Parliament and Council. Directive (EU) 2018/of the European Parliament and of the Council of 30 May 2018 Amending Directive 94/62/EC on Packaging and Packaging Waste, 14pp. Available online: https://eur-lex.europa.eu/legal-content/EN/TXT/PDF/?uri=CELEX:32018L0852 (accessed on 2 December 2024).
  25. Eurostat. Recycling Rate of Packaging Waste by Type of Packaging. 2023. Available online: https://ec.europa.eu/eurostat/cache/metadata/en/cei_wm020_esmsip2.htm (accessed on 2 December 2024).
  26. Close the Glass Loop. Container Glass Collection for Recycling in Europe. 2022. Available online: https://closetheglassloop.eu/wp-content/uploads/2023/06/CGL-Map-2022-Recycling-stats-scaled.jpg (accessed on 28 August 2024).
  27. Westbroek, C.D.; Bitting, J.; Craglia, M.; Azevedo, J.M.C.; Cullen, J.M. Global material flow analysis of glass: From raw materials to end of life. J. Ind. Ecol. 2021, 25, 333–343. [Google Scholar] [CrossRef]
  28. Butler, J.H.; Hooper, P.D. Glass Waste. In Waste; Elsevier: Amsterdam, The Netherlands, 2019; pp. 307–322. ISBN 9780128150603. [Google Scholar]
  29. Majdinasab, A.; Yuan, Q. Post-consumer cullet and potential engineering applications in North America. Resour. Conserv. Recycl. 2019, 147, 1–9. [Google Scholar] [CrossRef]
  30. Cimpan, C.; Maul, A.; Jansen, M.; Pretz, T.; Wenzel, H. Central sorting and recovery of MSW recyclable materials: A review of technological state-of-the-art, cases, practice and implications for materials recycling. J. Environ. Manag. 2015, 156, 181–199. [Google Scholar] [CrossRef] [PubMed]
  31. Dias, N.; Máximo, A.; Belo, N.; Carvalho, M.T. Packaging glass contained in the heavy residual fraction refused by Portuguese Mechanical and Biological Treatment plants. Resour. Conserv. Recycl. 2014, 85, 98–105. [Google Scholar] [CrossRef]
  32. Bourtsalas, A.C.T.; Themelis, N.J. Materials and energy recovery at six European MBT plants. Waste Manag. 2022, 141, 79–91. [Google Scholar] [CrossRef]
  33. Lipp, A.-M.; Lederer, J. The circular economy of packaging waste in Austria: An evaluation based on statistical entropy and material flow analysis. Resour. Conserv. Recycl. 2025, 217, 108193. [Google Scholar] [CrossRef]
  34. Pomberger, R.; Sarc, R.; Lorber, K.E. Dynamic visualisation of municipal waste management performance in the EU using Ternary Diagram method. Waste Manag. 2017, 61, 558–571. [Google Scholar] [CrossRef]
  35. Bayuseno, A.P.; Schmahl, W.W. Understanding the chemical and mineralogical properties of the inorganic portion of MSWI bottom ash. Waste Manag. 2010, 30, 1509–1520. [Google Scholar] [CrossRef]
  36. Eusden, J.; Eighmy, T.; Hockert, K.; Holland, E.; Marsella, K. Petrogenesis of municipal solid waste combustion bottom ash. Appl. Geochem. 1999, 14, 1073–1091. [Google Scholar]
  37. Blasenbauer, D.; Huber, F.; Mühl, J.; Fellner, J.; Lederer, J. Comparing the quantity and quality of glass, metals, and minerals present in waste incineration bottom ashes from a fluidized bed and a grate incinerator. Waste Manag. 2023, 161, 142–155. [Google Scholar] [CrossRef]
  38. Vateva, I.; Laner, D. Grain-Size Specific Characterisation and Resource Potentials of Municipal Solid Waste Incineration (MSWI) Bottom Ash: A German Case Study. Resources 2020, 9, 66. [Google Scholar] [CrossRef]
  39. Huber, F.; Blasenbauer, D.; Aschenbrenner, P.; Fellner, J. Complete determination of the material composition of municipal solid waste incineration bottom ash. Waste Manag. 2020, 102, 677–685. [Google Scholar] [CrossRef]
  40. Šyc, M.; Simon, F.G.; Hykš, J.; Braga, R.; Biganzoli, L.; Costa, G.; Funari, V.; Grosso, M. Metal recovery from incineration bottom ash: State-of-the-art and recent developments. J. Hazard. Mater. 2020, 393, 122433. [Google Scholar] [CrossRef]
  41. Del Valle-Zermeño, R.; Gómez-Manrique, J.; Giro-Paloma, J.; Formosa, J.; Chimenos, J.M. Material characterization of the MSWI bottom ash as a function of particle size. Effects of glass recycling over time. Sci. Total Environ. 2017, 581–582, 897–905. [Google Scholar] [CrossRef] [PubMed]
  42. Lederer, J.; Schuch, D. The contribution of waste and bottom ash treatment to the circular economy of metal packaging: A case study from Austria. Resour. Conserv. Recycl. 2024, 203, 107461. [Google Scholar] [CrossRef]
  43. van Caneghem, J.; de Coster, E.; Vandenbergh, K.; de Broyer, S.; Lambrix, N.; Weemaels, L. Closing the household metal packaging cycle through recovery of scrap from waste-to-energy bottom ash: The case study of Flanders. Resour. Conserv. Recycl. 2019, 144, 115–122. [Google Scholar] [CrossRef]
  44. Fletcher, C.A.; Dunk, R. Recovery and utilisation of municipal solid waste incineration bottom ash: Implications for European waste management strategy. Detritus 2023, 23, 43–57. [Google Scholar] [CrossRef]
  45. Blasenbauer, D.; Huber, F.; Lederer, J.; Quina, M.J.; Blanc-Biscarat, D.; Bogush, A.; Bontempi, E.; Blondeau, J.; Chimenos, J.M.; Dahlbo, H.; et al. Legal situation and current practice of waste incineration bottom ash utilisation in Europe. Waste Manag. 2020, 102, 868–883. [Google Scholar] [CrossRef]
  46. Makari, C. Optical Sorting for the Recovery of Glass from WIP Slags: Pilot Plant in Bratislava. In Waste Management; Thomé-Kozmiensky, K.J., Thiel, S., Eds.; TK-Verl. Thomé-Kozmiensky: Neuruppin, Germany, 2014; pp. 345–354. ISBN 978-3-944310-15-2. [Google Scholar]
  47. Mühl, J.; Skutan, S.; Stockinger, G.; Blasenbauer, D.; Lederer, J. Glass recovery and production of manufactured aggregate from MSWI bottom ashes from fluidized bed and grate incineration by means of enhanced treatment. Waste Manag. 2023, 168, 321–333. [Google Scholar] [CrossRef]
  48. Mühl, J.; Hofer, S.; Blasenbauer, D.; Lederer, J. Recovery of aluminum, magnetic ferrous metals and glass through enhanced industrial-scale treatment of different MSWI bottom ashes. Waste Manag. 2024, 190, 557–568. [Google Scholar] [CrossRef]
  49. Pfandl, K.; Küppers, B.; Scheiber, S.; Stockinger, G.; Holzer, J.; Pomberger, R.; Antrekowitsch, H.; Vollprecht, D. X-ray fluorescence sorting of non-ferrous metal fractions from municipal solid waste incineration bottom ash processing depending on particle surface properties. Waste Manag. Res. 2020, 38, 111–121. [Google Scholar] [CrossRef]
  50. Gerlach, R.W.; Nocerino, J.M. Guidance for Obtaining Representative Laboratory Analytical Subsamples from Particulate Laboratory Samples. 2003. Available online: https://clu-in.org/download/char/epa_subsampling_guidance.pdf (accessed on 14 December 2022).
  51. Peukert, D.; Xu, C.; Dowd, P. A Review of Sensor-Based Sorting in Mineral Processing: The Potential Benefits of Sensor Fusion. Minerals 2022, 12, 1364. [Google Scholar] [CrossRef]
  52. Wotruba, H.; Harbeck, H. Sensor-Based Sorting. Ullmann’s Encyclopedia of Industrial Chemistry; Wiley: Hoboken, NJ, USA, 2003; ISBN 9783527303854. [Google Scholar]
  53. Brunner, P.H.; Rechberger, H. Handbook of Material Flow Analysis: For Environmental, Resource, and Waste Engineers, 2nd ed.; CRC Press Taylor & Francis Group: Boca Raton, FL, USA; London, UK; New York, NY, USA, 2017; ISBN 978-1-4987-2134-9. [Google Scholar]
  54. EN 13656:2002; Characterization of Waste—Microwave Assisted Digestion with Hydrofluoric (HF), Nitric (HNO3) and Hydrochloric (HCl) Acid Mixture for Subsequent Determination of Elements. European Committee for Standardization: Brussels, Belgium, 2022.
  55. DIN 38405-52:2020-11; German Standard Methods for the Examination of Water, Waste Water and Sludge—Anions (Group D)—Part 52: Photometric Determination of Dissolved Chromium(VI) in Water (D 52). Deutsches Institut für Normung e.V.: Berlin, Germany, 2020.
  56. Huber, R. Weiterentwicklung Optischer Sortiertechnik und Erweiterung der Einsatzmöglichkeiten in der Aufbereitung Primärer und Sekundärer Rohstoffe [Improvement of Optical Sorting Technology and Expansion of Possible Applications in the Processing of Primary and Secondary Raw Materials]. Ph.D. Thesis, Montanuniversität Leoben, Leoben, Austria, 2016. [Google Scholar]
  57. Huber, R.; Leitner, K. Method and Device for Detecting Lead-Containing Glass. Pieces. Patent No. EP20100709457 20100226, 26 February 2010. [Google Scholar]
  58. Viczek, S.A.; Aldrian, A.; Pomberger, R.; Sarc, R. Origins and carriers of Sb, As, Cd, Cl, Cr, Co, Pb, Hg, and Ni in mixed solid waste—A literature-based evaluation. Waste Manag. 2020, 103, 87–112. [Google Scholar] [CrossRef] [PubMed]
  59. Morgan, T.J.; George, A.; Boulamanti, A.K.; Álvarez, P.; Adanouj, I.; Dean, C.; Vassilev, S.V.; Baxter, D.; Andersen, L.K. Quantitative X-ray Fluorescence Analysis of Biomass (Switchgrass, Corn Stover, Eucalyptus, Beech, and Pine Wood) with a Typical Commercial Multi-Element Method on a WD-XRF Spectrometer. Energy Fuels 2015, 29, 1669–1685. [Google Scholar] [CrossRef]
  60. Götze, R.; Boldrin, A.; Scheutz, C.; Astrup, T.F. Physico-chemical characterisation of material fractions in household waste: Overview of data in literature. Waste Manag. 2016, 49, 3–14. [Google Scholar] [CrossRef] [PubMed]
  61. Turner, A. Heavy Metals in the Glass and Enamels of Consumer Container Bottles. Environ. Sci. Technol. 2019, 53, 8398–8404. [Google Scholar] [CrossRef]
  62. Mika, S.; Mühl, J.; Skutan, S.; Aschenbrenner, P.; Limbeck, A.; Lederer, J. Substance flows of heavy metals in industrial-scale municipal solid waste incineration bottom ash treatment: A case study from Austria. Waste Manag. 2025, 195, 240–252. [Google Scholar] [CrossRef]
  63. Chen, X.; Kroell, N.; Feil, A.; Greiff, K. Sensor-based sorting. In Handbook of Recycling; Elsevier: Amsterdam, The Netherlands, 2024; pp. 145–159. ISBN 9780323855143. [Google Scholar]
  64. Aldrian, A.; Pomberger, R.; Schipfer, C.; Gattermayer, K. Altglasrecycling—Anteil an Störstoffen im Altglas in Österreich. [Waste glass recycling—share of impurities in waste glass in Austria]. In POSTER-Konferenzband zur 14. Recy & DepoTech-Konferenz; Pomberger, R., Adam, J., Aldrian, A., Curtis, A., Friedrich, K., Kranzinger, L., Küppers, B.E., Eds.; Recy & DepoTech, Leoben, 07–09.11.2018; Abfallverwertungstechnik & Abfallwirtschaft Eigenverlag: Leoben, Austria, 2018; pp. 193–198. ISBN 978-3-200-05858-3. [Google Scholar]
  65. Beigl, P. Auswertung der Restmüllzusammensetzung in Österreich 2018/2019: Ergebnisbericht [Evaluation of the Residual Waste Composition in Austria 2018/2019, Wien]. 2020. Available online: https://www.bmk.gv.at/dam/jcr:c034808f-c67d-4eab-b2a3-30a6bcd6d0eb/Restmuell-Zusammensetzung-2018-19.pdf (accessed on 7 June 2022).
  66. Blengini, G.A.; Busto, M.; Fantoni, M.; Fino, D. Eco-efficient waste glass recycling: Integrated waste management and green product development through LCA. Waste Manag. 2012, 32, 1000–1008. [Google Scholar] [CrossRef] [PubMed]
  67. Humbert, S.; Rossi, V.; Margni, M.; Jolliet, O.; Loerincik, Y. Life cycle assessment of two baby food packaging alternatives: Glass jars vs. plastic pots. Int. J. Life Cycle Assess. 2009, 14, 95–106. [Google Scholar] [CrossRef]
  68. Deschamps, J.; Simon, B.; Tagnit-Hamou, A.; Amor, B. Is open-loop recycling the lowest preference in a circular economy? Answering through LCA of glass powder in concrete. J. Clean. Prod. 2018, 185, 14–22. [Google Scholar] [CrossRef]
  69. Haupt, M.; Kägi, T.; Hellweg, S. Modular life cycle assessment of municipal solid waste management. Waste Manag. 2018, 79, 815–827. [Google Scholar] [CrossRef]
  70. Meylan, G.; Ami, H.; Spoerri, A. Transitions of municipal solid waste management. Part II: Hybrid life cycle assessment of Swiss glass-packaging disposal. Resour. Conserv. Recycl. 2014, 86, 16–27. [Google Scholar] [CrossRef]
  71. Costa, G.; Polettini, A.; Pomi, R.; Spagnuolo, R. Enhanced Separation of Incinerator Bottom Ash: Composition and Environmental Behaviour of Separated Mineral and Weakly Magnetic Fractions. Waste Biomass Valorization 2020, 11, 7079–7095. [Google Scholar] [CrossRef]
  72. Beikmohammadi, M.; Yaghmaeian, K.; Nabizadeh, R.; Mahvi, A.H. Analysis of heavy metal, rare, precious, and metallic element content in bottom ash from municipal solid waste incineration in Tehran based on particle size. Sci. Rep. 2023, 13, 16044. [Google Scholar] [CrossRef] [PubMed]
  73. Bunge, R.; Bunge, K. Probenahme auf Altlasten: Minimal notwendige Probenmasse. Altlasten Spektrum 1999, 1999, 174–179. [Google Scholar]
  74. European Environment Agency. Many EU Member States Not on Track to Meet Recycling Targets for Municipal Waste and Packaging Waste: Briefing no. 28/2022. 2023. Available online: https://www.eea.europa.eu/publications/many-eu-member-states (accessed on 11 December 2024).
  75. Chimenos, J.; Segarra, M.; Fernández, M.; Espiell, F. Characterization of the bottom ash in municipal solid waste incinerator. J. Hazard. Mater. 1999, 64, 211–222. [Google Scholar] [CrossRef]
Figure 1. Representation of the experimental setup. A detailed description of the IBA treatment can be found in Mühl et al. [48]. FB-IBA: Fluidized bed incineration bottom ash.
Recycling 10 00063 g001
Figure 2. Results of upgrading setup US_I–IV: Material flows of FB-IBA B (above) and FB-IBA C (below) per 1 ton of glass fraction as input material.
Recycling 10 00063 g002
Figure 3. Results of upgrading setup US_8–16: Material flows of FB-IBA B (above) and FB-IBA C (below) per 1 ton of glass fraction as input material.
Recycling 10 00063 g003
Figure 4. Compositions of glass fractions. Glass from fluidized bed incineration bottom ash (FB-IBA) B (above), from FB-IBA C (below). Other glass includes glass of other colors, molten agglomerates, or highly tarnished glass. CSP: non-glass mineral-based extraneous material (e.g., ceramic, stones, porcelain, building material).
Recycling 10 00063 g004
Figure 5. Pb concentrations in different fractions.
Recycling 10 00063 g005
Figure 6. Pb concentrations in fractions determined by XRF analysis and calculation from manually sorted lead glass using a UV-C lamp.
Recycling 10 00063 g006
Figure 7. Masses of the components in 1 ton of input glass fraction (GL 0) and in the upgrading of 1 ton of material. Left side: glass from fluidized bed incineration bottom ash (FB-IBA) B, right side: from FB-IBA C. Other glass includes glass of other colors, molten agglomerates, or highly tarnished glass. CSP: non-glass mineral-based extraneous material (e.g., ceramic, stones, porcelain, building material).
Recycling 10 00063 g007
Disclaimer/Publisher’s Note: The statements, opinions and data contained in all publications are solely those of the individual author(s) and contributor(s) and not of MDPI and/or the editor(s). MDPI and/or the editor(s) disclaim responsibility for any injury to people or property resulting from any ideas, methods, instructions or products referred to in the content.

