
Quantification of Plastics in Agriculture and Fisheries at a Regional Scale: A Case Study of South West England

 ,
,
Abstract
:1. Introduction
2. Method
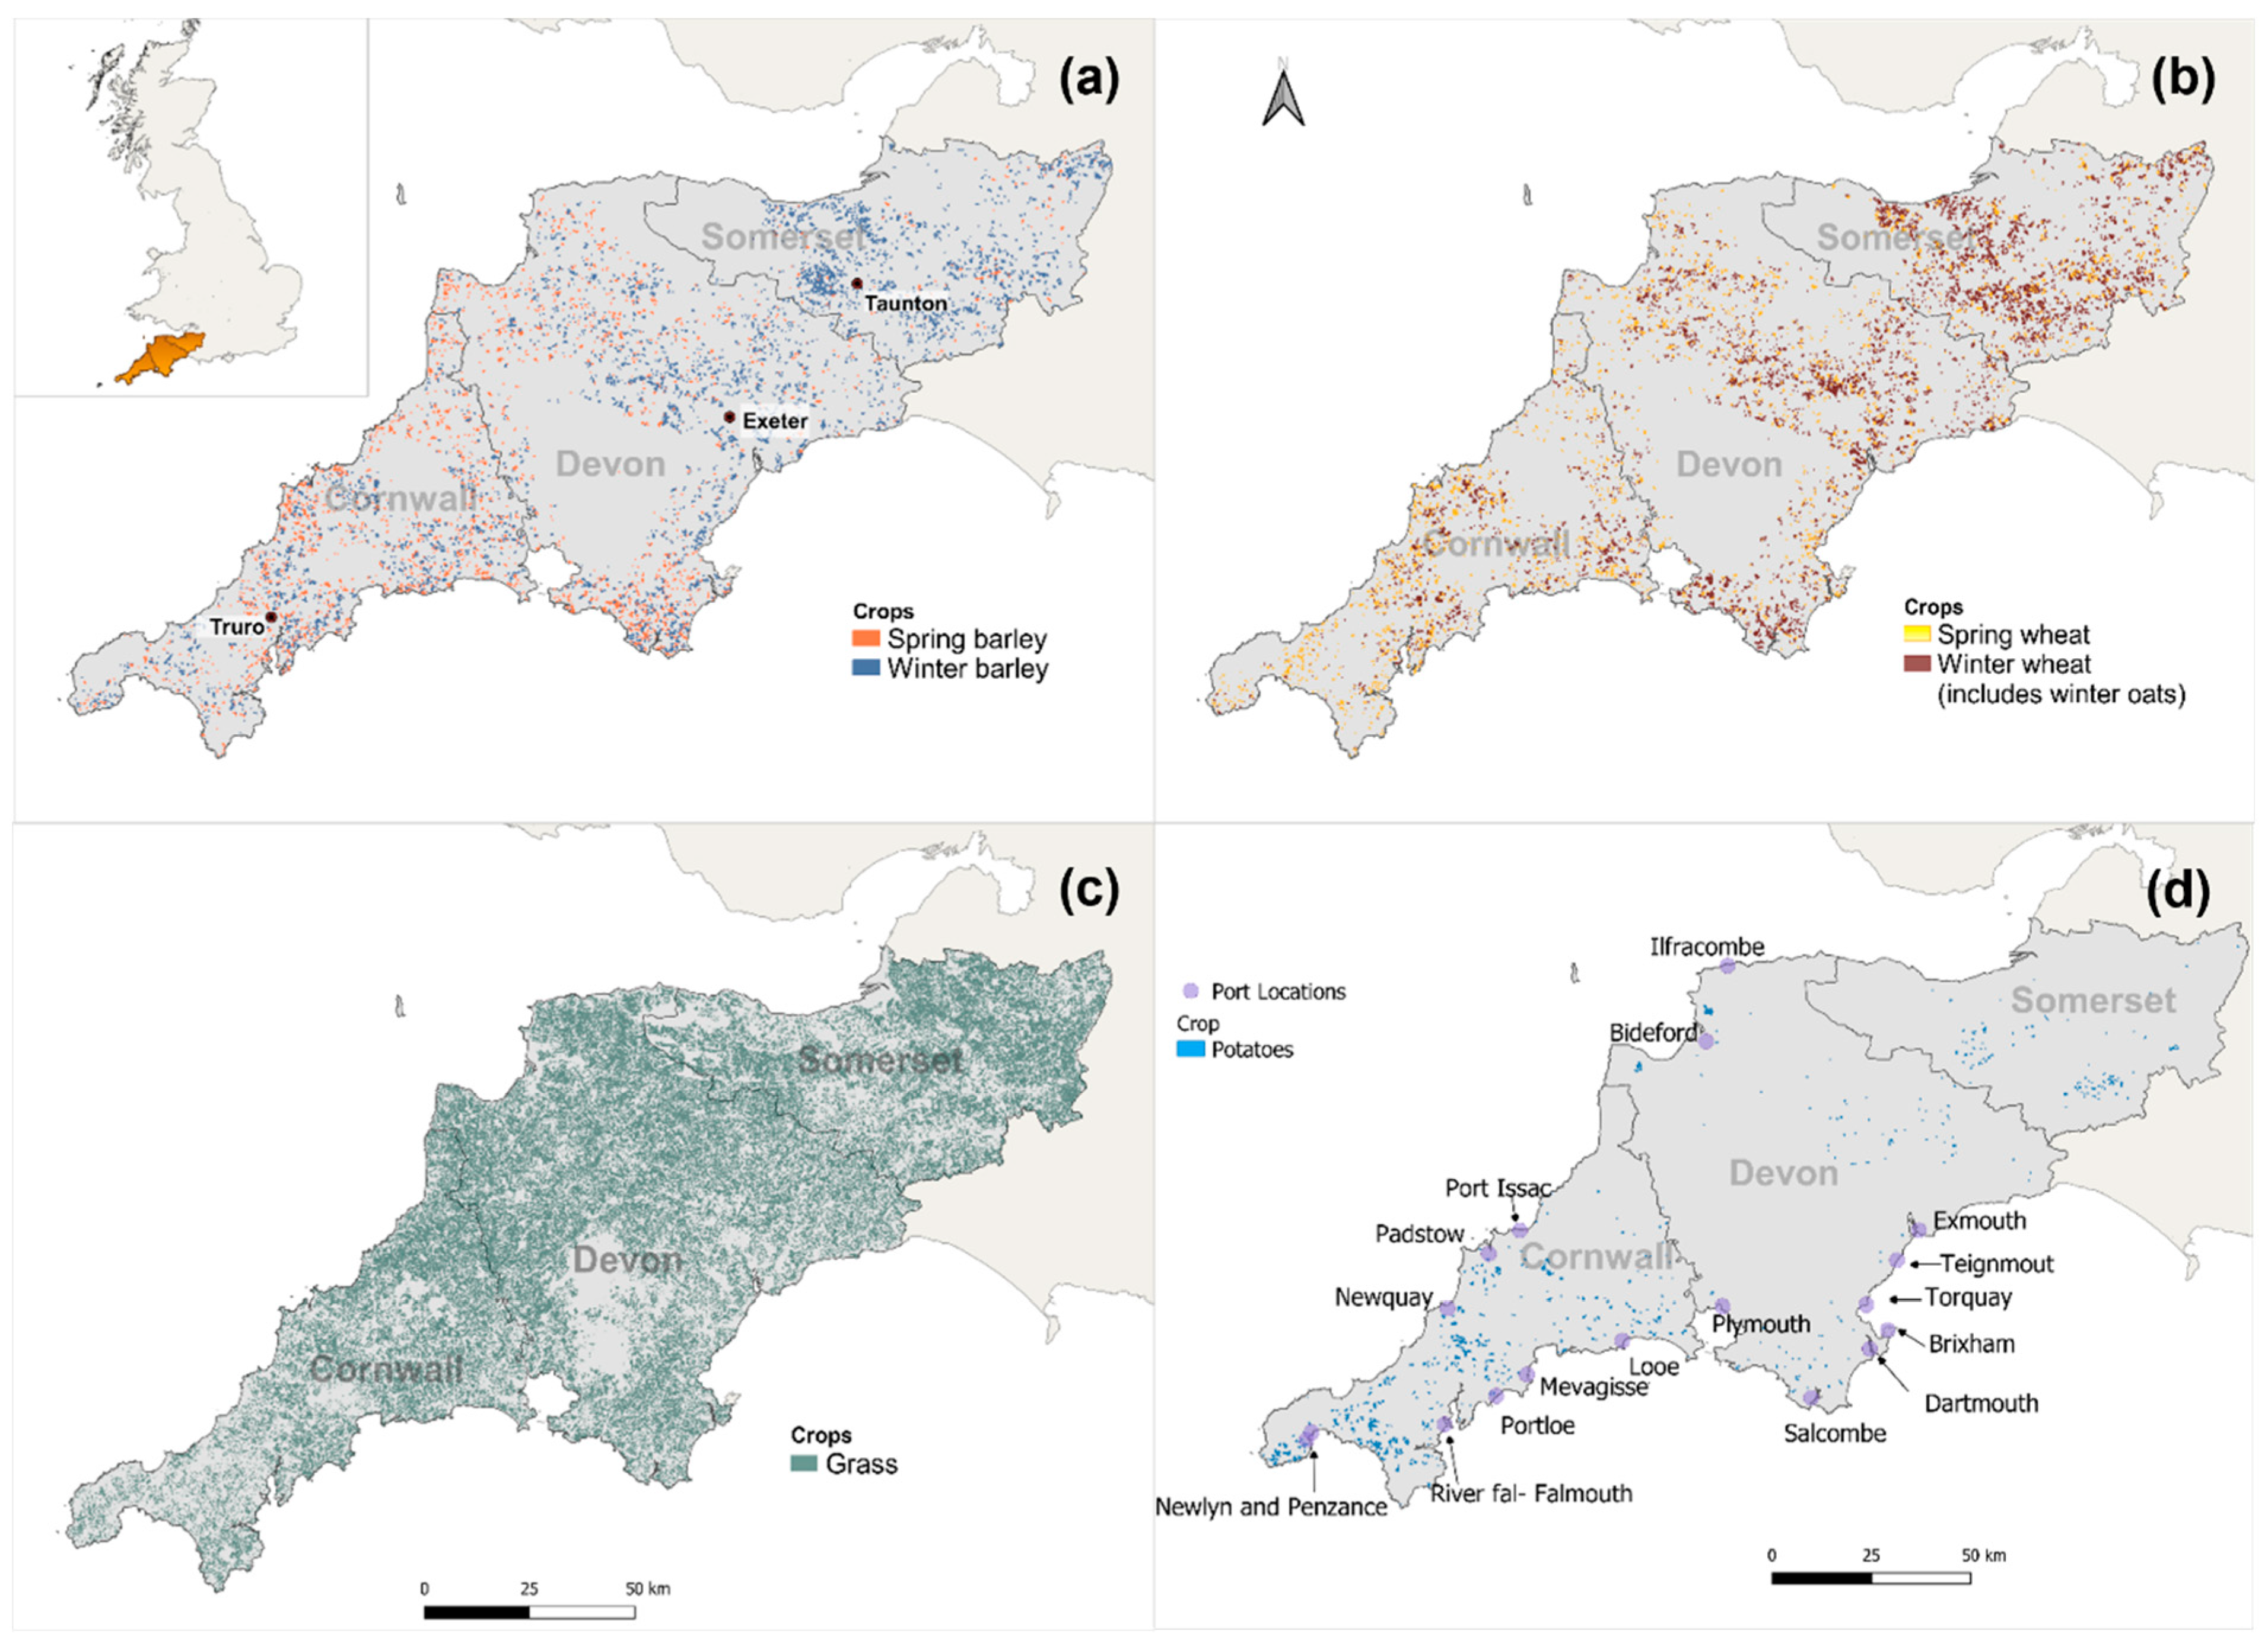
2.1. Study Area
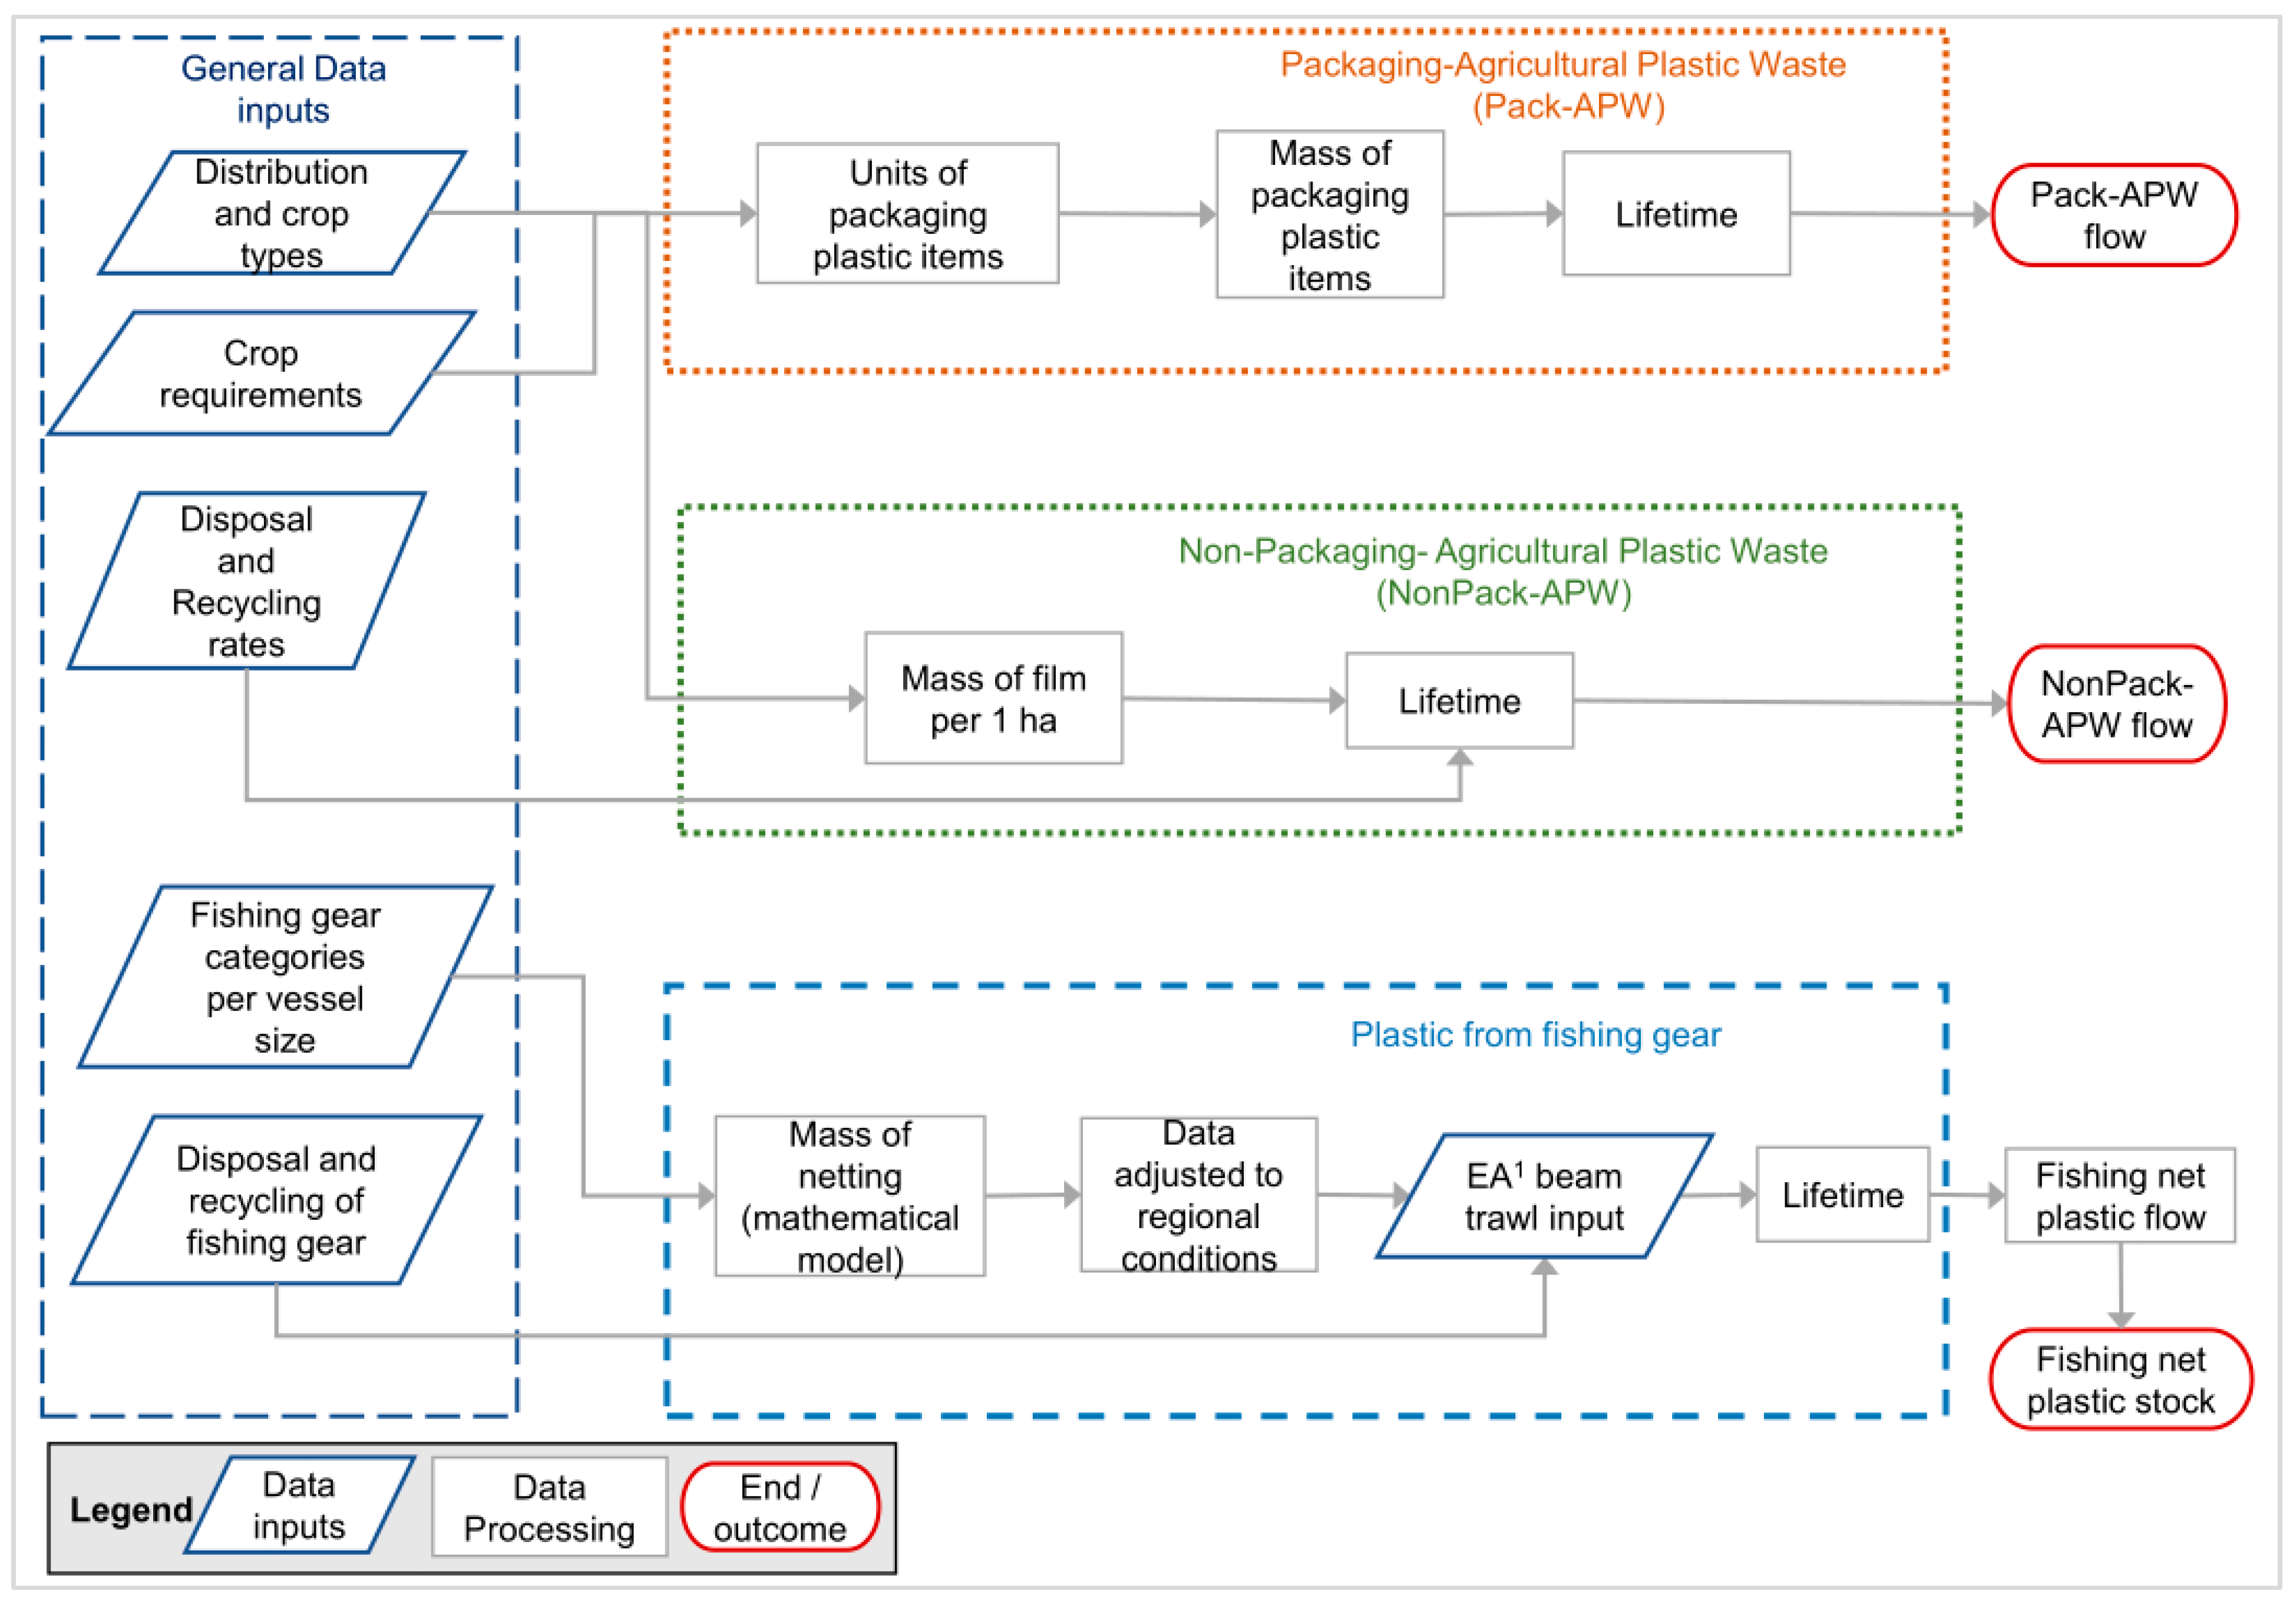
2.2. Data Sources of Plastic Waste
2.3. Agriculture
2.3.1. Crop Selection in the South West
2.3.2. Packaging Agricultural Plastic Waste (Pack-APW)
2.3.3. Non-Packaging Agricultural Plastic Waste (NonPack-APW)
2.3.4. End-of-Life Pathways
2.4. Fishing Nets
2.4.1. Port Location, Vessel Sizes and Fishing Gear Categories
2.4.2. Harbour Masters and Fleet Managers Survey
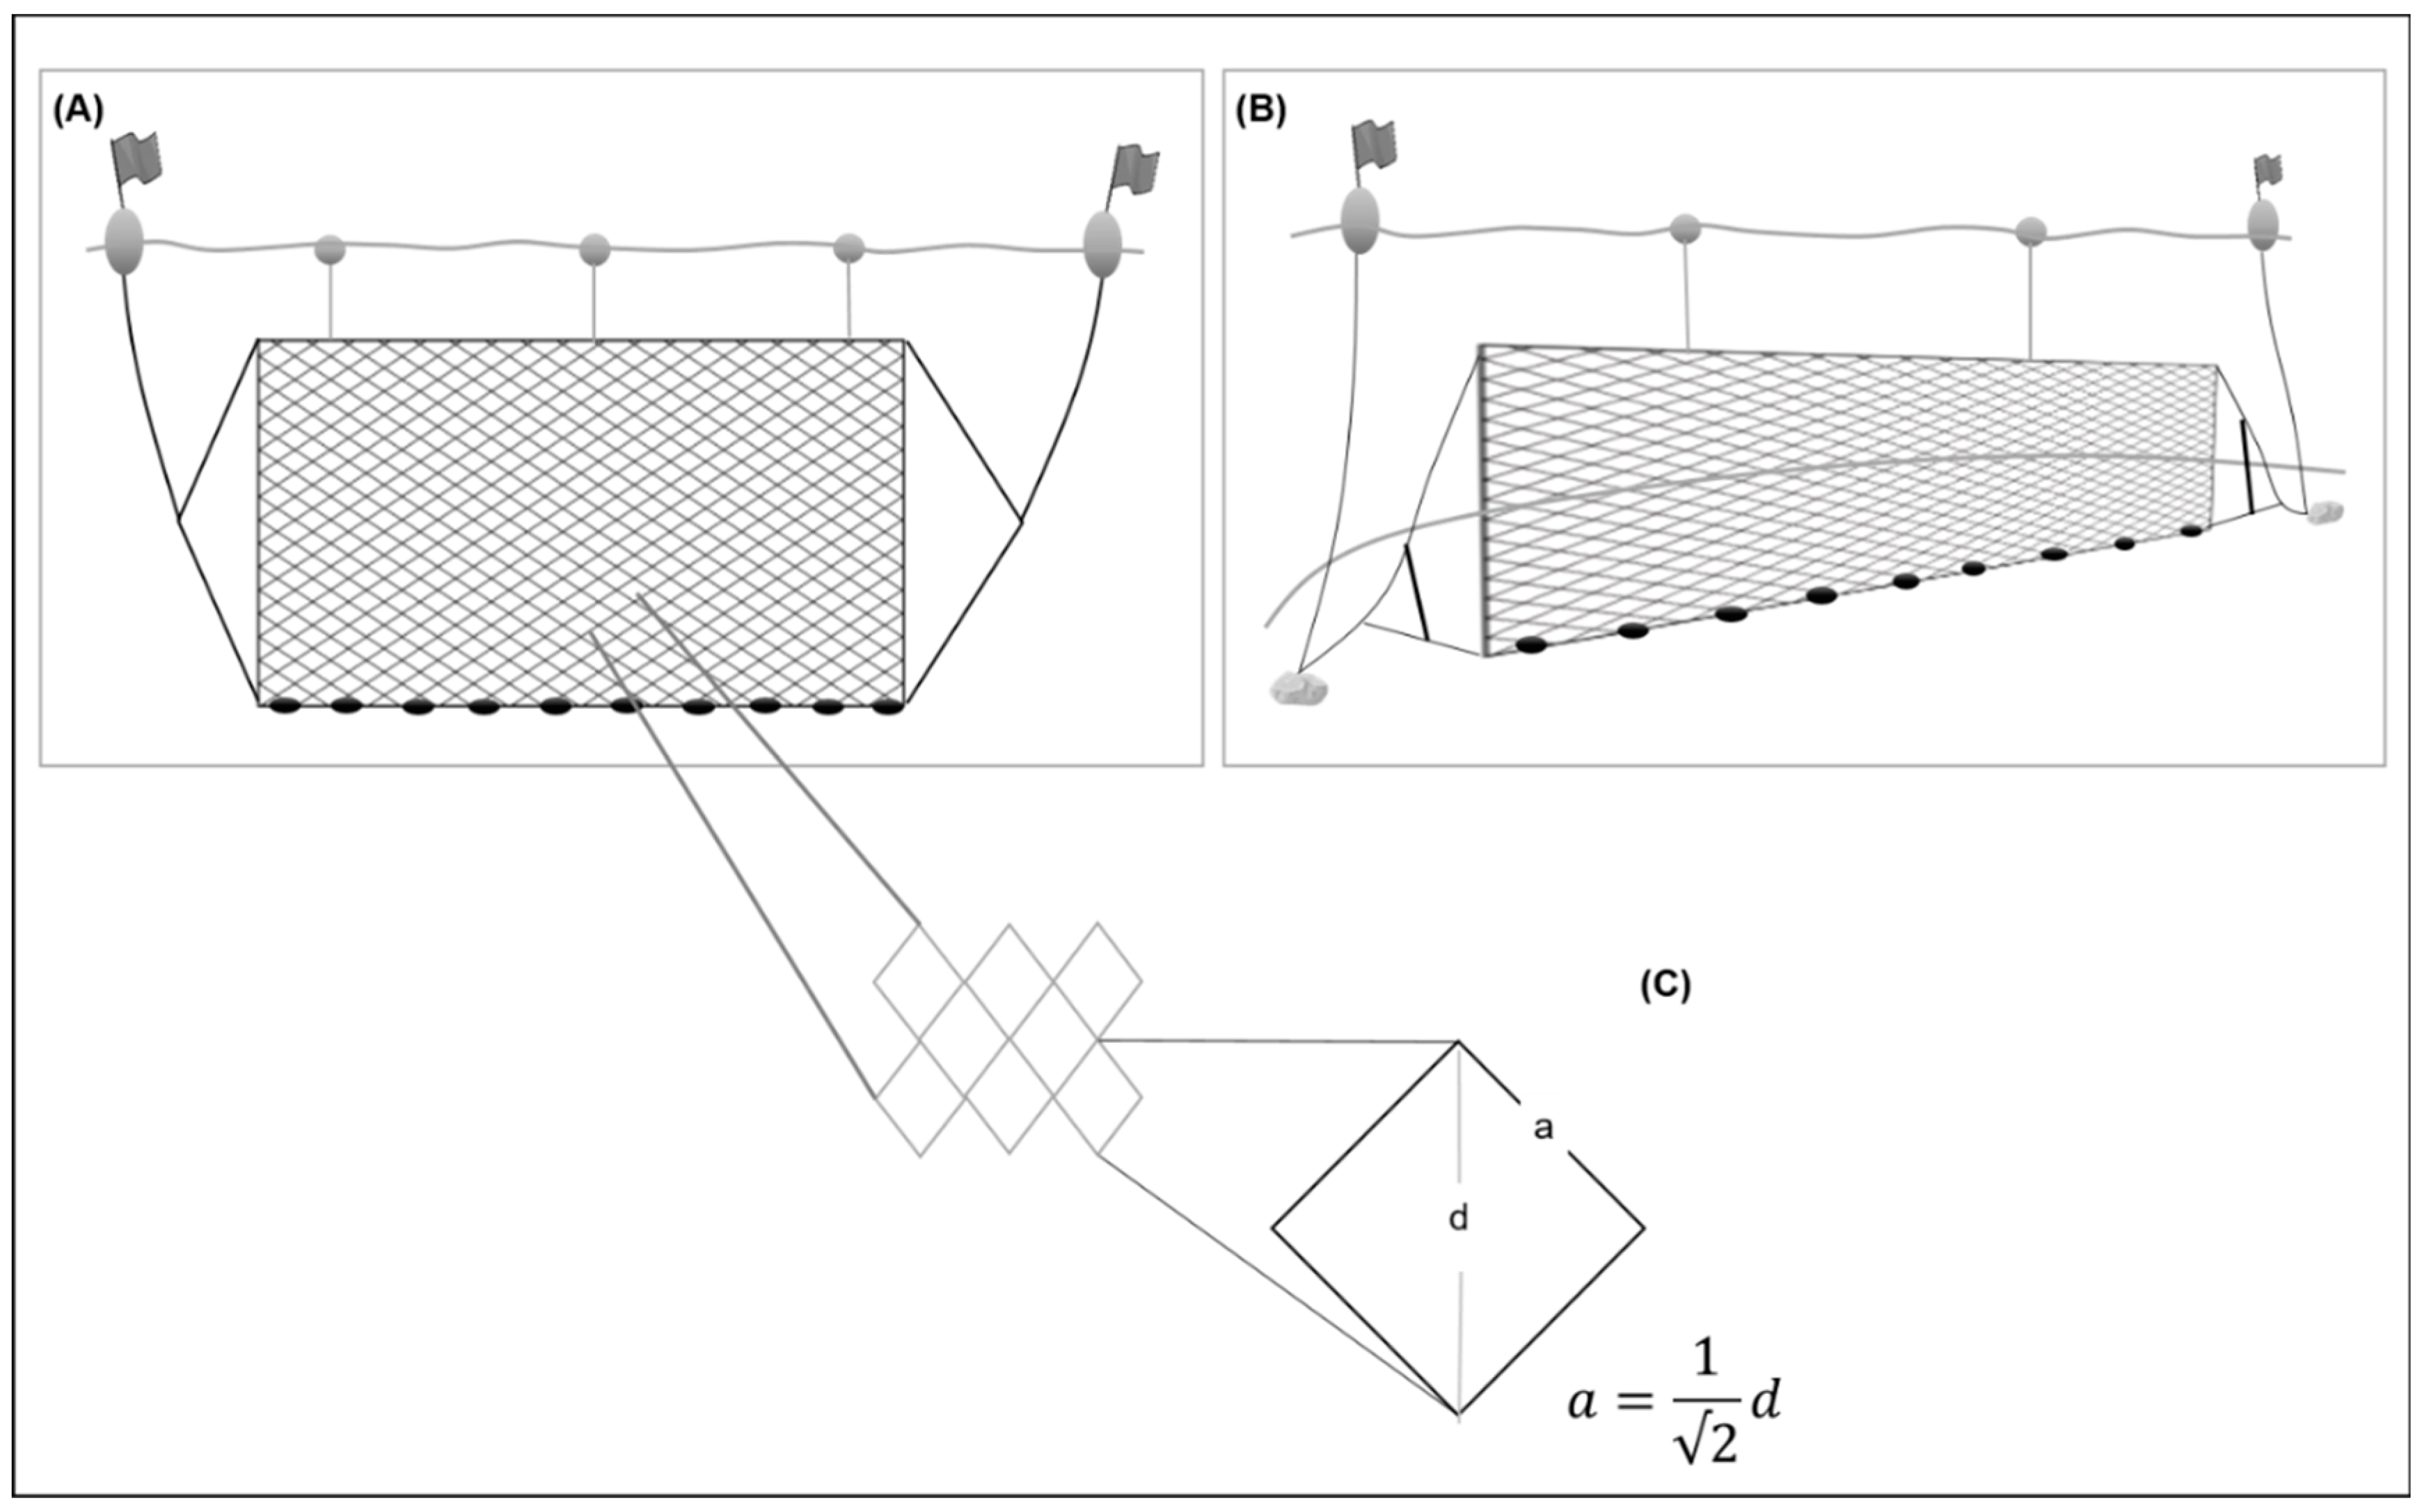
2.4.3. Mathematical Model for a Net
2.4.4. Fisheries Plastic Flow and Stock
2.5. Comparison with Other Published Data
3. Results
3.1. Agricultural Plastic Waste
3.2. Fisheries Plastic Waste
Disposal of Waste from Fisheries According to Surveys
4. Discussion
5. Limitations
6. Conclusions
Supplementary Materials
Author Contributions
Funding
Data Availability Statement
Conflicts of Interest
References
- United Nations. Department of Economic and Social Affairs. Available online: https://www.un.org/development/desa/en/news/population/world-population-prospects-2019.html (accessed on 13 May 2021).
- Fukase, E.; Martin, W. Economic growth, convergence, and world food demand and supply. World Dev. 2020, 132, 104954. [Google Scholar] [CrossRef]
- FAO. How to Feed the World in 2050; FAO: Rome, Italy, 2009; ISBN 978-92-5-106363-7. [Google Scholar]
- FAO. The Future of Food and Agriculture—Trends and Challenges; FAO: Rome, Italy, 2017; ISBN 978-92-5-109551-5. [Google Scholar]
- OECD. Food and Agriculture; OECD Green Growth Studies; OECD Publishing: Paris, France, 2011. [Google Scholar]
- Troell, M.; Naylor, R.L.; Metian, M.; Beveridge, M.; Tyedmers, P.H.; Folke, C.; Arrow, K.J.; Barrett, S.; Crépin, A.S.; Ehrlich, P.R.; et al. Does aquaculture add resilience to the global food system? Proc. Natl. Acad. Sci. USA 2014, 111, 13257–13263. [Google Scholar] [CrossRef] [PubMed]
- European Environment Agency (EEA). 2018. Available online: https://www.eea.europa.eu/airs/2018/resource-efficiency-and-low-carbon-economy/waste-generation (accessed on 20 May 2021).
- Orzolek, M. A Guide to the Manufacture, Performance, and Potential of Plastics in Agriculture; William Andrew Applied Science Publishers, Elsevier: Chippenham, UK, 2017; p. 207. [Google Scholar]
- Scarascia-Mugnozza, G.; Sica, C.; Russo, G. Plastic materials in European agriculture: Actual use and perspectives. J. Agric. Eng. 2011, 42, 15–28. [Google Scholar] [CrossRef]
- Valpak & WRAP. Plastic Spatial Flow. An Assessment of the Quantity of Un-Recycled Plastic in the UK. 2016. Available online: www.wrap.org.uk (accessed on 27 June 2021).
- Consumption and Generation. Published by Ian Tiseo. 27 August 2020. Available online: www.statista.com (accessed on 24 May 2021).
- Construction Magazine. Project News. Available online: https://constructionmaguk.co.uk/can-the-uks-construction-industry-lessen-its-plastic-usage/ (accessed on 15 July 2019).
- Briassoulis, D.; Babou, E.; Hiskakis, M.; Scarascia, G.; Picuno, P.; Guarde, D.; Dejean, C. Review, mapping and analysis of the agricultural plastic waste generation and consolidation in Europe. Waste Manag. Res. 2013, 31, 1262–1278. [Google Scholar] [CrossRef] [PubMed]
- Proceeding of the 15th Annual Meeting of the International Commission for the Northwest Atlantic Fisheries. -Netting Twines for Trawls. 1965. Serial No. 1531. Research Document No. 63. Available online: https://www.nafo.int (accessed on 16 September 2019).
- Kim, S.; Kim, P.; Lim, J.; An, H.; Suuronen, P. Use of biodegradable driftnets to prevent ghost fishing: Physical properties and fishing performance for yellow croaker. Anim. Conserv. 2016, 19, 309–319. [Google Scholar] [CrossRef]
- Lebreton, L.; Slat, B.; Ferrari, F.; Sainte-Rose, B.; Aitken, J.; Marthouse, R.; Hajbane, S.; Cunsolo, S.; Schwarz, A.; Levivier, A.; et al. Evidence that the Great Pacific Garbage Patch is rapidly accumulating plastic. Sci. Rep. 2018, 8, 4666. [Google Scholar] [CrossRef] [PubMed]
- Environment Agency and Biffaward. Towards Sustainable Agricultural Waste Management; Environment Agency: Bristol, UK, 2001; p. 106. [Google Scholar]
- Duque-Acevedo, M.; Belmonte-Ureña, L.J.; Cortés-García, F.J.; Camacho-Ferre, F. Agricultural waste: Review of the evolution, approaches and perspectives on alternative uses. Glob. Ecol. Conserv. 2020, 22, e00902. [Google Scholar] [CrossRef]
- Hiskakis, M.; Briassoulis, D.; Babou, E.; Liantzas, K. Agricultural Plastic Waste Mapping in Greece. Acta Hortic. 2008, 801, 351–358. [Google Scholar] [CrossRef]
- Loisi, R.V.; Sica, C.; Blanco, I.; Schettini, E.; Scarascia-Mugnozza, G.; Vox, G. Land analysis of agricultural plastic waste production in a South Italy area by means of a geographical information system. In International Symposium on New Technologies and Management for Greenhouses-GreenSys2015-1170; International Society for Horticultural Science: Korbeek-Lo, Belgium, 2015; pp. 579–586. [Google Scholar]
- Jiménez-Lao, R.; Aguilar, F.J.; Nemmaoui, A.; Aguilar, M.A. Remote sensing of agricultural greenhouses and plastic-mulched farmland: An analysis of worldwide research. Remote Sens. 2020, 12, 2649. [Google Scholar] [CrossRef]
- Bonifazi, G.; Francesconi, E.; Gasbarrone, R.; Palmieri, R.; Serranti, S.A. Preliminary Study on the Utilization of Hyperspectral Imaging for the On-Soil Recognition of Plastic Waste Resulting from Agricultural Activities. Land 2023, 12, 1934. [Google Scholar] [CrossRef]
- Matsumura, S.; Nasu, K. Distribution of floating debris in the North Pacific Ocean: Sighting surveys 1986–1991. In Marine Debris: Sources, Impacts, and Solutions; Springer: New York, NY, USA, 1997; pp. 15–24. [Google Scholar]
- Eriksen, M.; Lebreton, L.C.; Carson, H.S.; Thiel, M.; Moore, C.J.; Borerro, J.C.; Galgani, F.; Ryan, P.G.; Reisser, J. Plastic pollution in the world’s oceans: More than 5 trillion plastic pieces weighing over 250,000 tons afloat at sea. PLoS ONE 2014, 9, e111913. [Google Scholar] [CrossRef] [PubMed]
- OSPAR Commission. 2018. Available online: https://oap.ospar.org/en/ospar-assessments/committee-assessments/eiha-thematic-assessments/marine-litter/beach-litter-monitoring/ (accessed on 22 August 2019).
- Galgani, F.; Hanke, G.; Maes, T. Global distribution, composition and abundance of marine litter. In Marine Anthropogenic Litter, 1st ed.; Bergmann, M., Klages, M., Gutow, L., Eds.; Alfred-Wegener-Institut Helmholtz-Zentrum für Polar- und Meeresforschung: Bremerhaven, Germany, 2015; pp. 29–56. [Google Scholar]
- Unger, A.; Harrison, N. Fisheries as a source of marine debris on beaches in the United Kingdom. Mar. Pollut. Bull. 2016, 107, 52–58. [Google Scholar] [CrossRef] [PubMed]
- Horsman, P.V. The amount of garbage pollution from merchant ships. Mar. Pollut. Bull. 1982, 13, 167–169. [Google Scholar] [CrossRef]
- Macfadyen, G.; Huntington, T.; Cappell, R. Abandoned, Lost or Otherwise Discarded Fishing Gear; UNEP Regional Seas Reports and Studies, No. 185; FAO Fisheries and Aquaculture Technical Paper, No. 523; UNEP/FAO: Rome, Italy, 2009; 115p. [Google Scholar]
- Richardson, K.; Haynes, D.; Talouli, A.; Donoghue, M. Marine pollution originating from purse seine and longline fishing vessel operations in the Western and Central Pacific Ocean, 2003–2015. Ambio 2017, 46, 190–200. [Google Scholar] [CrossRef] [PubMed]
- Deshpande, P.C.; Philis, G.; Brattebø, H.; Fet, A.M. Using Material Flow Analysis (MFA) to generate the evidence on plastic waste management from commercial fishing gears in Norway. Resour. Conserv. Recycl. X 2020, 5, 100024. [Google Scholar] [CrossRef]
- United Kingdom Environment Act. 2021. Available online: https://www.gov.uk/government/consultations/environment-act-2021-environmental-targets (accessed on 22 February 2022).
- Leaders’ Pledge for Nature. 2021. Available online: https://www.leaderspledgefornature.org/ (accessed on 22 February 2022).
- Office for National Statistics. Census. 2021. Available online: https://www.ons.gov.uk/census (accessed on 13 May 2021).
- Statista. Available online: https://www.statista.com/statistics/270372/distribution-of-gdp-across-economic-sectors-in-the-united-kingdom/ (accessed on 13 May 2021).
- Defra Statistics. Agricultural Facts. 2021. Available online: https://www.gov.uk/government/statistics/agricultural-facts-england-regional-profiles (accessed on 10 September 2022).
- Marine Management Organisation (MMO) and Office of National Statistics. UK Sea Fish Statistics, Report. 2019. Available online: https://www.gov.uk/government/statistics/uk-sea-fisheries-annual-statistics-report-2019 (accessed on 18 July 2021).
- Department for Environment, Food & Rural Affairs. National Statistics: Local Authority Collected Waste Management–Annual Results 2021–2022. April 2023. Available online: https://www.gov.uk/government/statistics/local-authority-collected-waste-management-annual-results-202122/local-authority-collected-waste-management-annual-results-202122#waste-from-households (accessed on 3 December 2023).
- Lombardi, M.; Rana, R.; Fellner, J. Material flow analysis and sustainability of the Italian plastic packaging management. J. Clean. Prod. 2021, 287, 125573. [Google Scholar] [CrossRef]
- Centre for Environment, Fisheries and Aquaculture Science, CEFAS. Catalogue of Defra Historical Catch and Effort Charts: Six Decades of Detailed Spatial Statistics for British Fisheries. Available online: http://data.cefas.co.uk/#/View/2661 (accessed on 4 November 2019).
- Centre for Environment, Fisheries and Aquaculture Science, CEFAS. North East Atlantic Seafloor Marine Litter Data 1992–2014. Available online: http://data.cefas.co.uk/#/View/3479 (accessed on 4 November 2019).
- Allesch, A.; Brunner, P.H. Material flow analysis as a tool to improve waste management systems: The case of Austria. Environ. Sci. Technol. 2017, 51, 540–551. [Google Scholar] [CrossRef] [PubMed]
- Land Cover Plus: Crops. 2018. [FileGeoDatabase Geospatial Data], Scale 1:2500, Tiles: GB, Updated: 4 December 2018, CEH, Using: EDINA Environment Digimap Service. Available online: https://digimap.edina.ac.uk (accessed on 10 September 2019).
- QGIS Development Team. 2018. QGIS Geographic Information System. Open Source Geospatial Foundation Project. Available online: http://qgis.osgeo.org (accessed on 7 October 2019).
- Agriculture and Horticulture Development Board (AHDB). Recommended List for Cereals. 2018. Available online: https://ahdb.org.uk/rl (accessed on 10 September 2019).
- Borreani, G.; Tabacco, E. Plastics in animal production. In A Guide to the Manufacture, Performance, and Potential of Plastics in Agriculture; Elsevier: Amsterdam, The Netherlands, 2017; pp. 145–185. [Google Scholar]
- The Farming Forum. Available online: https://thefarmingforum.co.uk (accessed on 6 October 2019).
- Plastics Europe. Plastics—The Facts 2020. An Analysis of European Plastics Production, Demand and Waste Data. Available online: www.plasticseurope.org (accessed on 15 July 2021).
- Department for Environment, Food and Rural Affairs (DEFRA). Farm Practices Survey 2019. Farming Statistics Department. Available online: https://www.gov.uk/government/collections/farm-practices-survey (accessed on 18 October 2019).
- Marine Management Organisation (MMO). Summary of Fleet Landings for 2017. Excel Dataset. Available online: https://www.gov.uk/government/collections/uk-sea-fisheries-annual-statistics#data (accessed on 31 October 2019).
- Environment Agency. Brixham pilot project. Jon Harvey (responsible). 2019. Data collection of a 12 m Beam Trawl in Brixham, Devon. Excel spreadsheet shared by Jon Harvey.
- Sala, A. Alternative Solutions for Driftnet Fisheries. Directorate-General for Internal Policies. Policy Department B: Structural and Cohesion Policies Fisheries. 2015. Available online: http://www.europarl.europa.eu/studies (accessed on 31 July 2023).
- Plastics and Environment. Available online: https://ape-uk.com/ (accessed on 4 March 2020).
- The Chartered Institution of Wastes Management (CIWM). Available online: https://www.ciwm.co.uk/ciwm/knowledge/agricultural-waste.aspx (accessed on 18 August 2020).
- Agricultural Waste Collection from 2004–2019. Data Requested and Acquired from Farming & Wildlife Advisory Group (FWAG) for the South West. Available online: https://www.fwagsw.org.uk/ (accessed on 30 September 2019).
- Bishop, G.; Styles, D.; Lens, P.N. Recycling of European plastic is a pathway for plastic debris in the ocean. Environ. Int. 2020, 142, 105893. [Google Scholar] [CrossRef] [PubMed]
- Sandra, L. UK under Growing Pressure to Ban All Exports of Plastic Waste. (Report) The Guardian. 2021. Available online: https://www.theguardian.com/environment/2021/may/24/uk-under-growing-pressure-to-ban-all-exports-of-plastic-waste (accessed on 24 May 2021).
- Environment Agency. 2020. Press Release. Available online: https://www.gov.uk/government/news/farmers-and-waste-companies-urged-to-check-waste-management-processes-or-face-enforcement-action (accessed on 30 November 2020).
- Annual Plastics Waste Exports. Statista. 2023. Available online: https://www.statista.com/statistics/1268923/annual-plastics-waste-exports-united-kingdom-uk/ (accessed on 31 July 2023).


| Source of Information | Total Packaging (t) for the SW | NonP-APW (t) with Contamination Considering SW Farmed Area * | Adding the 70% That Is Not Collected to External Sources (with Contamination) ** |
|---|---|---|---|
| This study | 982 | 72,286 | 72,286 |
| CIWM | 2669 | 12,948 | 22,012 |
| WRAP | NI | 4775 | 15,916 |
| EA | 1135 *** | 4678 | 15,593 |
| FWAG | 9760 | NI | NI |
| Vessel Size Category | No. of Beam Trawl Vessels | No. of Ports of Landing Beam Trawl Vessels | No. of Drift and Fixed Nets Vessels | No. of Ports of Landing Drift and Fixed Nets | Total No. of Vessels |
|---|---|---|---|---|---|
| 10 m and under | 12 | 1 | 3519 | 16 | 3531 |
| over 10 m | 2127 | 6 | 980 | 14 | 3107 |
| Total | 2139 | 4499 | 6638 |
Disclaimer/Publisher’s Note: The statements, opinions and data contained in all publications are solely those of the individual author(s) and contributor(s) and not of MDPI and/or the editor(s). MDPI and/or the editor(s) disclaim responsibility for any injury to people or property resulting from any ideas, methods, instructions or products referred to in the content. |
© 2023 by the authors. Licensee MDPI, Basel, Switzerland. This article is an open access article distributed under the terms and conditions of the Creative Commons Attribution (CC BY) license (https://creativecommons.org/licenses/by/4.0/).
Share and Cite
Correa-Cano, M.E.; Burton, K.; Mueller, M.; Kouloumpis, V.; Yan, X. Quantification of Plastics in Agriculture and Fisheries at a Regional Scale: A Case Study of South West England. Recycling 2023, 8, 99. https://doi.org/10.3390/recycling8060099
Correa-Cano ME, Burton K, Mueller M, Kouloumpis V, Yan X. Quantification of Plastics in Agriculture and Fisheries at a Regional Scale: A Case Study of South West England. Recycling. 2023; 8(6):99. https://doi.org/10.3390/recycling8060099
Chicago/Turabian StyleCorrea-Cano, Maria Eugenia, Kerry Burton, Markus Mueller, Victor Kouloumpis, and Xiaoyu Yan. 2023. "Quantification of Plastics in Agriculture and Fisheries at a Regional Scale: A Case Study of South West England" Recycling 8, no. 6: 99. https://doi.org/10.3390/recycling8060099