Abstract
This paper examines the emissions tradeoffs of additive manufacturing (i.e., 3D printing) using plastic waste in fused granular fabrication (FGF) versus traditional fused filament fabrication (FFF) and injection molding (IM). A ‘cradle-to-gate’ life cycle assessment (LCA) was utilized to compare these methods, built in OpenLCA v1.11.0 with the Ecoinvent v3.9.1 database. Different scenarios were used to evaluate the impacts of varying transportation and material inputs, highlighting critical emission contributors in manufacturing plastic goods. FGF with waste plastic can significantly reduce climate impact by 82.1% relative to FFF and 70.6% relative to IM for a specified unit product. Even with varied transportation and materials, FGF is a lower CO2-equivalent emitting method. Utilizing FGF with waste plastic as a manufacturing method could reduce emissions and divert plastic from landfills and the environment, thereby contributing to a circular plastic economy.
1. Introduction
Plastic waste is an increasingly prevalent environmental challenge, with a recycling rate of only 9% for worldwide plastic production [1]. Globally, 22% of plastic waste is mismanaged, often in the form of release into the terrestrial or marine environment, which can impact wildlife adversely and contribute to pollution [2]. In 2018, the USA alone generated more than 35 million tons of post-consumer plastic waste, with 75% going to landfills [3]. Historically, China has imported plastic waste for recycling from 43 countries, including the USA, but starting in 2018, China banned the import of non-industrial plastic waste. As a result of the new policy, an estimated 111 million tons of plastic worldwide is expected to be displaced by 2030, driving the need to develop domestic recycling solutions rapidly [4]. One novel solution is to use additive manufacturing to upcycle waste plastic mechanically.
Additive manufacturing (AM) has unique benefits compared with traditional manufacturing methods. AM enables on-demand, onsite, customized manufacturing without the extensive equipment and up-front costs required by traditional manufacturing [5]. Consequently, AM solutions are deployable quickly and are especially well-suited for lower production runs. Furthermore, the distributed nature of consumer plastic waste creates logistical collection challenges [6], making additive manufacturing a potentially promising solution for upcycling plastic waste closer to the location at which it is produced, reducing transportation and storage costs.
Material extrusion additive manufacturing lends itself to distributed, closed-loop manufacturing—a circular process in which waste by-products and end products can be feasibly recycled back into the process to create new products—of polymer-based products, reducing the need for centralized mass manufacturing. In addition, distributed material-extrusion AM of polymer products can reduce energy demand by 41–64% compared with conventional manufacturing in some cases [7]. Furthermore, like other AM processes, material extrusion builds parts by layering material rather than removing or machining; thus, it is capable of building more complex and customizable parts. Specifically, complex internal and external architectures can be designed to enhance functionality without requiring multiple materials or components, thereby easing recycling at the end of products’ life.
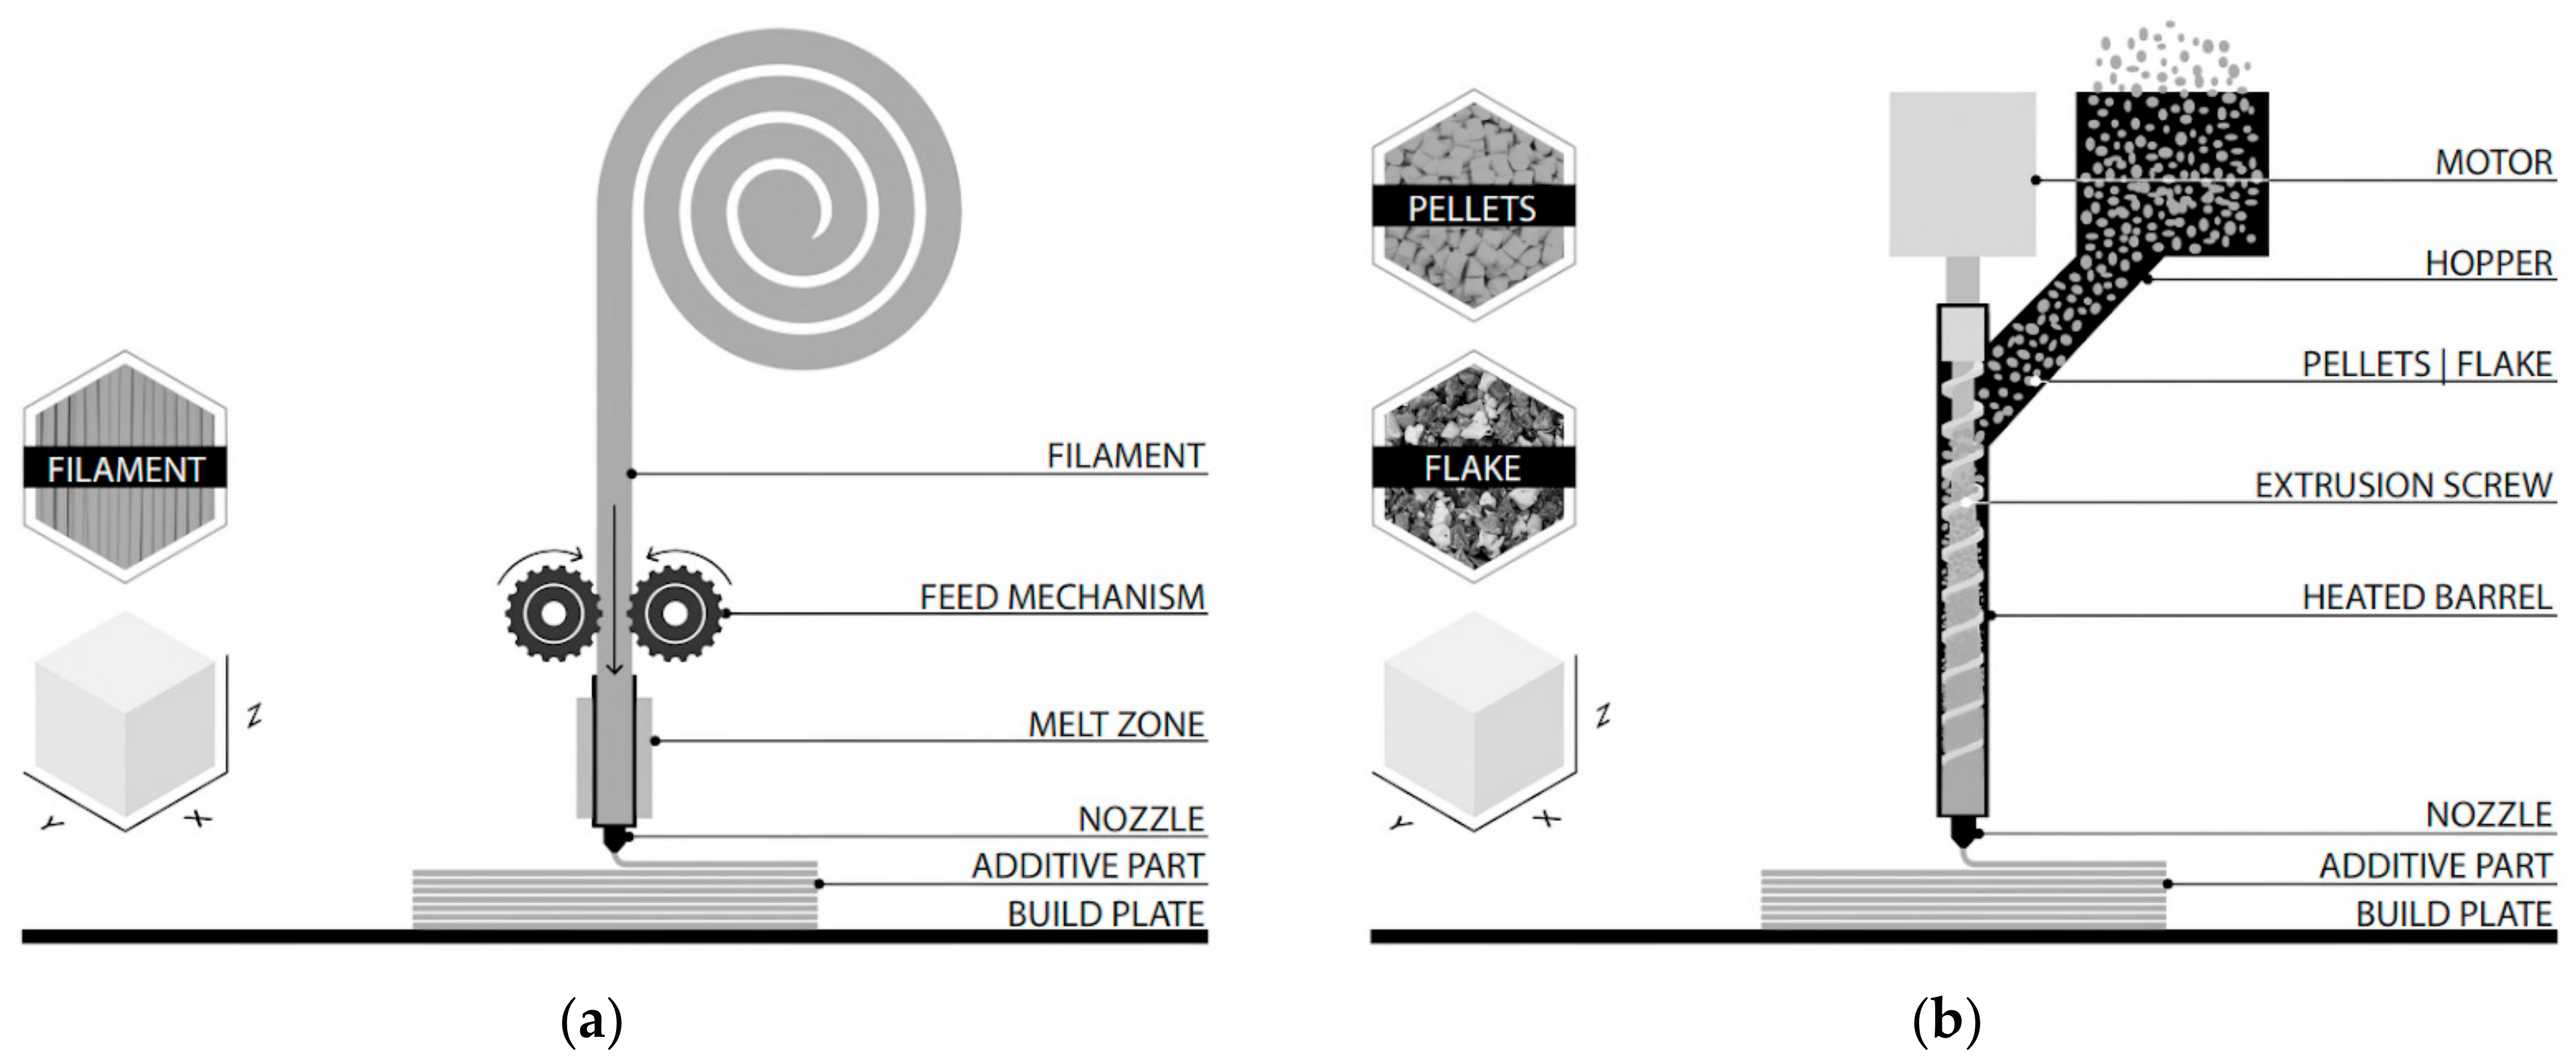
Most material extrusion processes require homogeneous filament feedstocks (i.e., fused filament fabrication (FFF)). Figure 1a depicts the FFF extrusion process, in which uniformly shaped filament passes through a geared mechanism into a melt zone where it becomes softer and malleable. Then, it is extruded onto the build plate to fabricate or ‘print’ the final product. The preprocessing necessary to convert bulk thermoplastic material into filament adds cost and limits the ability to use recycled material in these processes. Screw-based extrusion (or fused granular fabrication (FGF)) addresses both challenges by printing directly from pelletized or granulated recycled plastic without the need to form these materials into filament (Figure 1b). The recycled plastic feedstock does not need to be uniformly shaped; the pelletized feedstock softens in the heated barrel before it is extruded onto the build plate. This method saves preprocessing costs and energy [8].
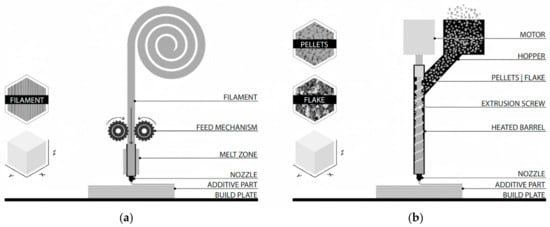
Figure 1.
Comparison between FFF (a) and FGF (b) additive manufacturing.
Prior work has focused on the energy implications and environmental trade-offs of non-traditional additive manufacturing, often in the form of a life cycle assessment (LCA). An LCA is an accounting framework that quantifies the environmental impacts of each stage in a product’s lifespan [9]. LCAs often follow the International Organization for Standardization’s ISO 14040 and ISO 14044 standards [10], which detail the principles behind LCA as well as specific guidelines for developing accurate LCAs. LCAs help quantify the environmental, financial, health, and social impacts of a particular process, which help inform decisions and sustainability claims.
Yang and Liu performed an LCA to evaluate the energy, time, and material consumption of fused deposition modeling (FDM), which is synonymous with FFF; different printing settings were investigated to optimize the FFF printer’s consumption [11]. Another study performed a similar LCA to compare the energy consumption associated with different feedstock materials in FFF and selective laser sintering (SLS) [12]. Telenko and Seepersad performed an LCA to compare the energy and emissions impacts of SLS and injection molding (IM) manufacturing processes and determined that SLS was more energy efficient for small production volumes while IM consumed less energy for larger volumes [9]. Other studies also conducted comparative LCAs between different AM technologies and conventional manufacturing processes. Faludi and coauthors conducted a comparative LCA on three different manufacturing machines: one CNC (computer numerical control) mill representing conventional manufacturing and two additive manufacturing machines (FFF and inkjet) [13]. They found that the ecological impact of all the machines depended mostly on the machine utilization per unit, with FDM exhibiting the lowest impact overall. Another comparative LCA analyzed variations in machine and material choices in AM, including ABS (acrylonitrile butadiene styrene), PET (polyethylene terephthalate), PLA (polylactic acid), and other polymers in FDM, polyjet, SLA (stereolithography), and inkjet machines [14]. The study concluded that electricity dictated ecological impacts in AM more than material variations, once again pointing to machine utilization and the benefit of reducing idle time. However, a later study found that machine utilization must be combined with low-impact materials and energy efficiency [15]. Further LCA studies investigated the capability of novel materials to improve the environmental impacts of AM [16]. A general overview of AM sustainability touched upon recycled and composted materials, but the authors claimed “desktop recycling for 3D printing is unlikely to be a net environmental benefit” compared with injection molding, “even if the recycling phase is low-energy, but future technologies could change this” [17]. The research study in this paper investigates this possibility with respect to FGF.
Beyond LCAs for additive manufacturing and conventional manufacturing processes, studies have been conducted specifically on the topic of recycling in AM. Multiple papers have investigated centralized versus distributed recycling systems in the context of gathering waste plastic for AM. Distributed recycling via AM, which entailed local waste collection for use in printers, was found to have a lower environmental impact than centralized recycling in which waste was transported to designated locations for recycling or landfilling [18]. Multiple studies have specifically investigated open-source printers (i.e., printers whose software and hardware is made available publicly for use and modification) such as the RepRap [19] coupled with the plastic waste extruder Recylebot, and researchers have arrived at similar conclusions in favor of distributed recycling and open-source printing [20]. These conclusions were backed by an LCA conducted on the production of high-density polyethylene filament from distributed versus centralized recycling, finding distributed systems to have less embodied energy than all the centralized recycling systems studied, although this reduction varied based on area population and recycling frequency [21]. Another LCA was conducted on recycled ABS in FDM, in which the plastic was obtained by recycling electronic waste (e.g., discarded cellphones and computers) in Brazil; it was determined that FDM had a lower environmental impact than IM under those conditions [22]. While that paper investigated manufacturing differences, others have focused on material properties. One assessed the print quality of FGF versus FFF on open-source printers using plastic waste, finding no significant difference in technical quality between the two, even though FGF was cheaper [23]. A different study investigated the properties of FGF with recycled particles versus conventional FFF and found similar tensile properties [24].
Although the literature review reveals that LCAs for AM and other manufacturing processes are common with and without recycled feedstock, a gap in the literature remains when comparing recycled AM processes and conventional production methods. A recent literature review on the net-zero future of recycled AM recommended transportation efficiency increases, improvements in recycling processes, and the development of a market for recycled filament to lower emissions toward net zero [25]. Unlike many of the studies previously conducted, the LCA in this work investigates a recycling process in which filament creation is not required, resulting in a possible new market model for waste-plastic printing. A previous study with the Gigabot X (GBX), an open source FGF machine developed by re:3D Inc. (Houston, TX, USA) that was used in this work, found that using the GBX with distributed recycling had significant economic potential compared with commercial manufacturing processes [26]. Another study found that prints made with the GBX were faster than conventional printers without significant decreases in mechanical properties [8]. Speed enables higher throughputs in FGF, allowing greater quantities of waste recycling. FFF has a traditionally low throughput in comparison.
In this work, we evaluate the emissions tradeoffs of using FGF as a manufacturing method compared with conventional FFF and injection molding (IM). The evaluation is performed via life cycle assessment (LCA) and considers both virgin and recycled polymer feedstock. The studies mentioned earlier have shown that material properties are not significantly affected and economics are improved; so, this LCA provides an emissions and environmental perspective regarding the viability of displacing current manufacturing processes with locally sourced waste plastic in FGF. In addition, different scenarios are investigated to explore the impacts of different supply chain transportation routes, varying material inputs (first-use vs. recycled), and varied electricity mixes.
2. Results
2.1. Goal and Scope of LCA
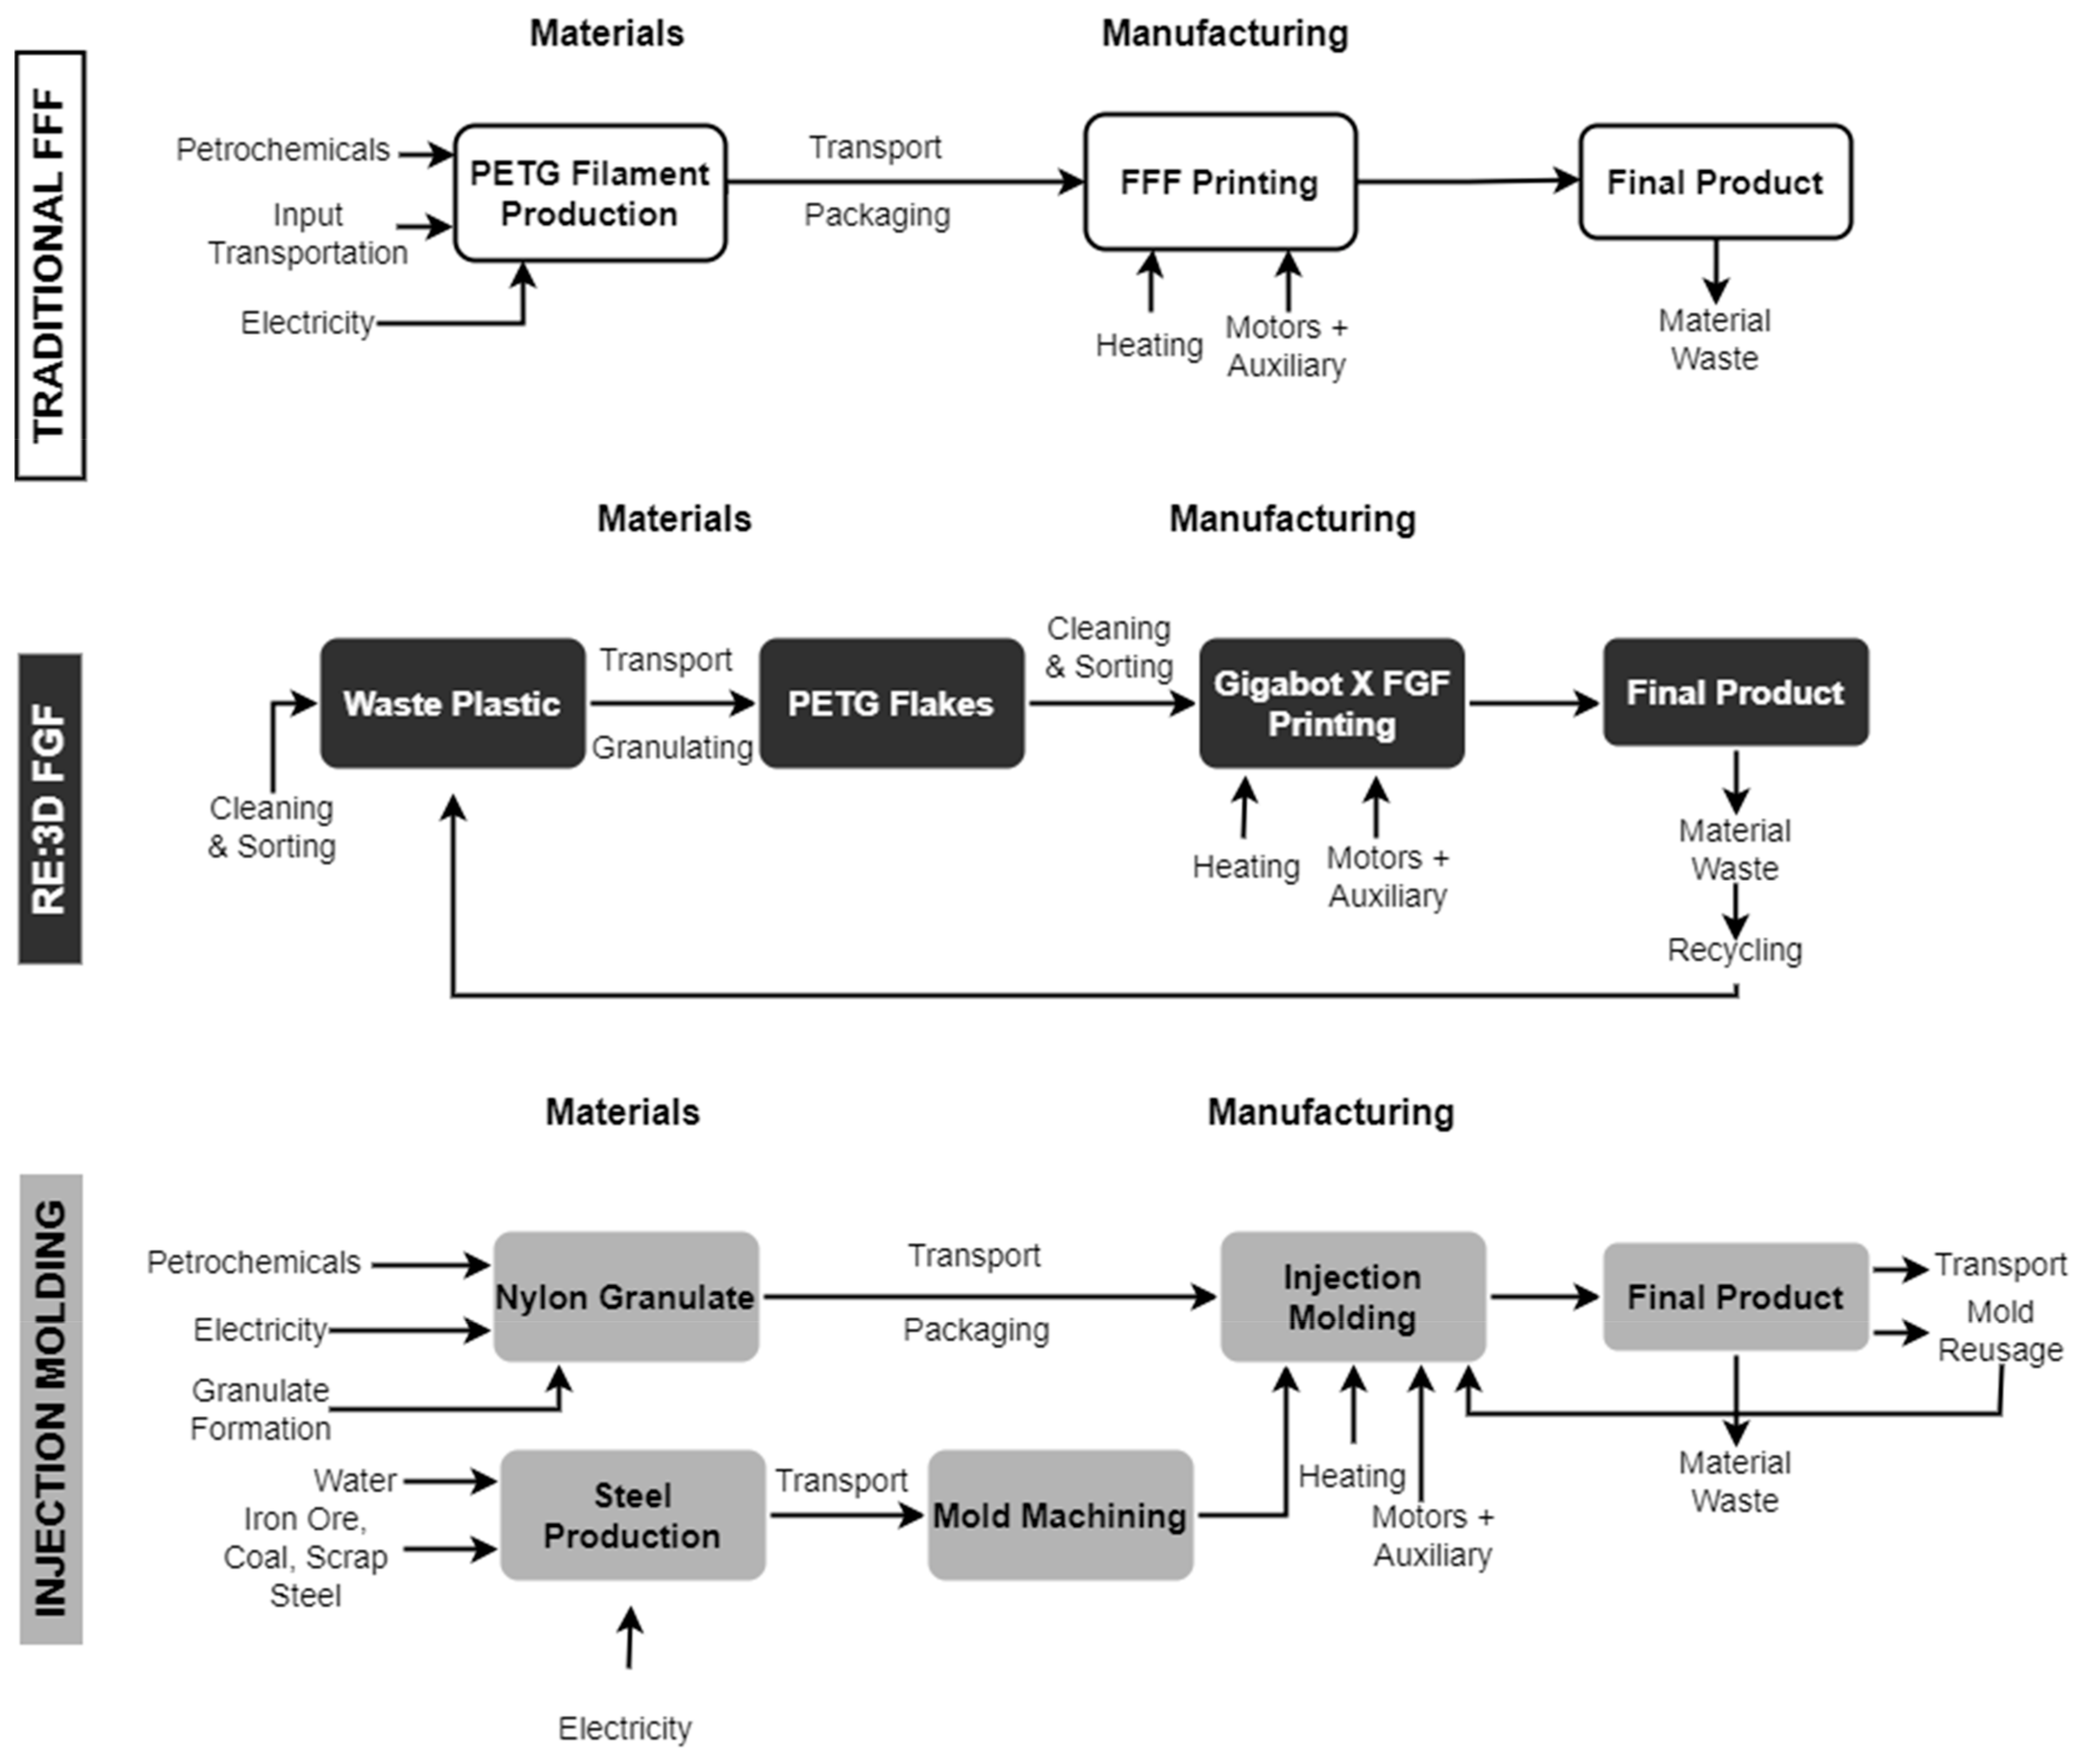
The goal of this study is to quantify and compare the ‘cradle-to-gate’ environmental impacts of conventional FFF and IM to those of FGF with waste plastic input. Cradle-to-gate encompasses the product’s manufacturing process from the start to final product delivery. We account for the emissions impacts of each step to produce and refine the material, package and transport it, produce the end product using the specified manufacturing method, and provide any relevant waste treatment. Figure 2 depicts the processes and associated flows for each of the three methods compared in this paper.
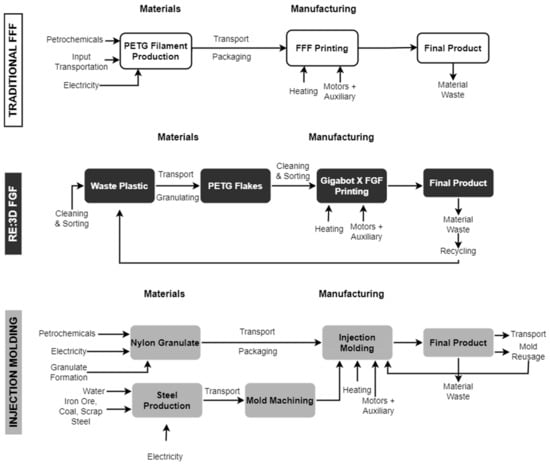
Figure 2.
Scope buildout diagram for traditional FFF, recycled FGF, and injection molding to produce a functional unit of a small plastic stool.
A functional unit is the quantity of a product on the basis of the performance it delivers in its end-use application, and serves as the reference basis for all calculations regarding impact assessment. The functional unit for this study is a small plastic stool weighing 8.7 kg, assumed to be produced using polyethylene terephthalate glycol (PETG) input in the re:3D Gigabot FFF and Gigabot X FGF machines and nylon input in a benchmark hydraulic injection molding machine [8]. These materials have been selected because they are commonly used in additive manufacturing and injection molding, including the LCAs discussed in Section 1 [9,14].
This study does not consider steps past the ‘gate’, meaning that consumer utilization of the product and eventual transportation and landfill disposal are not included. ‘Material waste’ (Figure 2) refers to byproducts of production, such as scrap and failed parts or support material in the case of the additive manufacturing systems. Since the input is waste plastic and the purpose is to give it a ‘second life’, this study disregards the emissions associated with producing the original virgin PETG products. Those emissions would nominally be allocated to the original production process, which are avoided when recycling a product.
Six different scenarios reveal the impacts of varying electricity, transportation, and/or material inputs. The baseline scenario for traditional FFF assumes domestic transportation with virgin material, modeling a vendor’s supply chain. Two additional scenarios are assessed for traditional FFF. The first (Scenario 1 (S1)) assumes international transportation rather than domestic. This assumption might allow for a better comparison with IM in terms of determining the emissions impacts of the manufacturing processes themselves, since IM often utilizes international transport. Another traditional FFF scenario (S2) expands on S1 by using recycled PET input with international transportation. This scenario compares FFF and recycled GBX FGF manufacturing processes. The baseline scenario for GBX FGF assumes the co-location of waste plastic and printing, resulting in no transportation. Another scenario (S3) explores the impacts of adding transportation of waste plastic to the GBX FGF case, to simulate a situation in which on-site plastic is not available.
A product system is defined by the International Organization for Standardization (ISO) as a “collection of unit processes with elementary and product flows, performing one or more defined functions, and which models the life cycle of a product”. In this study, the unit processes are the blocks presented in Figure 2, adjusted to represent each of the six mentioned scenarios.
2.2. LCA Results
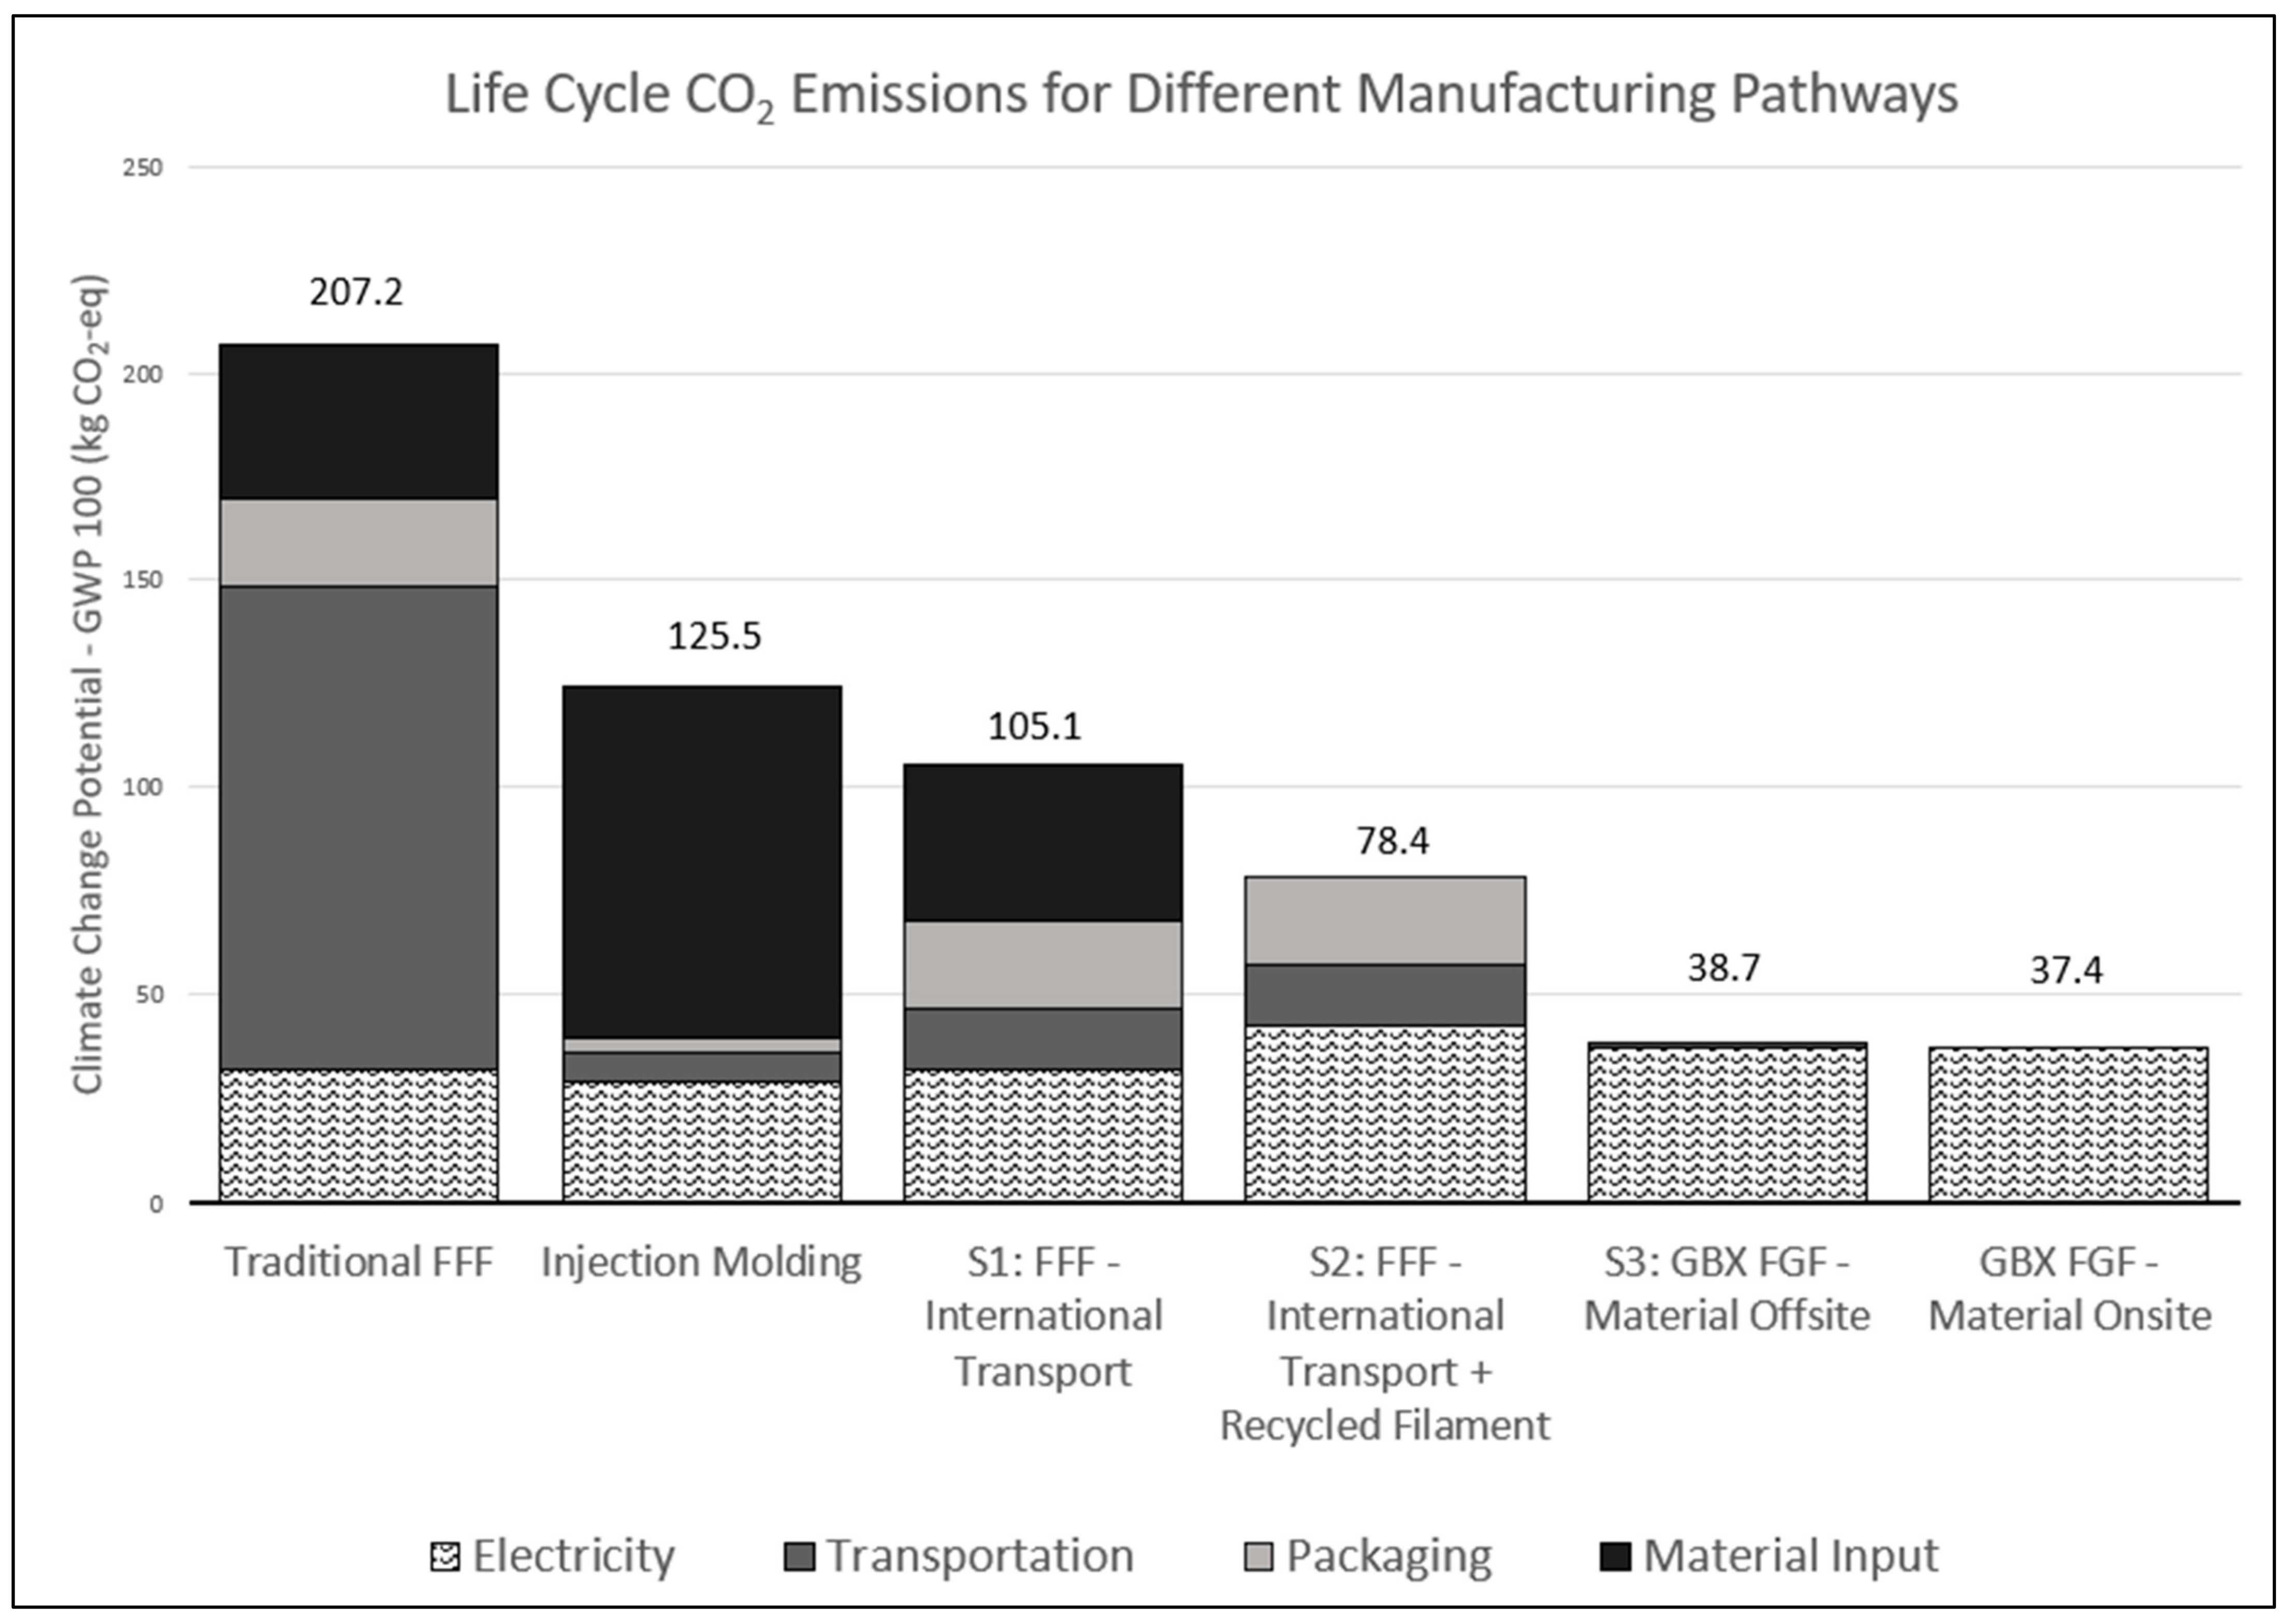
The bar chart in Figure 3 compares the CO2-equivalent emissions generated by each of the product systems. The results are further grouped by electricity, transportation, packaging, and material input, waste treatment. The emissions for each pathway were estimated in OpenLCA with the same functional unit and impact assessment method. Impact assessment methods are ways to quantify environmental impacts for an LCA system, by grouping and categorizing inputs with similar types of impacts. The chosen impact assessment method in this paper used raw data from OpenLCA to determine the numerical values presented in Figure 3. The results are also presented in Table A1 in Appendix B.
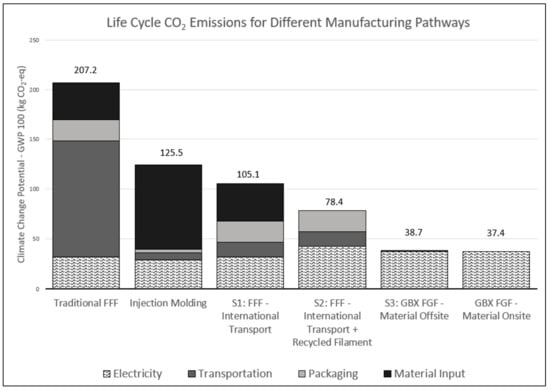
Figure 3.
The GBX FGF with onsite material has the lowest life cycle CO2-eq emissions per functional unit of production.
Figure 3 shows that GBX FGF had the lowest lifecycle emissions (just over 37 kg CO2-eq) per functional unit and thus, the lowest climate change potential of the six scenarios. GBX FGF plus local transport for material input has the second lowest lifecycle emissions, remaining much lower than the three FFF scenarios. In contrast, traditional FFF had the highest lifecycle emissions. Those for injection molding were between traditional FFF and GBX FGF.
While electricity consumption varied among the processes shown in Figure 3, its variation (37%) was minimal compared to the largest variations between processes for transportation (200%), material input (200%), and packaging (200%).
2.2.1. Transportation
Mode and distance of transport are the largest contributors to the higher overall climate change impact of traditional FFF because it has larger transportation requirements than other product systems such as S1, S2, and IM (see Table A2 in Appendix C), with its extensive use of light commercial trucks. While the transportation distance in the international product systems (S1 and S2) is significantly greater, a majority of the transportation is via a bulk carrier ship, which has a much lower emissions intensity (kg CO2). We assume the material suppliers for all international systems (S1, S2, and IM) are co-located in the heavily industrialized area of Shenzhen, China and, as such, minimal truck transport is involved. This assumption is based on knowledge of typical Shenzhen suppliers.
Because of the co-location of inputs and manufacturing, no transportation was included in the GBX FGF assessment, and minimal local transport was included for S3. As such, these product systems had much lower overall emissions than the FGF product systems.
2.2.2. Material Input
While PETG was the chosen material for FFF and FGF, neither of the databases we consulted for this study—Ecoinvent and the public Federal Commons LCA databases—contained information on PETG and its related processes. As a result, we utilized polyethylene terephthalate (PET) material inputs, presuming their characteristics to be aligned closely with those of PETG. Nylon 6 was chosen for injection molding because it is a commonly used plastic for IM, and an attempt was made to replicate the process for a product that would typically be purchased from a retailer. Nylon input production is a major contributor to the emissions associated with IM, which signify material dependence. The IM system in Figure 3 had a substantially larger material input contribution than any of the other systems, constituting 68% of its emissions, compared with 18% for traditional FFF and 36% for S1. The nylon input is defined by Ecoinvent as being the embedded energy used to produce Nylon 6 as well as the drying and granulation steps to produce nylon granulate. Nevertheless, taking out the nylon input section still places IM at greater climate change potential than GBX FGF. No emissions are related to material input for GBX FGF, S2, and S3, as these scenarios employ second-use plastic.
2.2.3. Packaging
Although packaging differs between the product systems, the overall contribution to emissions is lower than the other categories. There is no packaging associated with GBX FGF, due to the co-location of material input and manufacturing, resulting in no emissions for that category. Packaging contributes more to the three FFF streams compared to IM. FFF packaging refers to filament packing, which uses an acrylonitrile butadiene styrene (ABS) spool, polypropylene (PP) bagging, and cardboard box. IM packaging, on the other hand, is for the final manufactured item—assumed to use solely cardboard, which is typical of IM-manufactured products. Intermediate packaging for nylon and steel is not considered because it is expected to be minimal; however, because of its exclusion, this analysis probably underestimates packaging emissions for IM, especially compared with traditional FFF, S1, and S2.
2.2.4. Electricity
Electricity is the largest contributor to emissions in the GBX FGF product system. When compared with the electricity contribution for other production pathways, it is slightly higher than for traditional FFF and S1, but lower than S2 and IM. Exact values input into OpenLCA are shown in Table A2, Table A3, Table A4 and Table A5 in Appendix C. Despite the FFF printer having a larger power consumption than the Gigabot X, the slight increase is due to the added granulator and dryer electricity requirements for GBX. Scenario 1, being a combination of both the increased printer power consumption, granulation, and drying, has greater electricity-related emissions. IM employs a large electricity contribution due to the energy required to produce the steel and nylon, machine the mold plates, and operate the IM machine.
Because power sector CO2 emissions in the US have been dropping for over a decade, it is likely that the associated carbon emissions for all product systems in this category will decrease in an ongoing manner over the near future. Since electricity is the only emission contributor in GBX FGF, as the electric grid decarbonizes, that lifecycle total will trend toward zero emissions.
3. Materials and Methodology
3.1. LCA Methodology
This LCA utilized OpenLCA software (version 1.11) with data sourced from the Ecoinvent database (version 3.9.1), using the attributional method. Attributional LCA models the actual or forecasted supply-chain processes, similar to ‘accounting’, while consequential LCA focuses on market-based changes and broader system impacts [27]. Our study prioritized the attributional approach to obtain direct emission values.
Centrum voor Milieukunde Leiden (CML) is an LCA impact assessment method developed in 2001 by the University of Leiden in the Netherlands. It is required by European LCA standards and is a popular internationally employed LCA method. This study used the CML v4.8 2016 assessment method and the 100-year global warming potential (GWP-100) (with a reference unit of kg CO2-equivalent) for quantifying the overall climate impact.
For full data transparency in this study, Table A2, Table A3, Table A4 and Table A5 in Appendix C include the relevant information relating to OpenLCA. The following sections detail the major inputs and data sources for each product system.
3.2. Traditional FFF
The system in OpenLCA for conventional FFF models the existing supply chain and production techniques of a US-based filament supplier. The process is specific to production and transportation of PETG filament (originating from 100% virgin PETG resin); however, PETG and its associated processes were not available in either the Ecoinvent or public Federal Commons LCA databases. Therefore, PET material inputs were used and the values were assumed to be close to those of PETG. PET is a linear polymer made from the monomers ethylene glycol and terephthalic acid. PETG, on the other hand, is a copolyester where a portion of the ethylene glycol is replaced by 1,4-cyclohexanedimethanol (CHDM). This alteration impacts the thermo–mechanical properties, but no data were available on the differences in production energy consumption. Additive manufacturing of the two polymers is performed under similar conditions.
Under this scenario, raw PETG resin was transported from Atlanta, GA, to Green Bay, WI, using a light commercial truck, per information provided by the supplier. After the filament was manufactured from raw resin, the filament was spooled and packaged and then transported from the supplier to Austin, TX, again by light commercial truck. It is assumed that PETG input is equal to the functional unit’s weight (8.7 kg). Excess and waste is accounted for in the material waste process later in the LCA, which justifies this front-end assumption. Transportation was adjusted to account for every kilogram of material, measured in tonne–kilometers (tkm).
Electricity is incorporated in a similar two-step process. Electricity used in filament production, taken to be 0.355 kWh/kg [28], was sourced from the US-MRO (Midwest Reliability Organization) electricity provider and assumed to have emissions equal to the average of the overage grid mix for that grid service area. Electricity required for FFF printing was determined by measuring the power consumption of a commercial FFF printer—re:3D, Inc.’s Gigabot 4, which has a maximum power consumption of 1.2 kW while 3D printing (determined with a 20% safety factor). The provider for this electricity was US-TRE (Texas Regional Entity). Printing time was determined using a commercial AM slicing software on the functional unit with appropriate printer settings.
Packaging was considered for filament production: an ABS spool, PP bagging, and cardboard box for every package, with quantities for each provided by the filament supplier. Certain substitutions were made, such as white-lined chipboard instead of cardboard and plastic extrusion instead of PP bagging, to accommodate the availability of data. However, this assumption did not materially impact the LCA as packaging components constituted a very small weight (up to 320 g). This packaging was assumed to ultimately go to waste in the form of solid waste to landfill. Similarly, waste PETG goes to landfill after the printing stage in the form of failed or otherwise discarded prints [29].
Waste PETG is one of two paths forward from the FFF printing stage. The other is ‘End Usage’, referring to the print being handed off to a customer. This is where the LCA ends per the ‘cradle-to-gate’ scope specified in Section 2.
3.3. Gigabot X FGF
The system in OpenLCA for Gigabot X FGF assumes that input (i.e., waste plastic) and production are co-located, which builds on emerging methods of distributed recycling [18,19,20,21]. The first stage of the FGF LCA concerned flake production from the waste plastic input. The waste plastic is assumed to have zero associated emissions because it is a re-use scenario and the emissions from its manufacture would be allocated to the original production step. In addition, since this system assumes the additive manufacturing occurs at the site of waste collection, drying and granulation, no transportation requirements are included.
Electricity, as with traditional FFF, is accounted for in two steps. First, to produce the flakes, electricity is used in the form of drying and granulating the waste plastic, for which values were determined from dryer and granulator power consumption at Re:3D. Electricity requirements for FGF printing were determined from measured power consumption for a Gigabot X—re:3D, Inc.’s Gigabot X, which has a power rating of 1.33 kW (determined with a 20% safety factor)—along with a printing time estimate for the functional unit. The electricity provider was US-TRE.
After the printing stage, the product goes to ‘End Usage’, or it is recycled back into the process. The latter is accounted for in the LCA by including it as avoided waste that does not go to a landfill.
3.4. Scenario 1 (S1): Traditional FFF International
This scenario investigates the Traditional FFF product system with an international, rather than domestic, supply chain. We assumed an international PETG supplier from Shenzhen, China, that is widely used. Therefore, adjustments were made to the electricity mix for PETG filament production, from US-TRE to CN-CCG (Central China Grid). Transport of the PETG resin was from a local resin supplier via light commercial truck. The final PETG filament was transported via light commercial truck from the international PETG supplier to a port in Shenzhen, and from there via bulk cargo ship to the Port of Texas City. The last leg of the journey was made via light commercial truck from the port to Austin, Texas. This supply chain adds ship travel but reduces ground transportation compared with Section 3.2.
3.5. Scenario 2 (S2): Traditional FFF Recycled
Another scenario takes the Section 3.2 Traditional FFF product system and adjusts it to use a recycled PETG filament supplier rather than a virgin one. The assumption is that the international PETG supplier (used in Section 3.4 S1) is now manufacturing recycled filament from waste plastic, which is a known market model. The LCA is adjusted to omit PETG input or waste treatment, mirroring Section 3.3 GBX. Drying and granulation electricity values from Section 3.3 GBX FGF are added to represent the waste plastic being cleaned, dried, and granulated before being produced into filament. These steps were added to the previously identified electricity for filament production in Section 3.2 Traditional FFF [28].
3.6. Scenario 3 (S3): GBX FGF with Transport
A third scenario is presented for a slightly altered Gigabot X FGF model in which waste plastic is not available onsite. The analysis assumes that waste plastic is transported 48 km—a value determined based on the location of a known plastic manufacturer for waste plastic transport to the Gigabot X.
3.7. Injection Molding
With injection molding, the functional unit is identical to that of the aforementioned product systems; however, the mold volume needs to be determined as it is not the same as the unit volume itself. In injection molding (IM), parts are created by filling a mold with liquid material (in this case, nylon). In the LCA, to account for manufacturing of the metal mold, metal stock volume was calculated for a mold 1 inch greater than the part itself in each dimension. To account for machining energy, the cavity is assumed to be the unit volume itself, while the core is the unit volume subtracted from metal stock volume (as it is fabricated by machining everything except for the part volume itself). This assumption aligns with common practices of fabricating tools for injection molding.
The inputs for this system in OpenLCA were extracted from a secondary literature review, primarily from Telenko and Seepersad’s paper [9], except for the unit and mold volume calculations just described.
The material input into this process was the functional unit weight amount of Nylon 6, taken from the Ecoinvent database. For use in the IM machine this nylon must be processed and granulated, and the required electricity was presumed to be the same as drying and granulating electricity usage from Section 3.3, GBX FGF. Material input values for mold production, namely low-alloyed steel, were taken from the Ecoinvent database. As two steel plates make up one mold, the volume of each plate (determined from the 1 inch allowance described earlier) was doubled for the steel input. Values for the electricity to produce this steel were taken from Telenko and Seepersad’s paper [9]. An important consideration in this LCA is that while the nylon is used for one chair, the steel mold can be used for many units (around 50,000) [30]. Therefore, the LCA amortizes the mold production’s emissions by dividing by 50,000 units.
Transportation was considered, using an assumed supply chain with a steel manufacturer, nylon supplier, mold machine shop, and IM shop near Shenzhen, China (chosen because it is a highly industrial location). Transport from the steel manufacturer to the mold machining site was assumed to use a light commercial truck for 24 km. The mold manufacturing and IM shop were assumed to be co-located, so no transportation of the mold was required. The transport from the nylon supplier to the IM shop was assumed to be 29 km via light commercial truck. Transportation from the port of Shenzhen to the Port of Texas City was assumed to be via bulk cargo ship. The last leg of the journey, from the Port of Texas City to Austin was assumed to be via a light commercial truck. These transportation assumptions are based on known supplier information.
Aside from the electricity used to produce the nylon granulate and steel, electricity is also needed for mold machining and injection molding itself, both using the CN-CCG grid. Both values were calculated using injection molding SEC (specific energy consumption) values from literature [31].
Packaging was considered for the end product based on a typical store-bought plastic chair. The same type of cardboard was used as for Section 3.2, traditional FFF. Packaging has not been included, however, for intermediate materials such as nylon and steel. This exclusion is due to the unavailability of such data. After the production stage, the product goes to ‘End Usage’ or is recycled back into the process. Global LCA data access provided information on the typical amounts of IM plastic that go to a recycling facility or to landfill [32].
4. Discussion
These findings demonstrate the potential of recycled additive manufacturing to decrease carbon emissions in the plastics manufacturing industry. When compared with an LCA conducted on commercial FDM and IM [17], results show that the environmental impact of FDM (also known as FFF) is larger than that of injection molding in general. The difference between IM and FDM with PET, specifically, is smaller but still aligns with the trend determined from this study. This study’s authors also determined that electricity usage was the largest contributor to the environmental impacts of additive manufacturing, while transportation was not significant. The results depicted in Figure 3 show that electricity is a large emissions contributor, but transportation is the largest contributor to traditional FFF, while material input is the largest for IM. These results focus on specific product systems that cannot be generalized to all additive manufacturing processes, but they suggest that transportation might be more important from an environmental standpoint than previously thought. Faludi et al. indicated that sorting is one of the largest barriers to using recycled feedstocks in FFF [17]. They also emphasized that local plastic-waste collection curtails this issue because it can provide a stream of homogenous waste material. The results from this study indicate that recycled FFF reduces emissions compared with traditional FFF even when the filament in traditional FFF is recycled (S2), primarily because of the costs of transportation.
This LCA is based on a single functional unit geometry, with inputs such as transportation and printing energy simplified to mass-dependent relationships. However, the printing time in additive manufacturing, and the energy consumption and associated emissions, are specific to the shape of the fabricated functional unit and the configuration of the printer. To investigate the sensitivity of the results to the size of the part, the analysis was repeated for a 50% smaller part, and the results are reported in Appendix A. As shown in the Appendix, the results scale approximately linearly with the mass of the part in terms of CO2-equivalent emissions. Although the magnitudes of the emissions decrease with parts of decreasing size, the trends are consistent in terms of the relative climate change potential of different processes.
This LCA substituted PET for PETG to accommodate data limitations. As a result of the higher melting temperature required for printing with PET, an additional 20 W of power consumption (as calculated using a simplified 1D natural convection equation) would be required relative to PETG, which has not been accounted for in this LCA.
In addition, the usage of secondary data for the IM product system introduced uncertainty in material input substitutions. For example, the recycling and landfill values were taken from a dataset on injection-molded polypropylene (PP), rather than nylon parts. Another substitution used Nylon 6 for the IM product system, rather than PETG as used for the others. Data for the IM LCA were informed by Telenko and Seepersad’s paper [9], which used Nylon 6; no such papers or datasets were found for PETG in injection molding. This substitution could be considered a limitation because nylon has different material properties, such as melting point, which could cause emissions differences relative to PETG. Regardless, even without the material inputs, IM’s emissions have a greater climate change potential than GBX FGF. Machine maintenance was not considered for any of the product systems, and this requirement could cause emissions differences associated with the supply chains for the Gigabot X versus other FFF printing machines that make replacement parts easier or harder to obtain. Machine maintenance also differs between 3D printers and injection molding machines due to their varying levels of usage.
Water use has not been included in this study, although it is a unique trait of FGF systems (which use water for cleaning waste plastic) that does not necessarily appear in FFF or IM. Further studies could include water usage as a comparison metric between the different product systems.
5. Conclusions
Conducting a cradle-to-gate life cycle assessment of waste plastic FGF, traditional FFF, and IM provides a comparison of CO2-equivalent emissions for the three manufacturing methods. GBX FGF has the lowest overall climate change potential, measured in the amount of CO2-equivalent emitted by the process per functional unit. GBX FGF produces less than one-fifth of the emissions compared with traditional FFF. GBX FGF produces approximately one-third of the cradle-to-gate emissions compared with S2, and this is considered the ‘best case’ scenario for traditional FFF, replacing virgin filament with recycled and reducing transportation-related emissions. GBX FGF emissions are much lower compared with traditional FFF, primarily as a result of local transport, second-use material, and no need for packaging. FGF with a waste-plastic system allows material input to be sourced locally—as it is just waste in the form of plastic bottles, containers, and other discardable items—and used directly in the dryer, granulator, and printer, with no need for processing or packaging beforehand. Because this plastic is granted a second life—redirecting it from the landfill—the embedded energy of the material input does not contribute to overall emissions.
Limitations identified include the mass-dependence of the additive manufacturing product systems, certain material input substitutions, nylon’s greater embedded energy compared with PET, and the exclusion of emissions associated with producing the machine and performing maintenance. These limitations could be addressed by collecting primary data on all manufacturing systems in the study, rather than relying on the sparse literature and data available for this topic. The materials and resources required for this extension are out of scope for this study, but they offer important opportunities for further research into this topic.
Author Contributions
Conceptualization, E.B. and Y.R.G.; methodology, E.B., Y.R.G. and C.C.S.; software, E.B.; validation, E.B., Y.R.G. and D.M.S.; formal analysis, E.B. and Y.R.G.; investigation, E.B. and Y.R.G.; resources, Y.R.G., D.M.S., and C.C.S.; data curation, D.M.S. and E.B.; writing—original draft preparation, E.B. and Y.R.G.; writing—review and editing, Y.R.G., D.M.S., C.C.S. and M.E.W.; visualization, E.B.; supervision, Y.R.G. and M.E.W.; project administration, D.M.S. and C.C.S.; funding acquisition, D.M.S., C.C.S. and M.E.W. All authors have read and agreed to the published version of the manuscript.
Funding
This research was funded by the National Science Foundation, as part of a Convergence Accelerator project (contract numbers #49100423C0002 and #49100424C0004) in collaboration with Re:3D Inc, Austin Habitat for Humanity, The University of Texas at Austin, The University of Wollongong, and Western Sydney University.
Data Availability Statement
The original contributions presented in the study are included in the article (Appendix B and Appendix C); further inquiries can be directed to the corresponding author.
Acknowledgments
The authors of this paper would like to thank Samantha Snabes, Charlotte Craff, Aziz Ahmed, and Leela Kempton.
Conflicts of Interest
Doug Sassaman hereby declares a potential conflict of interest. At the time the research was conducted, he was employed as a postdoctoral scholar at the University of Texas at Austin. However, at the time of writing and submitting this paper, he is employed full-time at re:3D, Inc. He affirms that his current employment has not influenced the results or interpretations presented in the manuscript. All findings and conclusions in the paper are based on the research conducted during his tenure at the University of Texas at Austin and are presented with complete transparency and integrity. In addition to the research work on topics related to energy systems at the University of Texas at Austin, one of the authors (Webber) is a partner in IdeaSmiths LLC (an engineering consulting firm). Any opinions, findings, conclusions, or recommendations expressed in this material are those of the authors and do not necessarily reflect the views of the sponsors, re:3D, Inc., or IdeaSmiths LLC. The terms of this arrangement have been reviewed and approved by the University of Texas at Austin in accordance with its policy on objectivity in research. The funders had no role in the design of the study; in the collection, analyses, or interpretation of data; in the writing of the manuscript; or in the decision to publish the results.
Appendix A
The LCA was completed a second time for a functional unit occupying half the volume of the stool determined in Section 2, resulting in a mass of 1.529 kg. The new mass was approximately 17% of the mass of the original functional unit. The LCA results indicated an approximately 17% decrease in CO2-eq emissions across all categories and for all manufacturing systems. The printing time and energy consumption scaled approximately linearly with the mass of the functional unit, assuming the same overall geometry, ensuring comparison of similar scenarios in this LCA.
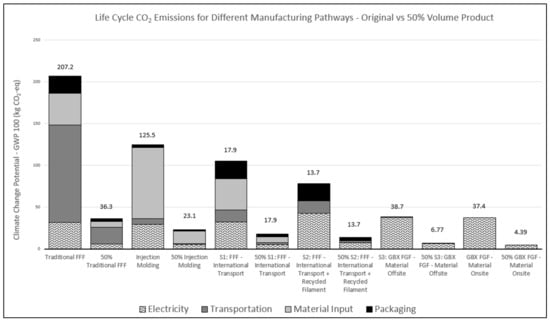
Figure A1.
At a 50% scale, the same emissions trends appear across manufacturing methods. Emissions decreased by 17% of the original values shown in Figure 3.
Figure A1.
At a 50% scale, the same emissions trends appear across manufacturing methods. Emissions decreased by 17% of the original values shown in Figure 3.

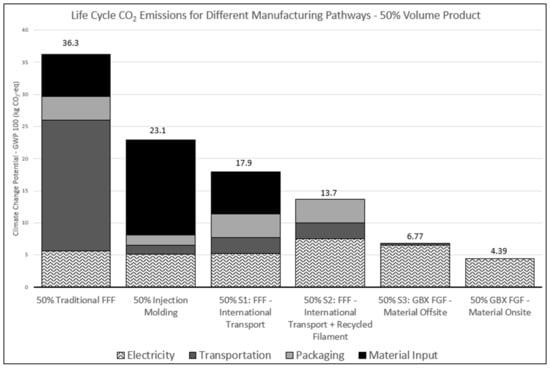
Figure A2.
At a 50% scale, the same emissions trends appear across manufacturing methods. GBX FGF with onsite material has the lowest lifecycle CO2-eq emissions per functional unit of production.
Figure A2.
At a 50% scale, the same emissions trends appear across manufacturing methods. GBX FGF with onsite material has the lowest lifecycle CO2-eq emissions per functional unit of production.

Appendix B

Table A1.
Lifecycle CO2 Emissions of a Functional Unit—Original and 50%. Steel Production and Waste Treatment were too small to show on Figure 3, Figure A1, and Figure A2.
| Climate Change Potential—GWP 100 (kg CO2) | |||||||
|---|---|---|---|---|---|---|---|
| Electricity | Transportation | Packaging | Material Input | Steel Production | Waste Treatment | Total | |
| Traditional FFF | 31.82 | 116.55 | 21.03 | 37.47 | 0 | 0.37 | 207.24 |
| Fifty percent Traditional FFF | 5.61 | 20.37 | 3.68 | 6.55 | 0 | 0.07 | 36.27 |
| Injection Molding | 29.32 | 7.011 | 3.32 | 84.75 | 0.56 | 0.01 | 125.51 |
| Fifty percent Injection Molding | 5.12 | 1.34 | 1.66 | 14.81 | 0.10 | 0 | 23.14 |
| S1: FFF—International Transport | 32.08 | 14.57 | 21.03 | 37.47 | 0 | 0.37 | 105.14 |
| Fifty percent S1: FFF—International Transport | 5.18 | 2.53 | 3.68 | 6.55 | 0 | 0.07 | 17.93 |
| S2: FFF—International Transport + Recycled Filament | 42.82 | 14.57 | 21.03 | 0 | 0 | 0 | 78.42 |
| Fifty percent S2: FFF—International Transport + Recycled Filament | 7.48 | 2.53 | 3.68 | 0 | 0 | 0 | 13.69 |
| S3: FGF—Material Offsite | 37.43 | 1.32 | 0 | 0 | 0 | 0 | 38.74 |
| Fifty percent S3: FGF—Material Offsite | 6.54 | 0.23 | 0 | 0 | 0 | 0 | 6.77 |
| GBX FGF—Material Onsite | 37.43 | 0 | 0 | 0 | 0 | 0 | 37.43 |
| Fifty percent GBX FGF—Material Onsite | 4.39 | 0 | 0 | 0 | 0 | 0 | 4.39 |
Appendix C
Table A2.
User Inputs for Traditional FFF.
Table A2.
User Inputs for Traditional FFF.
| Traditional FFF | ||
|---|---|---|
| Step | Ecoinvent Inputs/Outputs | Value |
| PETG Filament Production | polyethylene terephthalate production, granulate, bottle grade|polyethylene terephthalate, granulate, bottle grade|Cutoff, U—US | 1.00 kg |
| electricity, low voltage—|Cutoff, U—US-MRO | 0.36 kWh | |
| acrylonitrile-butadiene-styrene copolymer production|acrylonitrile-butadiene-styrene copolymer|Cutoff, U—RoW | 0.32 kg | |
| extrusion, plastic film|extrusion, plastic film|Cutoff, U—RoW | 0.07 kg | |
| white lined chipboard carton production|white lined chipboard carton|Cutoff, U—RoW | 0.08 kg | |
| transport, freight, light commercial vehicle|transport, freight, light commercial vehicle|Cutoff, U—RoW | 2.20 t·km | |
| Printing | market for electricity, low voltage|electricity, low voltage|Cutoff, U—US-TRE | 4641.96 Wh |
| transport, freight, light commercial vehicle|transport, freight, light commercial vehicle|Cutoff, U—RoW | 2.11 t·km | |
| treatment of waste polyethylene terephthalate, sanitary landfill|waste polyethylene terephthalate|Cutoff, U—RoW | 0.33 kg | |
| T: Packaging Waste (original flow) | 0.47 kg | |
Table A3.
User Inputs for Traditional FFF S1 and S2.
Table A3.
User Inputs for Traditional FFF S1 and S2.
| Traditional FFF | |||
|---|---|---|---|
| Step | Ecoinvent Inputs/Outputs | S1 | S2 |
| PETG Filament Production | polyethylene terephthalate production, granulate, bottle grade|polyethylene terephthalate, granulate, bottle grade|Cutoff, U—US | 1.00 kg | 0 kg |
| market for electricity, low voltage|electricity, low voltage|Cutoff, U—CN-CCG | 0.36 kWh | 1.09 kWh | |
| acrylonitrile-butadiene-styrene copolymer production|acrylonitrile-butadiene-styrene copolymer|Cutoff, U—RoW | 0.32 kg | 0.32 kg | |
| extrusion, plastic film|extrusion, plastic film|Cutoff, U—RoW | 0.07 kg | 0.07 kg | |
| white lined chipboard carton production|white lined chipboard carton|Cutoff, U—RoW | 0.08 kg | 0.08 kg | |
| transport, freight, light commercial vehicle|transport, freight, light commercial vehicle|Cutoff, U—RoW | 0.10 t·km | 0.10 t·km | |
| Printing | market for electricity, low voltage|electricity, low voltage|Cutoff, U—US-TRE | 4641.96 Wh | 4641.96 Wh |
| transport, freight, light commercial vehicle|transport, freight, light commercial vehicle|Cutoff, U—RoW | 0.37 t·km | 0.37 t·km | |
| transport, freight, sea, container ship|transport, freight, sea, container ship|Cutoff, U—GLO | 13.47 t·km | 13.47 t·km | |
| treatment of waste polyethylene terephthalate, sanitary landfill|waste polyethylene terephthalate|Cutoff, U—RoW | 0.33 kg | 0.33 kg | |
| T: Packaging Waste (original flow) | 0.47 kg | 0.47 kg | |
Table A4.
User Inputs for GBX FGF and S3.
Table A4.
User Inputs for GBX FGF and S3.
| GBX FGF | |||
|---|---|---|---|
| Step | Ecoinvent Inputs/Outputs | FGF | S3: Local Transport |
| PETG Flake Production | U: PETG Flake Source (original flow) | 1.00 kg | 1.00 kg |
| market for electricity, low voltage|electricity, low voltage|Cutoff, U—US-TRE | 731.78 Wh | 731.78 Wh | |
| transport, freight, light commercial vehicle|transport, freight, light commercial vehicle|Cutoff, U—RoW | 0 t·km | 0.05 t·km | |
| Printing | market for electricity, low voltage|electricity, low voltage|Cutoff, U—US-TRE | 5144.84 Wh | 5144.84 Wh |
| Recycling | treatment of waste polyethylene terephthalate, sanitary landfill|waste polyethylene terephthalate|Cutoff, U—RoW * | −0.33 kg | −0.33 kg |
* Negative values for waste treatment indicate that landfill waste is avoided; these avoided emissions are credited to the product system, signifying a positive impact.
Table A5.
User Inputs for Injection Molding.
Table A5.
User Inputs for Injection Molding.
| IM | ||
|---|---|---|
| Step | Ecoinvent Inputs/Outputs | Value |
| Steel Production | market for electricity, low voltage|electricity, low voltage|Cutoff, U—CN-CCG | 31,128.78 MJ |
| market for steel, low-alloyed|steel, low-alloyed|Cutoff, U—GLO | 1004.15 kg | |
| Mold Machining (50,000 items) | market for electricity, low voltage|electricity, low voltage|Cutoff, U—CN-CCG | 1,287,377.30 kJ |
| transport, freight, light commercial vehicle|transport, freight, light commercial vehicle|Cutoff, U—RoW | 23.69 t·km | |
| Nylon Granulate Formation | market for electricity, low voltage|electricity, low voltage|Cutoff, U—CN-CCG | 6401.58 Wh |
| nylon 6 production|nylon 6|Cutoff, U—RoW | 8.75 kg | |
| Injection Molding | market for electricity, low voltage|electricity, low voltage|Cutoff, U—CN-CCG | 96.23 MJ |
| transport, freight, light commercial vehicle|transport, freight, light commercial vehicle|Cutoff, U—RoW | 0.27 t·km | |
| plastic granulate, unspecified, recycled | 0.39 kg | |
| treatment of waste plastic, mixture, sanitary landfill|waste plastic, mixture|Cutoff, U—RoW | 0.14 kg | |
| End Usage | transport, freight, light commercial vehicle|transport, freight, light commercial vehicle|Cutoff, U—RoW | 3.28 t·km |
| transport, freight, sea, bulk carrier for dry goods|transport, freight, sea, bulk carrier for dry goods|Cutoff, U—GLO | 117.65 t·km | |
| white lined chipboard carton production|white lined chipboard carton|Cutoff, U—RoW | 2.27 kg | |
References
- Geyer, R.; Jambeck, J.R.; Law, K.L. Production, use, and fate of all plastics ever made. Sci. Adv. 2017, 3, e1700782. [Google Scholar] [CrossRef]
- OECD. Plastic Waste Projections to 2060. Available online: https://www.oecd.org/en/publications/2022/06/global-plastics-outlook_f065ef59/full-report/component-10.html (accessed on 21 June 2022).
- United States Environmental Protection Agency. National Overview: Facts and Figures on Materials, Wastes and Recycling [Overviews and Factsheets]. Available online: https://www.epa.gov/facts-and-figures-about-materials-waste-and-recycling/national-overview-facts-and-figures-materials (accessed on 2 October 2017).
- Brooks, A.L.; Wang, S.; Jambeck, J.R. The Chinese import ban and its impact on global plastic waste trade. Sci. Adv. 2018, 4, eaat0131. [Google Scholar] [CrossRef]
- Cotteleer, M.; Joyce, J. 3D Opportunity: Additive manufacturing paths to performance, innovation, and growth. Deloitte Rev. 2014, 14, 3–19. [Google Scholar]
- Hopewell, J.; Dvorak, R.; Kosior, E. Plastics recycling: Challenges and opportunities. Philos. Trans. R. Soc. B Biol. Sci. 2009, 364, 2115–2126. [Google Scholar] [CrossRef] [PubMed]
- Kreiger, M.; Pearce, J.M. Environmental Life Cycle Analysis of Distributed Three-Dimensional Printing and Conventional Manufacturing of Polymer Products. ACS Sustain. Chem. Eng. 2013, 1, 1511–1519. [Google Scholar] [CrossRef]
- Woern, A.L.; Byard, D.J.; Oakley, R.B.; Fiedler, M.J.; Snabes, S.L.; Pearce, J.M. Fused Particle Fabrication 3-D Printing: Recycled Materials’ Optimization and Mechanical Properties. Materials 2018, 11, 1413. [Google Scholar] [CrossRef]
- Telenko, C.; Conner Seepersad, C. A comparison of the energy efficiency of selective laser sintering and injection molding of nylon parts. Rapid Prototyp. J. 2012, 18, 472–481. [Google Scholar] [CrossRef]
- Finkbeiner, M.; Inaba, A.; Tan, R.; Christiansen, K.; Kluppel, H.-J. The new international standards for life cycle assessment: ISO 14040 and ISO 14044. Int. J. Life Cycle Assess. 2006, 11, 80–85. [Google Scholar] [CrossRef]
- Yang, J.; Liu, Y. Energy, time and material consumption modelling for fused deposition modelling process. Procedia CIRP 2020, 90, 510–515. [Google Scholar] [CrossRef]
- Ulkir, O. Energy-Consumption-Based Life Cycle Assessment of Additive-Manufactured Product with Different Types of Materials. Polymers 2023, 15, 1466. [Google Scholar] [CrossRef]
- Faludi, J.; Bayley, C.; Bhogal, S.; Iribarne, M. Comparing Environmental Impacts of Additive Manufacturing vs. Traditional Machining via Life-Cycle Assessment. Rapid Prototyp. J. 2015, 21, 14–33. [Google Scholar] [CrossRef]
- Faludi, J.; Hu, Z.; Alrashed, S.; Braunholz, C.; Kaul, S.; Kassaye, L. Does Material Choice Drive Sustainability of 3D Printing? Int. J. Mech. Aerosp. Ind. Mech. Eng. 2015, 9, 216–223. [Google Scholar]
- Shi, Y.; Faludi, J. Using life cycle assessment to determine if high utilization is the dominant force for sustainable polymer additive manufacturing. Addit. Manuf. 2020, 35, 101307. [Google Scholar] [CrossRef]
- Faludi, J.; Van Sice, C.M.; Shi, Y.; Bower, J.; Brooks, O.M.K. Novel materials can radically improve whole-system environmental impacts of additive manufacturing. J. Clean. Prod. 2019, 212, 1580–1590. [Google Scholar] [CrossRef]
- Faludi, J.; Cline-Thomas, N.; Agrawala, S. The Next Production Revolution, Implications for Government and Business—3D Printing and Its Environmental Implications; OECD Publishing: Paris, France, 2017; pp. 171–213. [Google Scholar] [CrossRef]
- Caceres-Mendoza, C.; Santander-Tapia, P.; Sanchez, F.A.; Troussier, N.; Camargo, M.; Boudaoud, H. Life Cycle Assessment of Filament Production in Distributed Plastic Recycling via Additive Manufacturing. Clean. Waste Syst. 2023, 5, 100100. [Google Scholar] [CrossRef]
- Baechler, C.; DeVuono, M.; Pearce, J.M. Distributed recycling of waste polymer into RepRap feedstock. Rapid Prototyp. J. 2013, 19, 118–125. [Google Scholar] [CrossRef]
- Zhong, S.; Pearce, J.M. Tightening the Loop on the Circular Economy: Coupled Distributed Recycling and Manufacturing with Recyclebot and RepRap 3-D Printing. Resour. Conserv. Recycl. 2018, 128, 48–58. [Google Scholar] [CrossRef]
- Kreiger, M.A.; Mulder, M.L.; Glover, A.G.; Pearce, J.M. Life Cycle Analysis of Distributed Recycling of Post-Consumer High Density Polyethylene for 3-D Printing Filament. J. Clean. Prod. 2014, 70, 90–96. [Google Scholar] [CrossRef]
- Garcia, F.L.; Nunes, A.O.; Martins, M.G.; Belli, M.C.; Saavedra, Y.M.; Silva, D.A.; Moris, V.A. Comparative LCA of convention manufacturing vs additive manufacturing: The case of injection moulding for recycled polymers. Int. J. Sustain. Eng. 2021, 14, 1604–1622. [Google Scholar] [CrossRef]
- Alexandre, A.; Cruz Sanchez, F.A.; Boudaoud, H.; Camargo, M.; Pearce, J.M. Mechanical Properties of Direct Waste Printing of Polylactic Acid with Universal Pellets Extruder: Comparison to Fused Filament Fabrication on Open-Source Desktop Three-Dimensional Printers. 3D Print. Addit. Manuf. 2020, 7, 237–247. [Google Scholar] [CrossRef]
- Reich, M.J.; Woern, A.L.; Tanikella, N.G.; Pearce, J.M. Mechanical Properties and Applications of Recycled Polycarbonate Particle Material Extrusion-Based Additive Manufacturing. Materials 2019, 12, 1642. [Google Scholar] [CrossRef] [PubMed]
- Oladapo, B.I.; Bowoto, O.K.; Adebiyi, V.A.; Ikumapayi, O.M. Net Zero on 3D Printing Filament Recycling: A Sustainable Analysis. Sci. Total Environ. 2023, 894, 165046. [Google Scholar] [CrossRef] [PubMed]
- Byard, D.J.; Woern, A.L.; Oakley, R.B.; Fiedler, M.J.; Snabes, S.L.; Pearce, J.M. Green Fab Lab Applications of Large-Area Waste Polymer-Based Additive Manufacturing. Addit. Manuf. 2019, 27, 515–525. [Google Scholar] [CrossRef]
- Yassine, E. (Director). Attributional vs. Consequential LCA. Available online: https://www.youtube.com/watch?v=3Rj7IlustcQ (accessed on 31 May 2022).
- Enemuoh, E.U.; Menta, V.G.; Abutunis, A.; O’Brien, S.; Kaya, L.I.; Rapinac, J. Energy and Eco-Impact Evaluation of Fused Deposition Modeling and Injection Molding of Polylactic Acid. Sustainability 2021, 13, 1875. [Google Scholar] [CrossRef]
- Toor, R. How Much Plastic Waste Does 3D Printing Really Generate? Available online: https://www.filamentive.com/how-much-plastic-waste-does-3d-printing-really-generate/ (accessed on 1 December 2023).
- Aluminum Molds vs. Steel Molds | Plastic Injection Molding—Xcentric Mold. Available online: https://xcentricmold.com/aluminum-molds-vs-steel-molds/ (accessed on 13 October 2023).
- Thiriez, A.; Gutowski, T. An Environmental Analysis of Injection Molding. In Proceedings of the 2006 IEEE International Symposium on Electronics and the Environment 2006, Scottsdale, AZ, USA, 8–11 May 2006; pp. 195–200. [Google Scholar] [CrossRef]
- Injection Molding, Rigid Polypropylene Part, at Plant | GLAD. Available online: https://www.globallcadataaccess.org/injection-molding-rigid-polypropylene-part-plant (accessed on 13 October 2023).
Disclaimer/Publisher’s Note: The statements, opinions and data contained in all publications are solely those of the individual author(s) and contributor(s) and not of MDPI and/or the editor(s). MDPI and/or the editor(s) disclaim responsibility for any injury to people or property resulting from any ideas, methods, instructions or products referred to in the content. |
© 2024 by the authors. Licensee MDPI, Basel, Switzerland. This article is an open access article distributed under the terms and conditions of the Creative Commons Attribution (CC BY) license (https://creativecommons.org/licenses/by/4.0/).