Article

Performance Assessment of One-Part Self-Compacted Geopolymer Concrete Containing Recycled Concrete Aggregate: A Critical Comparison Using Artificial Neural Network (ANN) and Linear Regression Models

School of Engineering, Deakin University, Geelong, VIC 3216, Australia
*
Author to whom correspondence should be addressed.
Recycling 2024, 9(5), 73; https://doi.org/10.3390/recycling9050073
Submission received: 19 June 2024 / Revised: 23 August 2024 / Accepted: 28 August 2024 / Published: 31 August 2024

Abstract

:
Geopolymer concrete, a cement-free concrete with recycled concrete aggregate (RCA), offers an eco-friendly solution for reducing carbon emissions from cement production and reusing a significant amount of old concrete from construction and demolition waste. This research on self-compacted, ambient-cured, and low-carbon concrete demonstrates the superior performance of one-part geopolymer concrete made from recycled materials. It is achieved by optimally replacing treated RCA with a unique method that involves coating the recycled aggregates with a one-part geopolymer slurry composed of fly ash, micro fly ash, slag, and anhydrous sodium metasilicate. The research presented in this paper introduces predictive models to assist researchers in optimising concrete mix designs based on RCA rates and treatment methods, including the incorporation of coated recycled concrete aggregates and basalt fibres. This study addresses the knowledge gap regarding geopolymer concrete based on recycled aggregate, various RCA rates, and novel RCA treatments. The novelty of the paper also lies in presenting the effectiveness of Artificial Neural Network (ANN) models in accurately predicting the compressive strength, splitting tensile strength, and modulus of elasticity for self-compacting geopolymer concrete with various rates of RCA replacement. This addresses a knowledge gap in existing research on ANN models for the prediction of geopolymer concrete properties based on RCA rate and treatment. The ANN models developed in this research predict results that are more comparable to experimental outcomes, showcasing superior accuracy compared to linear regression models.

1. Introduction

Construction and demolition waste (CDW) generation has been enhanced due to increased urbanisation and population growth [1]. In Australia, 25.2 million tons of CDW, accounting for 33% of the total waste volume, was generated in 2020–2021. This represents a 39% increase per capita over the past 15 years, primarily due to rapid urbanisation, particularly in major cities [2]. Traditionally, landfilling has been the simple solution for managing such waste [3]. However, this is not an environmentally friendly solution based on the circular economy [4]. The pyramid of the three Rs of reduce, reuse, and recycle suggests the importance of reusing or reducing waste reduction when it is impossible to move forward [5]. This research investigated the reuse of crushed concrete as coarse aggregates sourced from construction and demolition waste. Crushed concrete constitutes almost half of CDW and is one of the most crucial types of waste to manage [6]. Recycled concrete aggregate (RCA) incorporation in concrete preserves the natural resource of natural aggregate (NA), up to 75% of the concrete’s volume [7]. Moreover, this research examined RCA in a geopolymer concrete (GPC), a cement-free concrete introduced by Davidovits [8]. The binders used in this research include fly ash (FA), ground-granulated blast-furnace slag (GGBS), micro fly ash, and anhydrous sodium metasilicate, known as one-part GPC.
To the authors’ knowledge, there is limited research on the incorporation of RCA into one-part geopolymer concrete. Most of the relevant studies in this field have utilised liquid alkali activators. The method of using a solid alkali activator for the activation of geopolymer biding materials is called the “one-part” or “just-add-water” approach [9]. A solid alkali activator is more beneficial than using an alkali activator solution through the two-part approach due to the difficulties in transporting, storing, and preparing a liquid alkali activator [10]. Moreover, applying a solid powder alkali activator provides a ready-to-use dry mixture. After adding water, mixing, pouring into the moulds, and curing, hardened concrete will be obtained [9]. Recently, there has been a growing focus on one-part geopolymer concrete. The solid powder activators include anhydrous sodium metasilicate (Na2SiO3) [9,10,11,12], disodium silicate pentahydrate (Na2SiO3.5H2O) [9], sodium hydroxide (NaOH) in flake form [13], hydrous Na2SiO3 and sodium hydroxide (NaOH) [10], NaAlO2/Na2SiO3 [11,14], calcium carbide residue [15], and waste glass with NaOH micro-pearls [16]. Zhang, Liu, and Wu [10] reported that using solid Na2SiO3 in a one-part metakaolin- and fly ash-based GPC demonstrated higher compressive and flexural strengths than two-part GPC by 88–94% and 65–95%, respectively. Na2SiO3 is also applied as a solid alkali activator to develop self-compacting geopolymer concrete with a compressive strength of 40 MPa [17,18].
This research examined ambient-cured self-compacted geopolymer concrete (SCGC), which benefits the construction industry by reducing labour and cost, as well as lowering carbon emissions associated with the compaction and heat curing process [19]. This concrete is suitable for cast-in-place applications, even at night, due to the reduced noise levels associated with the casting process of self-compacted concrete [20].
A comprehensive examination of RCA’s impact on geopolymer concrete’s mechanical and rheological aspects makes it evident that identifying a concrete mix with the optimum amount of RCA is paramount [21,22]. Many studies have attempted to predict the mechanical properties of ordinary Portland cement (OPC) concrete based on the RCA content [23,24,25,26]. However, the development of a model for predicting geopolymer concrete properties based on the RCA content has been overlooked, despite the accuracy of ANN models in predicting geopolymer concrete properties [27,28].
Models for predicting the mechanical properties (compressive strength, flexural strength, etc.) include (1) regression-based models and (2) artificial intelligence models [7]. Regression analysis is a common and simple technique for modelling concrete behaviour [29]. Machine learning (ML) methods, as a leading area of artificial intelligence, provide better results but require substantial data to offer impartial and precise estimations. Additionally, ML models must be fine-tuned and robustly trained. Among the ML models, the most commonly applied technique for predicting the mechanical properties of various mix designs is an artificial neural network (ANN) [30]. Moreover, based on the RCA properties, ANN demonstrates a strong ability to predict the properties of OPC concrete. As illustrated in Table 1, the best ANN models’ linear coefficient correlation (R2) values are close to 1, indicating a higher correlation between the predicted results and actual values.
ANN is inspired by the communication among the neurons in the human brain [31]. As illustrated in Figure 1, ANN learns from the input information through a learning process, estimating and assigning a weight to each input datum. Then, bias is included as input and combined with other weighted inputs. The output is computed using an established activation function [30]. For instance, Levenberg–Marquardt was used by Chopra, Sharma, and Kumar [32] to estimate the compressive strength for various RCA replacement rates in OPC concrete.
This paper aims to investigate the accurate model for predicting the impact of RCA rate and treatment on the mechanical properties of one-part SCGC, including compressive strength (CS), splitting tensile strength (TS), and modulus of elasticity (MoE). Tests were performed on 28-day ambient-cured cylinder specimens. According to the experimental results and the key parameters affecting compressive strength, tensile strength, and MoE, linear regression (LR) and ANN models were developed to study the impact of RCA rate and treatment on the mechanical properties of SCGC mixes. Multiple verifications and analyses were performed to evaluate the effect of input parameters on compressive strength, tensile strength, and MoE.

2. Results and Discussion

The coarse RCA content ( C R C A ) , NA content ( C N A ) , 12 mm basalt fibre (BF) content ( B F 12 ) , 30 mm BF content ( B F 30 ) , and treatment of coating RCA ( C C o a t ) were used as the input parameters to develop ANN and linear regression models for predicting the compressive strength, tensile strength, and modulus of elasticity of SCGC mixes with various rates of RCA and treatment. This research used the training methods of Levenberg–Marquardt (LM), Bayesian regularisation (BR), and Scaled Conjugate Gradient (SCG) for ANN model development.

2.1. Linear Regression Model Development

The linear regression (LR) model summary and coefficients are presented in Table 2. The performance of the models was also tested, evaluated, and discussed using the following features: Linear coefficient correlation (R), Mean Squared Error (MSE), Mean Absolute Error (MAE), Mean Absolute Percentage Error (MAPE), and Root Mean Square Error (RMSE), as detailed in Table 3. According to all the statistical values in Table 3, the linear regression models estimate CS and TS values very close to the actual values. However, the predictions for MoE were less satisfactory. For example, the correlation coefficient of 0.813 for MoE indicates an unsatisfactory correlation, while the correlation coefficient for CS and TS reflects a perfect linear relationship.
Figure 2 shows the sensitivity index for the input variables of linear regression models. A higher sensitivity index (SI) indicates that the corresponding variable significantly impacts the output, while a lower SI suggests that the variable is less significant. C N A shows substantial sensitivity for modulus of elasticity with an SI of 43.9%, indicating that natural aggregates significantly affect the concrete’s elastic behaviour. The sensitivity index of 29.2% for C N A on splitting tensile strength indicates that natural aggregates also play a crucial role in the tensile strength of the concrete. Compared to RCA, the beneficial impact of higher amounts of natural aggregates on tensile strength [33,34,35,36] and MoE [35,36,37] has been well documented in several studies. B F 30 demonstrates a very high impact on splitting tensile strength with an SI of 47.1%. The beneficial effect of basalt fibre on tensile strength has been reported in previous studies [38,39,40]. C C o a t shows the highest sensitivity index of 50% for compressive strength, indicating a predominant impact in enhancing this property. The high sensitivity indices for the modulus of elasticity suggest that the coating treatment significantly improves the material’s stiffness.

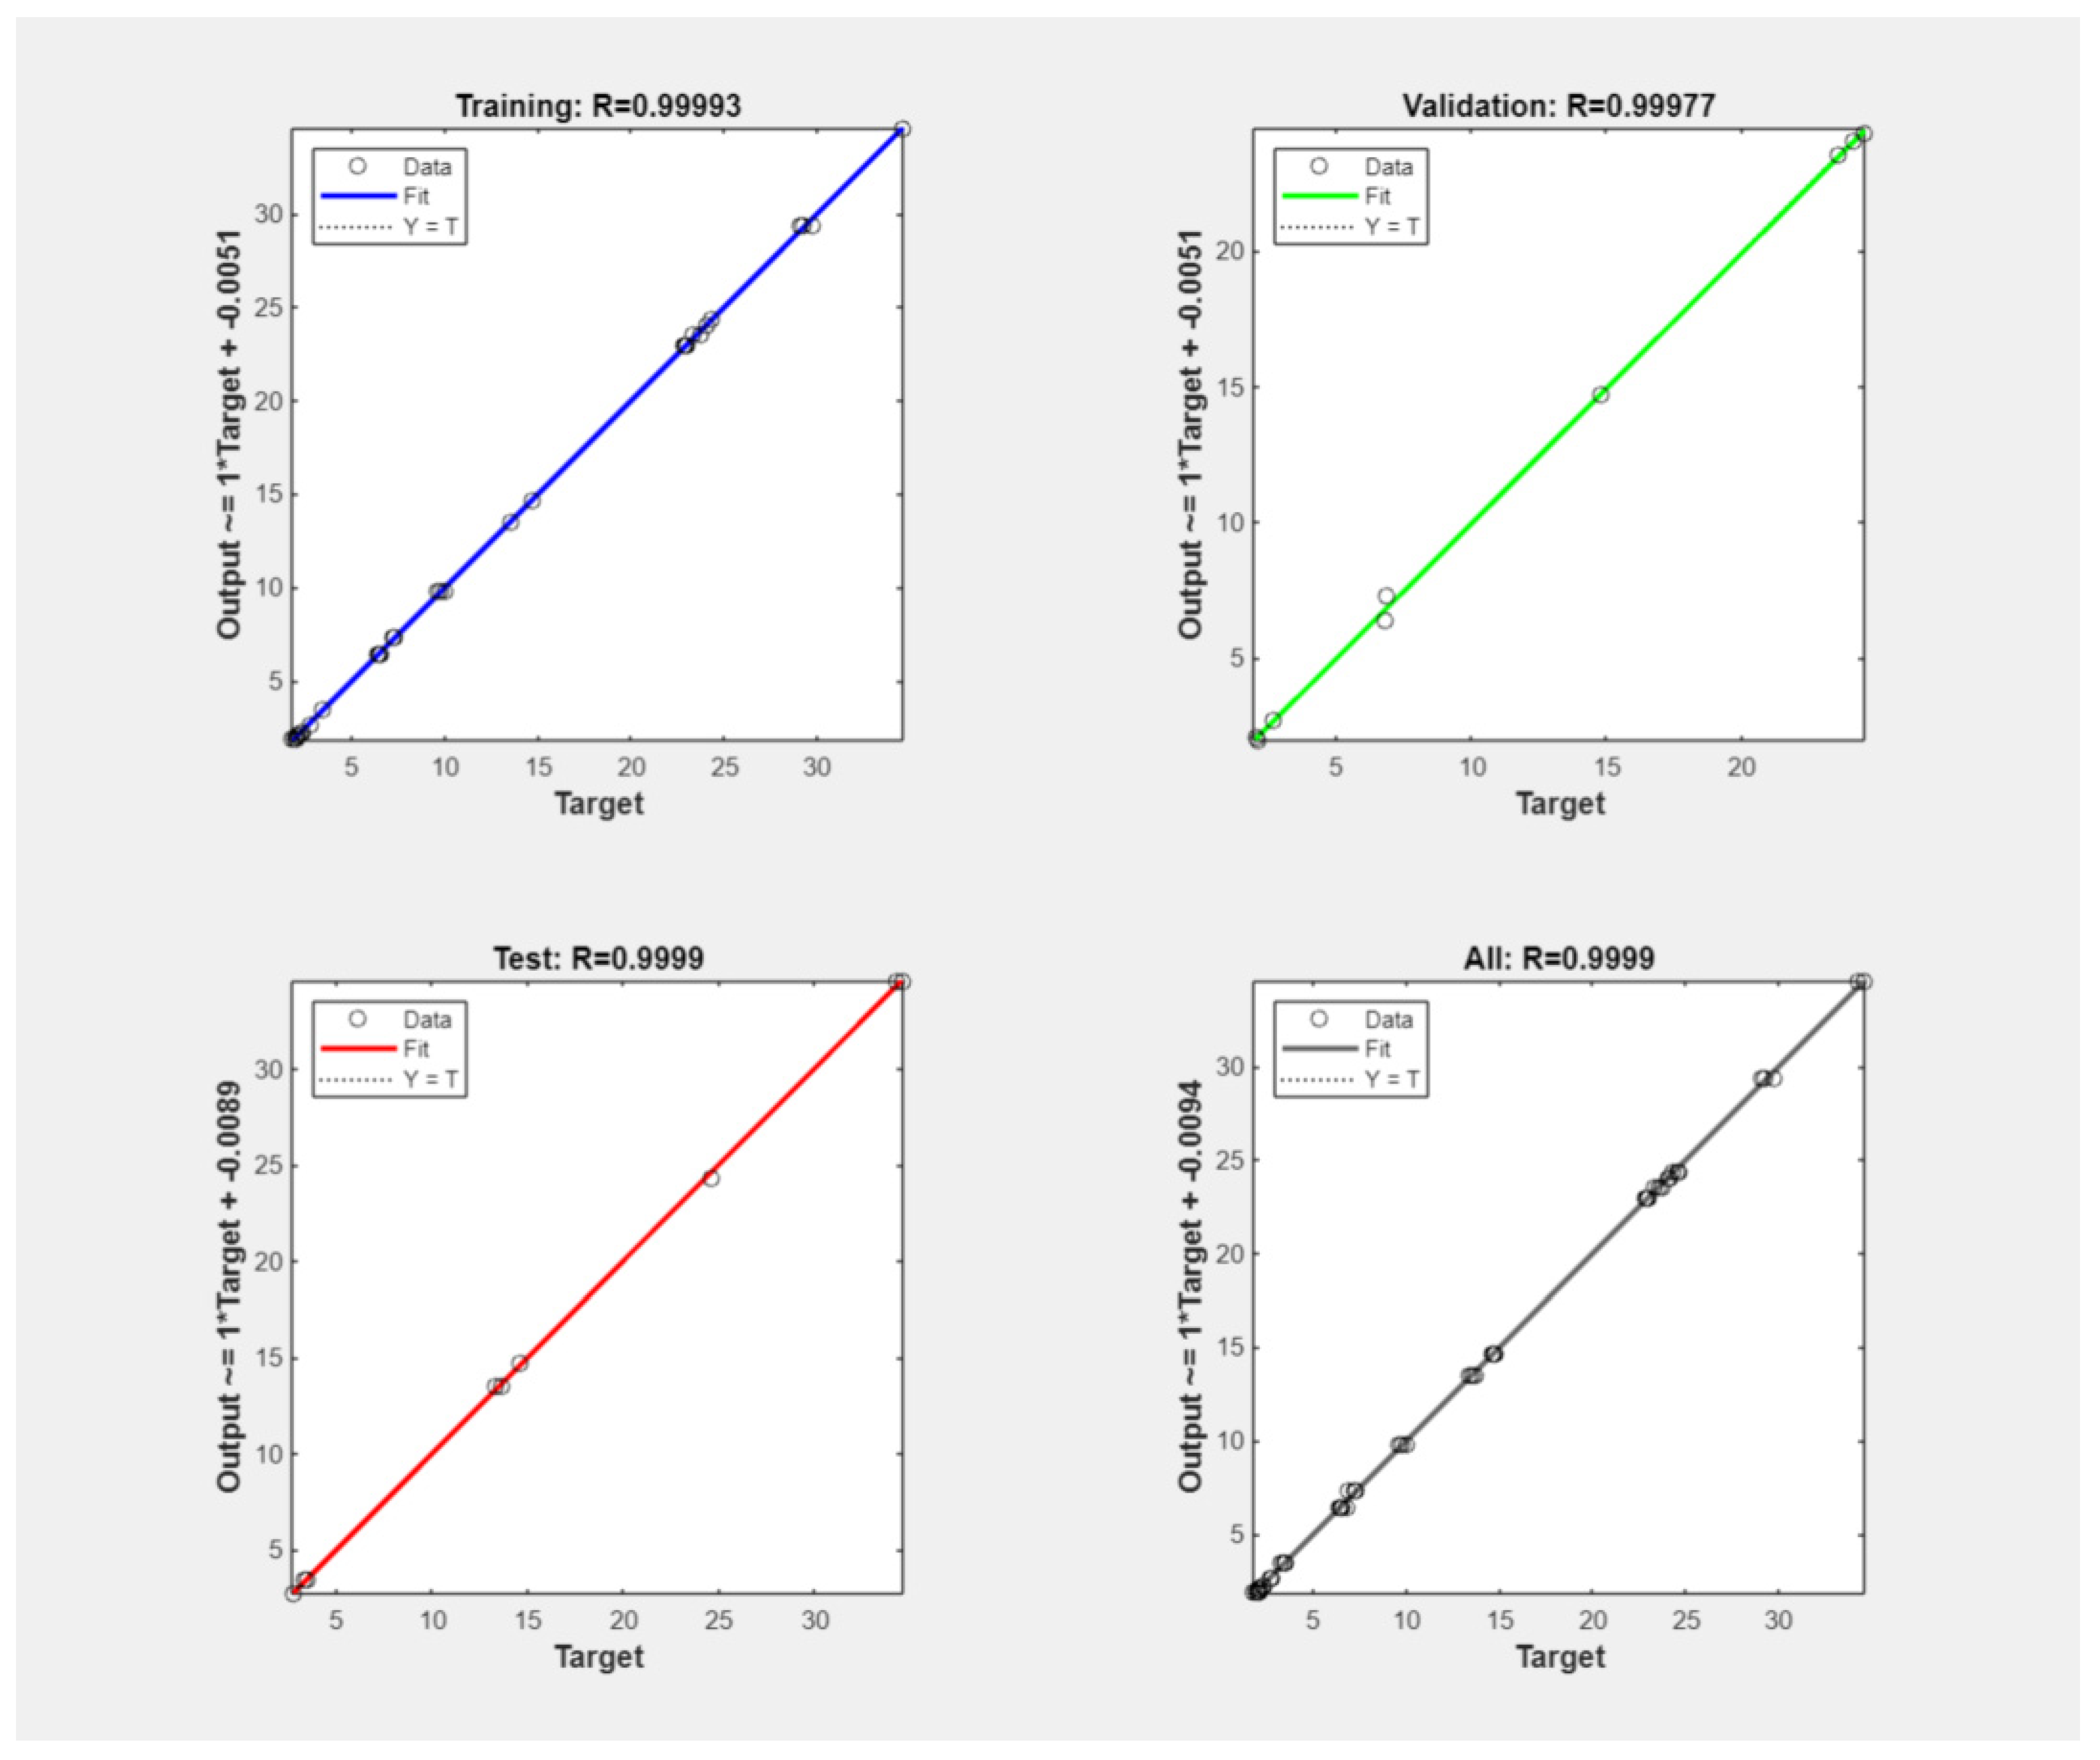
2.2. ANN Model According to the Levenberg–Marquardt (LM) Algorithm

The Levenberg–Marquardt training algorithm was used to develop an ANN model using five input variables and five hidden layers to predict the independent parameters of compressive strength, splitting tensile strength, and modulus of elasticity. The mean squared error (MSE) values for training, validation, and testing the dataset were 0.0162, 0.0087, and 0.0332, respectively. The lower MSE values indicate that the predicted values by the ANN model were closer to the actual numbers, indicating prediction accuracy and a reliable model. As illustrated in Figure 3, the best performance of the model was achieved after 18 epochs with a negligible value of 0.0087 for the validation MSE. Figure 4 illustrates the error histogram. The narrow spread of the error histogram indicates that the errors are close to zero, confirming the model’s high accuracy. Moreover, the histogram shows no left or right skew, indicating no bias in the errors. Outliers at the ends of the histogram are close to zero, supporting the model’s generalisation without overfitting.
Figure 5 displays R values and regression plots for the model prediction values concerning responses (target) for the training, validation, and test datasets. A 45-degree line in these plots confirms a perfect fit, where the model predictions align closely with the responses. The range of R values is between 0.999 and 1, which indicates a significant linear relationship between the model’s predictions and target values, as shown in Figure 5. The efficacy of the LN algorithm in training the ANN model was also evaluated and assessed based on the R values and errors for each feature in Table 4, concluding the model’s robustness in predicting CS, TS, and MoE.
Regarding the sensitivity analysis of the LM model, as shown in Figure 6, B F 12 input shows very high sensitivity across all mechanical properties, particularly in compressive strength. It indicates a strong influence of B F 12 on the mechanical characteristics of SCGC. C N A shows an extremely high sensitivity for the modulus of elasticity, suggesting it is a critical factor for the elastic behaviour of the material, confirmed by previous studies showing that concrete mixes with natural aggregates benefit from higher MoE [35,36,37]. Both B F 30 and C c o a t show moderate sensitivities across the properties, with notable peaks in splitting tensile strength for B F 30 and compressive strength for C c o a t .

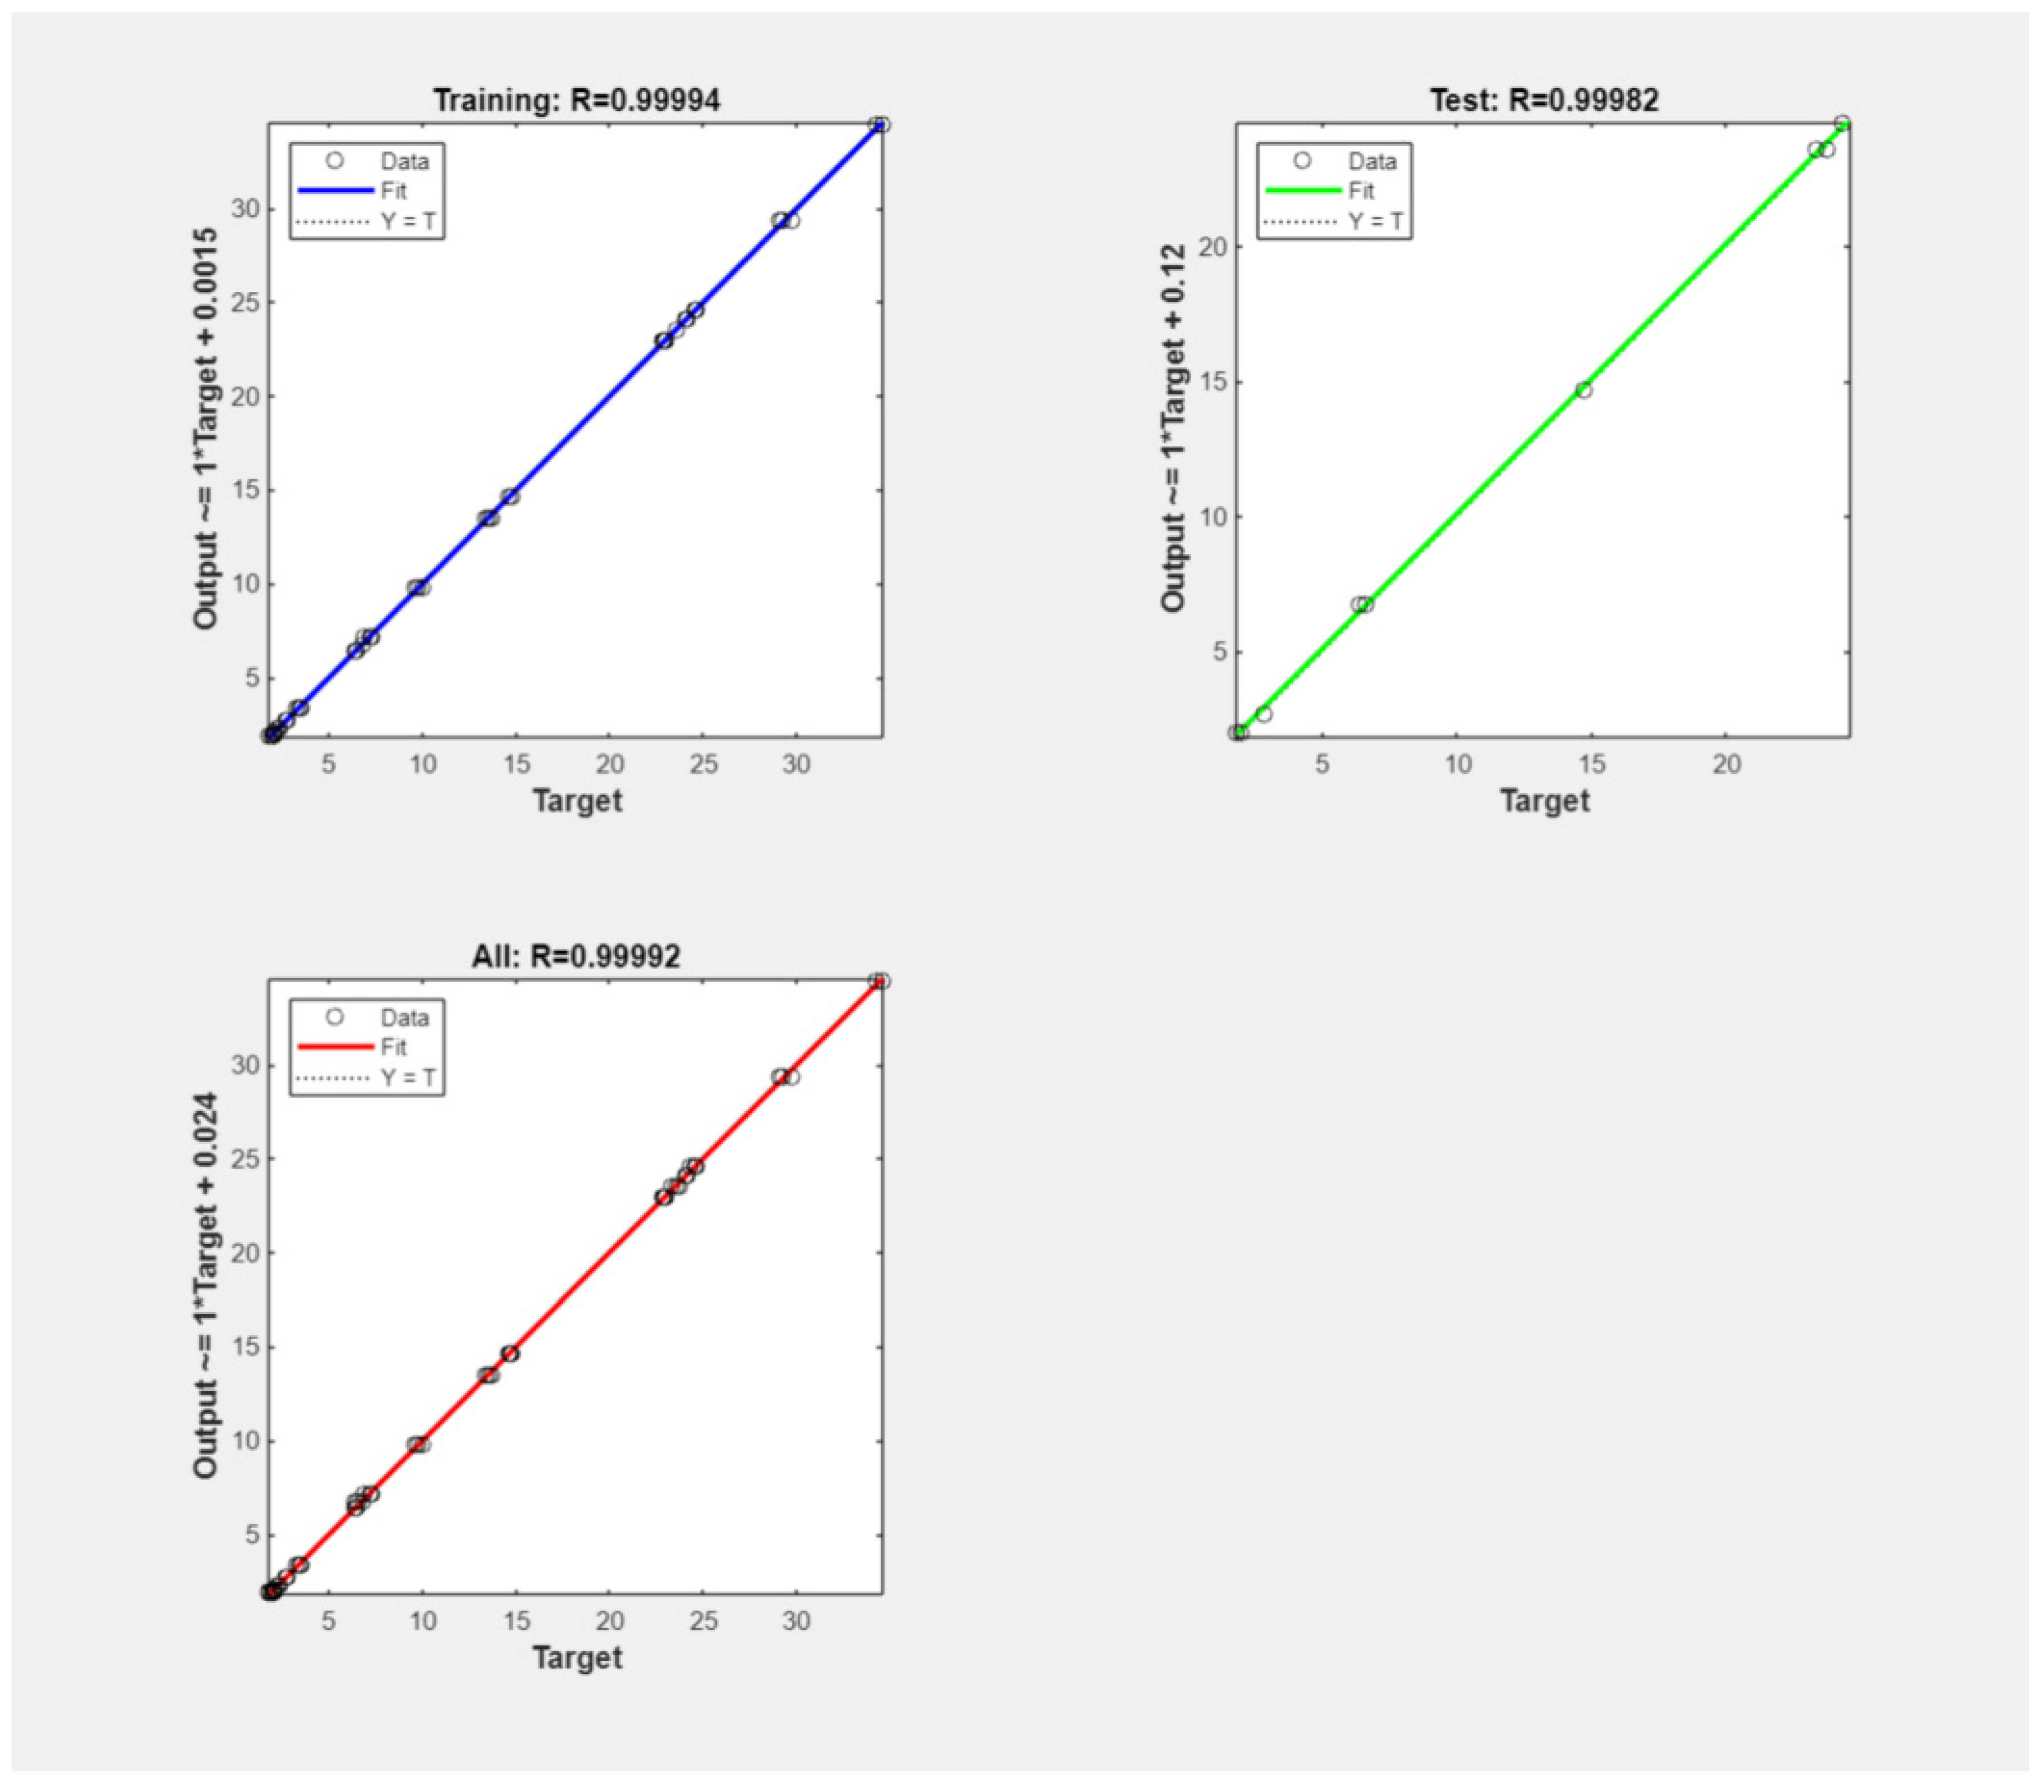
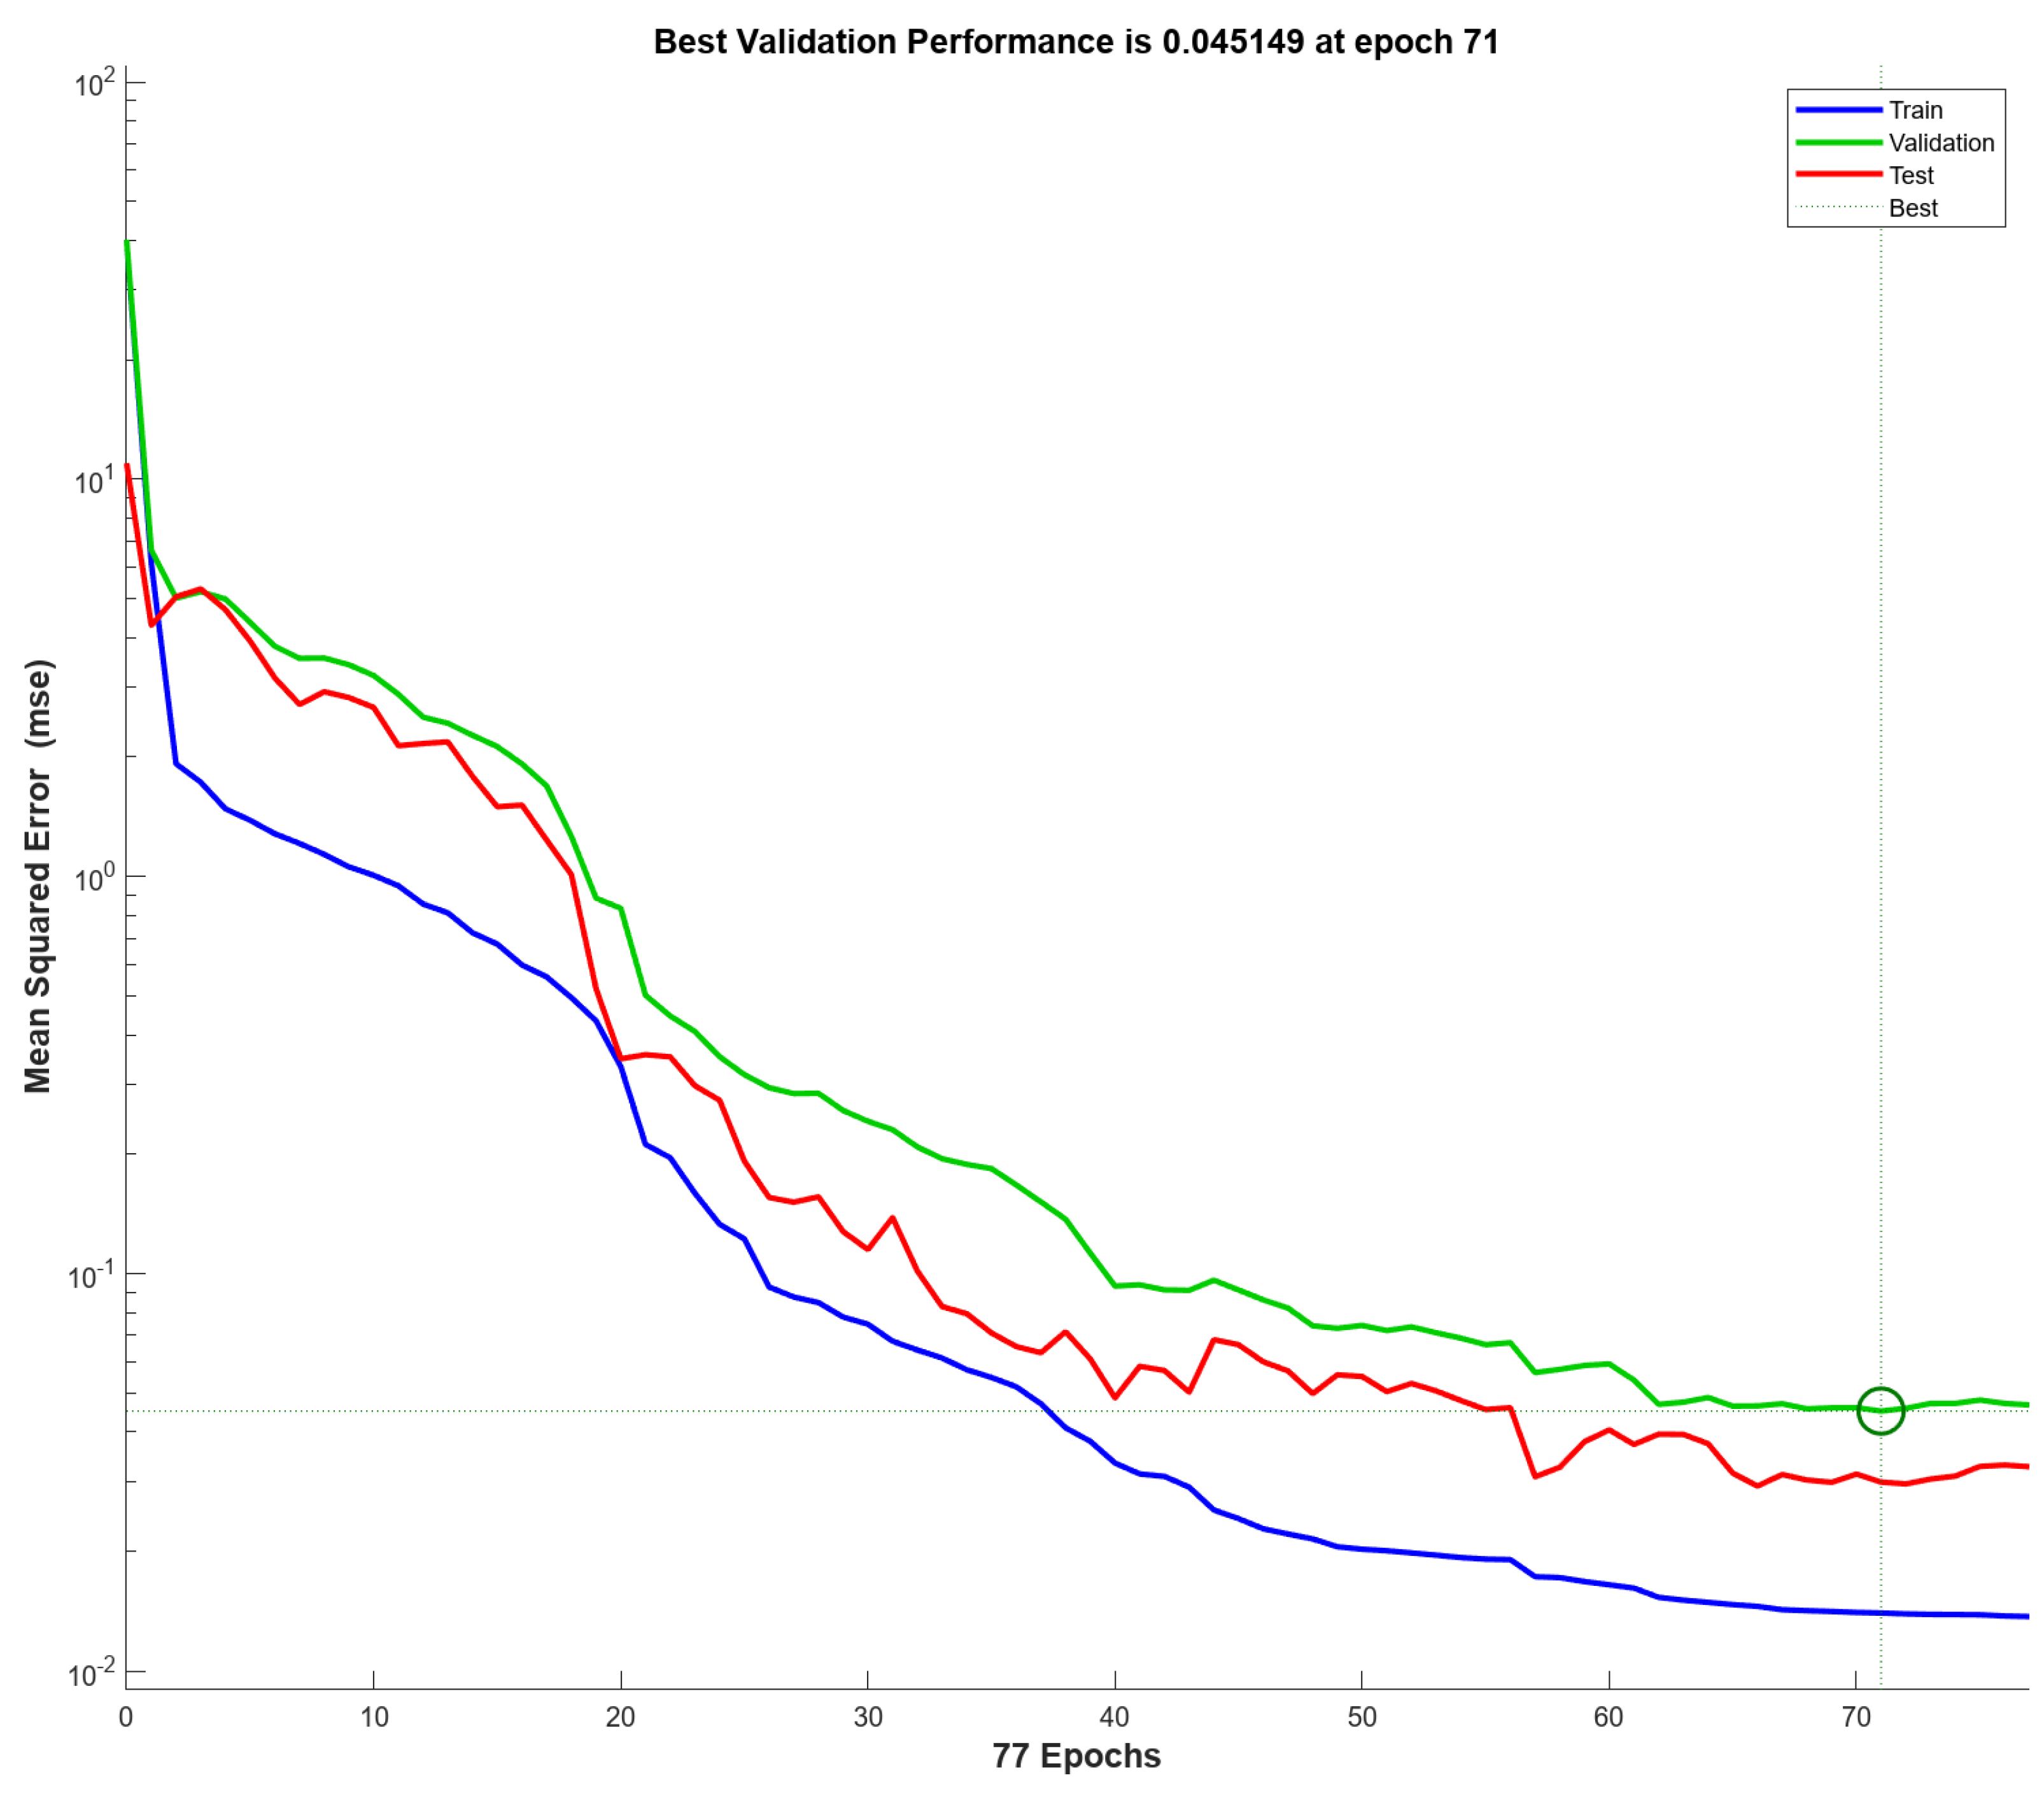
2.3. ANN Model According to Bayesian Regularisation (BR) Algorithm

Regarding developing the ANN model based on Bayesian regularisation training, five input variables and five hidden layers were considered to predict three output values of compressive strength, splitting tensile strength, and modulus of elasticity. This model was developed based on testing and training stages, as illustrated in Figure 7. As mentioned earlier, using the BR algorithm leads to a longer time for training, and training continued until epoch 375 confirming performance at epoch 118 with a negligible MSE of 0.0131 and 0.0466 for training and testing. The error histogram is shown in Figure 8. The error histogram displays no left or right skew, suggesting that the errors are unbiased. The outliers near the histogram’s edges are nearly zero, contributing to the model’s ability to generalise effectively without overfitting.
The regression plots in Figure 9 show that the R value for training and testing is 0.999, similar to LM, indicating a strong correlation between the input and output variables. The efficacy of the BR algorithm in training the ANN model was also evaluated and assessed based on the R values and errors for each feature, as presented in Table 5, confirming the model’s robustness in predicting CS, TS, and MoE.
Figure 10 illustrates the sensitivity analysis of BR-based ANN models. Both C R C A and C N A exhibit identical sensitivity indices, indicating that the model predicts similar impacts from these materials on the mechanical properties. The highest sensitivity is observed in the modulus of elasticity, suggesting that changes in aggregate type (recycled or natural) primarily affect the material’s elastic behaviour. Both 12 mm and 30 mm basalt fibres show identical sensitivity across all properties, with the highest impact on splitting tensile strength. It suggests that basalt fibres, regardless of the length, significantly enhance the tensile strength of the concrete, as mentioned in the sensitivity analysis of LR models. C C o a t shows the highest sensitivity in compressive strength and significant impacts on splitting tensile strength and modulus of elasticity. It indicates that the coated RCA applied to the concrete enhances compressive strength and overall stiffness [41].

2.4. ANN Model According to Scaled Conjugate Gradient (SCG) Training

ANN models based on the Scaled Conjugate Gradient algorithm are also developed using five input layers, five hidden layers, and three output sets. Like the LM model, 70%, 15%, and 15% of the datasets were incorporated for training, testing, and validation to prevent overfitting. As depicted in Figure 11, the optimal validation performance of the SCG model was observed at epoch 71 with an MSE value of 0.0451, while training continued until epoch 77. MSE for training and testing of the model was 0.0140 and 0.0299, with no significant difference among the two other algorithms of LM and BR. Similar to the models trained with both the BR and LM algorithms, the error histogram (Figure 12), exhibiting no left or right skew, suggests unbiased errors. Near-zero outliers at the histogram’s edges indicate that the model can generalise effectively without overfitting.
The R value for training, testing, and validation is 0.999, as shown in the regression plots in Figure 13. The R value approaching one and MSE nearing zero indicates that the SCG algorithm is well-suited for predicting the mechanical properties of SCGC based on the rates of RCA and treatment methods. Moreover, the model was evaluated according to the MSE, MAE, MAPE, and RMSE in Table 6, confirming the significant ability of the SCG method to train the ANN model to predict the mechanical properties of the SCGC samples according to the RCA replacement and treatment.
Figure 14 illustrates the results of the sensitivity analysis of the SCG-based ANN model. C R C A ’s impact on the modulus of elasticity is significant, suggesting that recycled aggregates primarily affect the concrete’s stiffness, which has been confirmed in the prior literature [35,36,37]. C N A exhibits high sensitivity across all measured properties, particularly in splitting tensile and compressive strength. Current studies indicate that natural aggregates significantly enhance strength [33,42,43,44,45] and elasticity [35,36,37]. B F 12 displays high sensitivity for both strength properties, indicating that basalt fibre enhances the material’s overall strength profile. Its influence on the modulus of elasticity, while not as high as its impact on strength, is still notable. C c o a t has a high impact on all three properties, particularly in enhancing the compressive strength and stiffness of the material. It suggests that the coating significantly improves the concrete’s structural integrity.

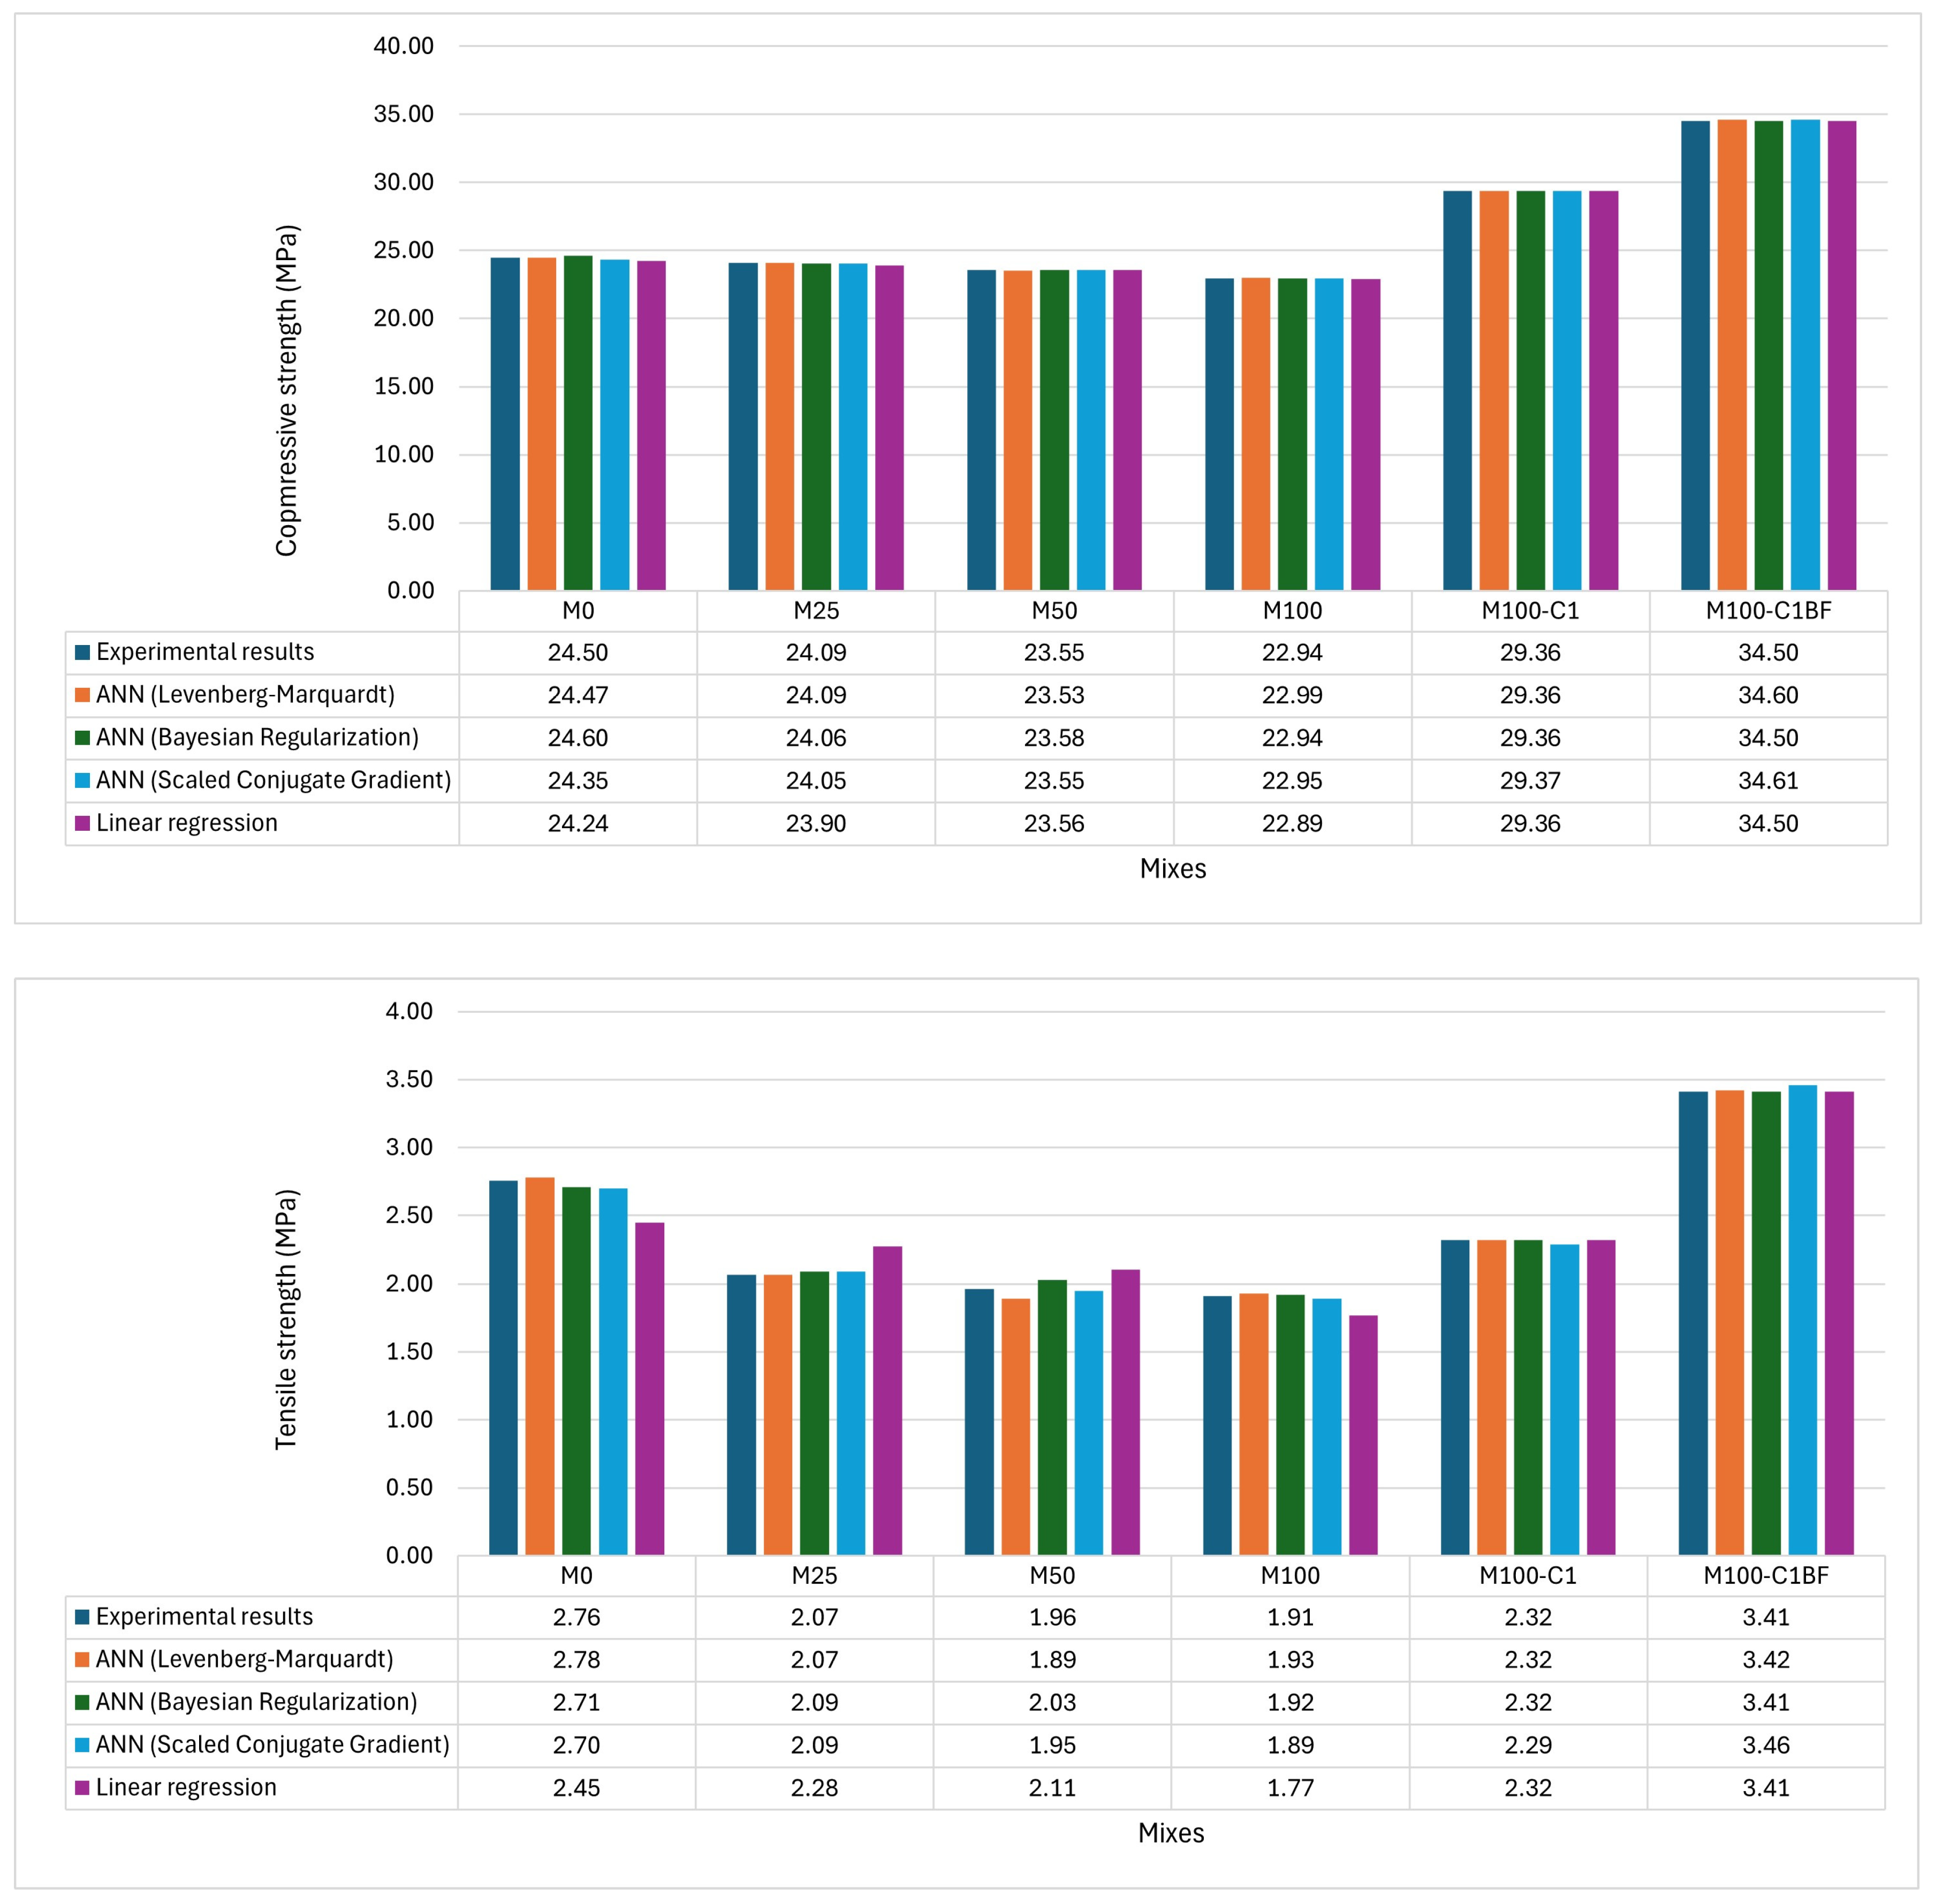
2.5. Performance Comparison of the Models

Previous sections discussed the performance of each model separately. This section compares the models according to the composite performance index (CPI) values calculated using Equation (2), as tabulated in Table 7. CPI unifies four (MSE, MAE, MAPE, and RMSE) errors among the predicted values and experimental results. All models were assessed and ranked based on CPI in Table 7, with rank 1 being the most effective model. Linear regression represents the poorest performance in predicting the mechanical properties of compression strength, tensile strength, and modulus of elasticity. Regarding the developed models for compressive strength, Bayesian regularisation was identified as the most effective ANN model, with a CPI value of 0, compared to CPI of 0.008, 0.194, and 1 for LM, SCG, and LR models, respectively, as shown in Table 7. Meanwhile, Levenberg–Marquardt is the top-performing ANN for predicting tensile strength and MoE, which is very close to the experimental counterparts, as shown in Figure 15.
Figure 15 compares the values predicted by linear regression, LM-, BR-, and SCG-based ANN models against the experimental results of compressive strength, tensile strength, and modulus of elasticity. The plot shows that all four models provide accurate predictions that closely match the experimental results for compressive strength, as confirmed in previous sections, with negligible errors and an R value close to 1 for compressive strength. The graphs comparing the models for predicting tensile strength indicate the accuracy of the three ANN models, which closely match the experimental results, confirmed by lower errors and an R value around 1. In contrast, the linear regression model’s predictions for tensile strength are not as accurate as those of the three ANN models. However, the R values and errors calculated for all tensile strength models in this research are within an acceptable range. The most significant difference among the models’ performance is observed in the graphs for the modulus of elasticity (MoE). The three ANN models demonstrate excellent performance, providing values very close to the experimental results, while the linear regression model performs poorly. This observation is supported by the unsatisfactory error values and an R value of 0.813 for the linear regression model, compared to 0.999 for all three ANN models.
All developed models were also compared using Taylor diagrams as depicted in Figure 16. The Taylor diagram uses three parameters of R2, RMSE, and standard deviation to compare the performance of the models [46]. Models were positioned on the graph according to their R2 value, RMSE, and standard deviation, and their performance was evaluated based on their distance from the experimental results, shown by a red square on the graphs. The closer a model is to its experimental values, the better its prediction performance. The BR-based ANN model (purple colour) is the closest to the red square, making it the best model for compressive strength prediction. For tensile strength, the yellow (SCG-based ANN) and blue (LM-based ANN) points are closest to the red square (experimental value). Therefore, the best models for tensile strength prediction are the LM and SCG-based ANN models. The blue point, representing the LM-based ANN model, is very close to the experimental results (red square), representing the excellent performance of this model in estimating the modulus of elasticity. These findings align with the CPI value analysis.

3. Materials and Methods

3.1. RCA-Based Self-Compacting Geopolymer Concrete

The geopolymer concrete used in this study is self-compacted concrete that can flow and compact by its weight without compaction. It is an ambient-cured geopolymer concrete that does not rely on a higher temperatures for the curing regime and can be cured at an ambient temperature of 23 ± 2 °C and 50% relative humidity, as recommended by AS 1012.8:1986 for ambient curing [47]. Mix M0 is a control mix cast following the research by Rahman and Al-Ameri [17], which is cement-free with binder materials of fly ash, micro fly ash, GGBS, and a solid alkali activator of sodium metasilicate (Na2SiO3), as shown in Table 8. The fly ash used in this research is Grade 1 fly ash in AS3582.1:2016, which meets the requirements of Class F fly ash with low calcium content in ACI C 618 [17]. RCA replaced 25%, 50%, and 100% of the coarse aggregates in mixes M25, M50, and M100, respectively. Due to the positive impact of treated RCA on concrete quality, such as improved compression and durability, as discussed by researchers [48,49,50,51], Mix M100-C1 contained coated RCA with geopolymer slurry, following the research by Nikmehr, Kafle, and Al-Ameri [41]. Hybrid lengths of basalt fibres, 12 mm and 30 mm, with the properties tabulated in Table 9, were incorporated into the mix M100-C1BF, which were reported as the optimum amount of basalt fibre in the research by Heweidak, Kafle, and Al-Ameri [40] for an SCGC cast using natural aggregates as the sole coarse aggregate component. Concrete mix design proportions for all mixes and geopolymer slurry are shown in Table 8. The chemical composition of binders is shown in Table 10.
The source of the RCA was demolished construction waste obtained from the local supplier of Daisy’s Garden Supplies, Geelong, VIC, Australia. The maximum coarse NA and RCA size is 14 mm with a similar gradation curve, as illustrated in Figure 17. The morphology of aggregates applied in this research is shown in Figure 18, highlighting the angular shape of all three types of coarse aggregates. The properties of the RCA and NA, including their moisture content for incorporation in the mixes, are tabulated in Table 11.

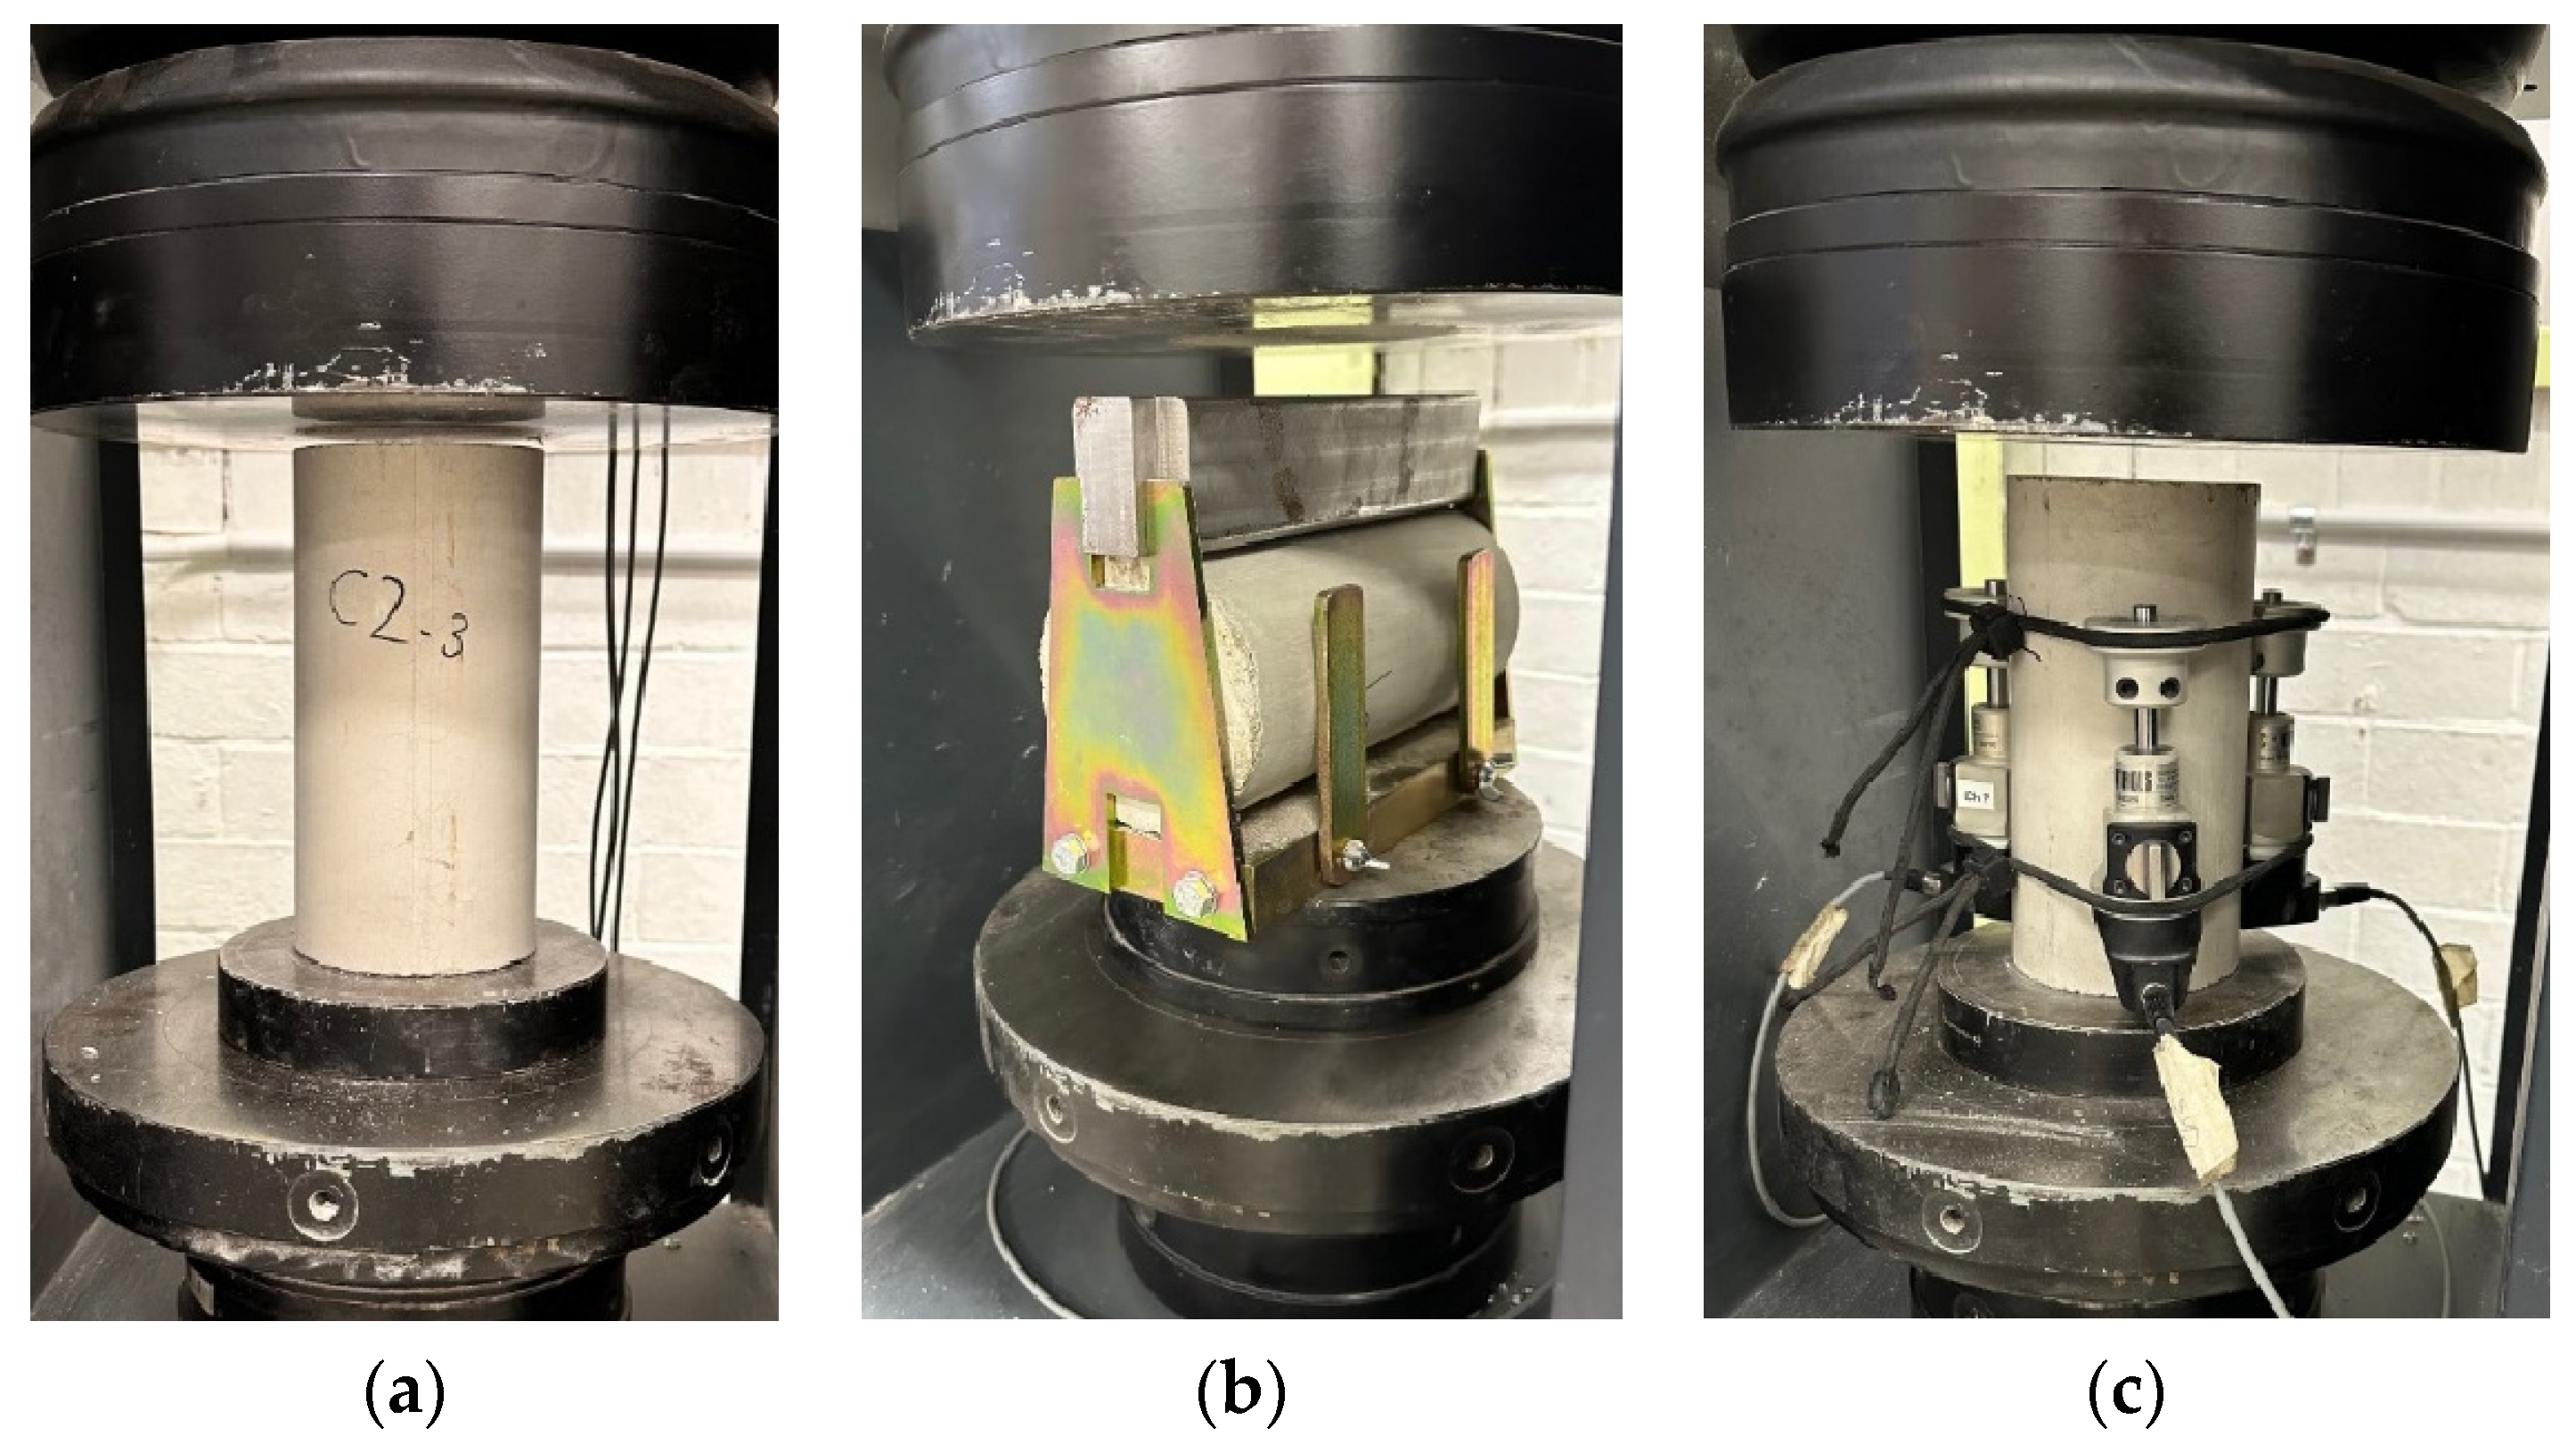
3.2. Experimental Investigation

Cylinder samples with a length of 200 mm and a diameter of 100 mm were considered for this study, following the code of AS 1012.8.1 [52]. Rheological properties of the SCGC mixes, including flowability, viscosity, and passing ability, were measured through the test methods of slump flow, T500, and J-ring tests following AS 1012.3.5:2015 [53] in compliance with the Australian code of TN 073 VicRoads: Self-compacting concrete (SCC) [54], as tabulated in Table 12.
After 28 days of ambient curing, samples from six mixes (M0, M25, M50, M100, M100-C1, and M100-C1BF) were assessed for compressive strength, tensile strength, and modulus of elasticity. Samples were tested for compressive strength using a 3000 kN compression testing device with a loading rate of 0.333 MPa/sec in compliance with AS 1012.9:2014 [55]. The load rate for the tensile strength test was 0.025 MPa/sec, and the tensile strength of the samples was measured based on AS 1012.10:2000 [56]. AS 1012.17:1997, Method 17: Determination of the static chord modulus of elasticity and Poisson’s ratio of concrete specimens [57] was followed for measuring the modulus of elasticity of the mixes. Test setups for the experimental phase of this research are illustrated in Figure 19.

3.3. Model Development

The database used to develop the ANN models (Table S1) included the compressive strength, splitting tensile strength, and modulus of elasticity of SCGC samples containing various rates of RCA replacement and treatment methods of coated RCA and BF. A total of 144 datasets were utilised for the development of each model. The goal is to have models that assess the effects of RCA rates and treatments on SCGC. Figure 20 depicts the correlation matrix of the relationships among the mix design parameters, highlighting that components such as binder content and fine aggregates, which are constant for all mixes, were excluded from model development. Hence, the influencing parameters in the tests include the coarse RCA content ( C R C A ) , NA content ( C N A ) , 12 mm BF content ( B F 12 ) , 30 mm BF content ( B F 30 ) , and treatment of coating RCA ( C C o a t ) . To distinguish between coated RCA and uncoated RCA, the incorporated RCA was converted to a numeric format, with 0 representing uncoated RCA and 1 representing coated RCA. So, 28-day compressive strength ( C S ) , tensile strength ( T S ) , and modulus of elasticity M o E were formulated as a function of the parameters below (Equation (1)):
g ( C S , T S , M o E ) = f ( C R C A , C N A , B F 12 , B F 30 , C c o a t )
Although ANN demonstrates excellent results in predicting the concrete’s properties with minimum computation, there are limitations in the requirement of a high amount of data for training and the effect of the RCA’s sources and mix design on the model’s accuracy. To develop an excellent prediction model using ANN, it is necessary to properly apply hyperparameters, namely weights, activation functions, number of hidden neurons, hidden layers, etc. [32]. Moreover, for an accurate and reliable model, the ratio of the number of the datasets to the number of variables should be higher than five [58,59]. According to the five variables mentioned above considered for model development, the ratio of the number of datasets to the number of variables is higher than five. However, due to the lack of additional literature on SCGC containing RCA [22], the model development can only be applied to the SCGC mix design reported in this study. The descriptive statistics of the input and output parameters for developing models are shown in Table 13. The histograms of input values are also shown in Figure 21 to demonstrate the precise data distribution [46].
The ANN model was developed to predict the compressive strength, splitting tensile strength, and modulus of elasticity of 28-day SCGC samples. The Neural Network Toolbox of MATLAB version: 23.2.0.2365128 (R2023b) [60] was used to develop ANN models. The accuracy of the ANN model is highly dependent on the model adjustments and the variables. Various variables must be modified and confirmed to ensure the accuracy of the ANN model outcomes. Moreover, the number of hidden layers and the training methods influence the accuracy of ANN models. This research used the training methods of Levenberg–Marquardt (LM), Bayesian regularisation (BR), and Scaled Conjugate Gradient (SCG) for ANN model development. Neural Network Toolbox provides the possibility of configuring the ANN’s architecture in terms of the number of layers and neurons in each layer, making it possible to design the ANN network based on the dataset properties. The model architecture is illustrated in Figure 22, with five input variables (features) and three outputs. The layer size value is set to five, indicating the number of hidden neurons.
This tool provides three training backpropagation algorithms for updating weight and bias quantities: (1) Levenberg–Marquardt (LM) is the quickest method, but it needs more memory than the other techniques. (2) Bayesian regularisation (BR), is ideal for noisy and small datasets, which makes it suitable for generalisation, although it takes more time. (3) Scaled Conjugate Gradient (SCG) is a memory-efficient algorithm that is suitable for large datasets [60]. This research applied all three algorithms for training and developing ANN models to conclude which algorithm provides the most accurate model for this research’s dataset. An amount of 70% of the dataset was used for training, with 15% allocated to each of the testing and validation datasets to prevent overfitting. Previous researchers also applied a pattern of 70%–15%–15% for training, testing, and validating the models [24,25]. SPSS software version: 29.0.0.0 (241) [61] was used to develop the linear regression models using a similar dataset.
The performance of each model was evaluated according to the statistical measures, including linear coefficient correlation (R), Mean Squared Error (MSE), Mean Absolute Error (MAE), Mean Absolute Percentage Error (MAPE), and Root Mean Square Error (RMSE) aiming to assess the accuracy of the models. The formula for each feature is obtained from Cook, Lapeyre, and Kumar [62] and presented in Table 14.
To evaluate the performance of the developed models and to compare them, four types of errors were unified into a composite performance index (CPI), as can be seen in Equation (2) [62,63]:
C P I = 1 N j = 1 j = N P j P m i n , j P m a x , j P m i n , j
where N (=4) is the total number of errors for the evaluation of the performance for each model, P j is the amount of the jth error, and P m i n , j and P m a x , j are the minimum and maximum amounts of the jth across the four errors calculated by the models. The range of the CPI would be between 0 and 1, where the lowest value would indicate the worst model, and 1 represents the best model for predicting in terms of the overall four errors. In this research, three ANN models and a linear regression model were ranked from worst to best in terms of predicting compressive strength, tensile strength, and modulus of elasticity according to the CPI. Moreover, the performance of the models was compared using the Taylor diagrams developed with the software Origin 2023b [64].

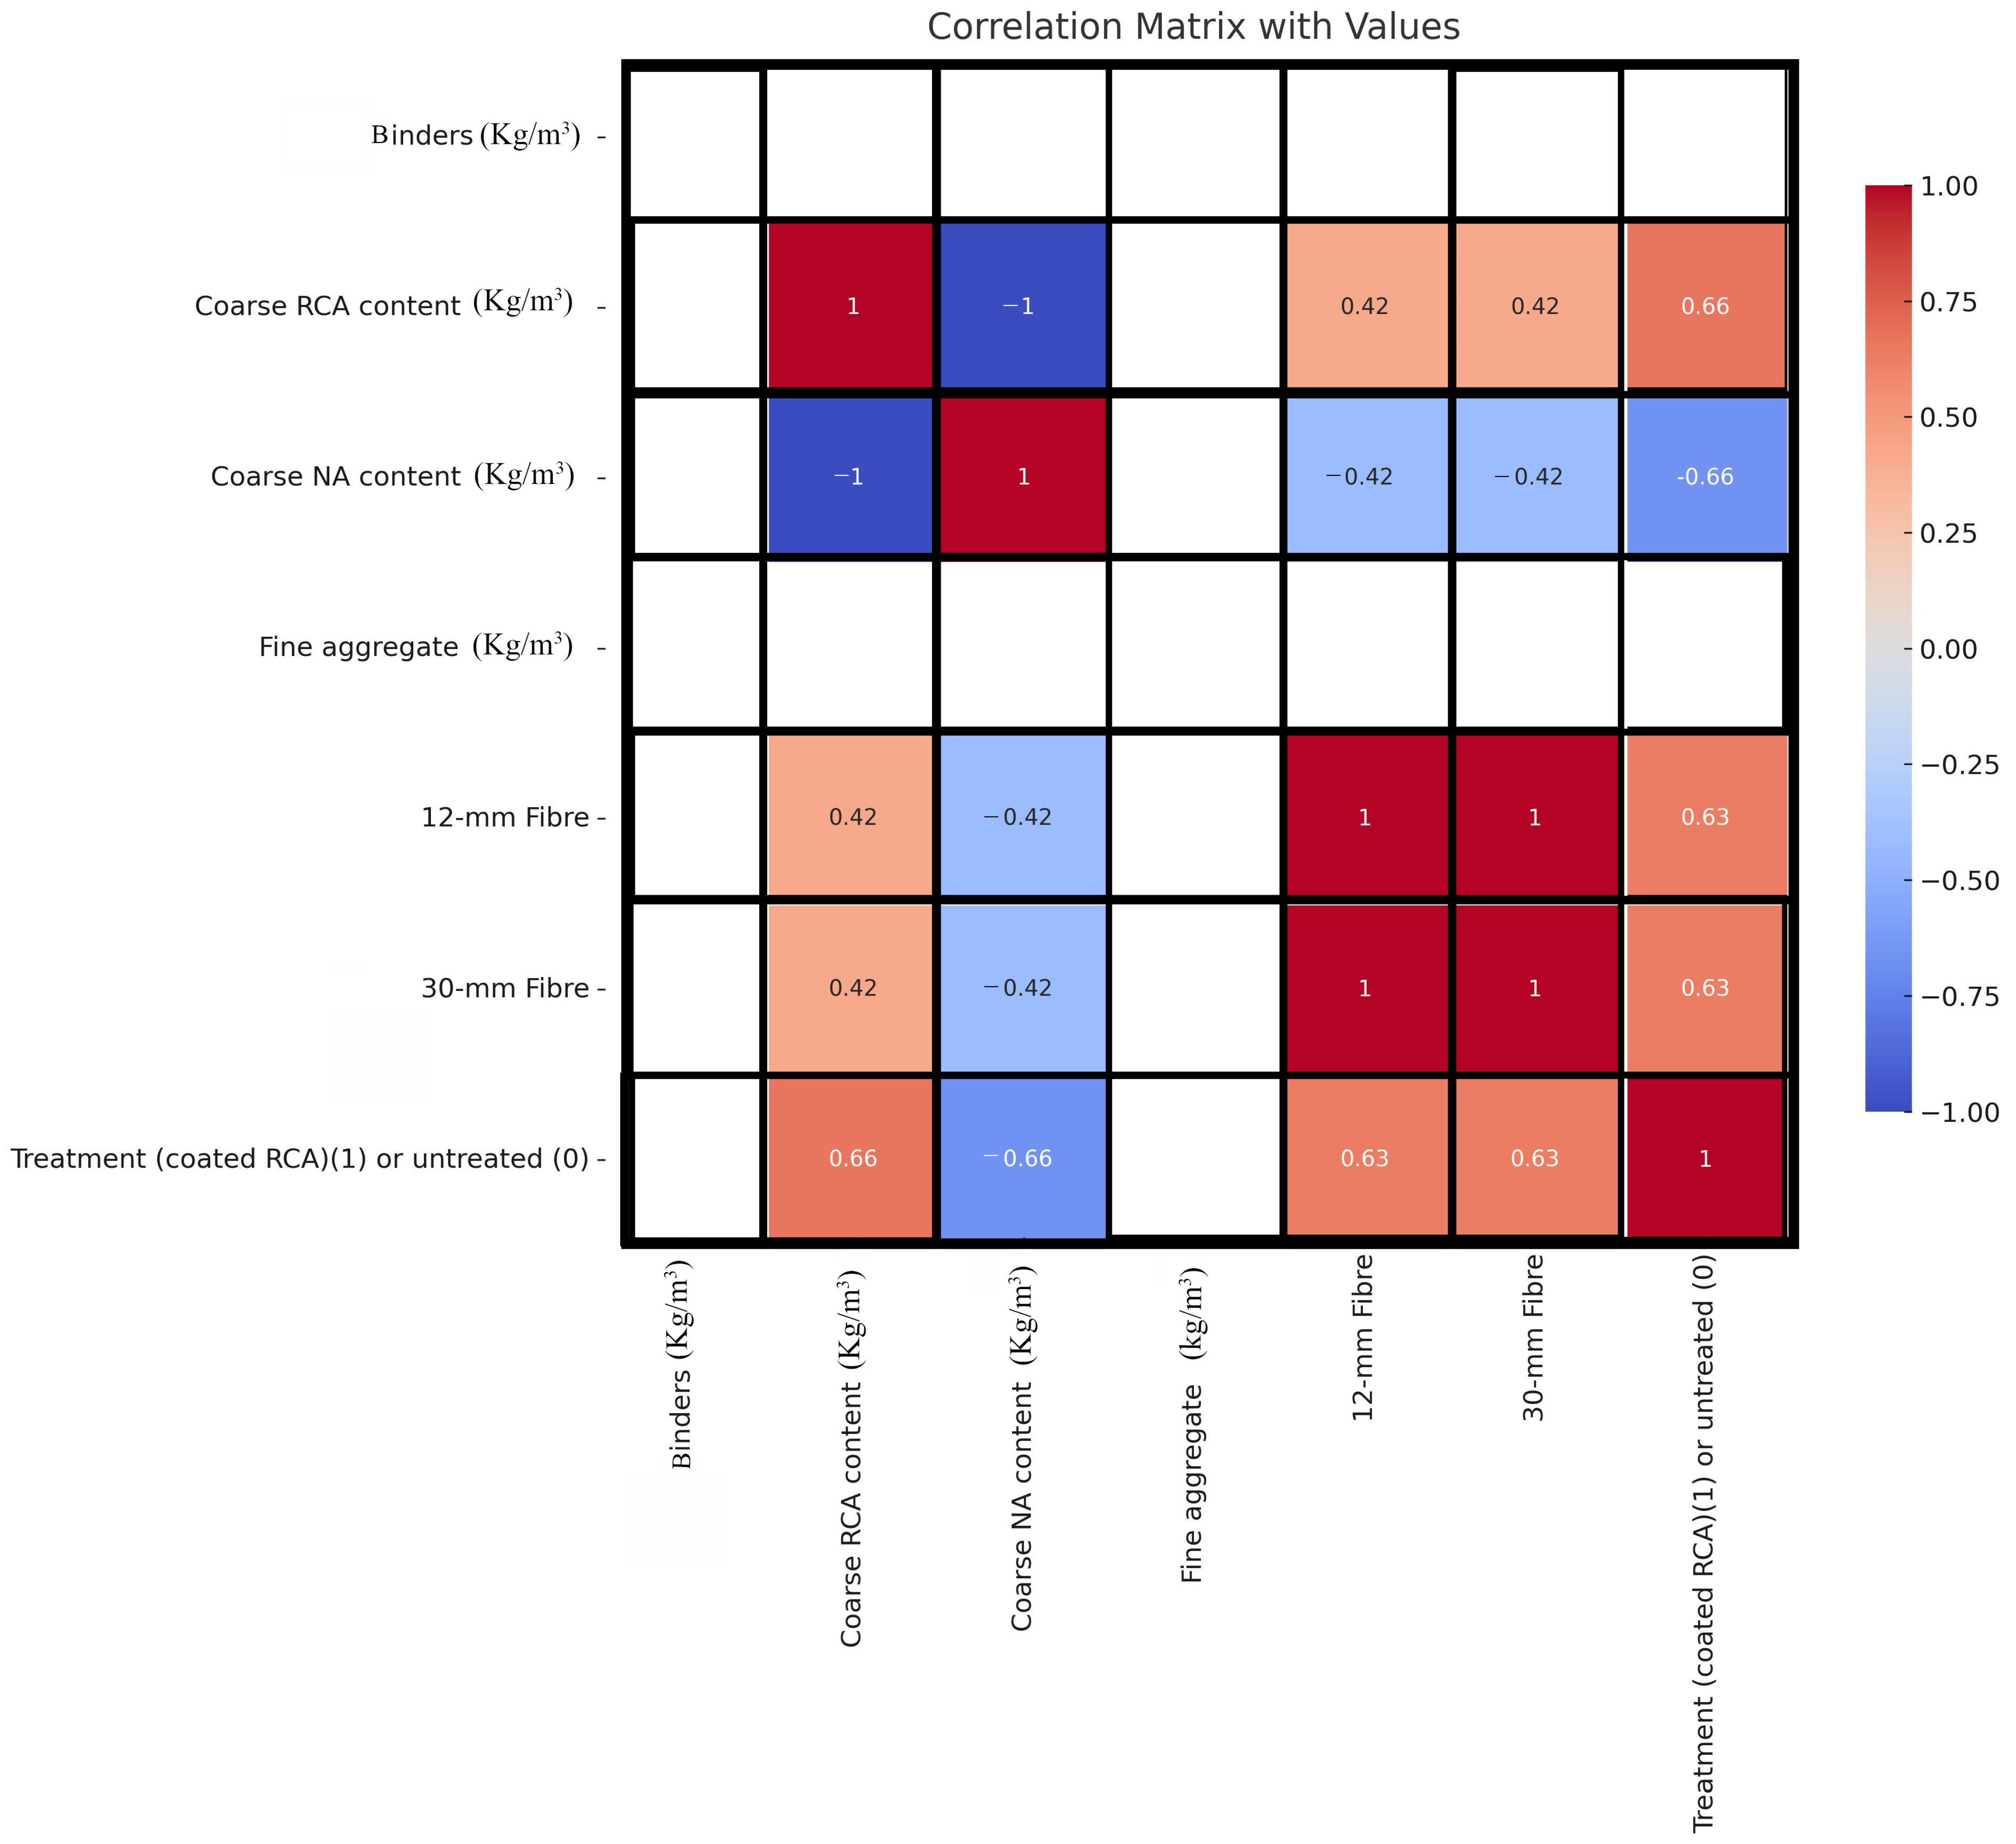
3.4. Sensitivity Analysis

Another way to analyse the models is to determine how input variable modifications impact the model’s predicted value. A sensitivity analysis may be conducted to achieve this aim. The sensitivity index (SI) demonstrates how each variable affects the models’ performance. For each input variable, SI can be calculated using Equations (3) and (4) [65]:
P i = f m a x x i f m i n ( x i )
S I i % = P i i = 1 n P i × 100
where f m a x ( x i ) and f m i n ( x i ) are the maximum and minimum predicted results for the ith input variable, while other variables remain constant at their mean values; n represents the number of variables in the model. A higher SI index shows that the corresponding variable has more impact on the output than a lower SI, which indicates that the lower values are not significant variables.

4. Conclusions

This research contributed to the enhancement of recycled construction materials, specifically concrete waste, by developing models to optimise the appropriate amount of recycled concrete aggregates (RCAs) for casting self-compacting geopolymer concrete. To achieve this, Artificial Neutral Network (ANN) models were compared with linear regression models to predict the mechanical properties of self-compacting geopolymer concrete, taking into account the rate and treatment of the RCA. The studied mechanical properties of the geopolymer concrete include compressive strength, splitting tensile strength, and modulus of elasticity. Each property is modelled using a linear regression method and three distinct ANN models trained with the algorithms of Levenberg–Marquardt (LM), Bayesian regularisation (BR), and Scaled Conjugate Gradient (SCG). The aim is to assess the capabilities of these models for predicting the 28-day hardened properties of geopolymer concrete against actual experimental results for various RCAs’ rates and treatment. The input parameters for developing the models included coarse RCA content (CRCA), coarse natural aggregates content (CNA), 12-mm basalt fibre content (BF12), 30-mm basalt fibre content (BF30), coated or uncoated RCA (CCoat), and g(CS, TS, MoE), which is the output of the models. Statistical evaluation highlights the robustness of ANN-based models in achieving precise predictions, resulting in the following conclusions:
  • Three ANN-based models demonstrate superior predictions, with R values close to 1, compared to the linear regression model, indicating closer agreement with experimentally reported compressive strength, tensile strength, and modulus of elasticity across various amounts of RCA and treatment incorporations. Hence, ANN models play a crucial role in enhancing the use of recycled concrete aggregate in self-compacted geopolymer concrete, achieving optimal mechanical properties;
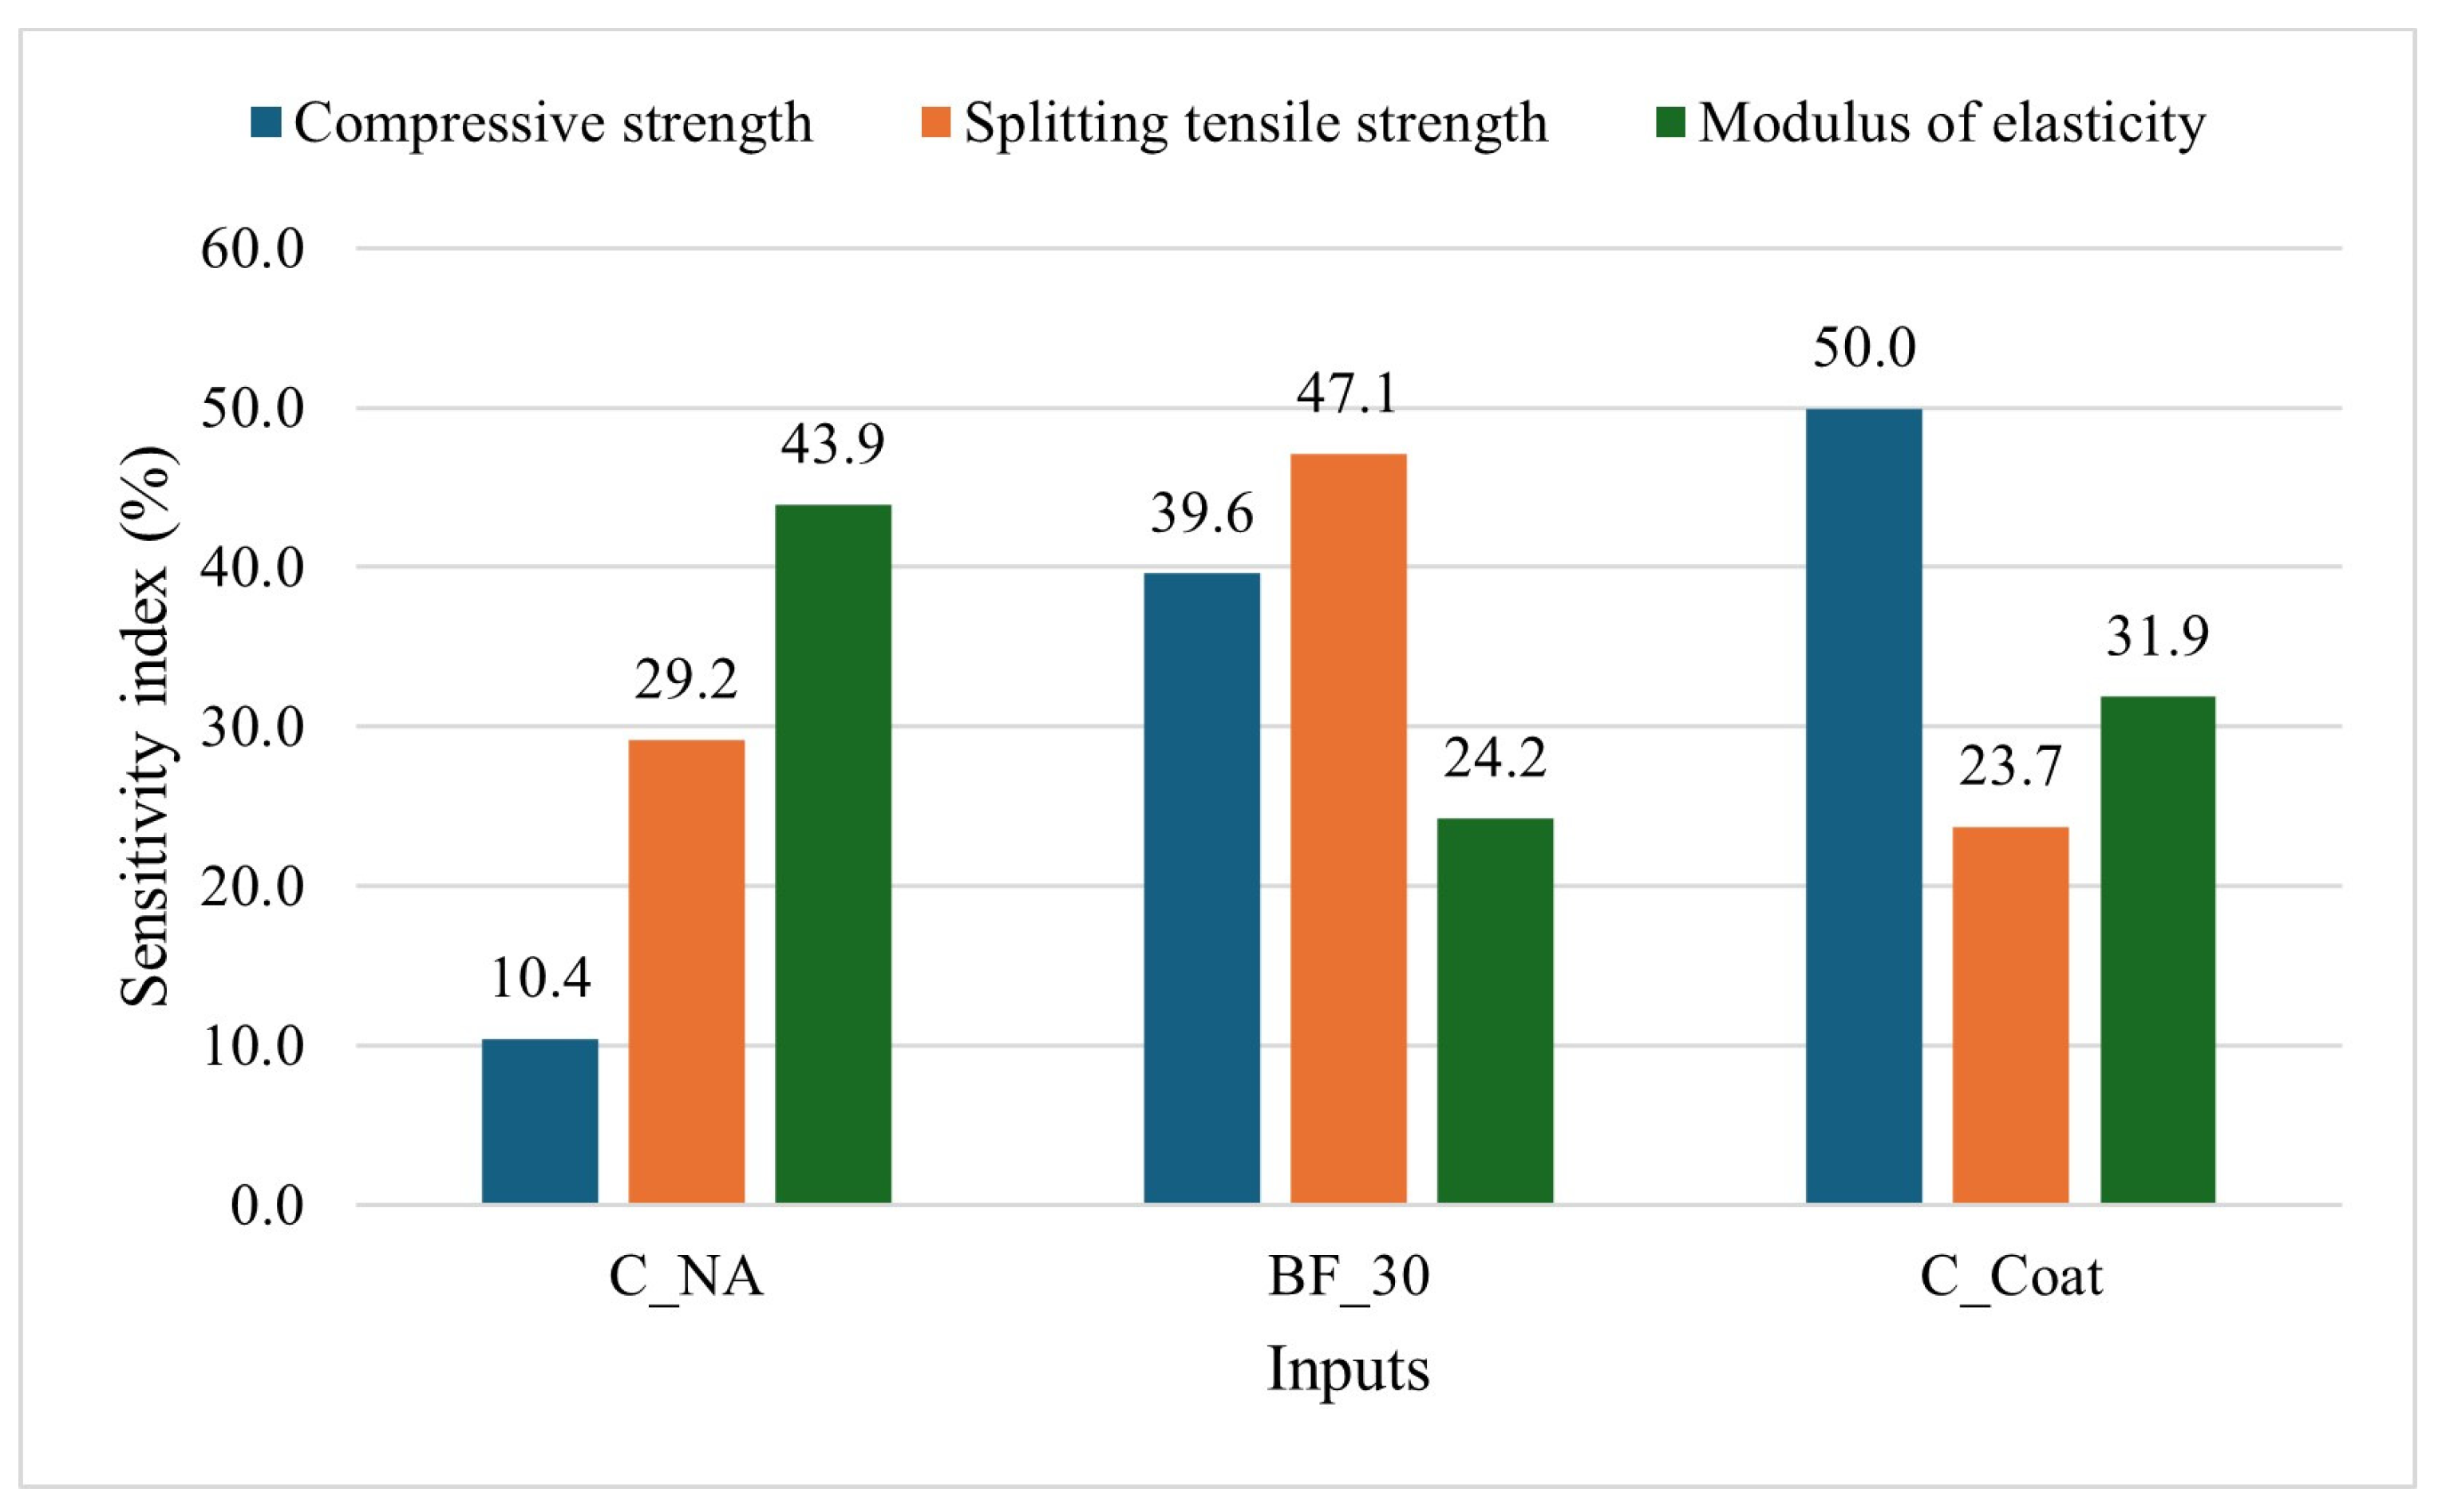
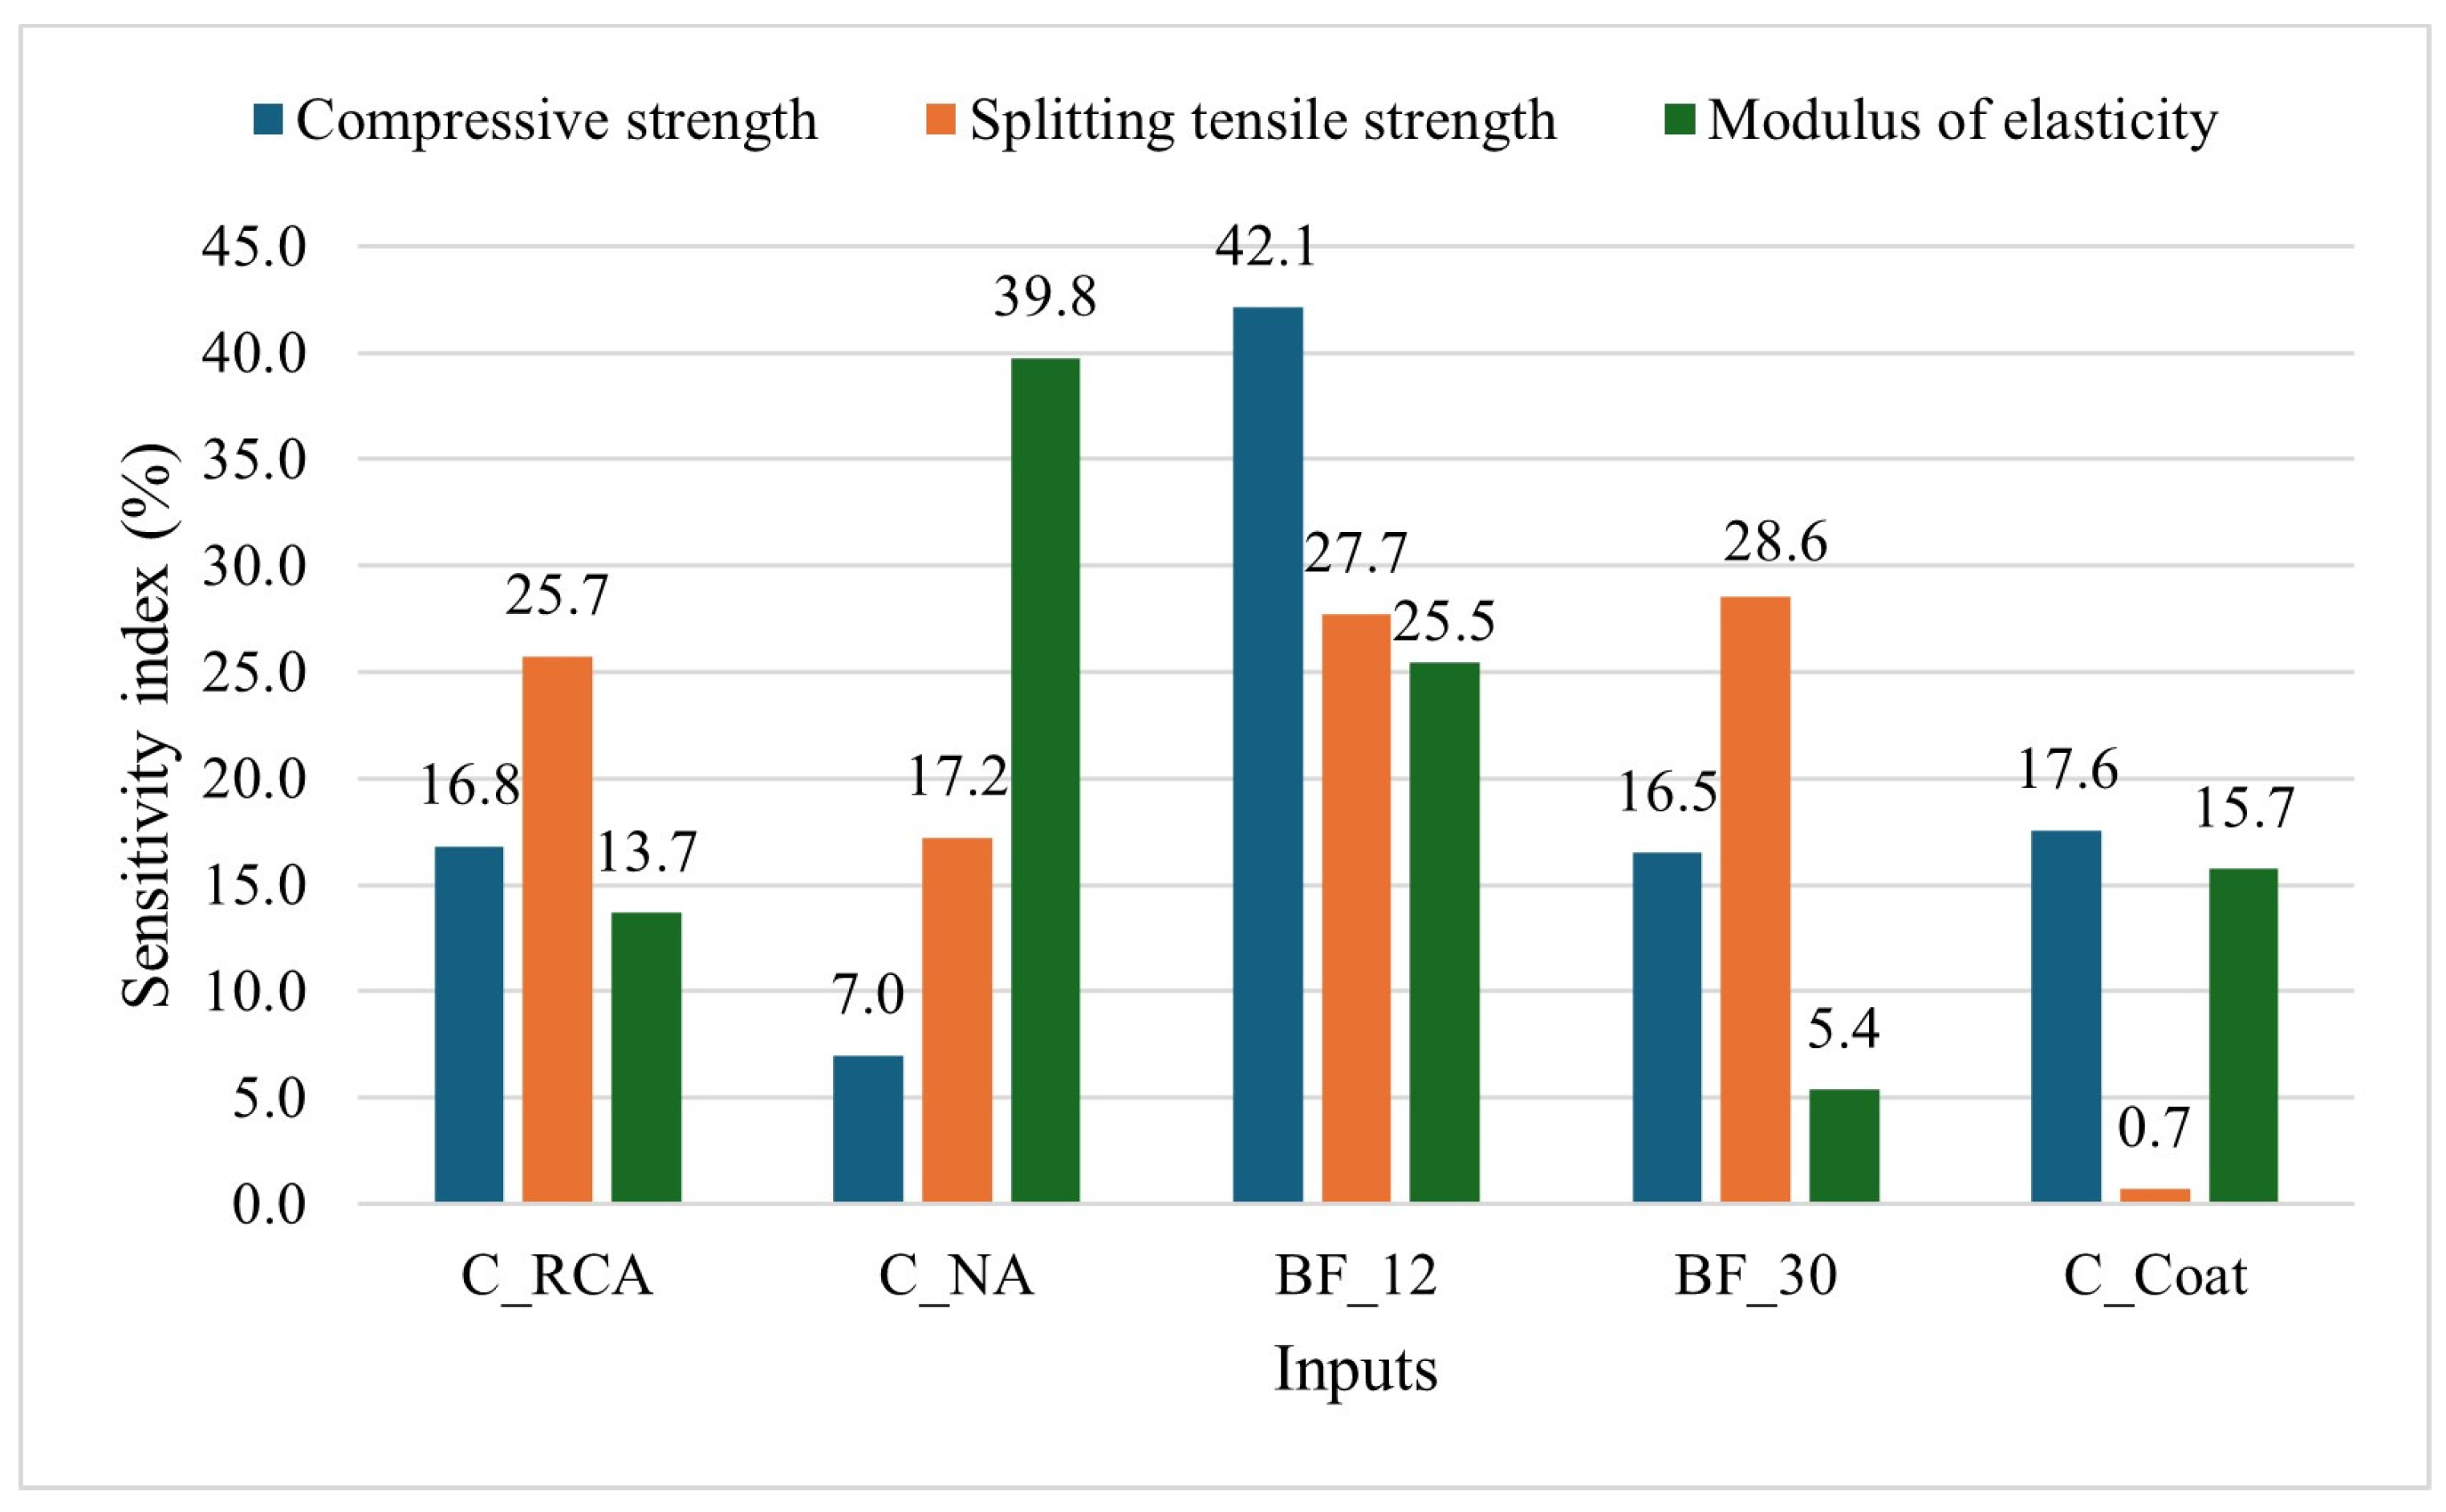
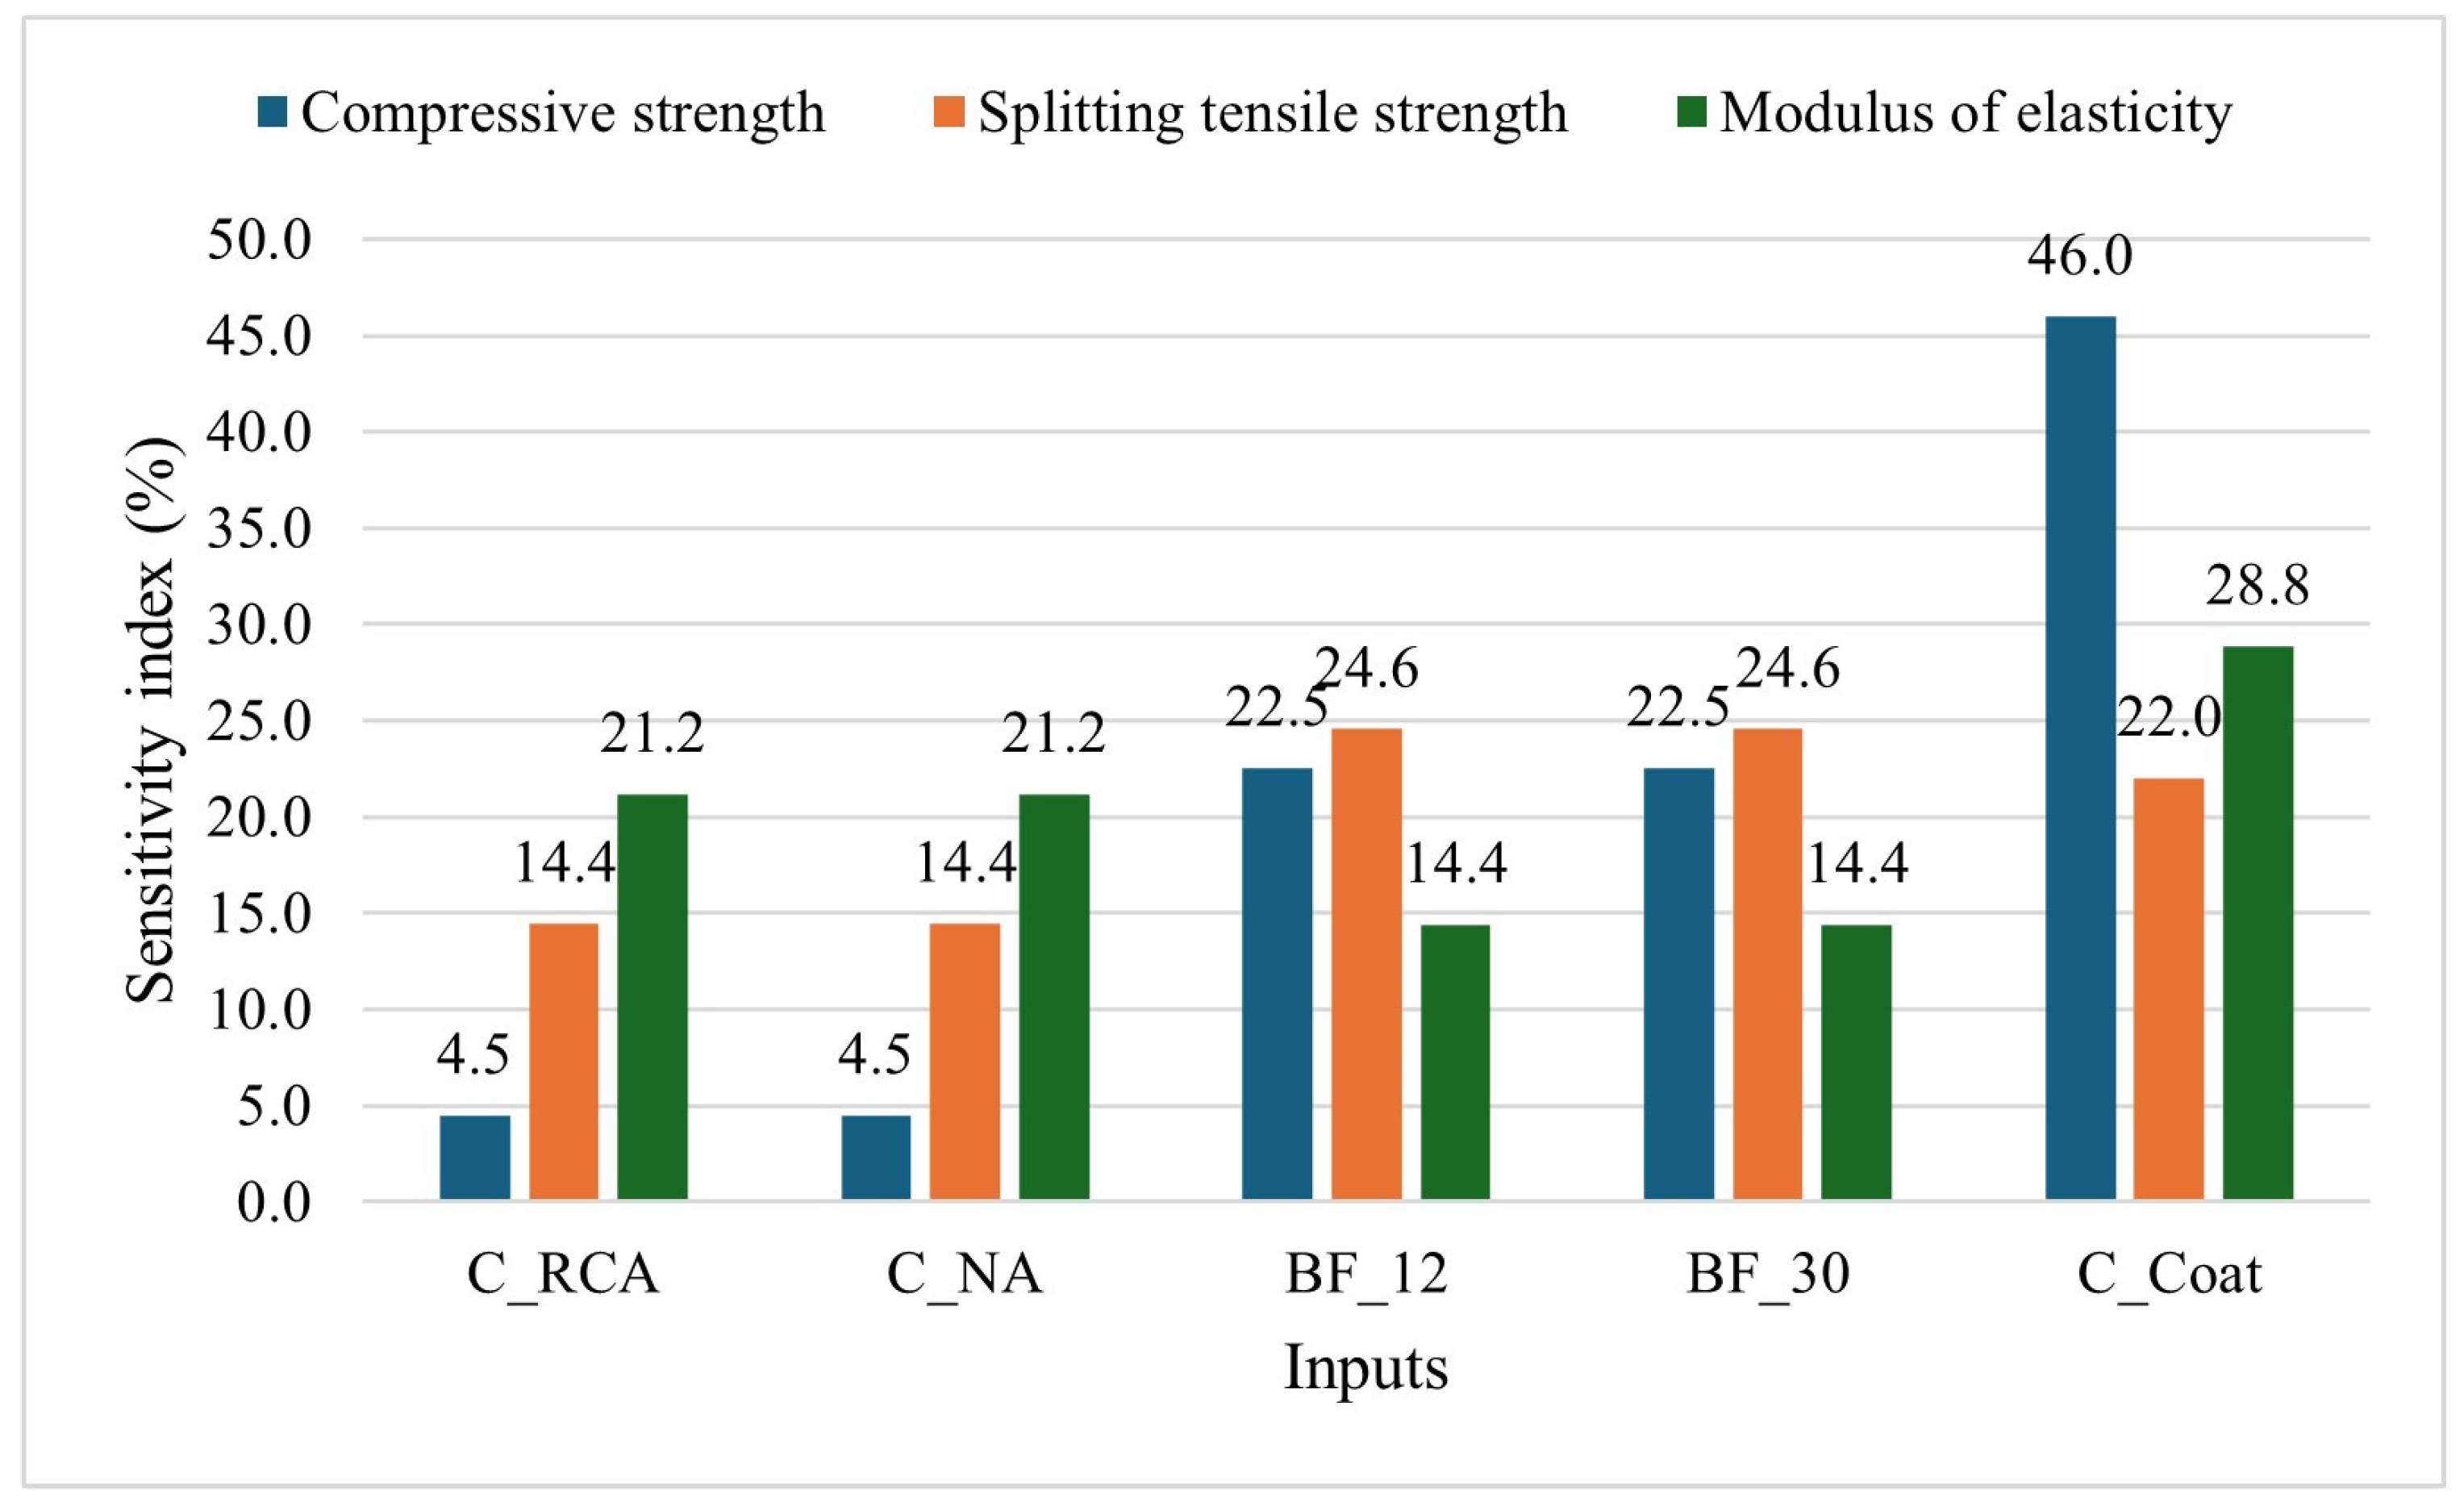
  • Sensitivity analysis was performed to study the impact of each input variable on g ( C S , T S , M o E ) , indicating that the LR-based ANN model for predicting compressive strength, tensile strength, and MoE is 50%, 47.1%, and 43.9% sensitive to C C o a t , B F 30 , and C N A , respectively. The ANN model trained with the LM algorithm represents sensitivities of 42.1%, 28.6%, and 39.8% to B F 12 ,   B F 30 , and C N A for compressive strength, splitting tensile strength, and modulus of elasticity estimations. The BR-based ANN model is highly sensitive to C C o a t for compressive strength and modulus of elasticity predictions, with sensitivity indexes of 46% and 28.8%, respectively, while for tensile strength, it is equally sensitive to both B F 12 and B F 30 each with a 24.6% sensitivity index. The SCG-based ANN model is sensitive to C N A and C R C A  by 31.4% and 29.1% for compressive strength and modulus of elasticity predictions, respectively. For tensile strength predictions, it is approximately 36% sensitive to 12-mm and 30-mm basalt fibres;
  • The BR-based ANN model outperformed the LM- and SCG-based ANN models in predicting the compressive strength of geopolymer concrete samples with various RCA rates and treatments;
  • The BR- and SCG-based ANN models were surpassed by the LM-based ANN model, demonstrating more accurate predictions for the splitting tensile strength and modulus of elasticity of SCGC samples cast with different replacement rates of treated and untreated RCA.

Supplementary Materials

The following supporting information can be downloaded at https://www.mdpi.com/article/10.3390/recycling9050073/s1. Table S1: Database for model development.

Author Contributions

Methodology, software, formal analysis, investigation, visualisation, writing—original draft preparation: B.N.; supervision, writing—review and editing: R.A.-A. and B.K. All authors have read and agreed to the published version of the manuscript.

Funding

This research received no external funding.

Data Availability Statement

Data are contained within the article and Supplementary Materials.

Acknowledgments

The authors recognise Deakin University’s valuable support for this study. The provision of binding materials by Fly Ash Australia (micro fly ash) and Independent Cement (GGBS) is also acknowledged with gratitude.

Conflicts of Interest

The authors declare no conflicts of interest.

References

  1. Akhtar, A.; Sarmah, A.K. Construction and demolition waste generation and properties of recycled aggregate concrete: A global perspective. J. Clean. Prod. 2018, 186, 262–281. [Google Scholar] [CrossRef]
  2. Pickin, J.; Wardle, C.; O’Farrell, K.; Stovell, L.; Nyunt, P.; Guazzo, S.; Lin, Y.; Caggiati-Shortell, G.; Chakma, P.; Edwards, C. National Waste Report 2022. Available online: https://www.dcceew.gov.au/sites/default/files/documents/national-waste-report-2022.pdf (accessed on 27 August 2024).
  3. Ajayi, S.O.; Oyedele, L.O.; Akinade, O.O.; Bilal, M.; Owolabi, H.A.; Alaka, H.A.; Kadiri, K.O. Reducing waste to landfill: A need for cultural change in the UK construction industry. J. Build. Eng. 2016, 5, 185–193. [Google Scholar] [CrossRef]
  4. Purchase, C.K.; Al Zulayq, D.M.; O’Brien, B.T.; Kowalewski, M.J.; Berenjian, A.; Tarighaleslami, A.H.; Seifan, M. Circular economy of construction and demolition waste: A literature review on lessons, challenges, and benefits. Materials 2021, 15, 76. [Google Scholar] [CrossRef] [PubMed]
  5. Nikmehr, B.; Hosseini, M.R.; Wang, J.; Chileshe, N.; Rameezdeen, R. BIM-Based Tools for Managing Construction and Demolition Waste (CDW): A Scoping Review. Sustainability 2021, 13, 8427. [Google Scholar] [CrossRef]
  6. Tam, V.W.Y. Economic comparison of concrete recycling: A case study approach. Resour. Conserv. Recycl. 2008, 52, 821–828. [Google Scholar] [CrossRef]
  7. Wang, B.; Yan, L.; Fu, Q.; Kasal, B. A Comprehensive Review on Recycled Aggregate and Recycled Aggregate Concrete. Resour. Conserv. Recycl. 2021, 171, 105565. [Google Scholar] [CrossRef]
  8. Davidovits, J. Geopolymers. J. Therm. Anal. 1991, 37, 1633–1656. [Google Scholar] [CrossRef]
  9. Matějková, P.; Matějka, V.; Sabovčík, T.; Gryžbon, L.; Vlček, J. Alkali Activation of Ground Granulated Blast Furnace Slag and Low Calcium Fly Ash Using “One-Part” Approach. J. Sustain. Metall. 2022, 8, 511–521. [Google Scholar] [CrossRef]
  10. Zhang, H.Y.; Liu, J.C.; Wu, B. Mechanical properties and reaction mechanism of one-part geopolymer mortars. Constr. Build. Mater. 2021, 273, 121973. [Google Scholar] [CrossRef]
  11. Wan-En, O.; Yun-Ming, L.; Cheng-Yong, H.; Abdullah, M.M.A.B.; Li, L.Y.; Ho, L.N.; Loong, F.K.; Shee-Ween, O.; Hui-Teng, N.; Yong-Sing, N.; et al. Comparative mechanical and microstructural properties of high calcium fly ash one-part geopolymers activated with Na2SiO3-anhydrous and NaAlO2. J. Mater. Res. Technol. 2021, 15, 3850–3866. [Google Scholar] [CrossRef]
  12. Zhou, S.; Ma, C.; Long, G.; Xie, Y. A novel non-Portland cementitious material: Mechanical properties, durability and characterization. Constr. Build. Mater. 2020, 238, 117671. [Google Scholar] [CrossRef]
  13. Tesanasin, T.; Suksiripattanapong, C.; Van Duc, B.; Tabyang, W.; Phetchuay, C.; Phoo-ngernkham, T.; Sukontasukkul, P.; Chindaprasirt, P. Engineering properties of marginal lateritic soil stabilized with one-part high calcium fly ash geopolymer as pavement materials. Case Stud. Constr. Mater. 2022, 17, e01328. [Google Scholar] [CrossRef]
  14. Wan-En, O.; Yun-Ming, L.; Cheng Yong, H.; Li-Ngee, H.; Al Bakri Abdullah, M.M.; Shee-Ween, O.; Sandu, A.V. Effect of Sodium Aluminate on the Fresh and Hardened Properties of Fly Ash-Based One-Part Geopolymer. Arch. Metall. Mater. 2022, 67, 441–445. [Google Scholar] [CrossRef]
  15. Cong, P.; Mei, L. Using silica fume for improvement of fly ash/slag based geopolymer activated with calcium carbide residue and gypsum. Constr. Build. Mater. 2021, 275, 122171. [Google Scholar] [CrossRef]
  16. Samarakoon, M.H.; Ranjith, P.G.; Hui Duan, W.; Chen, B.K.; Khandelwal, M. Early age properties of alkali-activated cement and class G cement under different saturation conditions in oil well applications. Constr. Build. Mater. 2021, 271, 121543. [Google Scholar] [CrossRef]
  17. Rahman, S.K.; Al-Ameri, R. A newly developed self-compacting geopolymer concrete under ambient condition. Constr. Build. Mater. 2021, 267, 121822. [Google Scholar] [CrossRef]
  18. Rahman, S.K.; Al-Ameri, R. Marine Geopolymer Concrete—A Hybrid Curable Self-Compacting Sustainable Concrete for Marine Applications. Appl. Sci. 2022, 12, 3116. [Google Scholar] [CrossRef]
  19. Pang, L.; Liu, Z.; Wang, D.; An, M. Review on the Application of Supplementary Cementitious Materials in Self-Compacting Concrete. Crystals 2022, 12, 180. [Google Scholar] [CrossRef]
  20. Okrajnov-Bajić, R.; Vasović, D. Self-compacting concrete and its application in contemporary architectural practice. Spatium 2009, 20, 28–34. [Google Scholar] [CrossRef]
  21. Nikmehr, B.; Al-Ameri, R.; Kafle, B. Structural Performance of Geopolymer Concrete with Recycled Concrete Aggregate: A review. In Proceedings of the 3rd International Conference on Structural Engineering Research (iCSER-2022), Sydney, Australia, 27–30 November 2022. [Google Scholar]
  22. Nikmehr, B.; Al-Ameri, R. A State-of-the-Art Review on the Incorporation of Recycled Concrete Aggregates in Geopolymer Concrete. Recycling 2022, 7, 51. [Google Scholar] [CrossRef]
  23. Salimbahrami, S.R.; Shakeri, R. Experimental investigation and comparative machine-learning prediction of compressive strength of recycled aggregate concrete. Soft Comput. 2021, 25, 919–932. [Google Scholar] [CrossRef]
  24. Suescum-Morales, D.; Salas-Morera, L.; Jiménez, J.R.; García-Hernández, L. A novel artificial neural network to predict compressive strength of recycled aggregate concrete. Appl. Sci. 2021, 11, 11077. [Google Scholar] [CrossRef]
  25. Amiri, M.; Hatami, F. Prediction of mechanical and durability characteristics of concrete including slag and recycled aggregate concrete with artificial neural networks (ANNs). Constr. Build. Mater. 2022, 325, 126839. [Google Scholar] [CrossRef]
  26. Rizvon, S.S.; Jayakumar, K. Strength prediction models for recycled aggregate concrete using Random Forests, ANN and LASSO. J. Build. Pathol. Rehabil. 2022, 7, 5. [Google Scholar] [CrossRef]
  27. Rahman, S.K.; Al-Ameri, R. Structural assessment of Basalt FRP reinforced self-compacting geopolymer concrete using artificial neural network (ANN) modelling. Constr. Build. Mater. 2023, 397, 132464. [Google Scholar] [CrossRef]
  28. Rahman, S.K.; Al-Ameri, R. Experimental and Artificial Neural Network-Based Study on the Sorptivity Characteristics of Geopolymer Concrete with Recycled Cementitious Materials and Basalt Fibres. Recycling 2022, 7, 55. [Google Scholar] [CrossRef]
  29. Tam, V.W.Y.; Butera, A.; Le, K.N.; Silva, L.C.F.D.; Evangelista, A.C.J. A prediction model for compressive strength of CO2 concrete using regression analysis and artificial neural networks. Constr. Build. Mater. 2022, 324, 126689. [Google Scholar] [CrossRef]
  30. Nunez, I.; Marani, A.; Flah, M.; Nehdi, M.L. Estimating compressive strength of modern concrete mixtures using computational intelligence: A systematic review. Constr. Build. Mater. 2021, 310, 125279. [Google Scholar] [CrossRef]
  31. Vapnik, V. The Nature of Statistical Learning Theory; Springer: New York, NY, USA, 2013. [Google Scholar]
  32. Chopra, P.; Sharma, R.K.; Kumar, M. Prediction of Compressive Strength of Concrete Using Artificial Neural Network and Genetic Programming. Adv. Mater. Sci. Eng. 2016, 2016, 7648467. [Google Scholar] [CrossRef]
  33. Ayub, T.; Mahmood, W.; Khan, A.-R. Durability performance of SCC and SCGC containing recycled concrete aggregates: A comparative study. Sustainability 2021, 13, 8621. [Google Scholar] [CrossRef]
  34. Waqas, R.M.; Butt, F.; Danish, A.; Alqurashi, M.; Mosaberpanah, M.A.; Masood, B.; Hussein, E.E. Influence of Bentonite on Mechanical and Durability Properties of High-Calcium Fly Ash Geopolymer Concrete with Natural and Recycled Aggregates. Materials 2021, 14, 7790. [Google Scholar] [CrossRef] [PubMed]
  35. Al-Jaberi, L.; Al-Saraj, A.-S.K.W.; Al-Serai, A.-S.J.S. Scanning Electron Microscopy of Metakaolin Based Geopolymer Concrete. J. Phys. Conf. Ser. 2021, 2114, 012061. [Google Scholar] [CrossRef]
  36. Lim, Y.Y.; Pham, T.M. Effective utilisation of ultrafine slag to improve mechanical and durability properties of recycled aggregates geopolymer concrete. Clean. Eng. Technol. 2021, 5, 100330. [Google Scholar] [CrossRef]
  37. Kanagaraj, B.; Kiran, T.; Anand, N.; Al Jabri, K.; Justin, S. Development and strength assessment of eco-friendly geopolymer concrete made with natural and recycled aggregates. Constr. Innov. 2022, 23, 524–545. [Google Scholar] [CrossRef]
  38. Zhang, C.; Wang, Y.; Zhang, X.; Ding, Y.; Xu, P. Mechanical properties and microstructure of basalt fiber-reinforced recycled concrete. J. Clean. Prod. 2021, 278, 123252. [Google Scholar] [CrossRef]
  39. Wang, Y.; Hu, S.; He, Z. Mechanical and fracture properties of geopolymer concrete with basalt fiber using digital image correlation. Theor. Appl. Fract. Mech. 2021, 112, 102909. [Google Scholar] [CrossRef]
  40. Heweidak, M.; Kafle, B.; Al-Ameri, R. Influence of Hybrid Basalt Fibres Length on Fresh and Mechanical Properties of Self-Compacted Ambient-Cured Geopolymer Concrete. J. Compos. Sci. 2022, 6, 292. [Google Scholar] [CrossRef]
  41. Nikmehr, B.; Kafle, B.; Al-Ameri, R. Developing a sustainable self-compacting geopolymer concrete with 100% geopolymer-coated recycled concrete aggregate replacement. Smart Sustain. Built Environ. 2023; ahead-of-print. [Google Scholar] [CrossRef]
  42. Bhardwaj, B.; Kumar, P. Performance Assessment of Graphene Oxide–Reinforced Sustainable Geopolymer Concrete. J. Mater. Civ. Eng. 2021, 33, 04021322. [Google Scholar] [CrossRef]
  43. Alserai, S.J.; Alsaraj, W.K.; Abass, Z.W. Effect of iron filings on the mechanical properties of different types of sustainable concrete. Open Civ. Eng. J. 2018, 12, 441–457. [Google Scholar] [CrossRef]
  44. Nuaklong, P.; Jongvivatsakul, P.; Pothisiri, T.; Sata, V.; Chindaprasirt, P. Influence of rice husk ash on mechanical properties and fire resistance of recycled aggregate high-calcium fly ash geopolymer concrete. J. Clean. Prod. 2020, 252, 119797. [Google Scholar] [CrossRef]
  45. Koushkbaghi, M.; Alipour, P.; Tahmouresi, B.; Mohseni, E.; Saradar, A.; Sarker, P.K. Influence of different monomer ratios and recycled concrete aggregate on mechanical properties and durability of geopolymer concretes. Constr. Build. Mater. 2019, 205, 519–528. [Google Scholar] [CrossRef]
  46. Dabiri, H.; Clementi, J.; Marini, R.; Mugnozza, G.S.; Bozzano, F.; Mazzanti, P. Machine learning-based analysis of historical towers. Eng. Struct. 2024, 304, 117621. [Google Scholar] [CrossRef]
  47. AS 1012.8-1986 AMDT 1; Methods of Testing Concrete, Method 8: Method for Making and Curing Concrete Compression, Indirect Tensile and Flexure Test Specimens, in the laboratory or in the Field. Standards Australia Limited: Sydney, NSW, Australia, 1986.
  48. Ismail, S.; Ramli, M. Engineering properties of treated recycled concrete aggregate (RCA) for structural applications. Constr. Build. Mater. 2013, 44, 464–476. [Google Scholar] [CrossRef]
  49. Li, J.; Xiao, H.; Zhou, Y. Influence of coating recycled aggregate surface with pozzolanic powder on properties of recycled aggregate concrete. Constr. Build. Mater. 2009, 23, 1287–1291. [Google Scholar] [CrossRef]
  50. Nikmehr, B.; Kafle, B.; Al-Ameri, R. A review of the advanced treatment techniques for enriching the recycled concrete aggregates for recycled-based concrete: Economic, environmental and technical analysis. Smart Sustain. Built Environ. 2024, 13, 560–583. [Google Scholar] [CrossRef]
  51. Gupta, A.; Mandal, S.; Ghosh, S. Durability of geopolymer coated recycled aggregate concrete exposed to Sulphuric acid. Int. J. Appl. Eng. Res. 2012, 7, 91–103. [Google Scholar] [CrossRef]
  52. AS 1012.8.1:2014; Methods of Testing Concrete. Method 8.1: Method for Making and Curing Concrete-Compression and Indirect Tensile Test Specimens. Standards Australia Limited: Sydney, NSW, Australia, 2014.
  53. AS 1012.3.5:2015; Methods of Testing Concrete. Method 3.5: Determination of Properties Related to the Consistency of Concrete—Slump Flow, T500 and J-Ring Test. Standards Australia: Sydney, NSW, Australia, 2015.
  54. VicRoads. Technical Note 73: Self Compacting Concrete (SCC). Melbourne, VIC, Australia. 2006. Available online: https://www.google.com/url?sa=t&source=web&rct=j&opi=89978449&url=https://www.vicroads.vic.gov.au/-/media/files/technical-documents-new/technical-notes/technical-note-tn-073--self-compacting-concrete.ashx&ved=2ahUKEwitpOf5gaOIAxVvna8BHc_cIEgQFnoECBkQAQ&usg=AOvVaw3y4wkbNHn5Cf04GgNE4v7l (accessed on 27 August 2024).
  55. AS 1012.9: 2014; Methods of Testing Concrete. Method 9: Compressive Strength Tests—Concrete, Mortar and Grout Specimens. Standards Australia Limited: Sydney, NSW, Australia, 2014.
  56. AS 1012.10-2000Methods of Testing Concrete, Method 10: Determination of Indirect Tensile Strength of Concrete Cylinders (‘Brazil’ or Splitting Test); Standards Australia Limited: Sydney, NSW, Australia, 2000.
  57. AS 1012.17-1997; Methods of Testing Concrete, Method 17: Determination of the Static Chord Modulus of Elasticity and Poisson’s Ratio of Concrete Specimens. Standards Australia Limited: Sydney, NSW, Australia, 1997.
  58. Frank, I.E.; Todeschini, R. The Data Analysis Handbook; Elsevier Science: Amsterdam, The Netherlands, 1994. [Google Scholar]
  59. Ghorbani, B.; Arulrajah, A.; Narsilio, G.; Horpibulsuk, S. Experimental investigation and modelling the deformation properties of demolition wastes subjected to freeze–thaw cycles using ANN and SVR. Constr. Build. Mater. 2020, 258, 119688. [Google Scholar] [CrossRef]
  60. MathWorks, Inc. MATLAB, version: 23.2.0.2365128 (R2023b); Natick: Massachusetts, MA, USA, 2023. [Google Scholar]
  61. Corporation, I. IBM SPSS Statistics for Windows, Version 29.0; IBM Corp.: Armonk, NY, USA, 2022. [Google Scholar]
  62. Cook, R.; Lapeyre, J.; Ma, H.; Kumar, A. Prediction of Compressive Strength of Concrete: Critical Comparison of Performance of a Hybrid Machine Learning Model with Standalone Models. J. Mater. Civ. Eng. 2019, 31, 04019255. [Google Scholar] [CrossRef]
  63. Han, T.; Siddique, A.; Khayat, K.; Huang, J.; Kumar, A. An ensemble machine learning approach for prediction and optimization of modulus of elasticity of recycled aggregate concrete. Constr. Build. Mater. 2020, 244, 118271. [Google Scholar] [CrossRef]
  64. Origin. OriginLab Corporation, 2023b; OriginLab: Northampton, MA, USA, 2023. [Google Scholar]
  65. Rostami, M.F.; Sadrossadat, E.; Ghorbani, B.; Kazemi, S.M. New empirical formulations for indirect estimation of peak-confined compressive strength and strain of circular RC columns using LGP method. Eng. Comput. 2018, 34, 865–880. [Google Scholar] [CrossRef]
Figure 1. ANN model (adapted from Nunez, Marani, Flah, and Nehdi [30]).
Recycling 09 00073 g001
Figure 2. Sensitivity analysis of the LR model according to the input variables.
Recycling 09 00073 g002
Figure 3. Performance of ANN model according to LM algorithm.
Recycling 09 00073 g003
Figure 4. Error histogram of ANN model according to LM algorithm.
Recycling 09 00073 g004
Figure 5. Regression plots for ANN model according to LM algorithm.
Recycling 09 00073 g005
Figure 6. Sensitivity analysis of the LM model according to the input variables.
Recycling 09 00073 g006
Figure 7. Performance of ANN model according to BR algorithm.
Recycling 09 00073 g007
Figure 8. Error histogram of ANN model according to BR algorithm.
Recycling 09 00073 g008
Figure 9. Regression plots for ANN model according to BR algorithm.
Recycling 09 00073 g009
Figure 10. Sensitivity analysis of the BR model according to the input variables.
Recycling 09 00073 g010
Figure 11. Performance of ANN model according to SCG algorithm.
Recycling 09 00073 g011
Figure 12. Error histogram of ANN model according to SCG algorithm.
Recycling 09 00073 g012
Figure 13. Regression plots for ANN model according to SCG algorithm.
Recycling 09 00073 g013
Figure 14. Sensitivity analysis of the SCG model according to the input variables.
Recycling 09 00073 g014
Figure 15. Comparison of model predictions with experimental results for compressive strength, splitting tensile strength, and modulus of elasticity.
Recycling 09 00073 g015aRecycling 09 00073 g015b
Figure 16. Comparing the models’ performance for (a) compressive strength, (b) tensile strength, and (c) modulus of elasticity.
Recycling 09 00073 g016
Figure 17. Gradation curves of NA and RCA.
Recycling 09 00073 g017
Figure 18. Morphology of (a) natural aggregates, (b) RCA, and (c) coated RCA.
Recycling 09 00073 g018
Figure 19. Set-ups for tests of (a) compressive strength, (b) tensile strength, and (c) modulus of elasticity.
Recycling 09 00073 g019
Figure 20. Correlation plot of mix design parameters.
Recycling 09 00073 g020
Figure 21. Histograms of input parameters.
Recycling 09 00073 g021
Figure 22. The schematic depiction of ANN architecture.
Recycling 09 00073 g022
Table 1. Studies on ANN models for predicting OPC properties based on the RCA characteristics.
Study byInput VariablesOutputR2
Tam, Butera, Le, Silva, and Evangelista [29]Chamber time, chamber pressure, cement, water, water to binder ratio (W/C), RCA, and sand contentCompressive strength 0.95
Rizvon and Jayakumar [26]Age, W/C, superplasticiser, FA, RCA, and water contentCompressive strength0.93
Amiri and Hatami [25]Age, W/C, slag, RCA contentCompressive strength and chloride migration0.99
Suescum-Morales, Salas-Morera, Jiménez, and García-Hernández [24]Cement, FA, water, superplasticiser, fine and coarse NA or RCA contentCompressive strength0.99
Salimbahrami and Shakeri [23]Coarse and fine NA and RCA, cement, water, superplasticiser contentCompressive strength0.98
Table 2. Regression model summary and coefficients.
Model SummaryLinear Regression Coefficients
RR2R2
Adjusted
SEEConstant C R C A C N A B F 30 B F 12 C C o a t
Compressive Strength0.9990.9980.9980.1868822.88600.0020.32406.477
Tensile Strength0.9370.8780.8520.212851.76900.0010.06900.551
Modulus of Elasticity0.8130.6610.5892.197004.88700.0100.23604.913
Table 3. Validity of linear regression model.
Compressive StrengthTensile StrengthModulus of Elasticity
Statistical ValuesConditionOutcome AchievedRemarksStatistical ValuesConditionOutcome AchievedRemarksStatistical ValuesConditionOutcome AchievedRemarks
R>0.900.999SatisfactoryR>0.900.937SatisfactoryR>0.900.813Unsatisfactory
MSEClose to 00.041SatisfactoryMSEClose to 00.036SatisfactoryMSEClose to 03.755Unsatisfactory
MAEClose to 00.172SatisfactoryMAEClose to 00.155SatisfactoryMAEClose to 01.555Unsatisfactory
MAPE<10%0.656%SatisfactoryMAPE<10%6.812%SatisfactoryMAPE<10%18.657%Unsatisfactory
RMSEClose to 00.204SatisfactoryRMSEClose to 00.189SatisfactoryRMSEClose to 01.938Unsatisfactory
Table 4. Validity of ANN model (LM).
Compressive StrengthTensile StrengthModulus of Elasticity
Statistical ValuesConditionOutcome AchievedRemarksStatistical ValuesConditionOutcome AchievedRemarksStatistical ValuesConditionOutcome AchievedRemarks
R>0.900.999SatisfactoryR>0.900.989SatisfactoryR>0.900.999Satisfactory
MSEClose to 00.026SatisfactoryMSEClose to 00.006SatisfactoryMSEClose to 00.021Satisfactory
MAEClose to 00.121SatisfactoryMAEClose to 00.063SatisfactoryMAEClose to 00.118Satisfactory
MAPE<10%0.454%SatisfactoryMAPE<10%2.777%SatisfactoryMAPE<10%1.389%Satisfactory
RMSEClose to 00.161SatisfactoryRMSEClose to 00.081SatisfactoryRMSEClose to 00.145Satisfactory
Table 5. Validity of ANN model (BR).
Compressive StrengthTensile StrengthModulus of Elasticity
Statistical ValuesConditionOutcome AchievedRemarksStatistical ValuesConditionOutcome AchievedRemarksStatistical ValuesConditionOutcome AchievedRemarks
R>0.900.999SatisfactoryR>0.900.989SatisfactoryR>0.900.999Satisfactory
MSEClose to 00.026SatisfactoryMSEClose to 00.007SatisfactoryMSEClose to 00.024Satisfactory
MAEClose to 00.121SatisfactoryMAEClose to 00.064SatisfactoryMAEClose to 00.117Satisfactory
MAPE<10%0.447%SatisfactoryMAPE<10%2.887%SatisfactoryMAPE<10%1.410%Satisfactory
RMSEClose to 00.161SatisfactoryRMSEClose to 00.082SatisfactoryRMSEClose to 00.154Satisfactory
Table 6. Validity of ANN model (SCG).
Compressive StrengthTensile StrengthModulus of Elasticity
Statistical ValuesConditionOutcome AchievedRemarksStatistical ValuesConditionOutcome AchievedRemarksStatistical ValuesConditionOutcome AchievedRemarks
R>0.900.999SatisfactoryR>0.900.989SatisfactoryR>0.900.999Satisfactory
MSEClose to 00.030SatisfactoryMSEClose to 00.007SatisfactoryMSEClose to 00.027Satisfactory
MAEClose to 00.127SatisfactoryMAEClose to 00.064SatisfactoryMAEClose to 00.125Satisfactory
MAPE<10%0.475%SatisfactoryMAPE<10%2.814%SatisfactoryMAPE<10%1.507%Satisfactory
RMSEClose to 00.172SatisfactoryRMSEClose to 00.082SatisfactoryRMSEClose to 00.164Satisfactory
Table 7. Model performance comparison.
Developed ModelModel TypesMSE
(MPa2)
MAE
(MPa)
MAPE
(%)
RMSE
(MPa)
CPI
(Unitless)
Rank in Each Category
Compressive strengthANN (Levenberg–Marquardt)0.0260.1210.4540.1610.0082
ANN (Bayesian regularisation)0.0260.1210.4470.1610.0001
ANN (Scaled Conjugate Gradient)0.0300.1270.4750.1720.1943
Linear Regression0.0410.1720.6560.2041.0004
Tensile strengthANN (Levenberg–Marquardt)0.0060.0632.7770.0810.0001
ANN (Bayesian regularisation)0.0070.0642.8870.0820.0203
ANN (Scaled Conjugate Gradient)0.0070.0642.8140.0820.0162
Linear Regression0.0360.1556.8120.1891.0004
Modulus of elasticityANN (Levenberg–Marquardt)0.0210.1181.3890.1450.0001
ANN (Bayesian regularisation)0.0240.1171.4100.1540.0022
ANN (Scaled Conjugate Gradient)0.0270.1251.5070.1640.0063
Linear Regression3.7551.55518.6571.9381.0004
Table 8. Mix proportions.
MixesCoarse Aggregates (kg/m3)Fine Aggregates
(kg/m3)
Fly Ash * (kg/m3)Micro Fly Ash (kg/m3)GGBS (kg/m3)Sodium Metasilicate Activator (kg/m3)Water/Binder RatioBasalt Fibre
(% Total Mass of Binders)
NARCACoated RCA12 mm30 mm
M0677--763480120360960.45--
M25169508-763480120360960.45--
M50338.5338.5-763480120360960.45--
M100-677-763480120360960.45--
M100-C1--677 763480120360960.45--
M100-C1BF--677 763480120360960.450.51.5
Geopolymer slurry ----24060180480.45--
* Source of the material is Fly ash: Cement Australia Fly Ash, Darra, QLD, Australia; Micro fly ash: Fly Ash Australia Pty. Limited., Bayswater Power Plant, NSW, Australia; GGBS: Independent Cement, Port Melbourne, VIC, Australia; Sodium metasilicate activator: Redox Pty Ltd, Melbourne, VIC, Australia; RCA: Daisy’s Garden Supplies, Geelong, VIC, Australia; BF: BlackBar, Beyond Materials Group PTY Ltd., Yatala, QLD, Australia.
Table 9. Properties of applied basalt fibres.
Length (mm)Diameter
(μm)
Density
(g/cm3)
Modulus of Elasticity
(GPa)
Moisture AbsorptionMelt Temperature
(°C)
Tensile Strength
(MPa)
12132.6–2.870<0.1% T14501000
30132.6–2.870<0.1% T14501000
Table 10. Chemical composition of binders [17,41].
Chemical Composition (Mass%)SiO2CaOAl2O3MgOK2OMnOSO3V2O5TiO2Na2OP2O5FeO
Binders
Fly ash 65.75-32.87-----1.38---
GGBS 35.1941.4713.666.32--2.430.200.73---
Micro fly ash 63.09-32.26-0.83---1.670.410.621.12
Anhydrous Sodium Metasilicate 50--------50--
Table 11. Properties of NA and RCA.
AggregateNominal SizeWater Absorption (%)Moisture Content (%)
Coarse natural aggregate14 mm3.32.05
Recycled concrete aggregate 14 mm6.63
Table 12. Rheological properties of the SCGC mixes.
MixSlump Flow (mm)T500 (s)J-Ring (mm)
M070022
M256902.32
M506802.52
M1006603.13
M100-C15504.58
M100-C1BF5803.510
Table 13. Statistical characteristics of datasets used for developing the models.
Input/Output VariablesMeanStandard Error of the Mean (SEM)Sample Standard Deviation (SSD)Sample Variance (SV)RangeMinMax
C R C A 423.12565.97729279.917978,354.046770677
C N A 253.87565.97729279.917978,354.046770677
B F 12 0.880.4772472.0247884.0997655.2805.28
B F 30 2.641.4317416.07436336.8978815.84015.84
C C o a t 0.3333330.1143320.4850710.235294101
CS26.491111.0076964.2752918.278111.7322.8834.61
TS2.4055560.1302970.5528030.3055911.71.83.5
MoE9.7055560.8073783.42541611.733478.46.414.8
Table 14. Statistical metrics used in this research.
ItemFormula
Linear coefficient correlation (R) R = i = 1 n ( x i x ¯ ) ( y i y ¯ ) i = 1 n ( x i x ¯ ) 2 i = 1 n ( y i y ¯ ) 2
Adjusted R2 R a d j u s t e d 2 = 1 ( ( 1 R 2 ) ( n 1 ) n k 1 )
Mean Squared Error (MSE) M S E = 1 n i = 1 n ( x i y i ) 2
Mean Absolute Error (MAE) M A E = 1 n i = 1 n x i y i
Mean Absolute Percentage Error (MAPE) M A P E = 1 n x i y i x i × 100 %
Root Mean Square Error (RMSE) R M S E = 1 n i = 1 n ( x i y i ) 2
Sample Variance (SV) S 2 = 1 n 1 i = 1 n ( x i x ¯ ) 2
Sample Standard Deviation (SSD) S S D = i = 1 n ( x i x ¯ ) 2 n 1
Standard Error of the Mean (SEM) S E M = S S D n
Standard Error of the Estimate (SEE) S E E = ( x i y i ) 2 n 2
x i : actual values by the experiments; y i : predicted values by the models; x ¯ : mean of actual values; y ¯ : mean of predicted values; n : number of observations; k : the number of predictors in the model.
Disclaimer/Publisher’s Note: The statements, opinions and data contained in all publications are solely those of the individual author(s) and contributor(s) and not of MDPI and/or the editor(s). MDPI and/or the editor(s) disclaim responsibility for any injury to people or property resulting from any ideas, methods, instructions or products referred to in the content.

