
Direct Contact Membrane Distillation of Artificial Urine and Its Application in Plasticizing Lunar Regolith


Abstract
:
1. Introduction
2. Results and Discussion
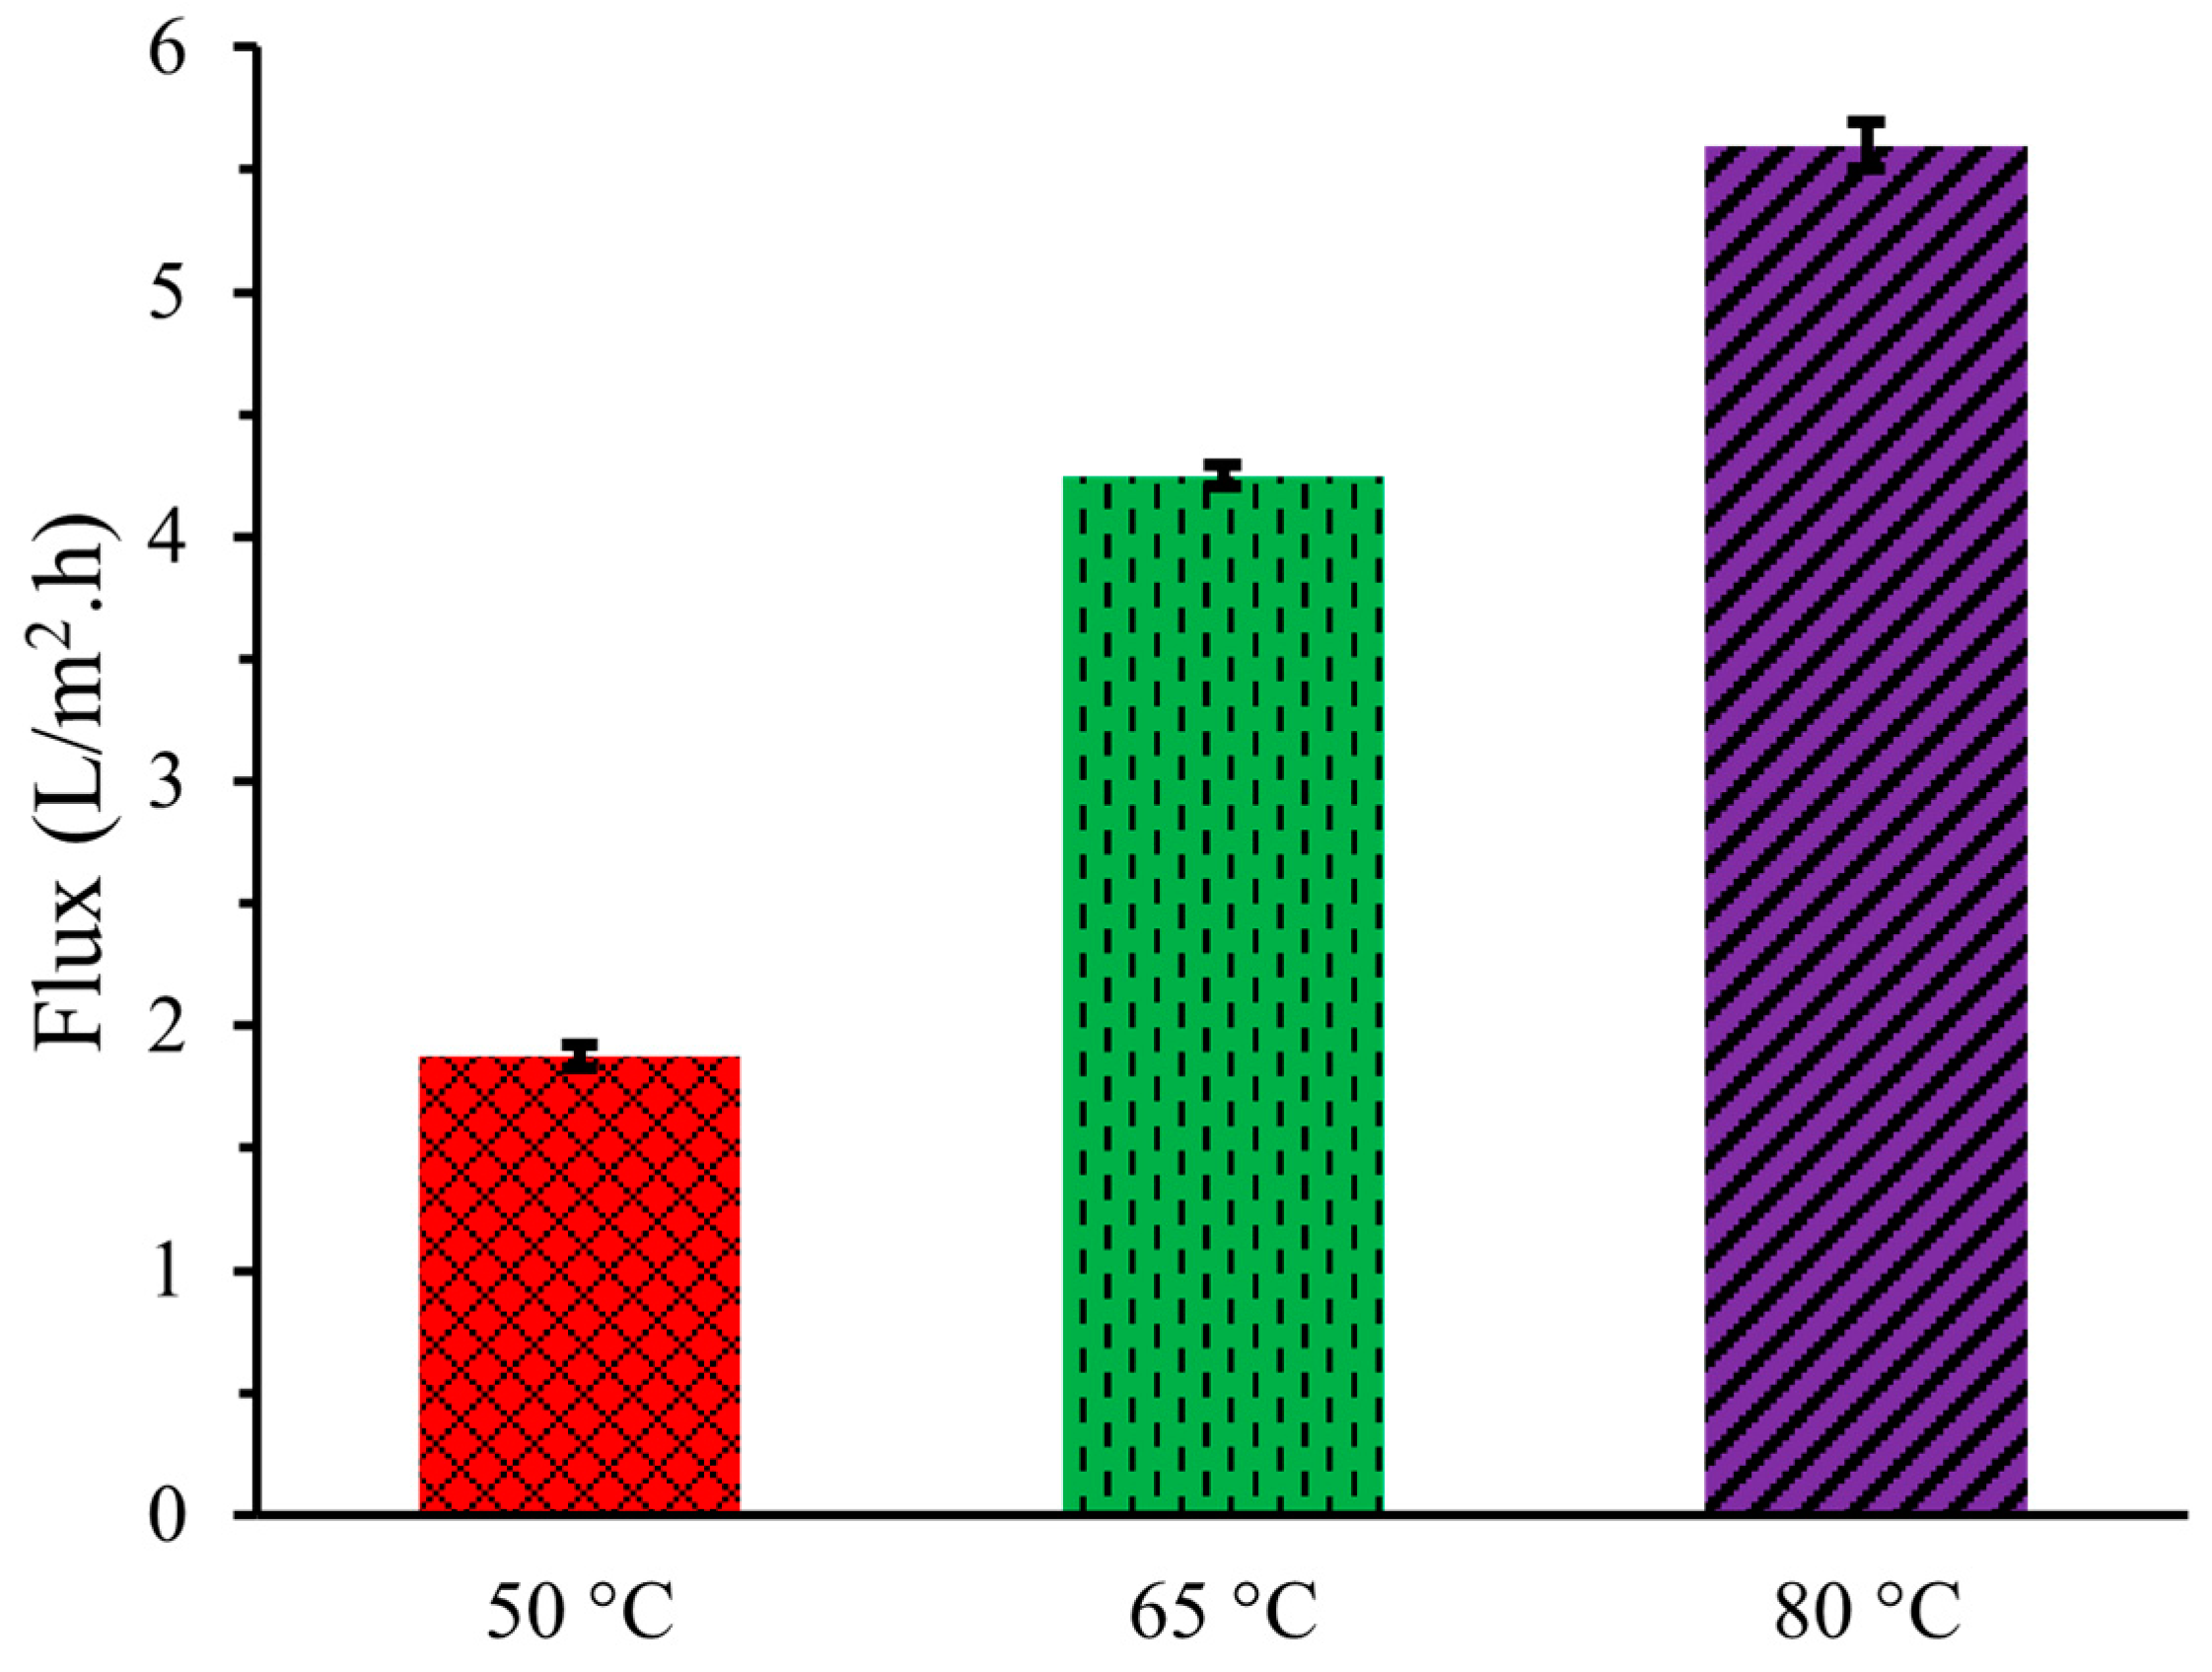
2.1. Flux
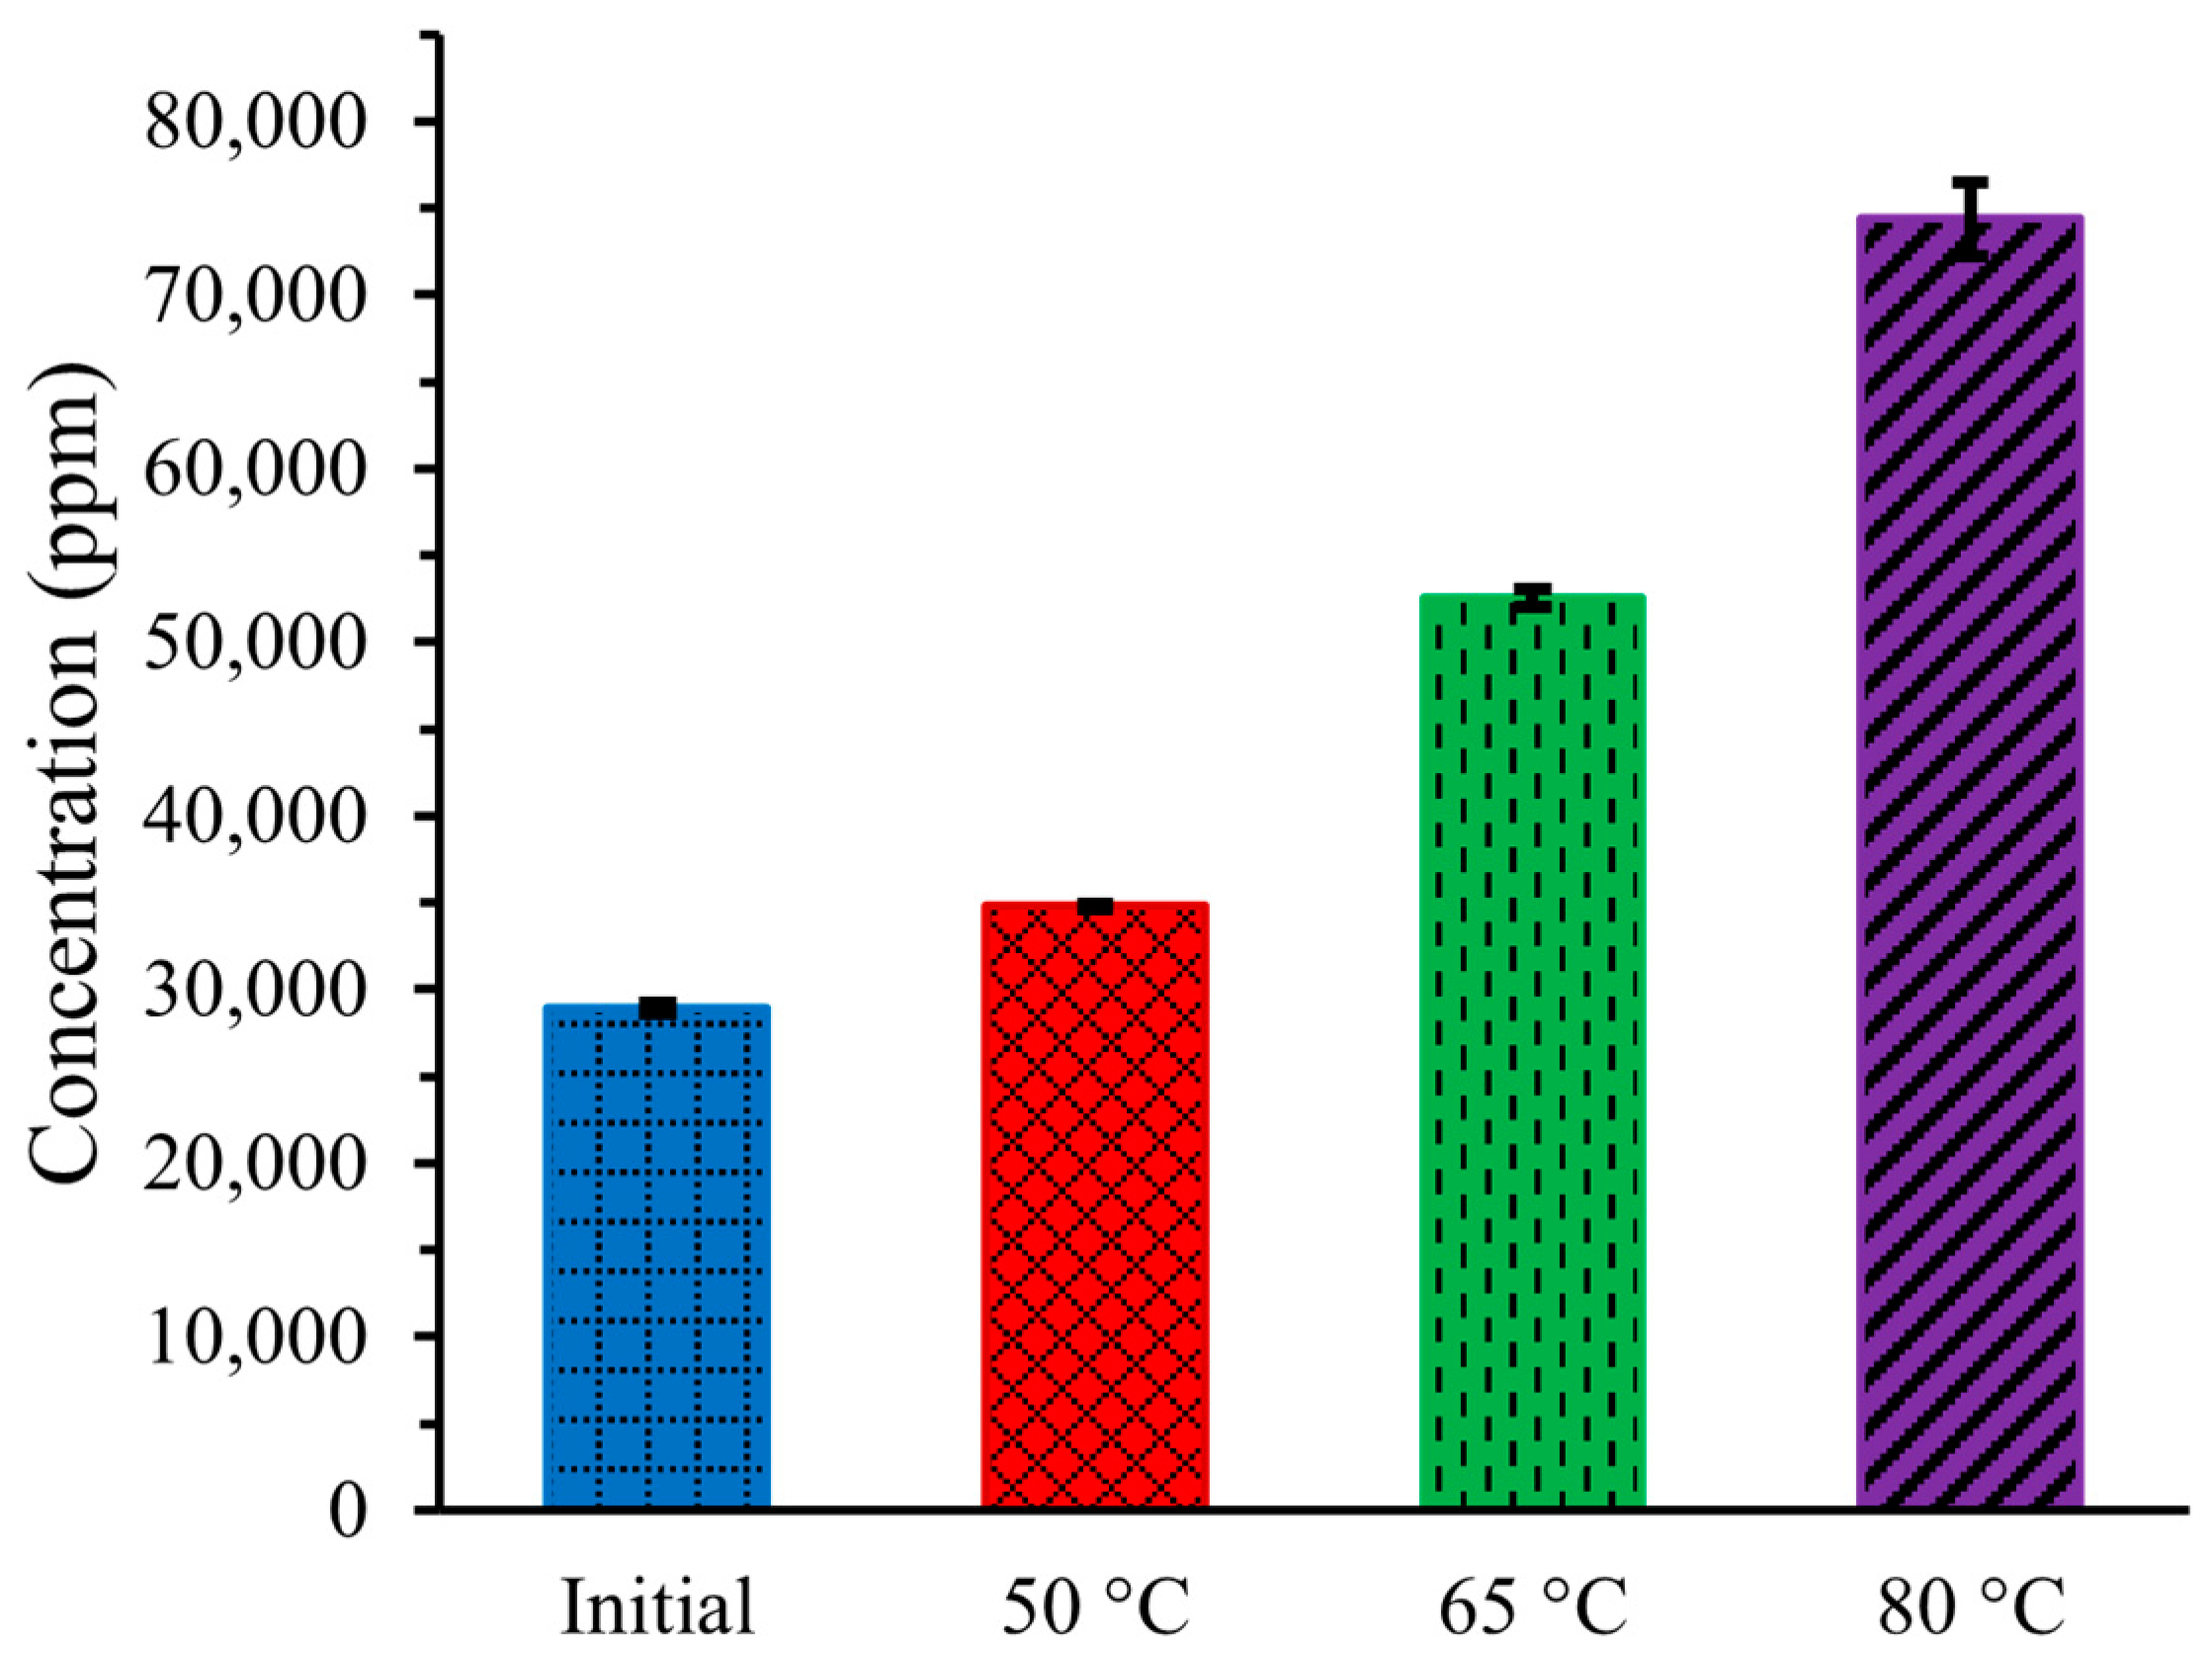
2.2. Concentration
2.3. Density
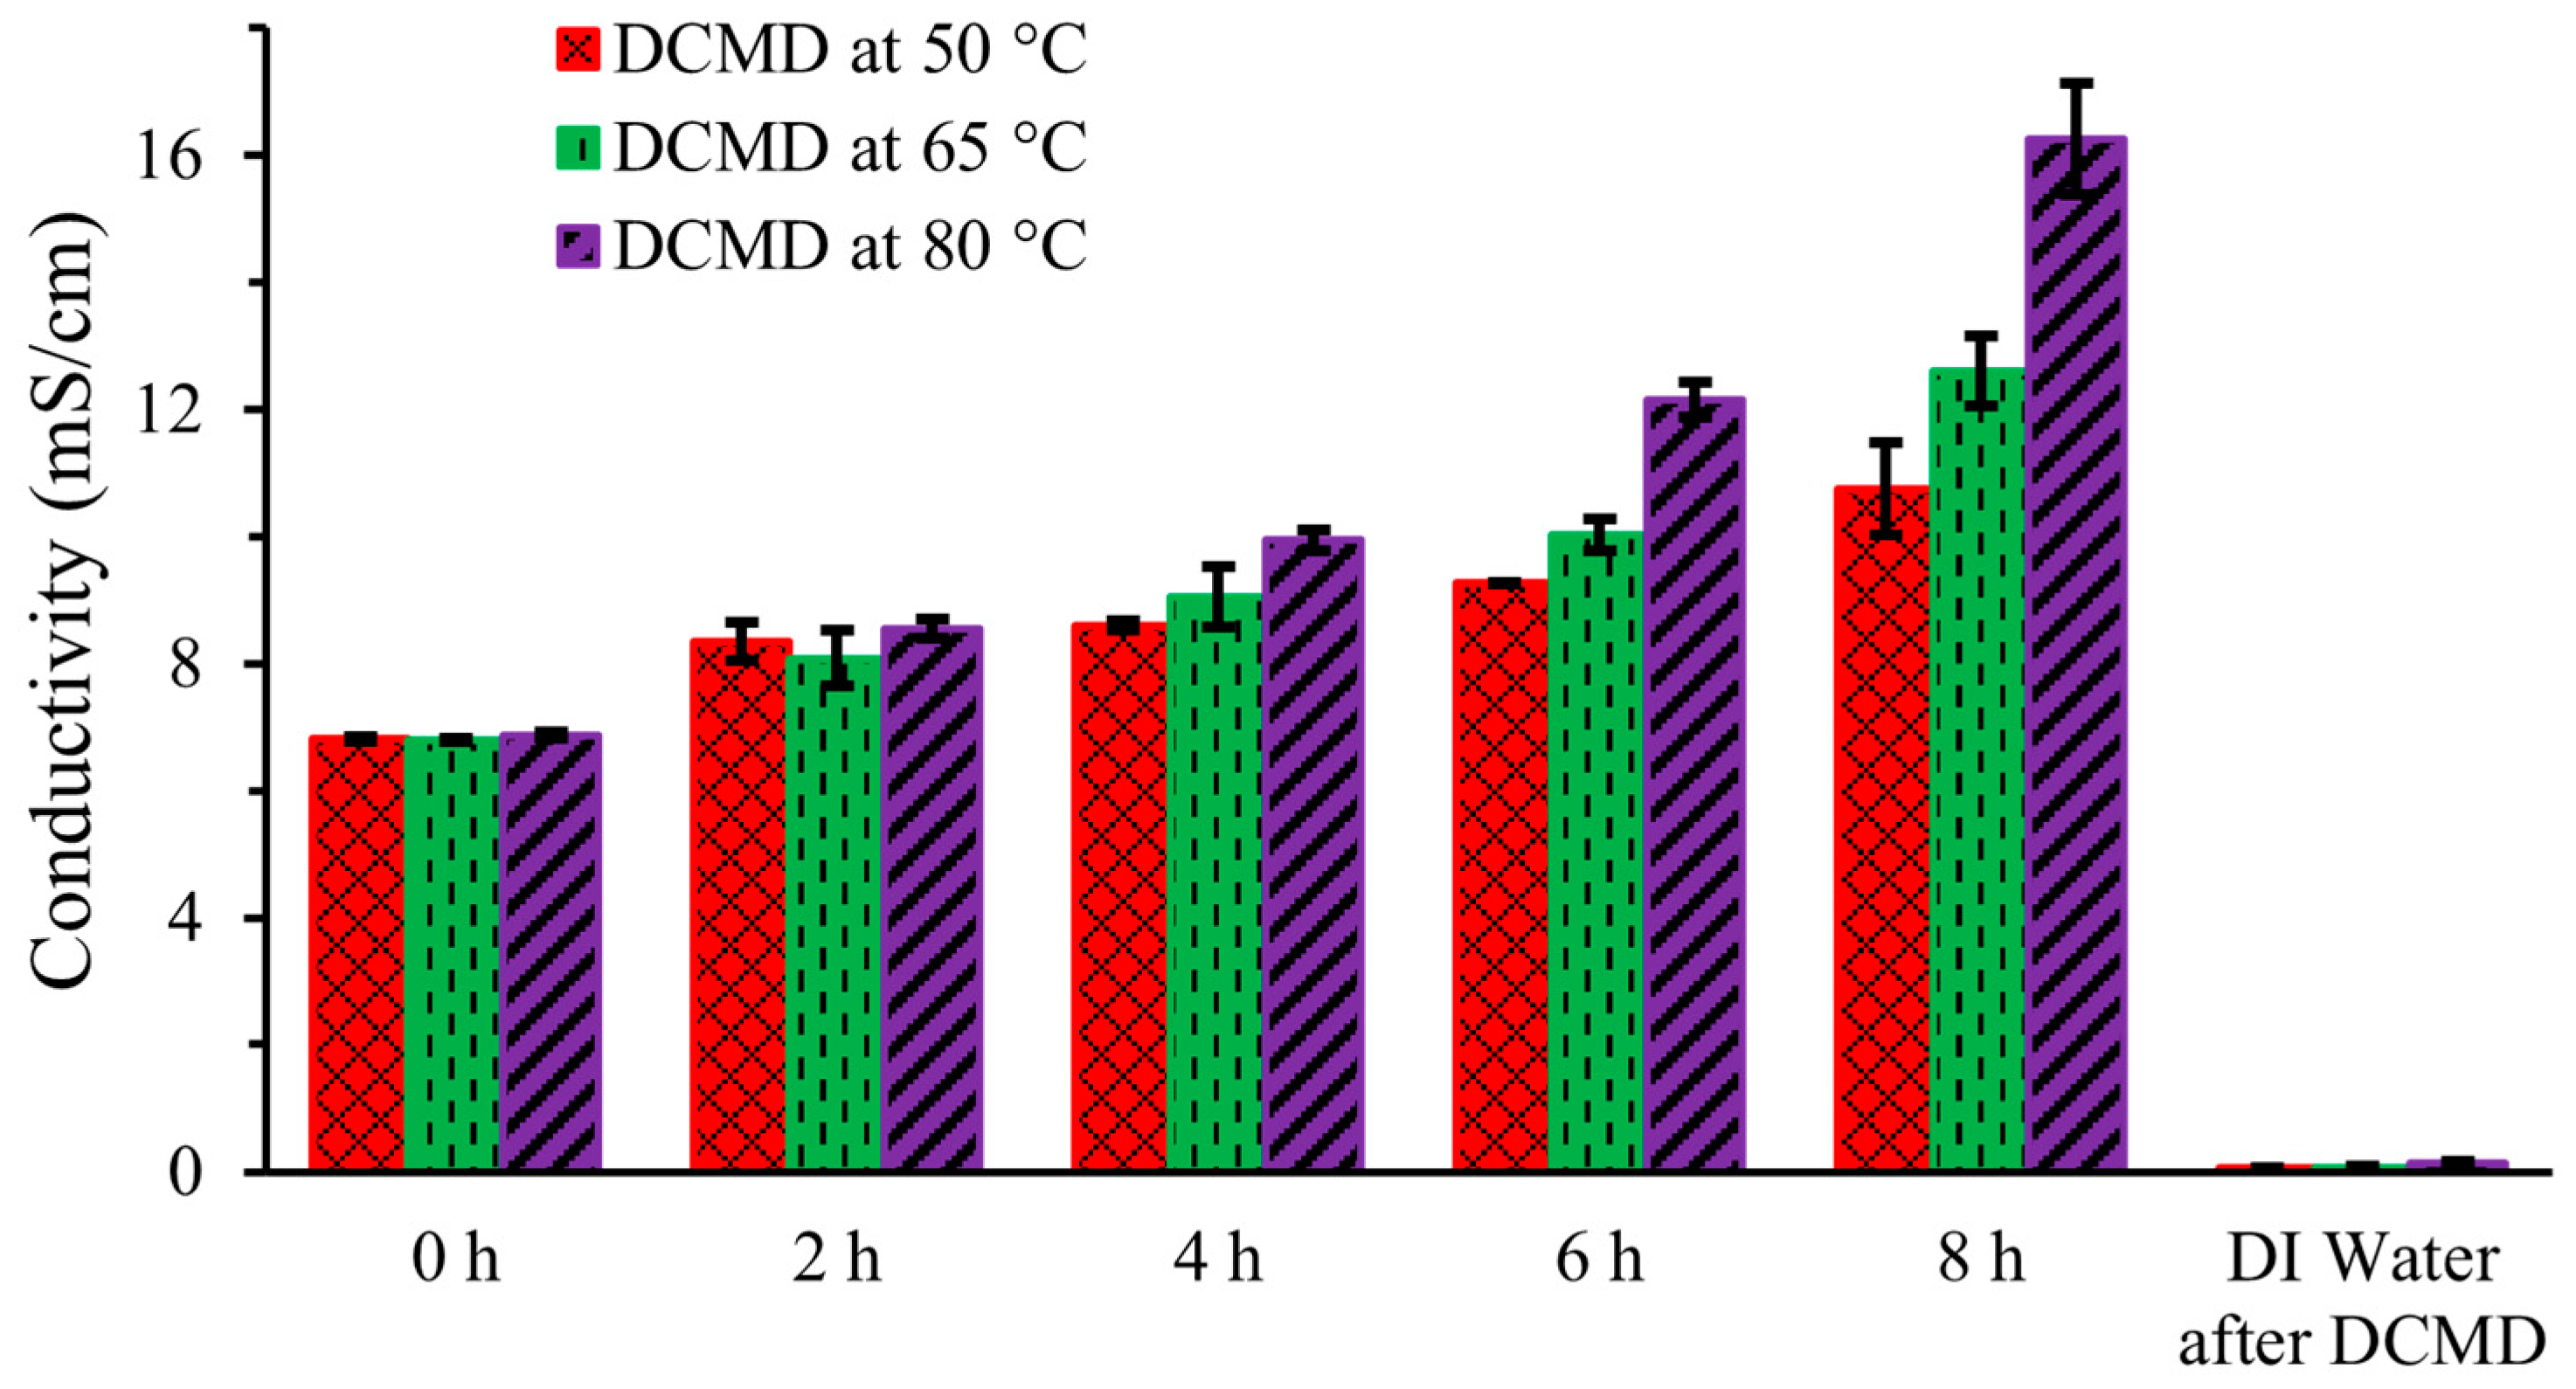
2.4. Ionic Conductivity
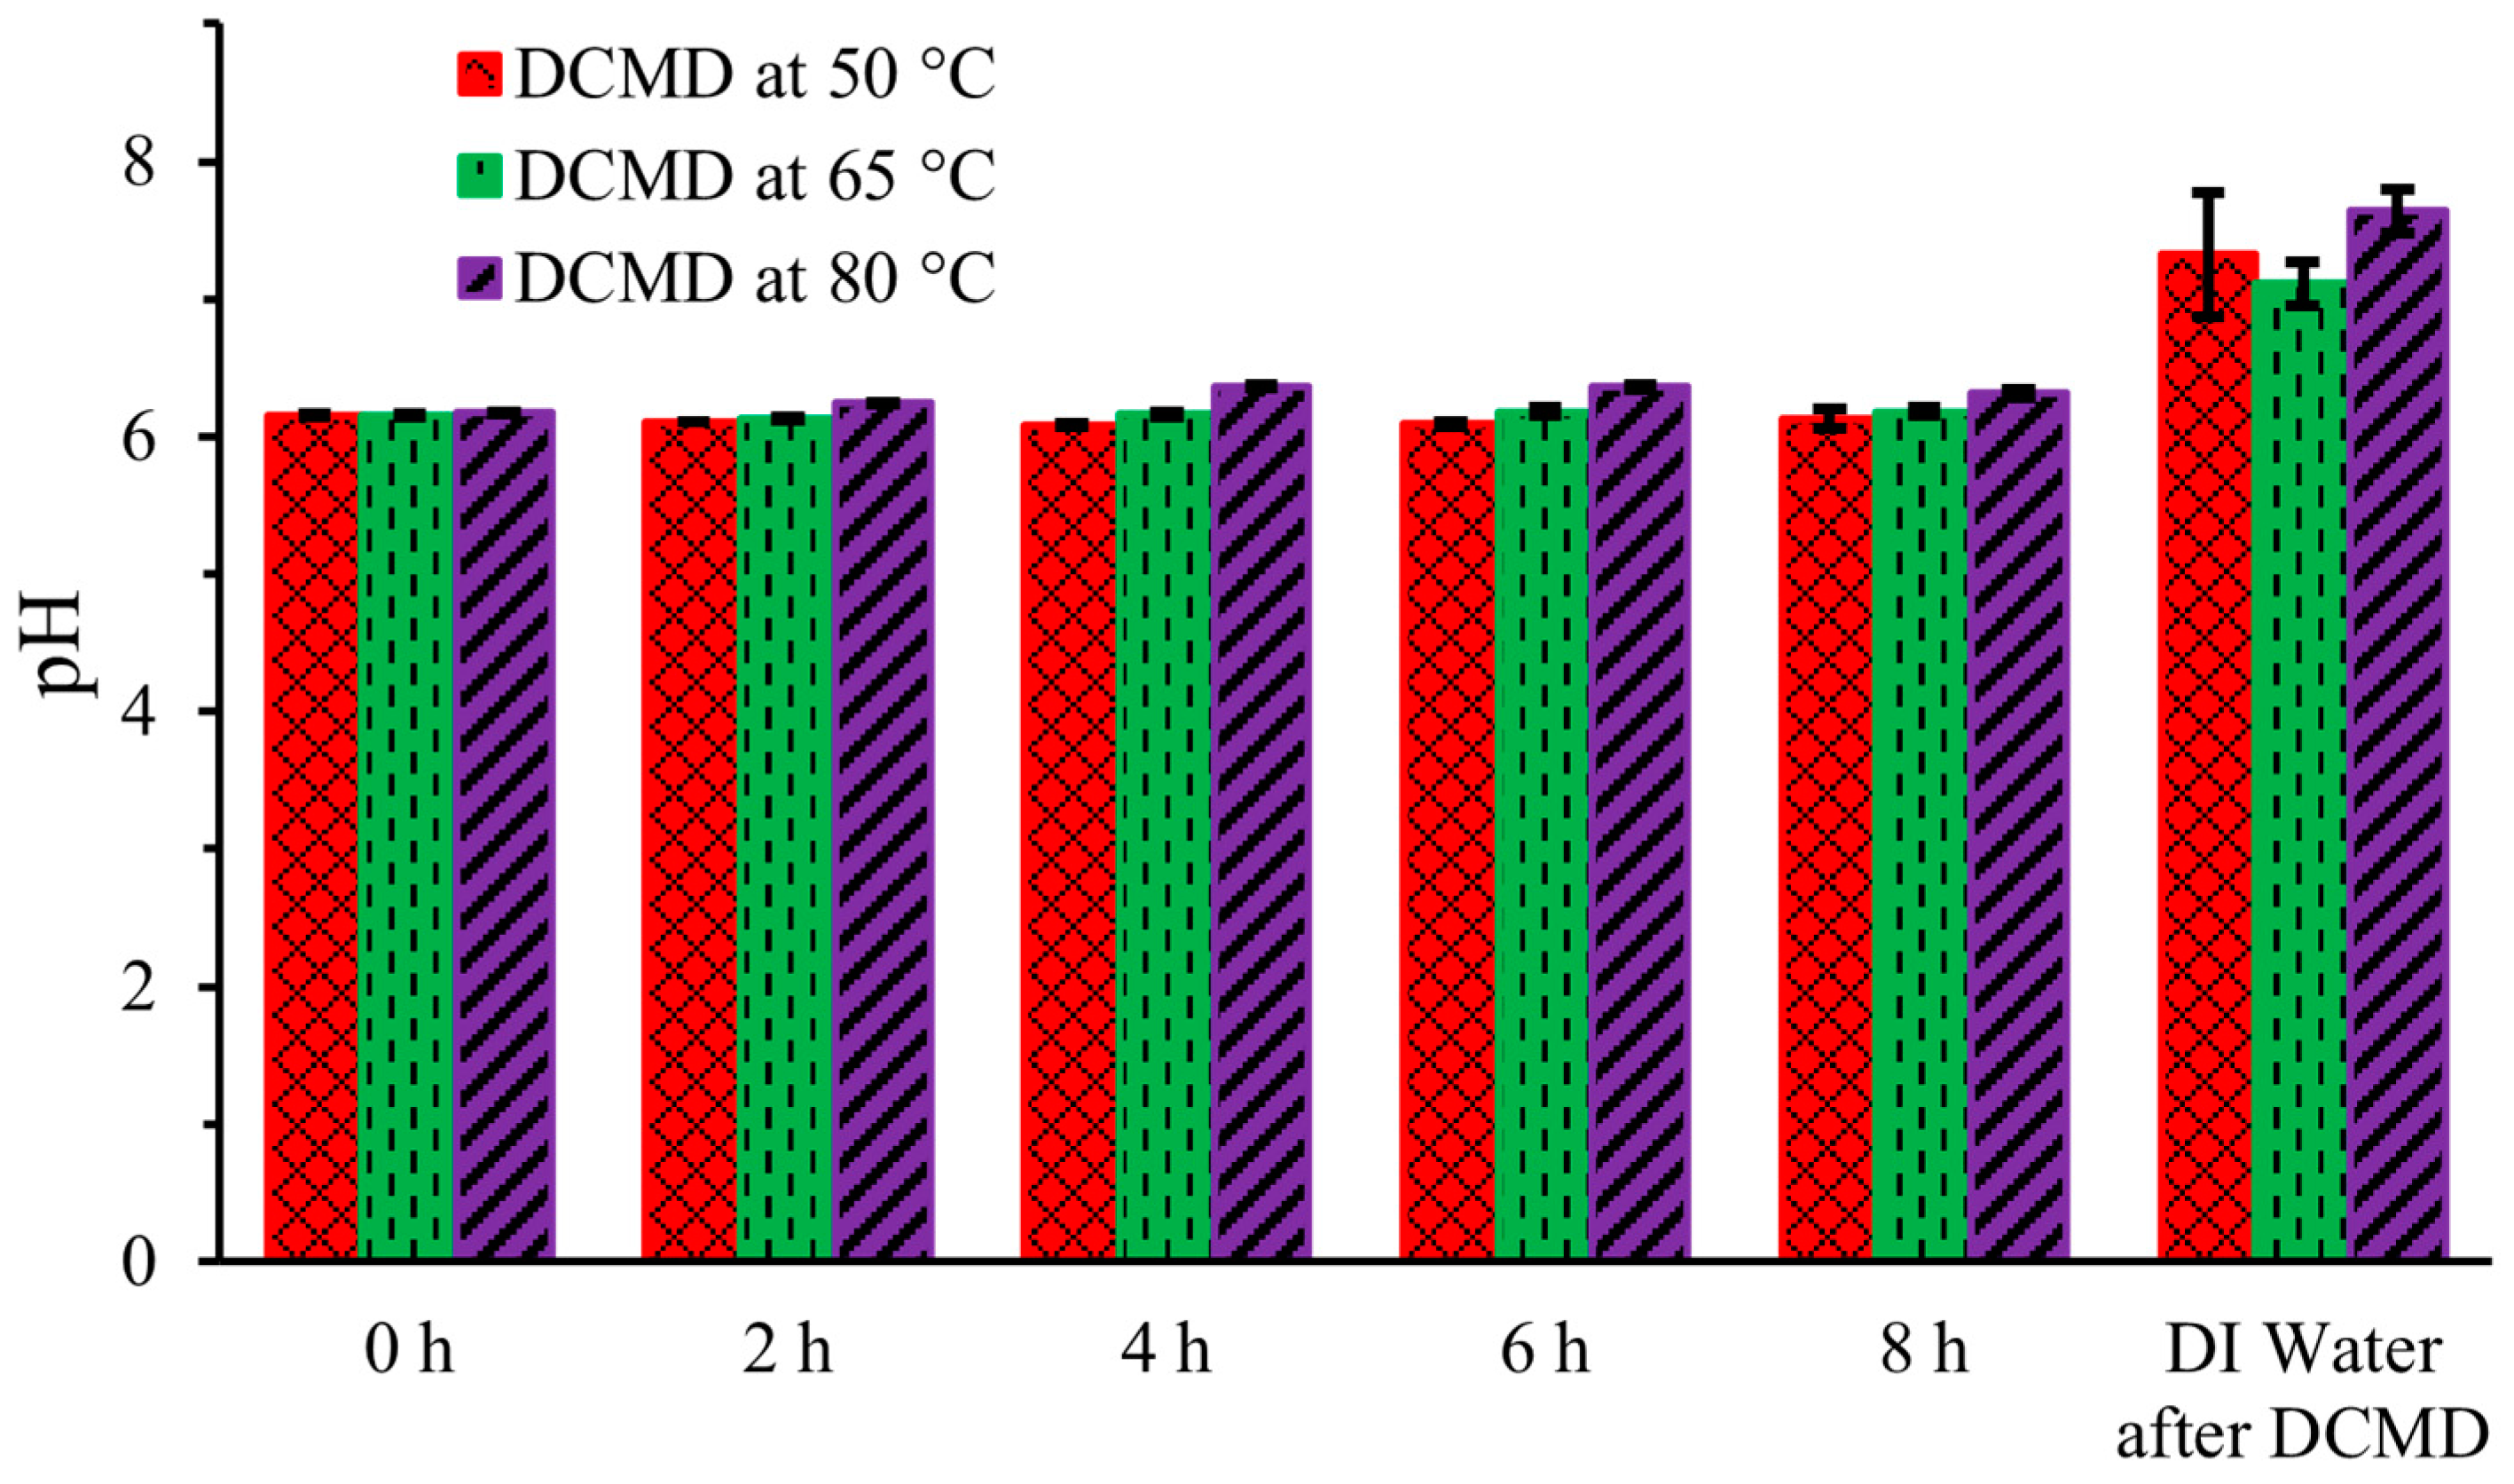
2.5. pH
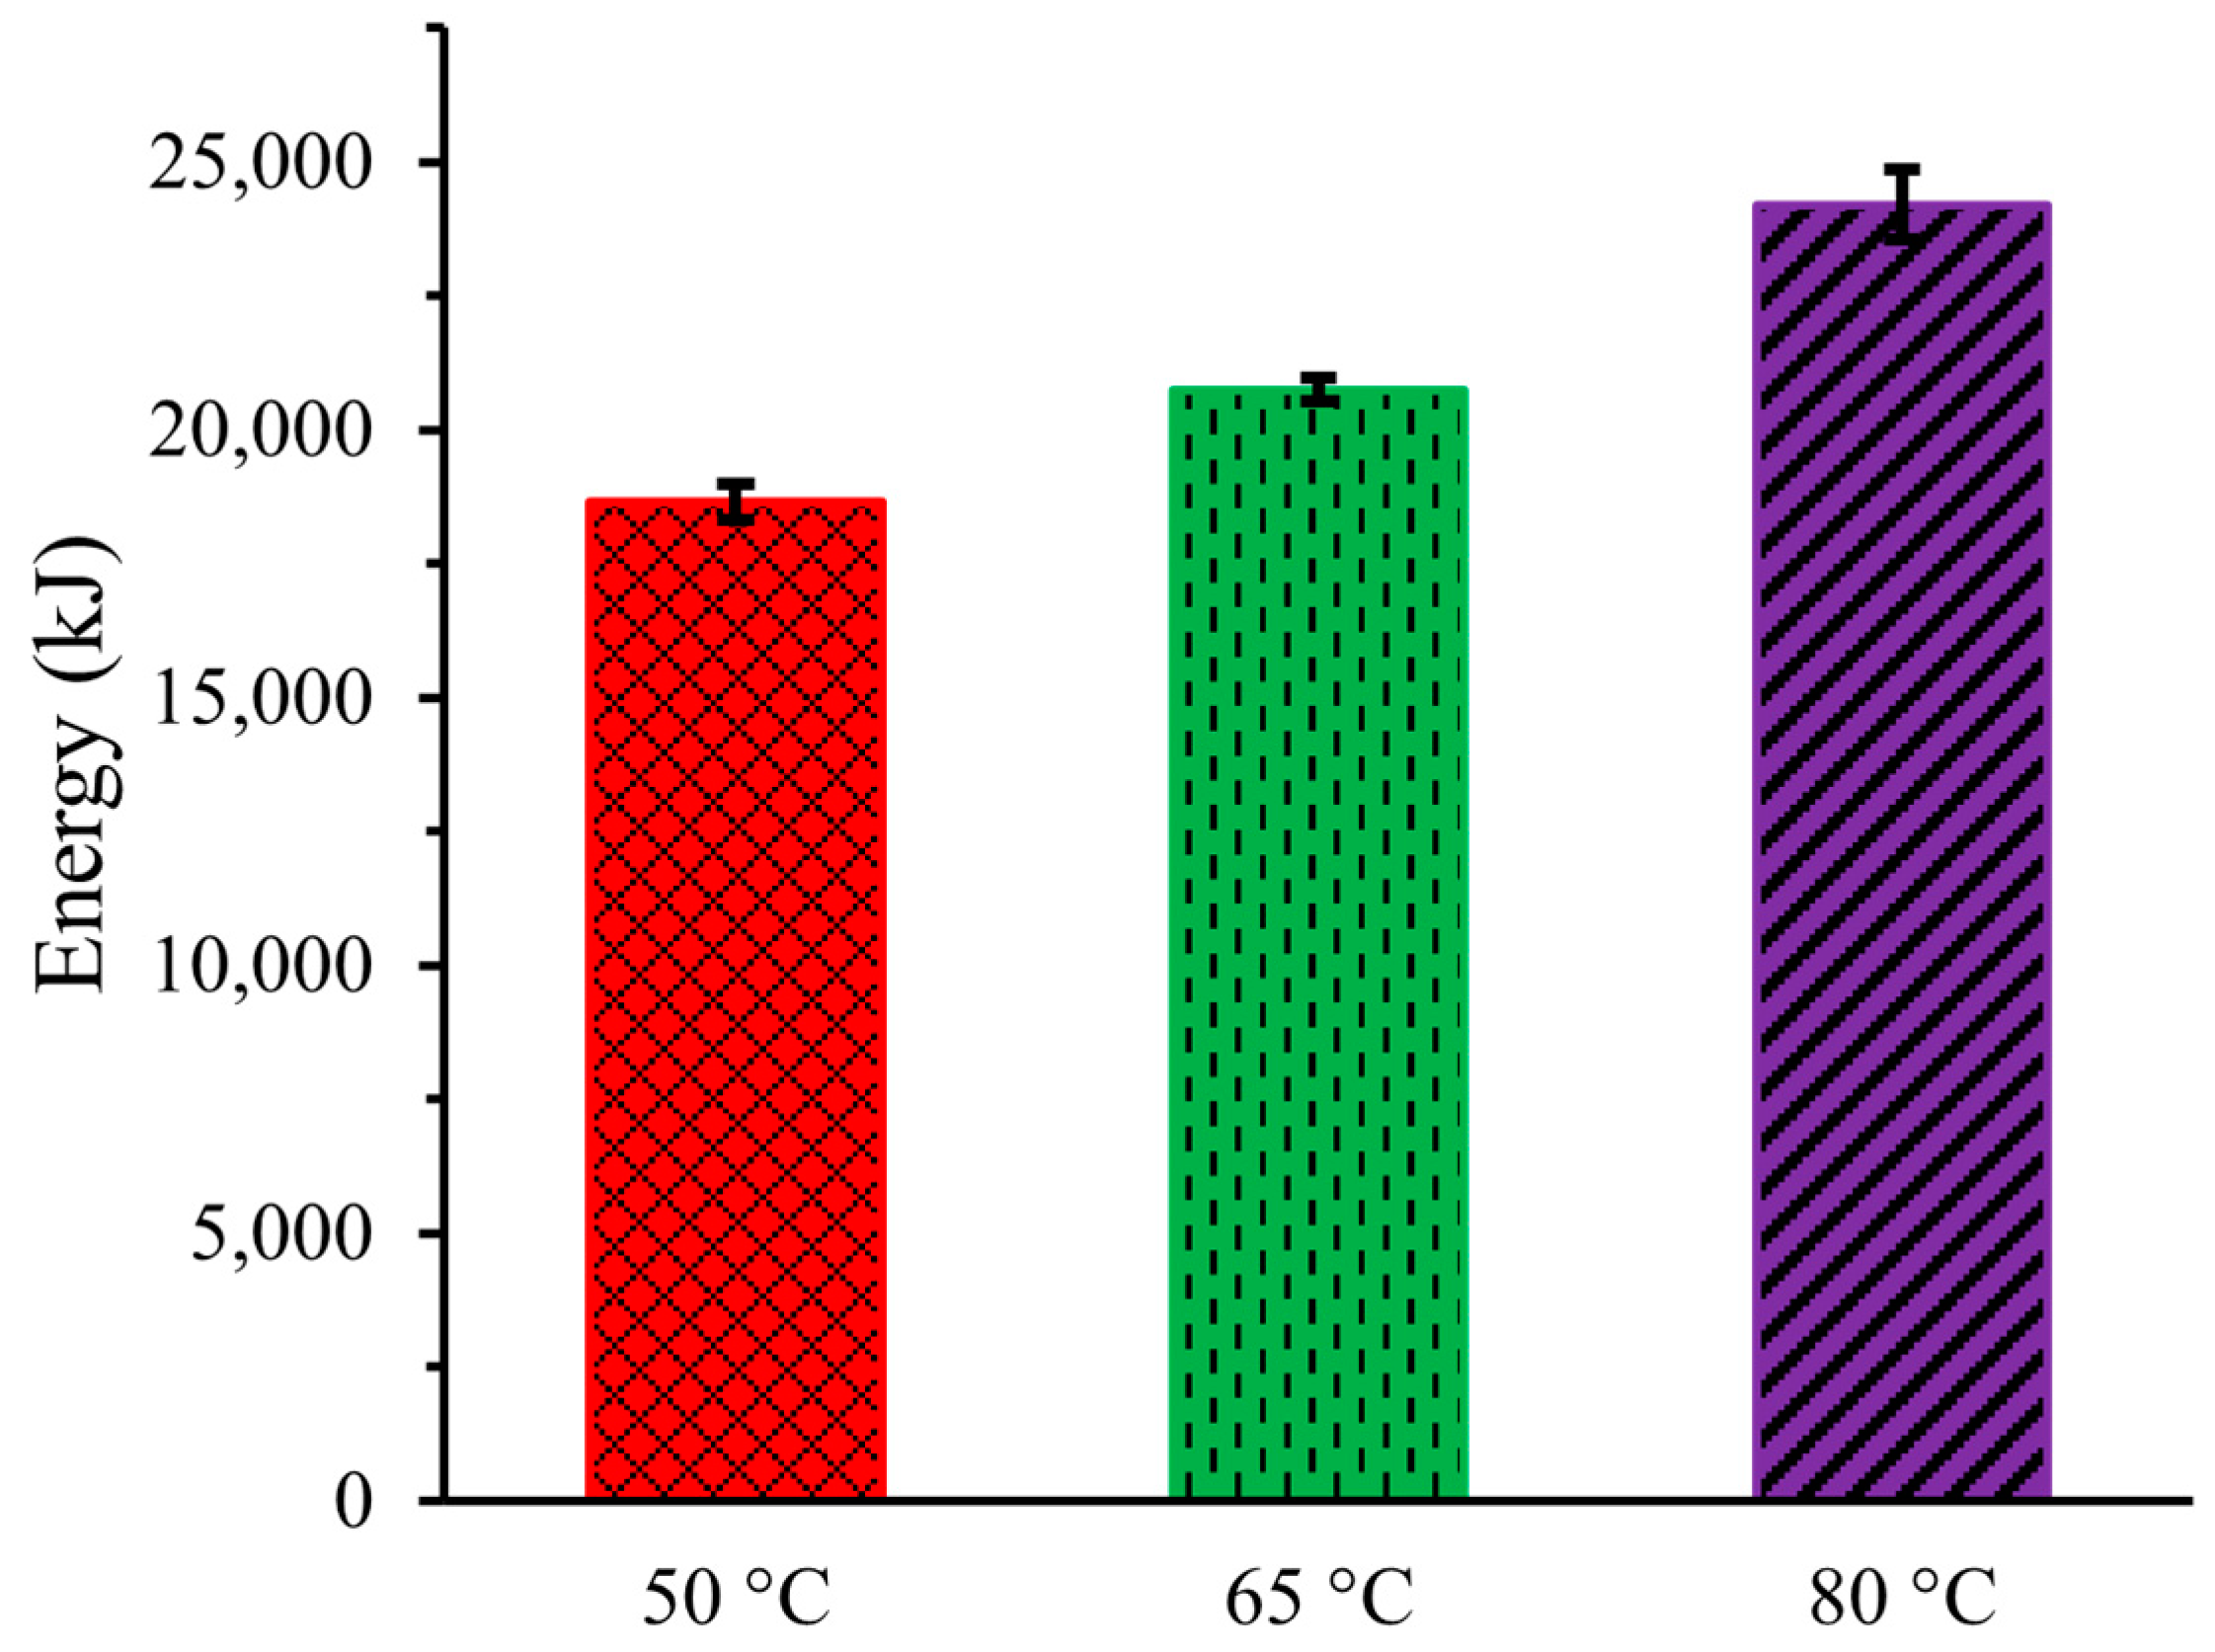
2.6. Energy
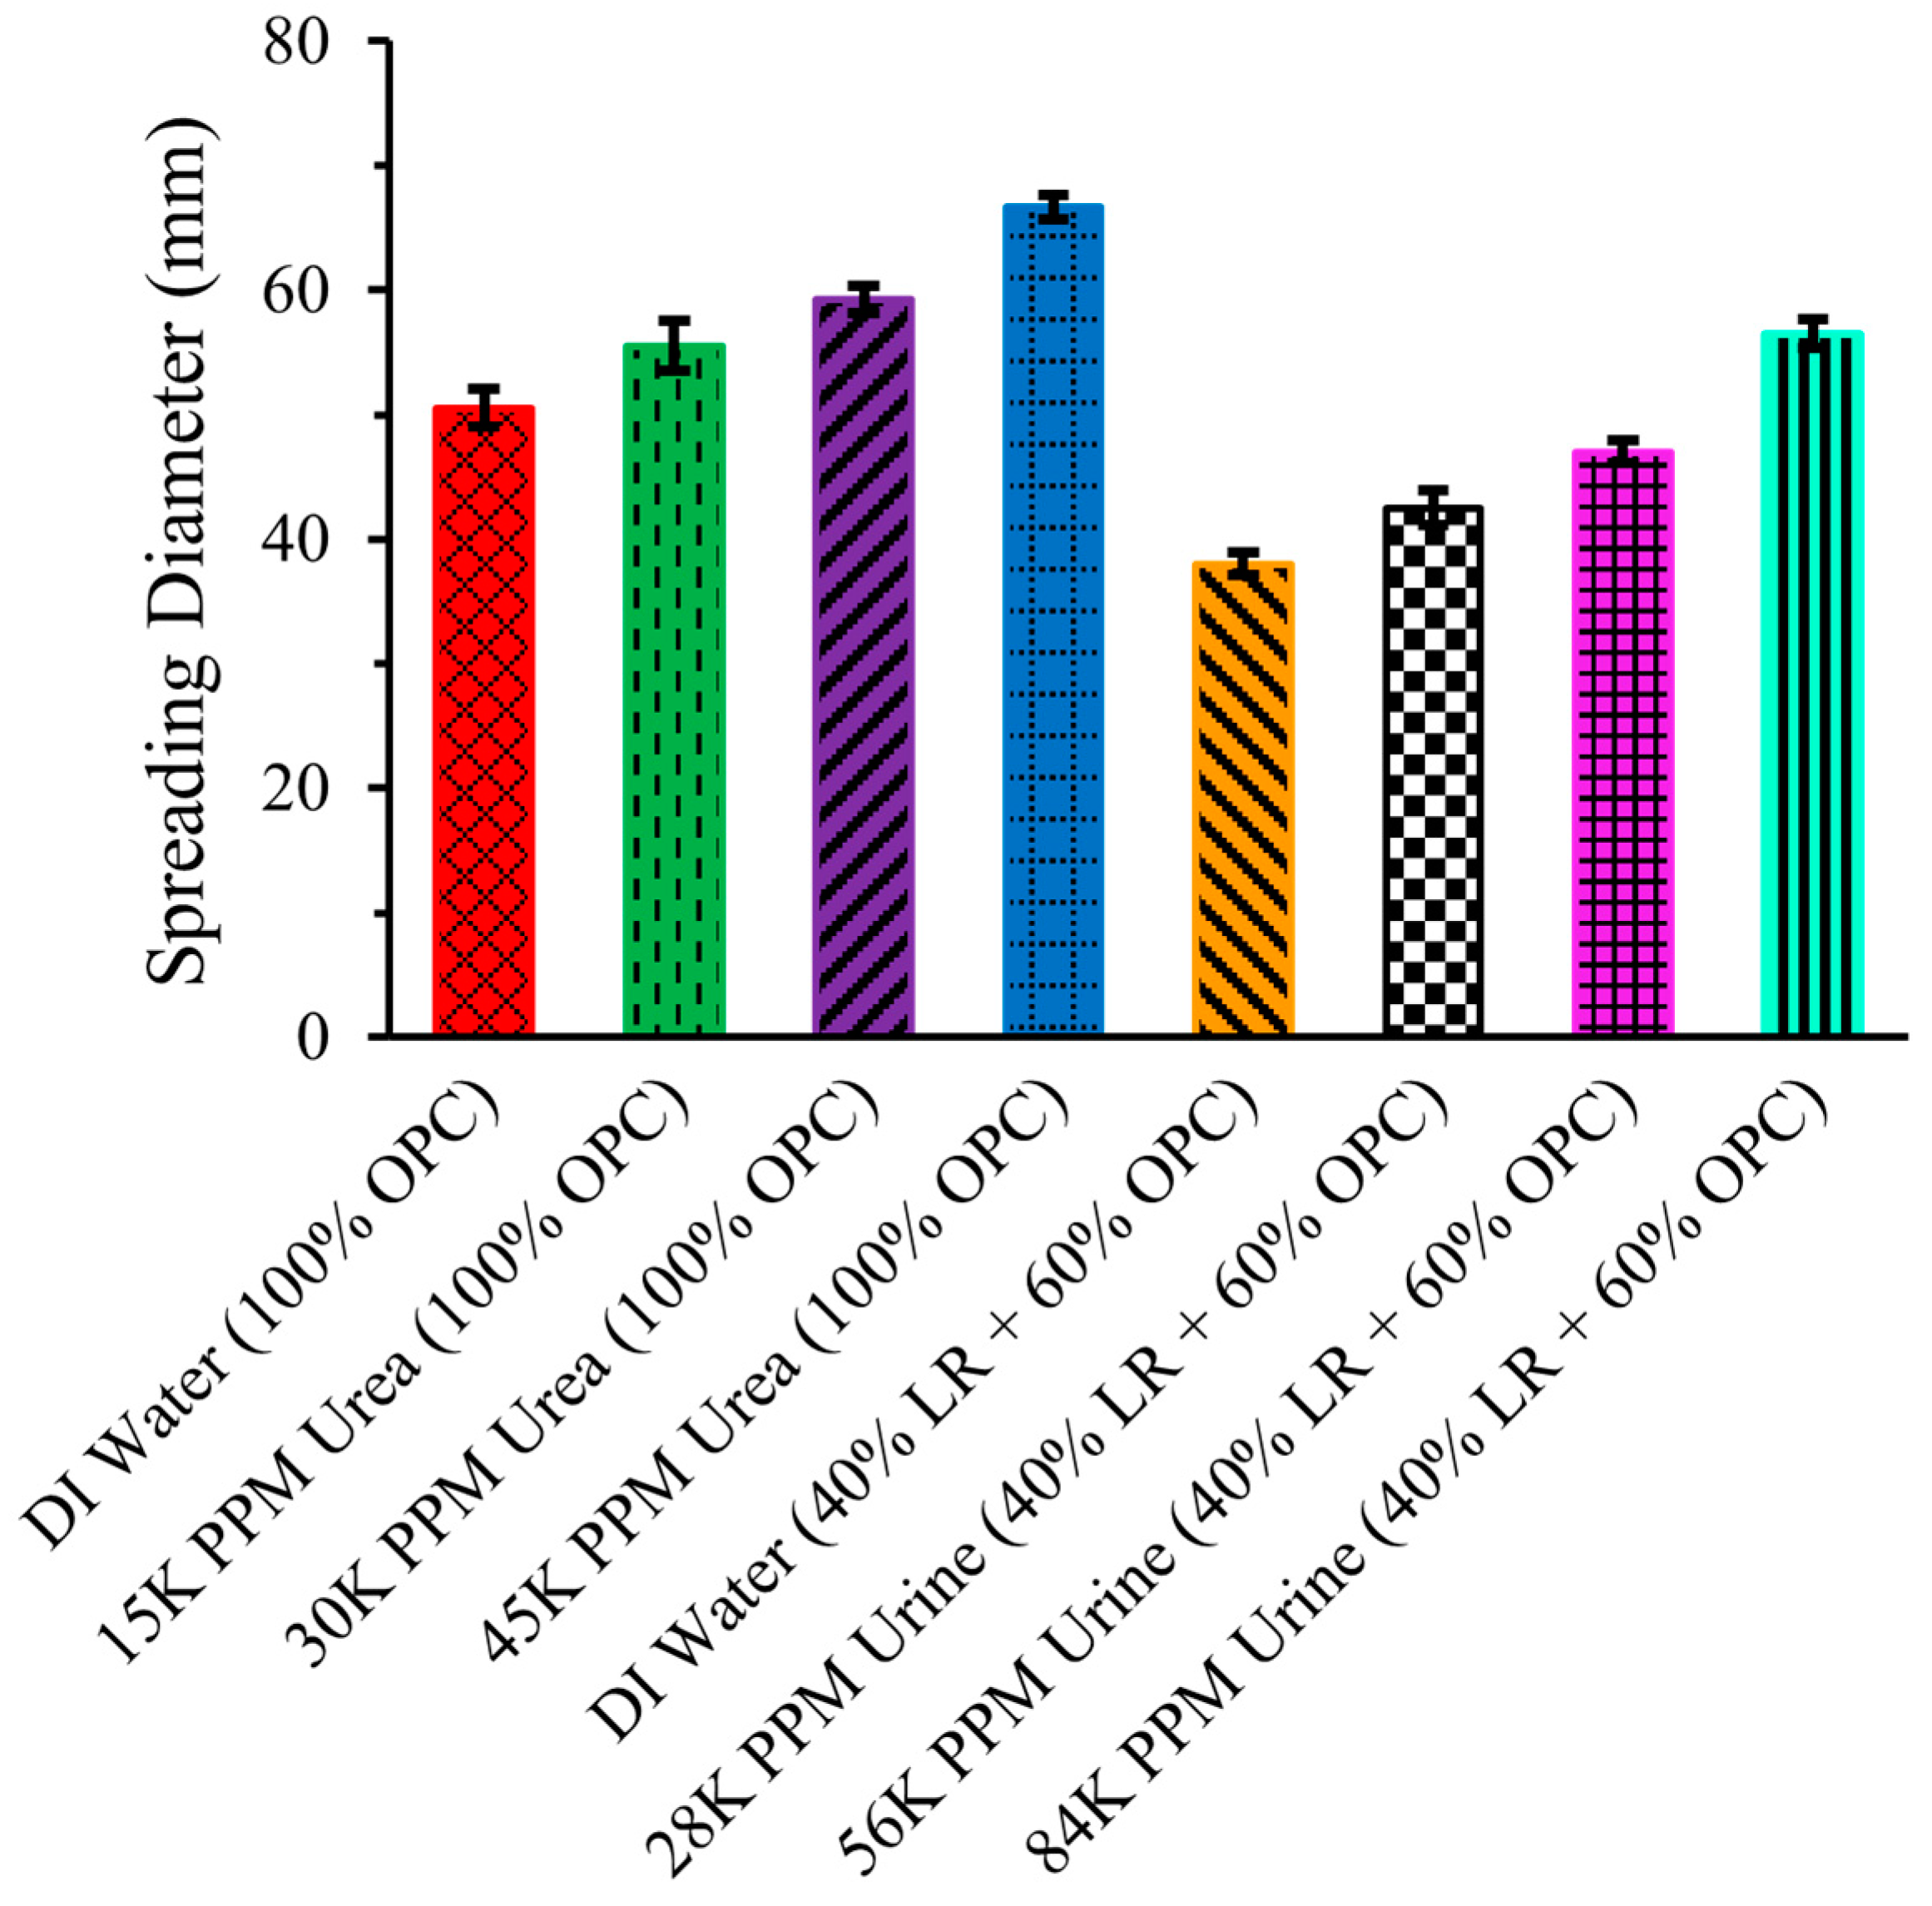
2.7. Slump Test
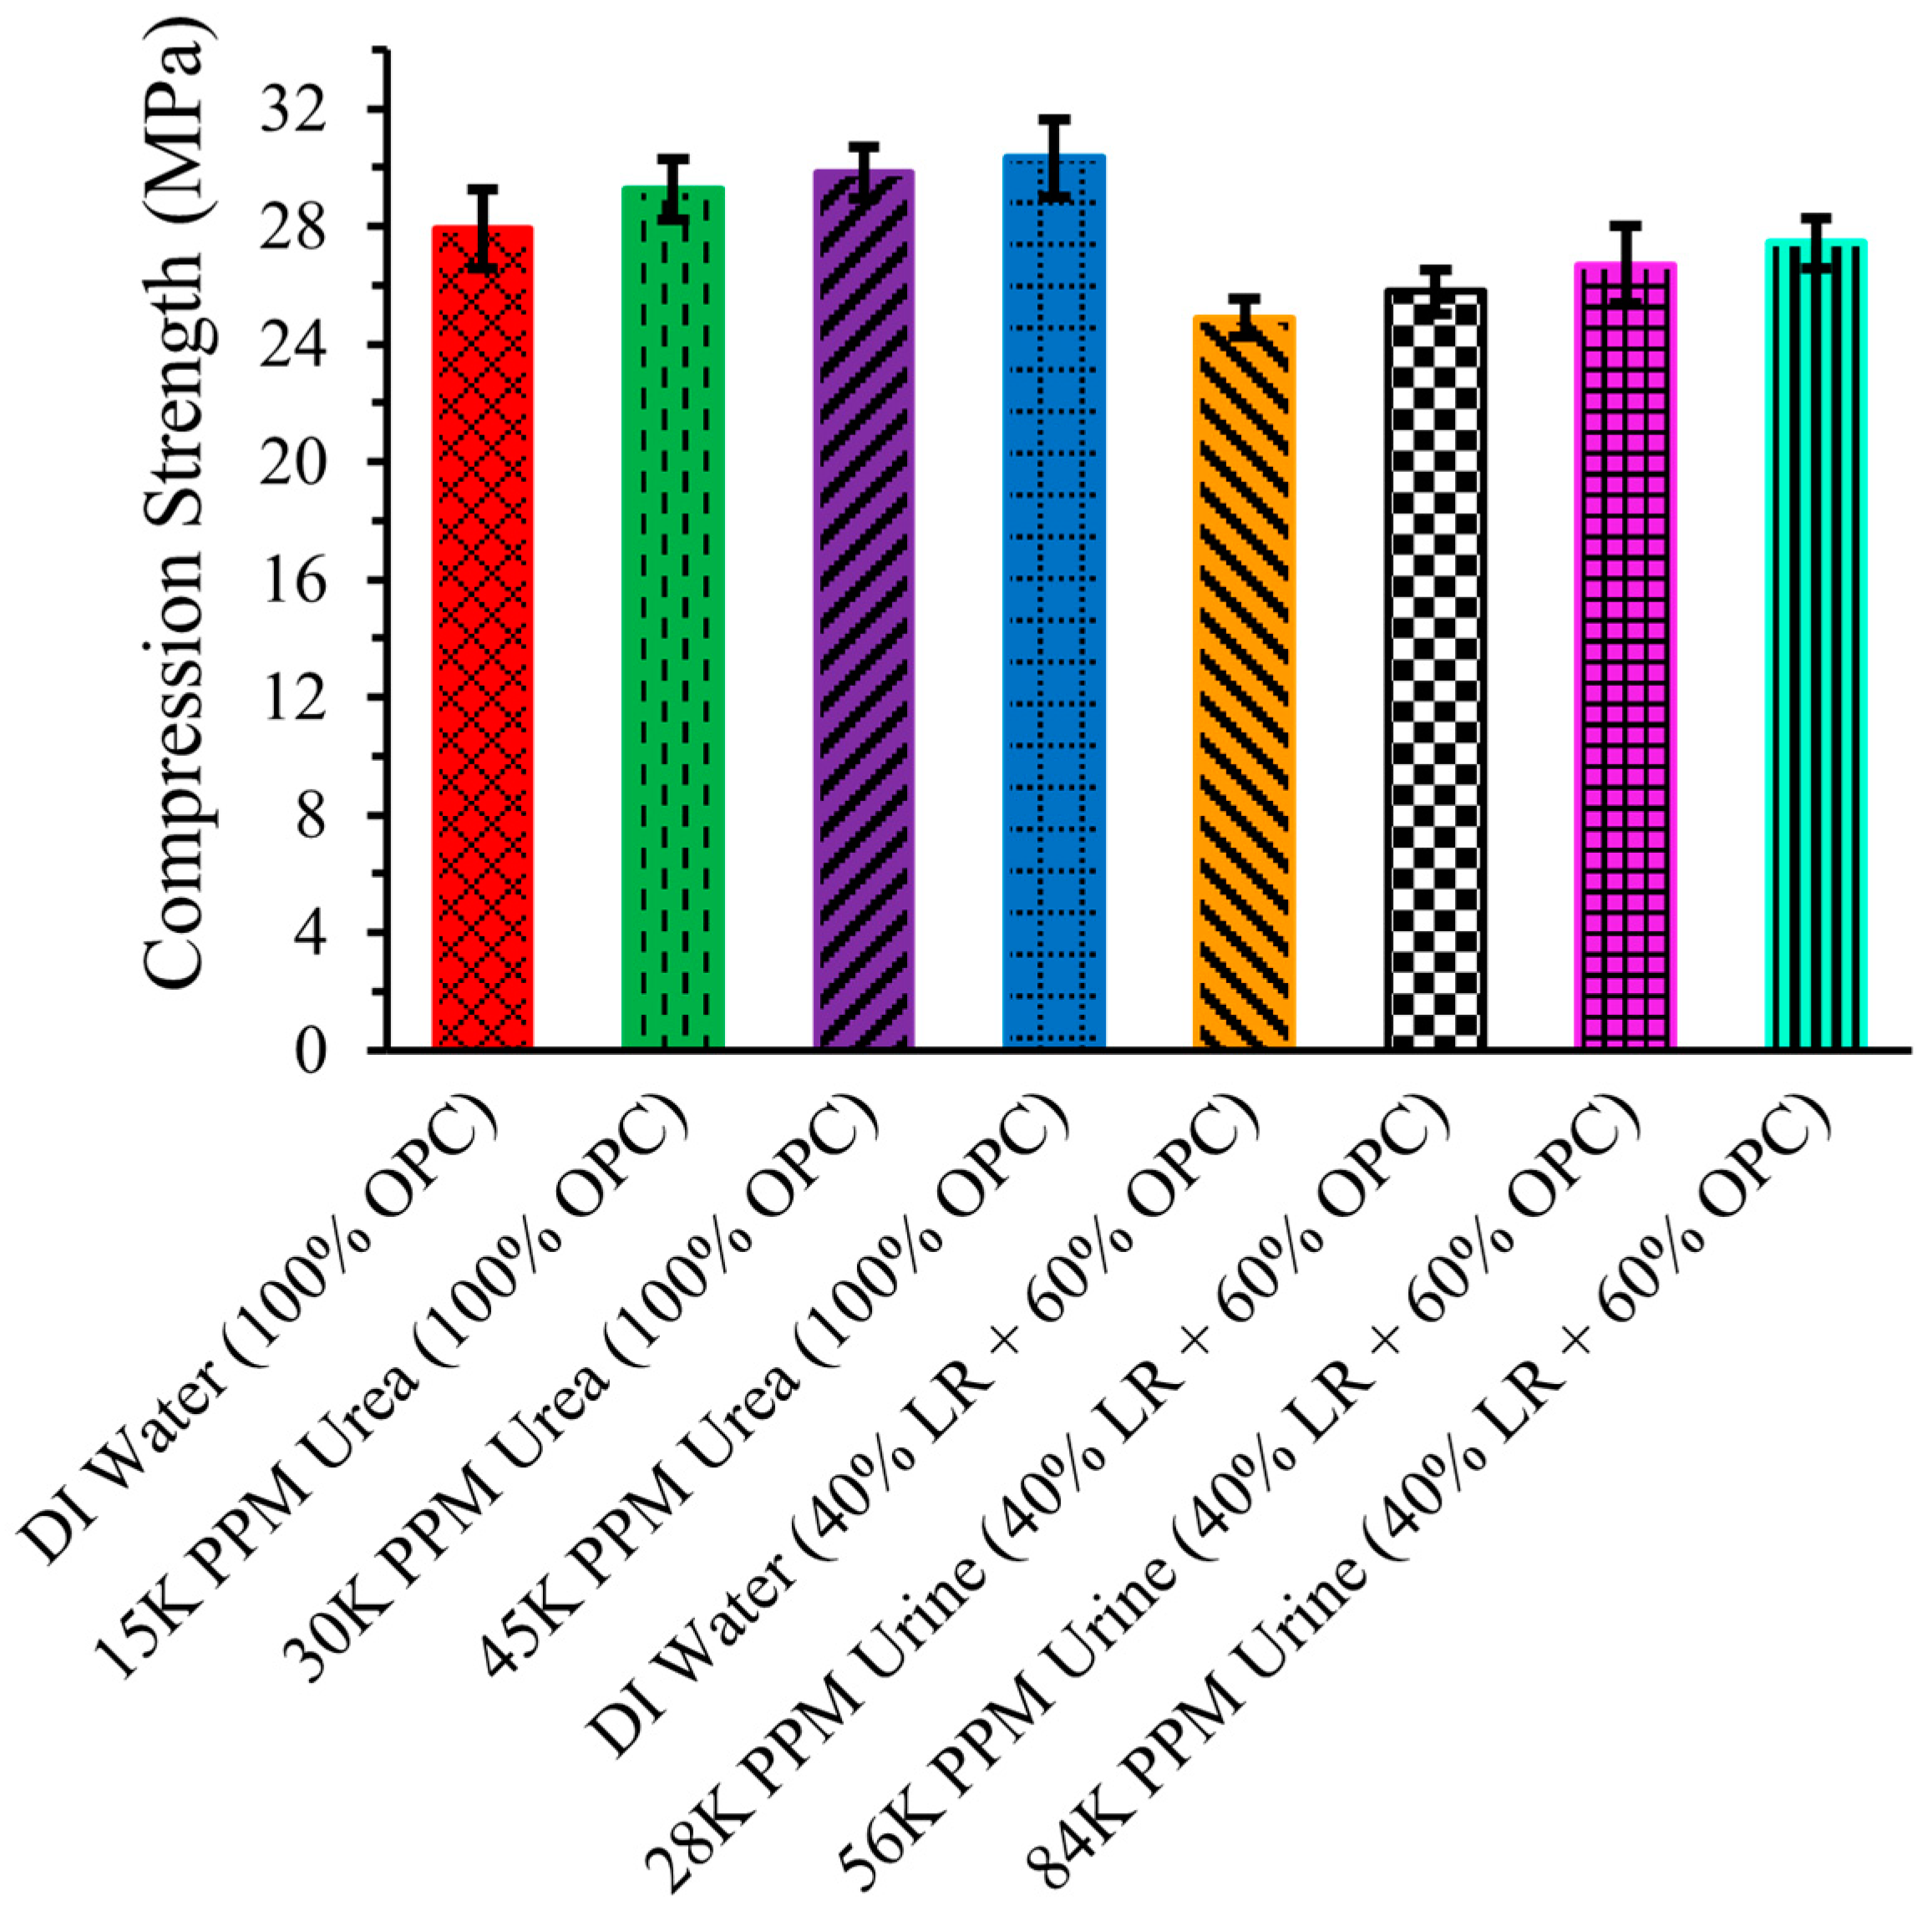
2.8. Compression Strength
2.9. Porosity
3. Materials and Methods
3.1. Raw Materials and Chemicals
3.2. Methods
3.2.1. Preparation of Artificial Urine
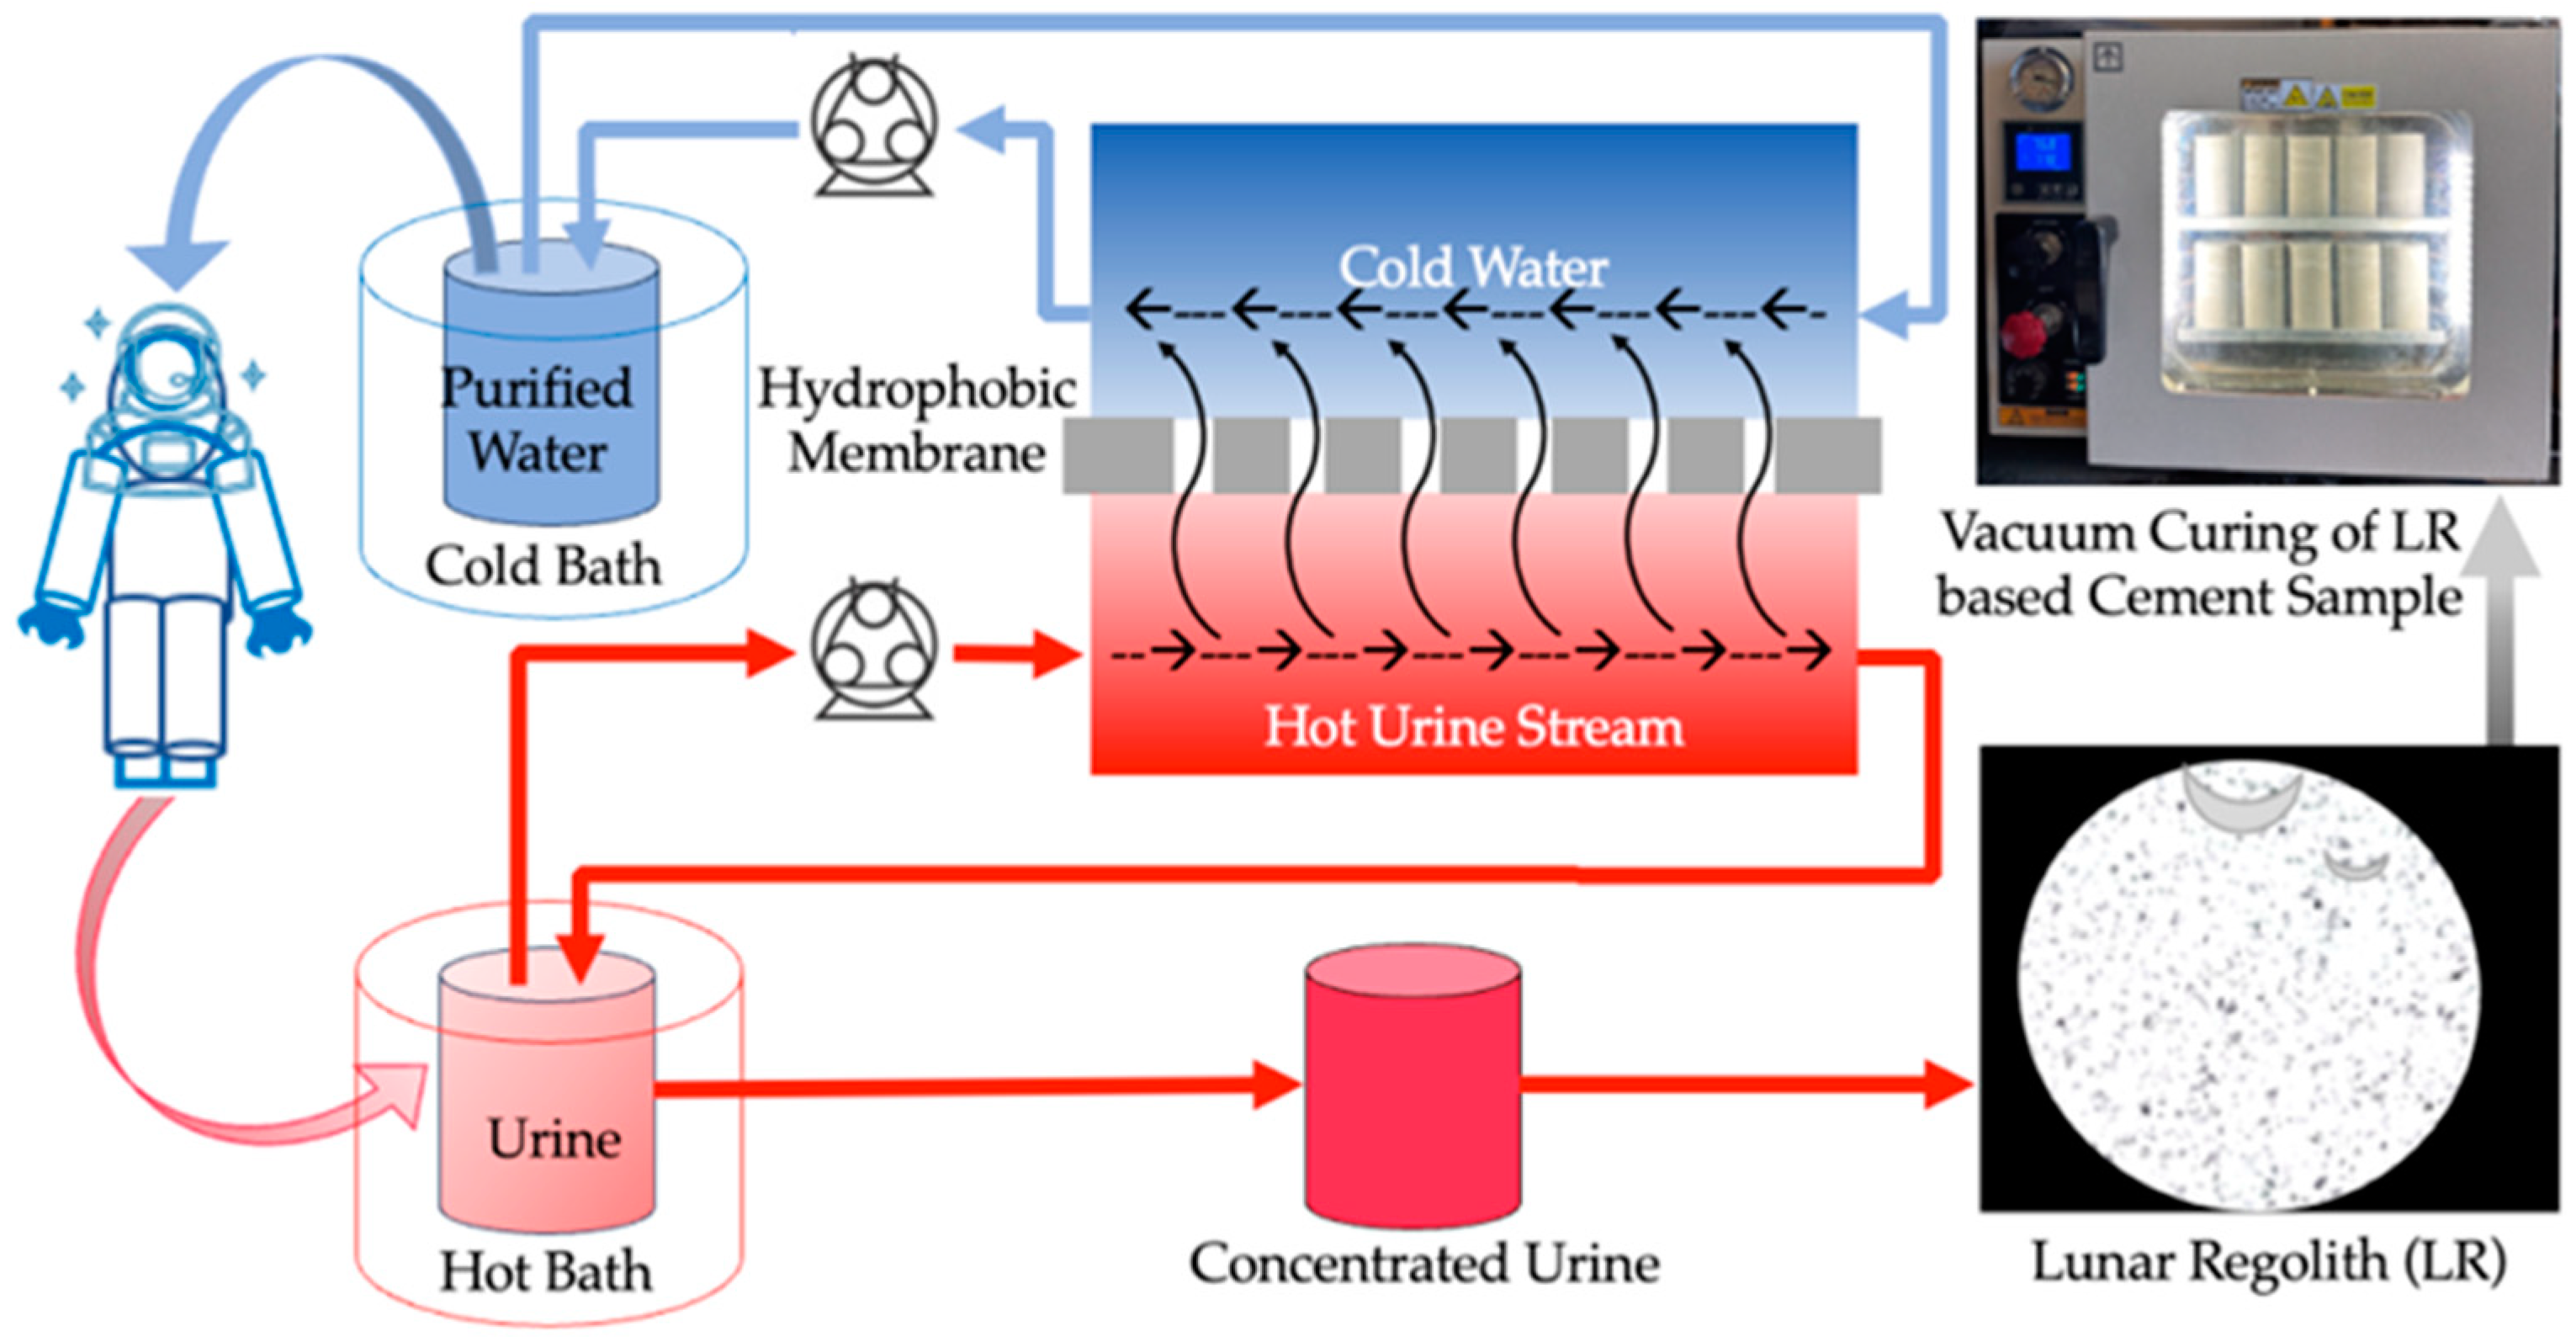
3.2.2. Direct Contact Membrane Distillation (DCMD) of Artificial Urine
3.2.3. Preparation of Lunar-Regolith (LR)-Based Cement Sample
4. Conclusions
Supplementary Materials
Author Contributions
Funding
Data Availability Statement
Acknowledgments
Conflicts of Interest
References
- Steigerwald, W. NASA’s Artemis Base Camp on the Moon Will Need Light, Water, Elevation. Available online: https://www.nasa.gov/humans-in-space/nasas-artemis-base-camp-on-the-moon-will-need-light-water-elevation/ (accessed on 25 July 2024).
- Özen, S.; Şengül, C.; Taşdemir, M.A.; Erenoğlu, T.; Çolak, Ü.; Reyhancan, İ.A. Properties of Heavyweight Concrete for Structural and Radiation Shielding Purposes. Arab. J. Sci. Eng. 2016, 41, 1573–1584. [Google Scholar] [CrossRef]
- Pilehvar, S.; Arnhof, M.; Pamies, R.; Valentini, L.; Kjøniksen, A.-L. Utilization of urea as an accessible superplasticizer on the moon for lunar geopolymer mixtures. J. Clean. Prod. 2020, 247, 119177. [Google Scholar] [CrossRef]
- Duan, H.; Jiang, Z.; Zhu, S.; Yao, P.; Sun, Q. New composite grouting materials: Modified urea–formaldehyde resin with cement. Int. J. Min. Sci. Technol. 2012, 22, 195–200. [Google Scholar] [CrossRef]
- Simha, P.; Zabaniotou, A.; Ganesapillai, M. Continuous urea–nitrogen recycling from human urine: A step towards creating a human excreta based bio–economy. J. Clean. Prod. 2018, 172, 4152–4161. [Google Scholar] [CrossRef]
- Horvath, T.; Hayne, P.O.; Paige, D.A. Thermal and illumination environments of lunar pits and caves; models and observations from the Diviner Lunar Radiometer Experiment. Geophys. Res. Lett. 2022, 49, e2022GL099710. [Google Scholar] [CrossRef]
- Hegde, C.; Ribeiro, R. Preparation and Characterization of Hydrophobic Membranes and Their Seawater Desalination Performance Study by Direct Contact Membrane Distillation. Nat. Environ. Pollut. Technol. 2022, 21, 1599–1608. [Google Scholar] [CrossRef]
- Sirkar, K.K.; Song, L. Pilot-Scale Studies for Direct Contact Membrane Distillation-Based Desalination Process. In Desalination and Water Purification Research and Development Program Report; U.S. Department of the Interior Bureau of Reclamation: Washington, DC, USA, 2009. [Google Scholar]
- Khumalo, N.; Nthunya, L.; Derese, S.; Motsa, M.; Verliefde, A.; Kuvarega, A.; Mamba, B.B.; Mhlanga, S.; Dlamini, D.S. Water recovery from hydrolysed human urine samples via direct contact membrane distillation using PVDF/PTFE membrane. Sep. Purif. Technol. 2019, 211, 610–617. [Google Scholar] [CrossRef]
- Tarikuzzaman, M.; Iqbal, M.A.; Lynam, J.G. Direct Contact Membrane Distillation of Artificial Urine for Sugar Beet Production in a Hydroponic System. J. Ecol. Eng. 2024, 25, 252–260. [Google Scholar] [CrossRef] [PubMed]
- Lee, J.-G.; Kim, W.-S.; Choi, J.-S.; Ghaffour, N.; Kim, Y.-D. Dynamic solar-powered multi-stage direct contact membrane distillation system: Concept design, modeling and simulation. Desalination 2018, 435, 278–292. [Google Scholar] [CrossRef]
- Mohammad, A.W.; Teow, Y.H.; Ang, W.L.; Chung, Y.T.; Oatley-Radcliffe, D.L.; Hilal, N. Nanofiltration membranes review: Recent advances and future prospects. Desalination 2015, 356, 226–254. [Google Scholar] [CrossRef]
- Sagar, V.; Mekalip Lauren, M.; Lynam Joan, G. Membrane distillation of synthetic urine for use in space structural habitat systems. Green Process. Synth. 2024, 13, 1599–1604. [Google Scholar] [CrossRef]
- Fei, W.; Junfeng, L.; Da, L.; Zheng, L.; Jie, Z.; Ping, D.; Guochang, L.; Yujie, F. High-Efficiency Water Recovery from Urine by Vacuum Membrane Distillation for Space Applications: Water Quality Improvement and Operation Stability. Membranes 2022, 12, 629. [Google Scholar] [CrossRef] [PubMed]
- Sarigul, N.; Korkmaz, F.; Kurultak, İ. A New Artificial Urine Protocol to Better Imitate Human Urine. Scientific Reports 2019, 9, 1–11. [Google Scholar] [CrossRef] [PubMed]
- Kulthanan, K.; Nuchkull, P.; Varothai, S. The pH of water from various sources: An overview for recommendation for patients with atopic dermatitis. Asia Pac. Allergy 2013, 3, 155–160. [Google Scholar] [CrossRef] [PubMed]
- Zakrzewska-Trznadel, G.; Harasimowicz, M.; Chmielewski, A.G. Concentration of radioactive components in liquid low-level radioactive waste by membrane distillation. J. Membr. Sci. 1999, 163, 257–264. [Google Scholar] [CrossRef]
- Jones, B.M.; Aleksandrov, A.; Dyar, M.D.; Hibbitts, C.A.; Orlando, T.M. Investigation of water interactions with Apollo lunar regolith grains. J. Geophys. Res. Planets 2020, 125, e2019JE006147. [Google Scholar] [CrossRef]
- Ma, B.; Yi, P.; Hongbo, T.; Zhenghang, L.; Xiufeng, D. Effect of Polyacrylic Acid on Rheology of Cement Paste Plasticized by Polycarboxylate Superplasticizer. Materials 2018, 11, 1081. [Google Scholar] [CrossRef] [PubMed]
- Peng, Y.; Su, L.; Wang, Y.; Zhang, L. Analysis of the Effect of Porosity in Concrete under Compression Based on DIP Technology. J. Mater. Civ. Eng. 2022, 34, 04021376. [Google Scholar] [CrossRef]
- ASTM C143/C143M-12; Standard Test Method for Slump of Hydraulic-Cement Concrete. ASTM International: West Conshohocken, PA, USA, 2015. [CrossRef]
- Akond, A.U.R.; Lynam, J.G. Deep eutectic solvent extracted lignin from waste biomass: Effects as a plasticizer in cement paste. Case Stud. Constr. Mater. 2020, 13, e00460. [Google Scholar] [CrossRef]
- ASTM C39/C39M-21; Standard Test Method for Compressive Strength of Cylindrical Concrete Specimens. ASTM International: West Conshohocken, PA, USA, 2023. [CrossRef]
- Andreola, F.; Leonelli, C.; Romagnoli, M.; Miselli, P. Techniques Used to Determine Porosity. Am. Ceram. Soc. Bull. 2000, 79, 49–52. [Google Scholar]


| Chemical Name | Chemical Formula | Quantity (Gram) | Supplier |
|---|---|---|---|
| Sodium Sulfate | Na2SO4 | 1.700 | Flinn Scientific, Batavia, IL, USA |
| Uric Acid | C5H4N4O3 | 0.250 | Sigma Aldrich, Buchs, Switzerland |
| Sodium Citrate | Na3C6H5O7.2H2O | 0.720 | Flinn Scientific, Batavia, IL, USA |
| Creatinine | C4H7N3O | 0.881 | Sigma Aldrich, Jiangsu, China |
| Urea | CH4N2O | 15.000 | Sigma Aldrich, Steinheim, Germany |
| Potassium Chloride | KCl | 2.308 | Flinn Scientific, Batavia, IL, USA |
| Sodium Chloride | NaCl | 1.756 | Fisher Scientific, Fair Lawn, NJ, USA |
| Calcium Chloride | CaCl2 | 0.1850 | Flinn Scientific, Batavia, IL, USA |
| Ammonium Chloride | NH4Cl | 1.266 | Flinn Scientific, Batavia, IL, USA |
| Potassium Oxalate Monohydrate | K2C2O4.H2O | 0.035 | Flinn Scientific, Batavia, IL, USA |
| Magnesium Sulfate | MgSO4.7H2O | 1.082 | Flinn Scientific, Batavia, IL, USA |
| Sodium Phosphate Dihydrate | NaH2PO4.2H2O | 2.912 | Aldon Corporation, NY, USA |
| Sodium Phosphate Dibasic Dihydrate | Na2HPO4.2H2O | 0.831 | Sigma Aldrich, Steinheim, Germany |
| Compound | LHS-1 | OPC |
|---|---|---|
| SiO2 | 51.2 | 19.3 |
| TiO2 | 0.6 | 0 |
| Al2O3 | 26.6 | 4.9 |
| FeO | 2.7 | 0 |
| Fe2O3 | 0 | 3.7 |
| MnO | 0.1 | 0 |
| MgO | 1.6 | 1.3 |
| CaO | 12.8 | 64.5 |
| Na2O | 2.9 | 0 |
| K2O | 0.5 | 0 |
| P2O5 | 0.1 | 0 |
| SO3 | 0 | 3.4 |
| LOI * | 0.4 | 2.49 |
| Insoluble residue | 0 | 0.41 |
| Total ** | 99.4 | 100.0 |
| Sample Name | OPC (g) | LR (g) | DI Water (g) | Urea Solution (g) | Conc. Artificial Urine (g) | Liquid to Solid Ratio |
|---|---|---|---|---|---|---|
| DI Water (100% OPC) | 3000 | 1350 | 0.45 | |||
| 15 K PPM Urea (100% OPC) | 3000 | 1350 | 0.45 | |||
| 30 K PPM Urea (100% OPC) | 3000 | 1350 | 0.45 | |||
| 45 K PPM Urea (100% OPC) | 3000 | 1350 | 0.45 | |||
| DI Water (60% OPC + 40% LR) | 1800 | 1200 | 1350 | 0.45 | ||
| 28 K PPM Urine (60% OPC + 40% LR) | 1800 | 1200 | 1350 | 0.45 | ||
| 54 K PPM Urine (60% OPC + 40% LR) | 1800 | 1200 | 1350 | 0.45 | ||
| 84 K PPM Urine (60% OPC + 40% LR) | 1800 | 1200 | 1350 | 0.45 |
Disclaimer/Publisher’s Note: The statements, opinions and data contained in all publications are solely those of the individual author(s) and contributor(s) and not of MDPI and/or the editor(s). MDPI and/or the editor(s) disclaim responsibility for any injury to people or property resulting from any ideas, methods, instructions or products referred to in the content. |
© 2024 by the authors. Licensee MDPI, Basel, Switzerland. This article is an open access article distributed under the terms and conditions of the Creative Commons Attribution (CC BY) license (https://creativecommons.org/licenses/by/4.0/).
Share and Cite
Tarikuzzaman, M.; Gordon, S.T.; Alam, S.; Lynam, J.G. Direct Contact Membrane Distillation of Artificial Urine and Its Application in Plasticizing Lunar Regolith. Recycling 2024, 9, 89. https://doi.org/10.3390/recycling9050089
Tarikuzzaman M, Gordon ST, Alam S, Lynam JG. Direct Contact Membrane Distillation of Artificial Urine and Its Application in Plasticizing Lunar Regolith. Recycling. 2024; 9(5):89. https://doi.org/10.3390/recycling9050089
Chicago/Turabian StyleTarikuzzaman, Mohammad, Stephen T. Gordon, Shaurav Alam, and Joan G. Lynam. 2024. "Direct Contact Membrane Distillation of Artificial Urine and Its Application in Plasticizing Lunar Regolith" Recycling 9, no. 5: 89. https://doi.org/10.3390/recycling9050089