Abstract
In the context of producing a digital surface model (DSM) and an orthophotomosaic of a study area, a modern Unmanned Aerial System (UAS) allows us to reduce the time required both for primary data collection in the field and for data processing in the office. It features sophisticated sensors and systems, is easy to use and its products come with excellent horizontal and vertical accuracy. In this study, the UAS WingtraOne GEN II with RGB sensor (42 Mpixel), multispectral (MS) sensor (1.2 Mpixel) and built-in multi-frequency PPK GNSS antenna (for the high accuracy calculation of the coordinates of the centers of the received images) is used. The first objective is to test and compare the accuracy of the DSMs and orthophotomosaics generated from the UAS RGB sensor images when image processing is performed using only the PPK system measurements (without Ground Control Points (GCPs)), or when processing is performed using only GCPs. For this purpose, 20 GCPs and 20 Check Points (CPs) were measured in the field. The results show that the horizontal accuracy of orthophotomosaics is similar in both processing cases. The vertical accuracy is better in the case of image processing using only the GCPs, but that is subject to change, as the survey was only conducted at one location. The second objective is to perform image fusion using the images of the above two UAS sensors and to control the spectral information transferred from the MS to the fused images. The study was carried out at three archaeological sites (Northern Greece). The combined study of the correlation matrix and the ERGAS index value at each location reveals that the process of improving the spatial resolution of MS orthophotomosaics leads to suitable fused images for classification, and therefore image fusion can be performed by utilizing the images from the two sensors.
1. Introduction
A typical process for collecting and processing photogrammetric data includes specific steps. In brief, Ground Control Points (GCPs) and Check Points (CPs) [1,2,3] are first selected in the field, followed by the determination of their coordinates (x, y and z) by means of a surveying instrument (e.g., Global Navigation Satellite System (GNSS)). GCPs are required to resolve the triangulation, while CPs are required to monitor the products produced (Digital Surface Model (DSM) and orthophotomosaic) [4]. Next, the required images are collected and then processed via an appropriate photogrammetric or remote sensing software, allowing at last the production of the DSM and the orthophotomosaic of the study area [4,5].
The products, the DSM and orthophotomosaic, should be tested using CPs to determine their actual horizontal and vertical accuracy. Coordinates x’, y’ and z’ of the CPs are digitally collected (from, e.g., a geographic information system or photogrammetric or remote sensing software) from these products in order to be compared with the coordinates (x, y, z) of the same CPs measured in the field (e.g., via GNSS).
The principal methods of product evaluation are the mean, the standard deviation and the Root Mean Square Error [4,5,6,7]. Furthermore, when we are dealing with normally distributed data, then the analysis of variance (ANOVA) performs hypothesis tests to determine the differences in the mean values and standard deviations of the various data sets (x-measurement on the product and x-measurement in the field, y-measurement on the product and y-measurement in the field, z-measurement on the product and z-measurement in the field) [8].
Currently, aerial surveys are mainly carried out with the use of an Unmanned Aerial System (UAS). This is due to the fact that these systems offer ease of use, product accuracy and automation in aerial data collection processes. Modern UASs feature sophisticated sensors and systems that minimize working time [9] both in the field and in the office. The working time in the field is significantly reduced as, according to the UAS manufacturers, either the collection of GCPs and CPs is not necessary, or the number is very small when the UAS is equipped, e.g., with a multi-frequency Post-Processing Kinematic (PPK) GNSS receiver [10]. In the office, the elimination of manual selection of GCPs or automatic finding of GCPs in images that then need to be checked to confirm that they were correctly marked reduces processing time [8]. However, in PPK or Real Time Kinematic (RTK) systems, inherent high systematic errors occur in the calculation of the Z coordinates [5].
In several projects where a UAS is equipped with RTK or PPK, it has been observed that processing without the use of GCPs leads to good horizontal accuracy (comparable to the accuracy achieved with the exclusive use of GCPs), but considerably lower altimetric accuracy compared to that achieved by the exclusive use of GCPs. In these applications, there are a variety of different terrains in the areas to be mapped (smooth to rugged terrain), a structured to unstructured mapping surface, different flight heights (from 30 m to 120 m), different sensors, classic image collection strips perpendicular to each other in the same flight, different UASs (multi-rotor, fixed-wing), etc. [4,11,12,13,14,15,16,17,18]. However, there are also studies (though fewer) that report that the use of RTK or PPK (processing without GCPs) results in products of equal or better accuracy on all three axes as opposed to processing with the exclusive use of GCPs [19,20,21,22].
In the present study, the UAS WingtraOne GEN II with RGB sensor (42 Mpixel) and built-in multi-frequency PPK GNSS antenna was used to calculate with a high level of accuracy the coordinates of the centers of the images received [10].
The first objective of this study is to test the accuracy of the DSM and the orthophotomosaic of the UAS RGB sensor by exploiting a large number of CPs when a solution is applied:
- Without GCPs (direct georeferencing), but with known X, Y and Z coordinates of the image centers (PPK utilization);
- Using only GCPs (no known X, Y or Z values of the image centers).
The above shows whether classical processing with GCPs leads to better results compared to processing without the use of GCPs (using only PPK data) or vice versa. To enable this test, 20 GCPs and 20 CPs were measured in the field by means of GNSS (Topcon HiPer SR, Tokyo, Japan). For each of the above two processing cases, the coordinates (x’, y’, z’) of the CPs were extracted from the products (DSM and orthoimagery) and then compared with the measurements (using GNSS) of their coordinates (x, y, z) in the field. This research was carried out at the archaeological site of the Acropolis of Platanias (North Greece, Figure 1).

Figure 1.
The location of Greece in Europe and the locations of the archaeological sites of the Acropolis of Platanias, the Ancient Theater of Mieza and the Kasta Mound.
From the very early years of the emergence of remote sensing science, one of the key processes for processing satellite images was image fusion. Methodological image fusion procedures allow us to improve the spatial resolution of the multispectral (MS) image by utilizing the panchromatic (PAN) image with better spatial resolution, while trying to preserve to a large extent the spectral information of the original MS image transferred to the fused image [23,24,25,26,27,28,29,30,31,32,33,34,35,36,37,38,39,40,41].
In the case of UASs, MS sensors do not feature a PAN sensor. The only exception is the MicaSense RedEdge-P (with a high-resolution PAN band), which made its appearance a few months ago.
The UAS used in this study can also make use of an MS sensor (1.2 Mpixel, Bands: RGB, Blue, Green, Red, RedEdge, Near Infrared (NIR)), replacing the RGB sensor (42 Mpixel) and performing a new flight to capture the study area.
In previous papers, image fusion was performed using RGB and MS images from the same sensor (Sequoia+ by Parrot) or different sensors (RGB images from Phantom 4 and MS images from Sequoia+ by Parrot) for the UAS. These efforts have demonstrated that it is feasible to improve the spatial resolution of MS images, while preserving a reasonable amount of the spectral information of the original MS images transferred to the fused images [8,42]. The minimum allowable flight height with the MS sensor (1.2 Mpixel) on the WingtraOne GEN II UAS is 100 m. This results in a spatial resolution of the MS images of about 7 cm. The spatial resolution of the RGB sensor (42 Mpixel) for the minimum allowable flight height of 60 m (the minimum allowable flight heights for the two sensors are different) is about 1 cm. Thus, it is interesting to produce fused images with a spatial resolution of about 1 cm, because in many archaeological investigations this spatial resolution is required.
The second objective of this paper is to perform image fusion using the images of the two sensors (RGB 42 Mpixel and MS 1.2 Mpixel) of the UAS, and to control the spectral information of the original MS images transferred to the fused images. The research took place in three archaeological sites, the Acropolis of Platanias, the Ancient Theater of Mieza and the Kasta Mound (the locations are in Northern Greece, Figure 1).
2. Areas of Study
The Acropolis of Platanias (41°11′05.4″ N 24°26′03.2″ E) is located in the prefecture of Drama (Northern Greece, Figure 1). Archaeological research has revealed the existence and use of the site of the acropolis since prehistoric times until late Roman antiquity. It is an acropolis of an ellipsoidal shape at an altitude of about 650 m to 670 m with a perimeter of about 270 m, built on a natural rock. The height of the walls varies from 2.3 m to 2.5 m. The first phase of the acropolis dates back to prehistoric times, while in its second phase it was used by cattle breeders. In its third phase, it was developed by the Greek king of Macedonia, Philip II (382 BC–336 BC), as a point of control for the wider region. The fourth phase of the acropolis dates back to Roman times; the fifth phase is linked to the construction of the dormitories and storage areas of the 3rd century AD and the sixth phase is linked to coins and other findings of the 6th century AD, which testify to the presence of a small garrison in the acropolis [43].
The Ancient Theater of Mieza (Northern Greece, Figure 1) belongs to the ancient city of Votiaia Mieza (40°38′38.6″ N 22°07′21.3″ E). It was discovered in 1992 during the excavation of an underground irrigation network. It is located on the slope of a low hill, facing east. Most of its hollow has been carved in the natural soft limestone, on which the rows of seats have been placed. Most of the stones of the first seven rows have been preserved. Carvings in the natural rock, however, confirm the existence of at least 19 levels. Four staircases divide it into five stands. The orchestra is semi-circular in shape with a diameter of about 22 m. The stage consists of the main stage building and the proscenium. The southern backstage and small parts of the walls in the southern part of the stage are preserved and found at the level of its foundation. The earliest phase of the monument dates back to the Hellenistic period. Following the middle of the 2nd century BC, a new late Hellenistic-early Roman theater was built. The partial collapse of the hollow and part of the stage, probably in the 2nd century AD, led to makeshift repairs. According to coins and pottery, the theatre must have been in operation up to the 4th century AD [44].
Inside the Kasta Mound (Amphipolis, Northern Greece, Figure 1), a Macedonian burial monument was discovered dating to the last quarter of the 4th century BC (40°50′21.5″ N 23°51′44.9″ E). In the mid-1950s and until the 1970s, excavations were carried out in the upper part of the mound, bringing to light a set of modest tombs dating back to the Iron Age. Excavation of the perimeter of the site began again in 2012, and in 2014 the first findings were unearthed on the south side of the mound, i.e., the entrance to the burial monument. Three chambers were then discovered (a total of four rooms including the entrance and the stairs to the interior of the tomb). The marble enclosure of the circular mound has a perimeter of 497 m, a height of 3 m and an area of about 20,000 sq.m., and it was constructed using approximately 2500 m3 of Thassos marble. In its entirety, it is the largest burial monument discovered in Greece, and one of the most important international archaeological discoveries of 2014. In short, at the entrance of the burial monument, there is a door above which stand two marble sphinxes. Inside the mound (first chamber) there are two “Caryatids” resting on piers. In the second chamber there is a floor mosaic depicting “The Abduction of Persephone by Pluto”. In the third chamber, a tomb was found with bones belonging to five persons (the skeletons are not whole) and the remains of a horse skeleton. According to the excavation team, the monument was constructed by Deinocrates (Greek architect and technical advisor of Alexander the Great, known for many works, such as the urban planning and construction of the city of Alexandria, the funeral pyre of Hephaestion and the reconstruction of the Temple of Artemis at Ephesus) and commissioned by Alexander the Great [45].
3. Equipment
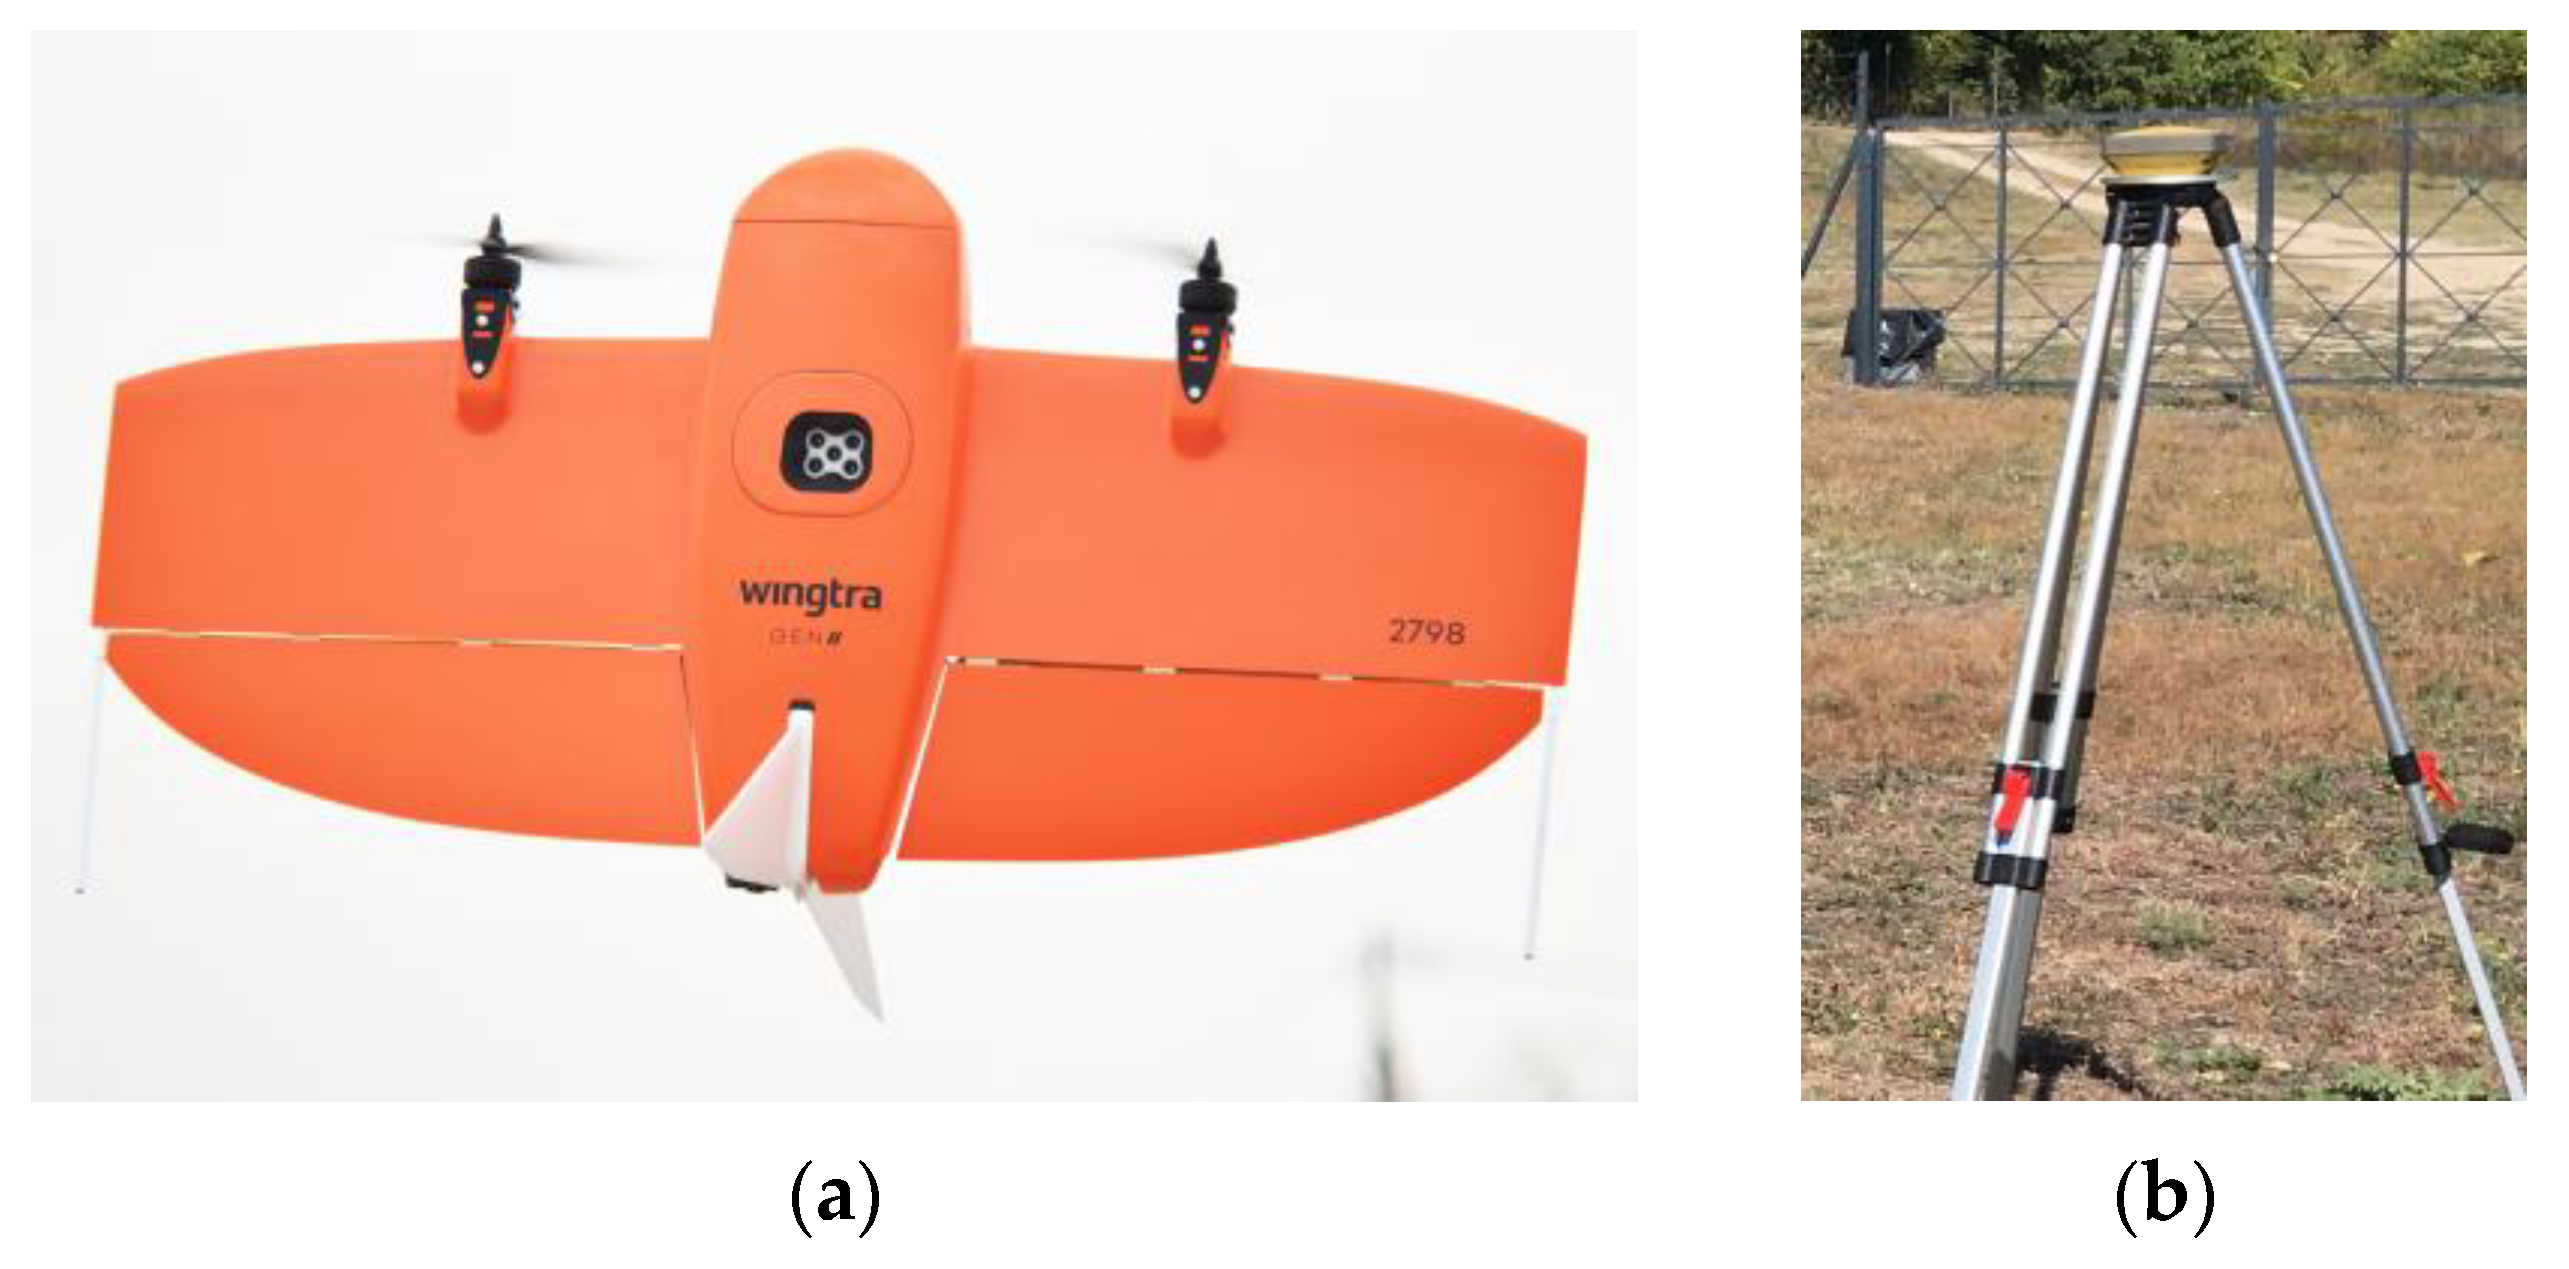
For the collection of the aerial images from the three archaeological sites, the UAS WingtraOne GEN II of Wingtra was used, while for the measurement of the GCPs and CPs at the Acropolis of Platanias, the GNSS Topcon HiPer SR was used (horizontal and vertical accuracy of real-time positioning of approximately 10 mm and 15 mm, respectively; GPS: L1, L2, L2C, GLONASS: L1, L2, 2C, SBAS-QZAA: L1, L2C) (Figure 2). No ground targets were used, as there were plenty of distinctive points on the weathered stones (the building material of the acropolis) that were distinct and easily identifiable.
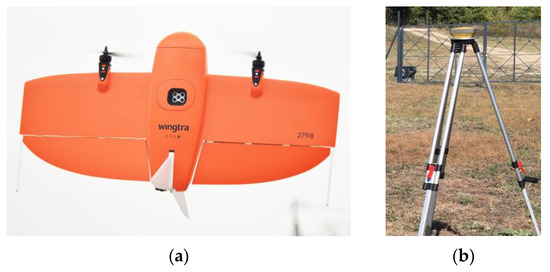
Figure 2.
(a) The UAS WingtraOne GEN II; (b) the GNSS Topcon HiPer SR mounted on a tripod.
The WingtraOne GEN II is a fixed-wing vertical takeoff and landing (VTOL) UAS, weighing 3.7 kg and measuring 125 × 68 × 12 cm. The maximum flight time is 59 min. For the calculation of the coordinates of the centers of the images received, it utilizes a built-in multi-frequency PPK GNSS antenna (GPS: L1, L2; GLONASS: L1, L2; Galileo: L1; BeiDou: L1). The flight plan and parameters are defined through the WingtraPilot© 2.11 software. It is equipped with one RGB and one MS sensor (Table 1).

Table 1.
Technical characteristics of the RGB and MS sensor [10,46] of the UAS.
4. Materials
4.1. Flight Plans and Image Collection
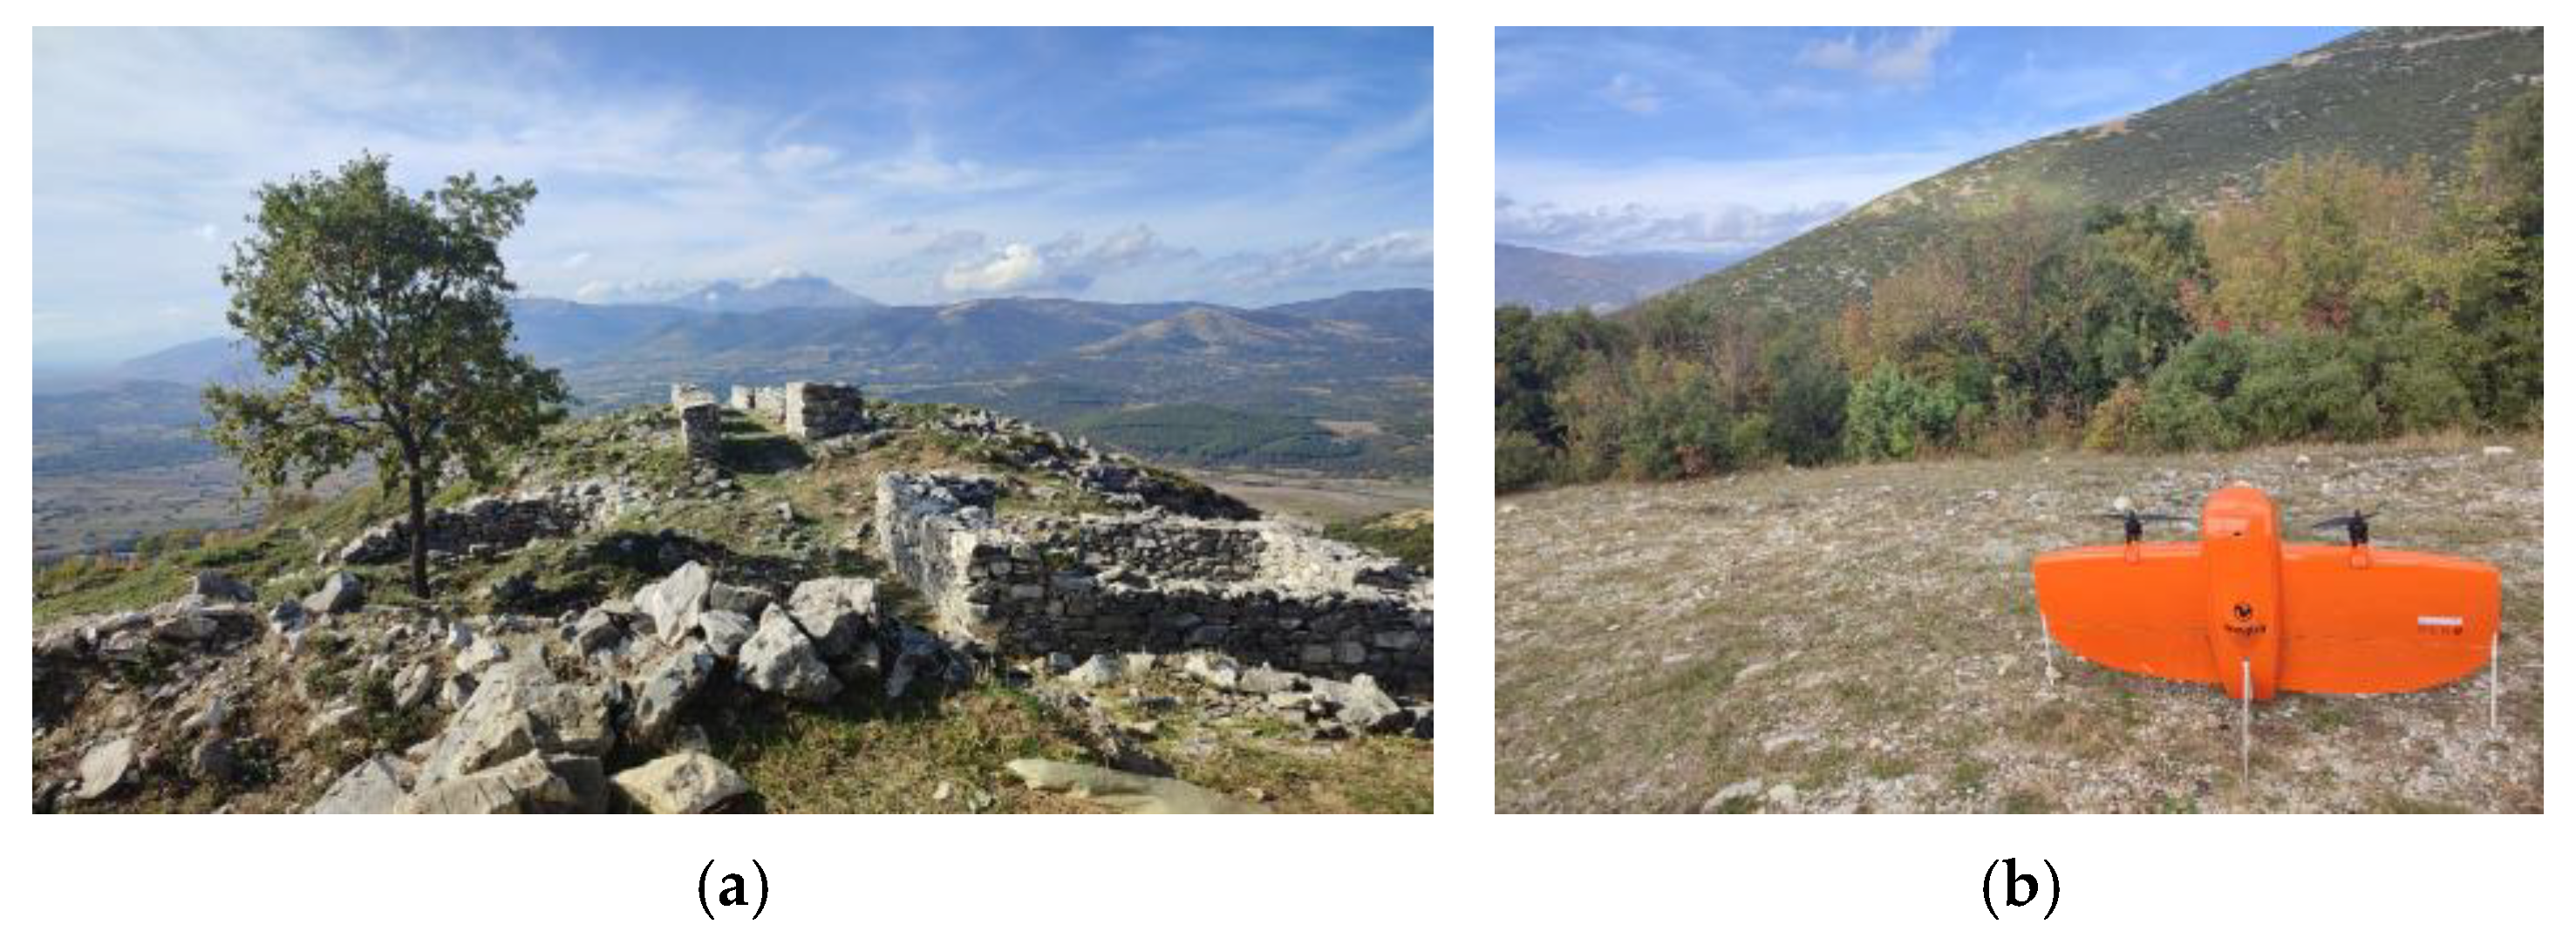
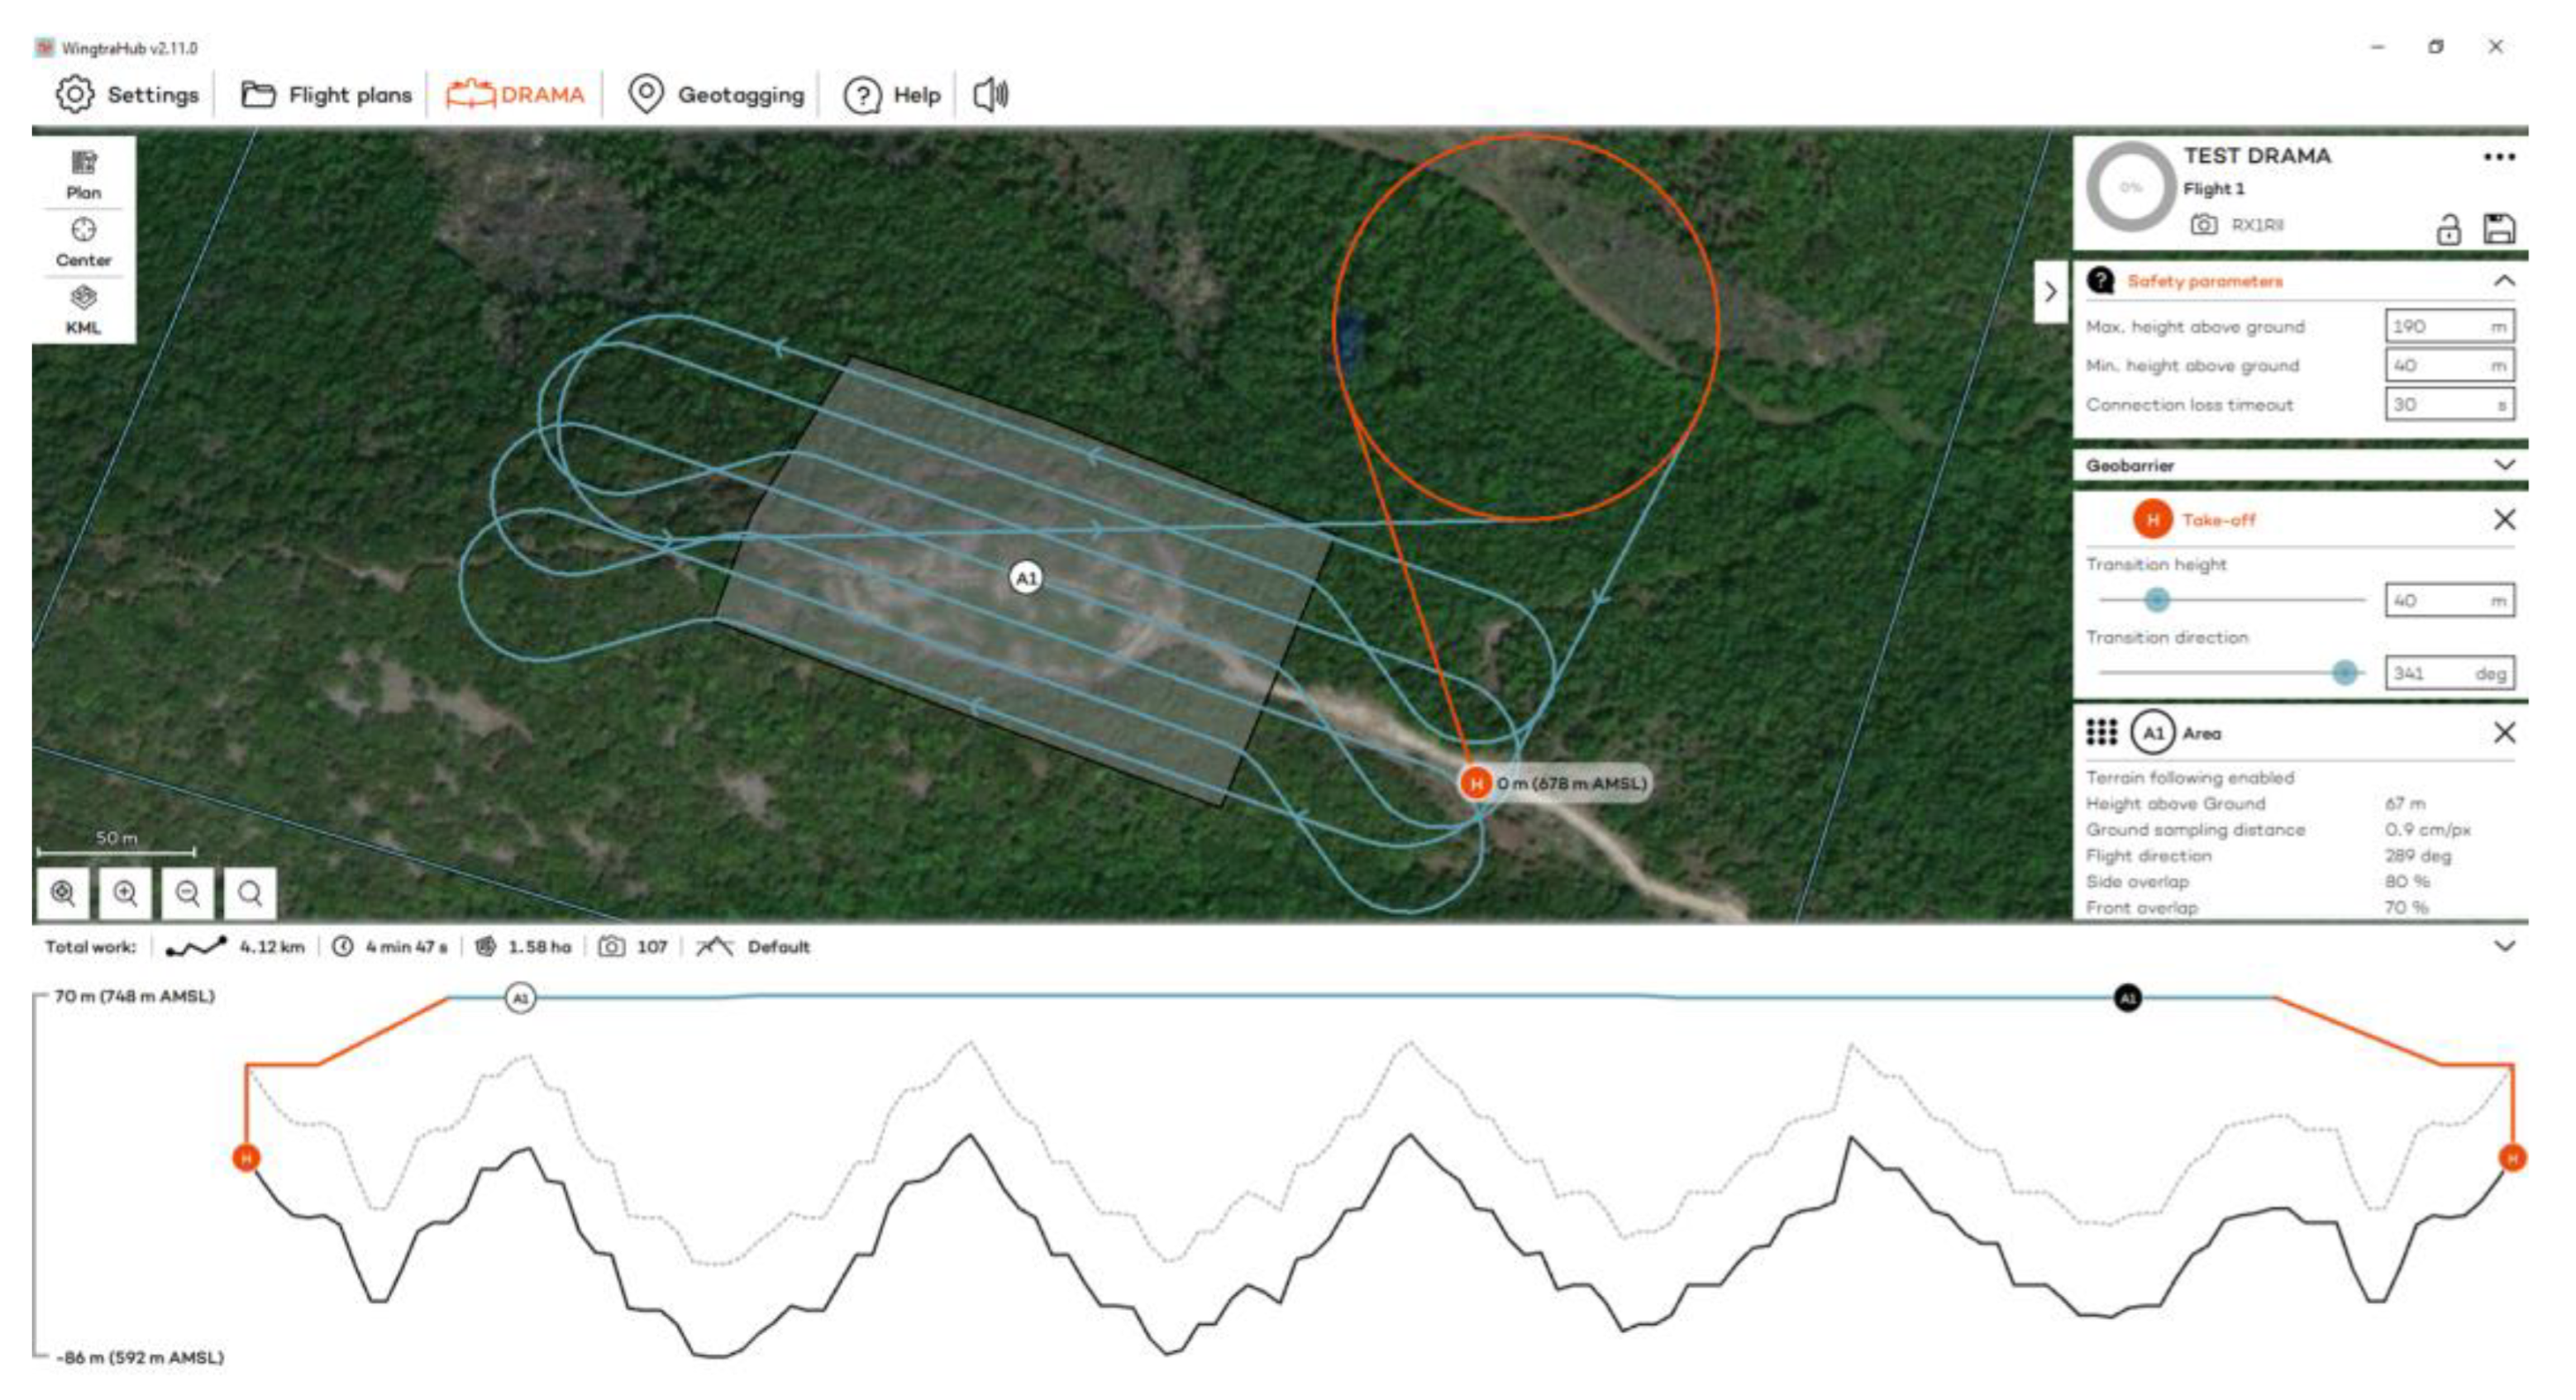
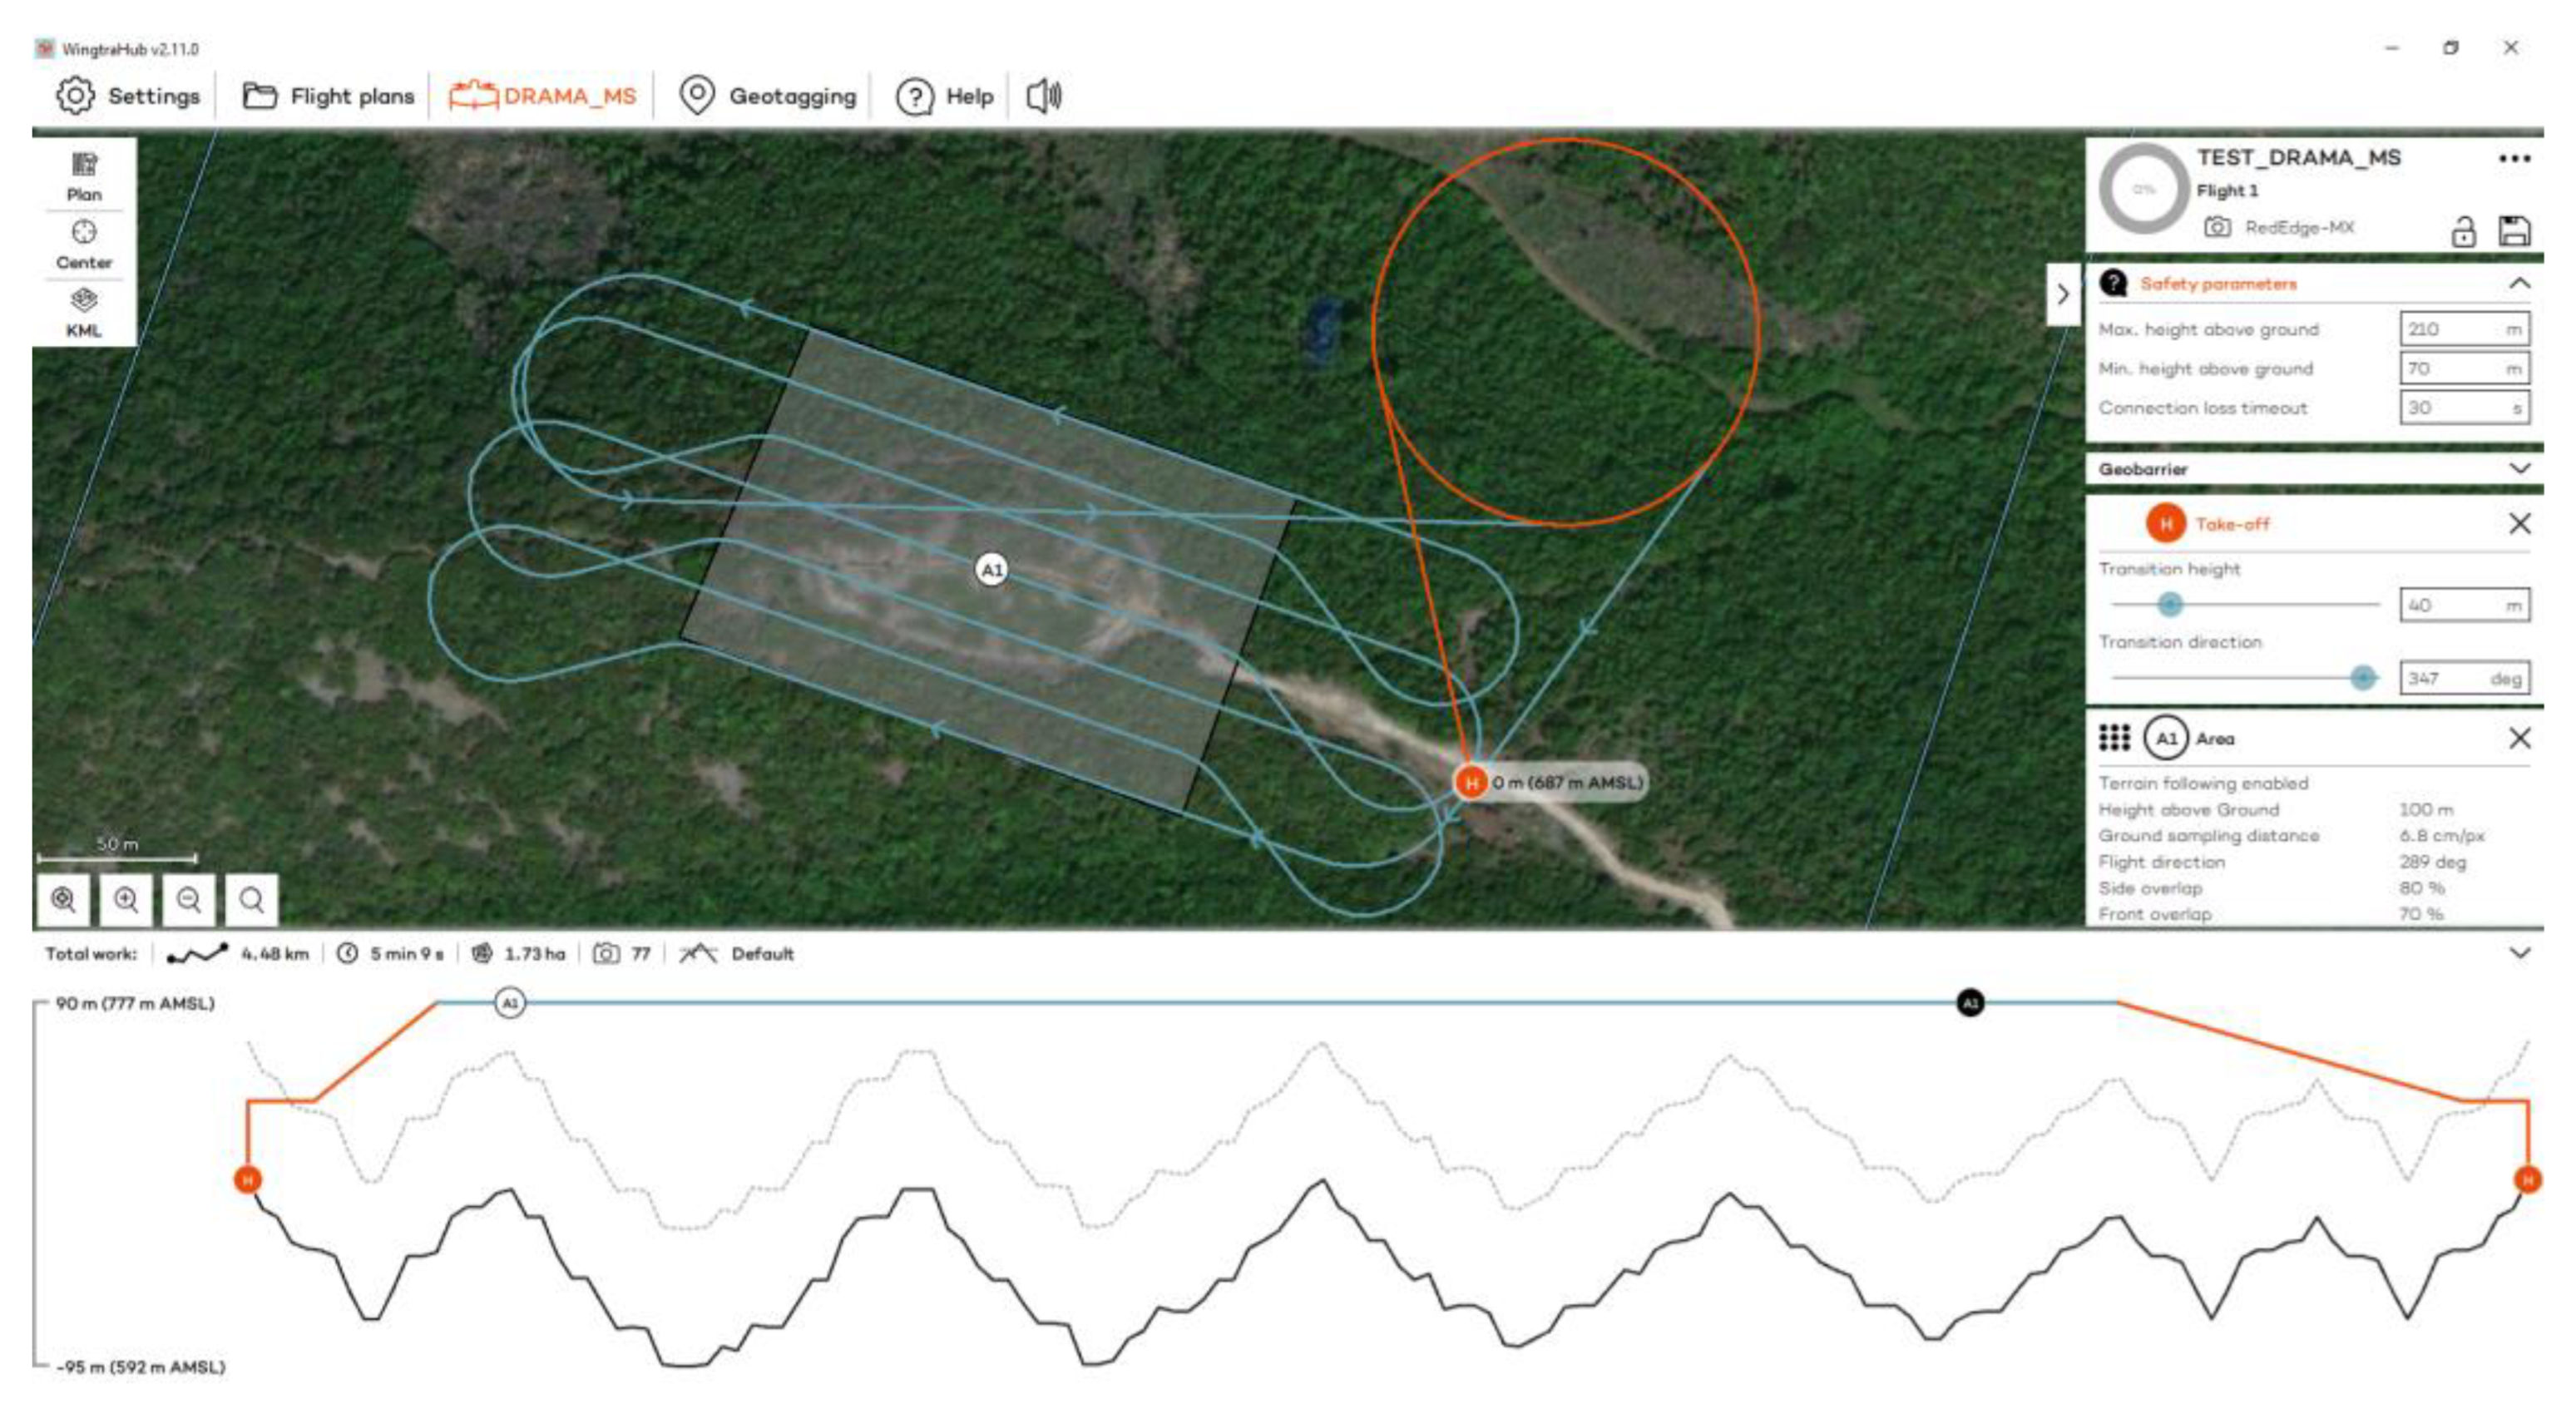
Flights to the Acropolis of Platanias took place on 3 November 2023 at 12:30 p.m., using RGB and MS sensors (Figure 3). Flights were designed with 80% side and 70% front image overlap (Figure 4 and Figure 5). Seven strips were developed for the RGB and MS sensors. Flight height was 67 m in the case of the RGB and 100 m in the case of the MS sensor (the minimum allowed flight height for the RGB sensor is 60 m and for the MS sensor is 100 m). The expected spatial resolution of the RBG images was 0.9 cm, and of the MS images 6.8 cm. Flight time was 4 min and 47 s with the RGB sensor and 5 min and 9 s with the MS sensor. The images that were collected reached 107 RGB and 77 MS images.
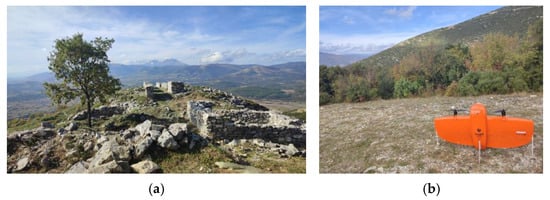
Figure 3.
(a) The Acropolis of Platanias; (b) the UAS.
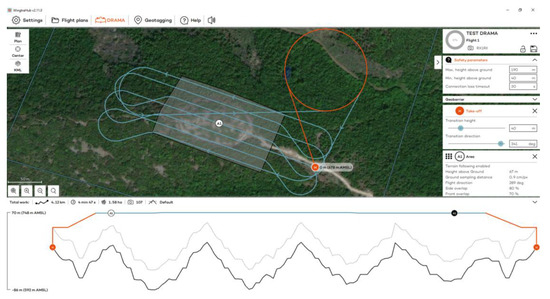
Figure 4.
The flight plan at the Acropolis of Platanias for the RGB sensor.
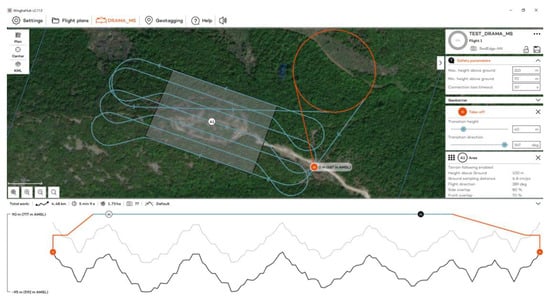
Figure 5.
The flight plan at the Acropolis of Platanias for the MS sensor.
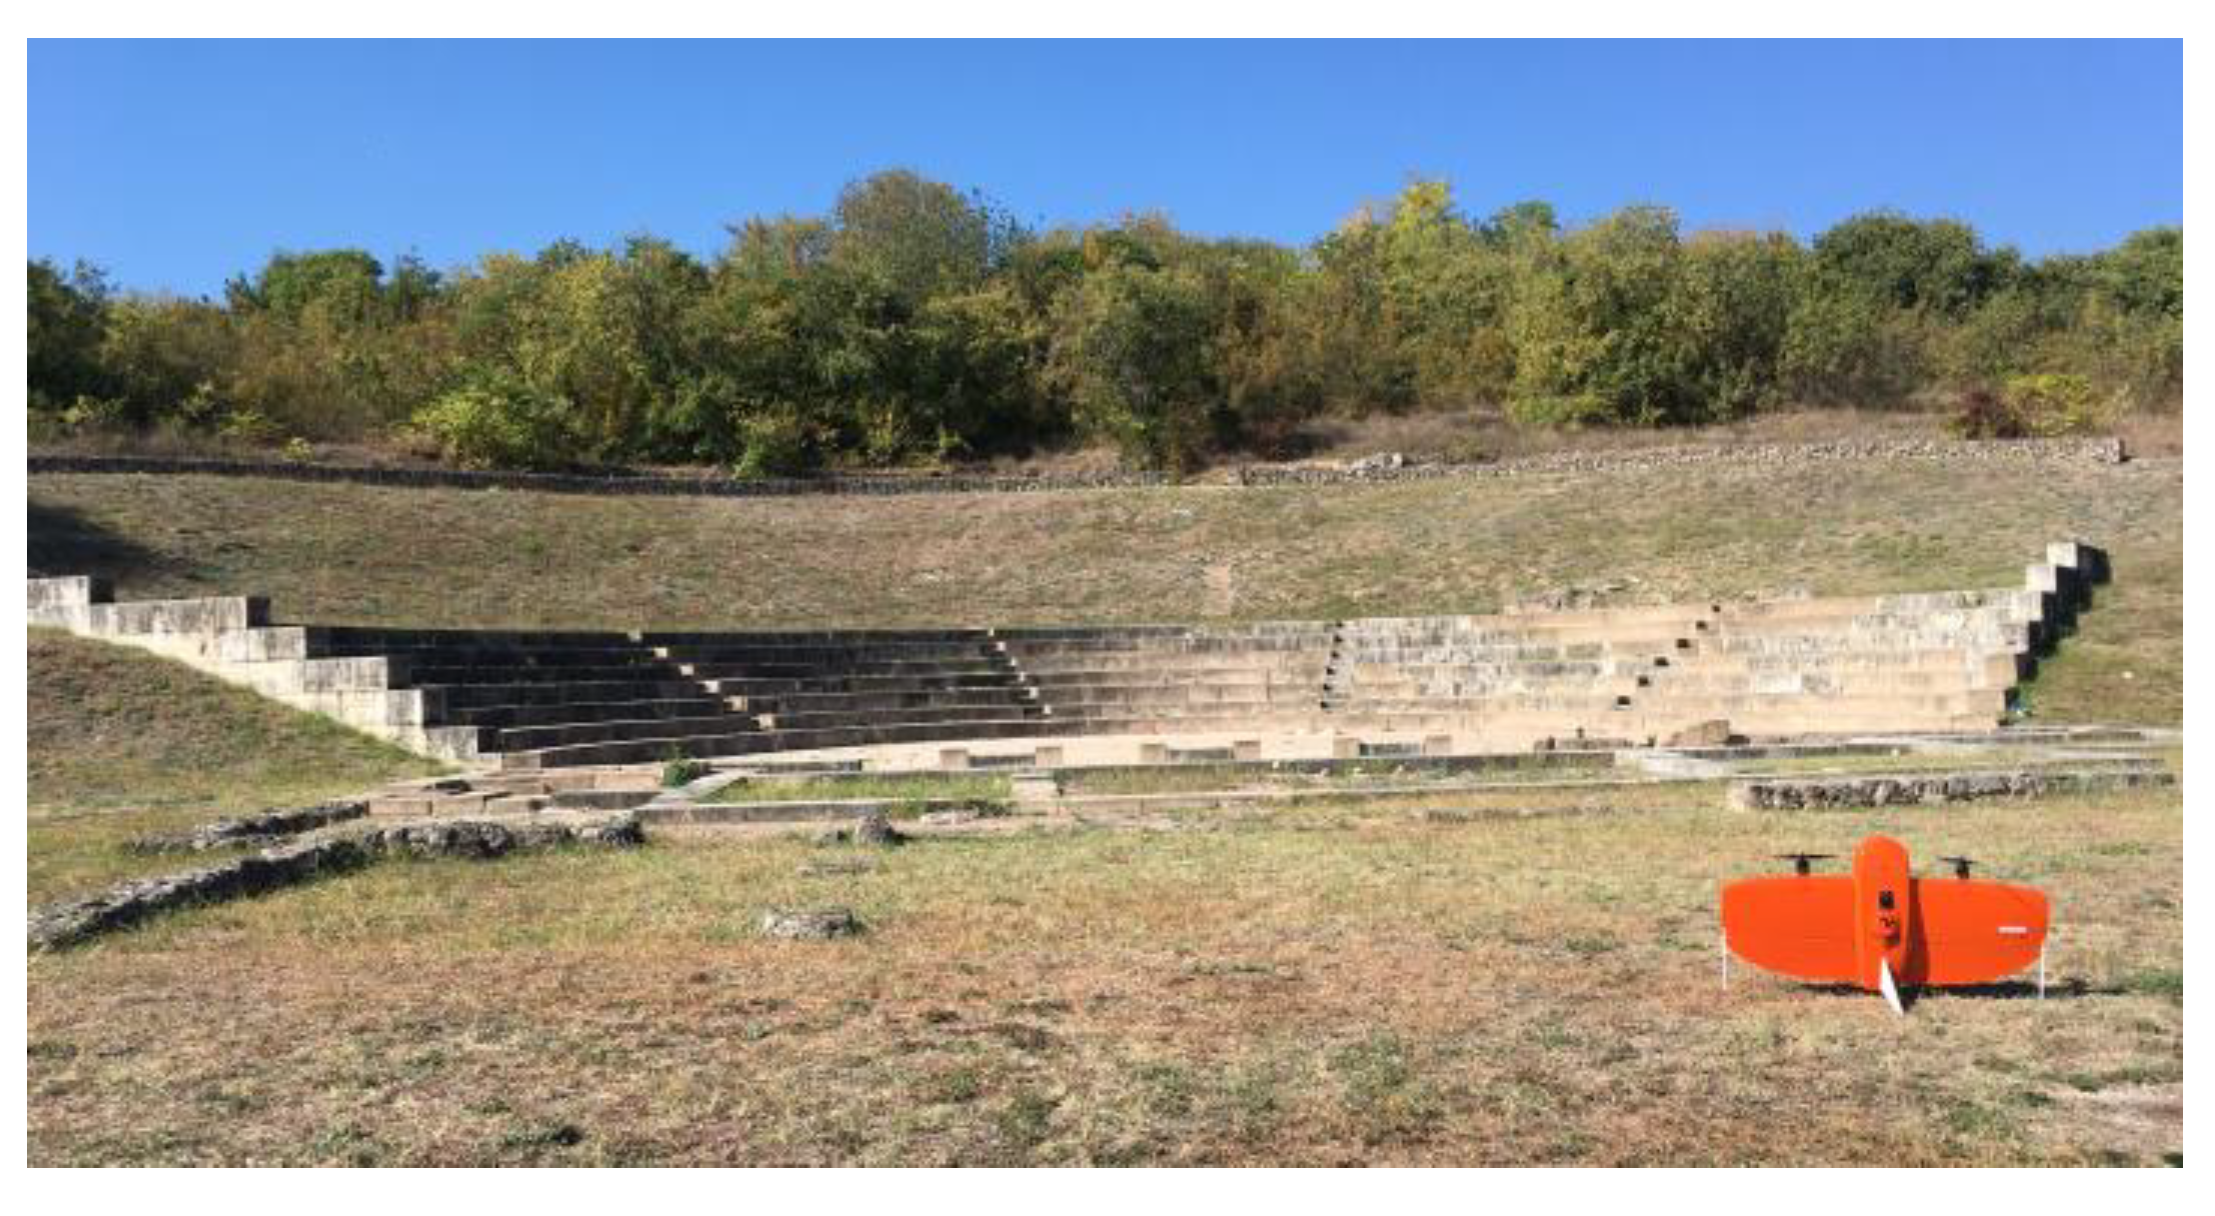
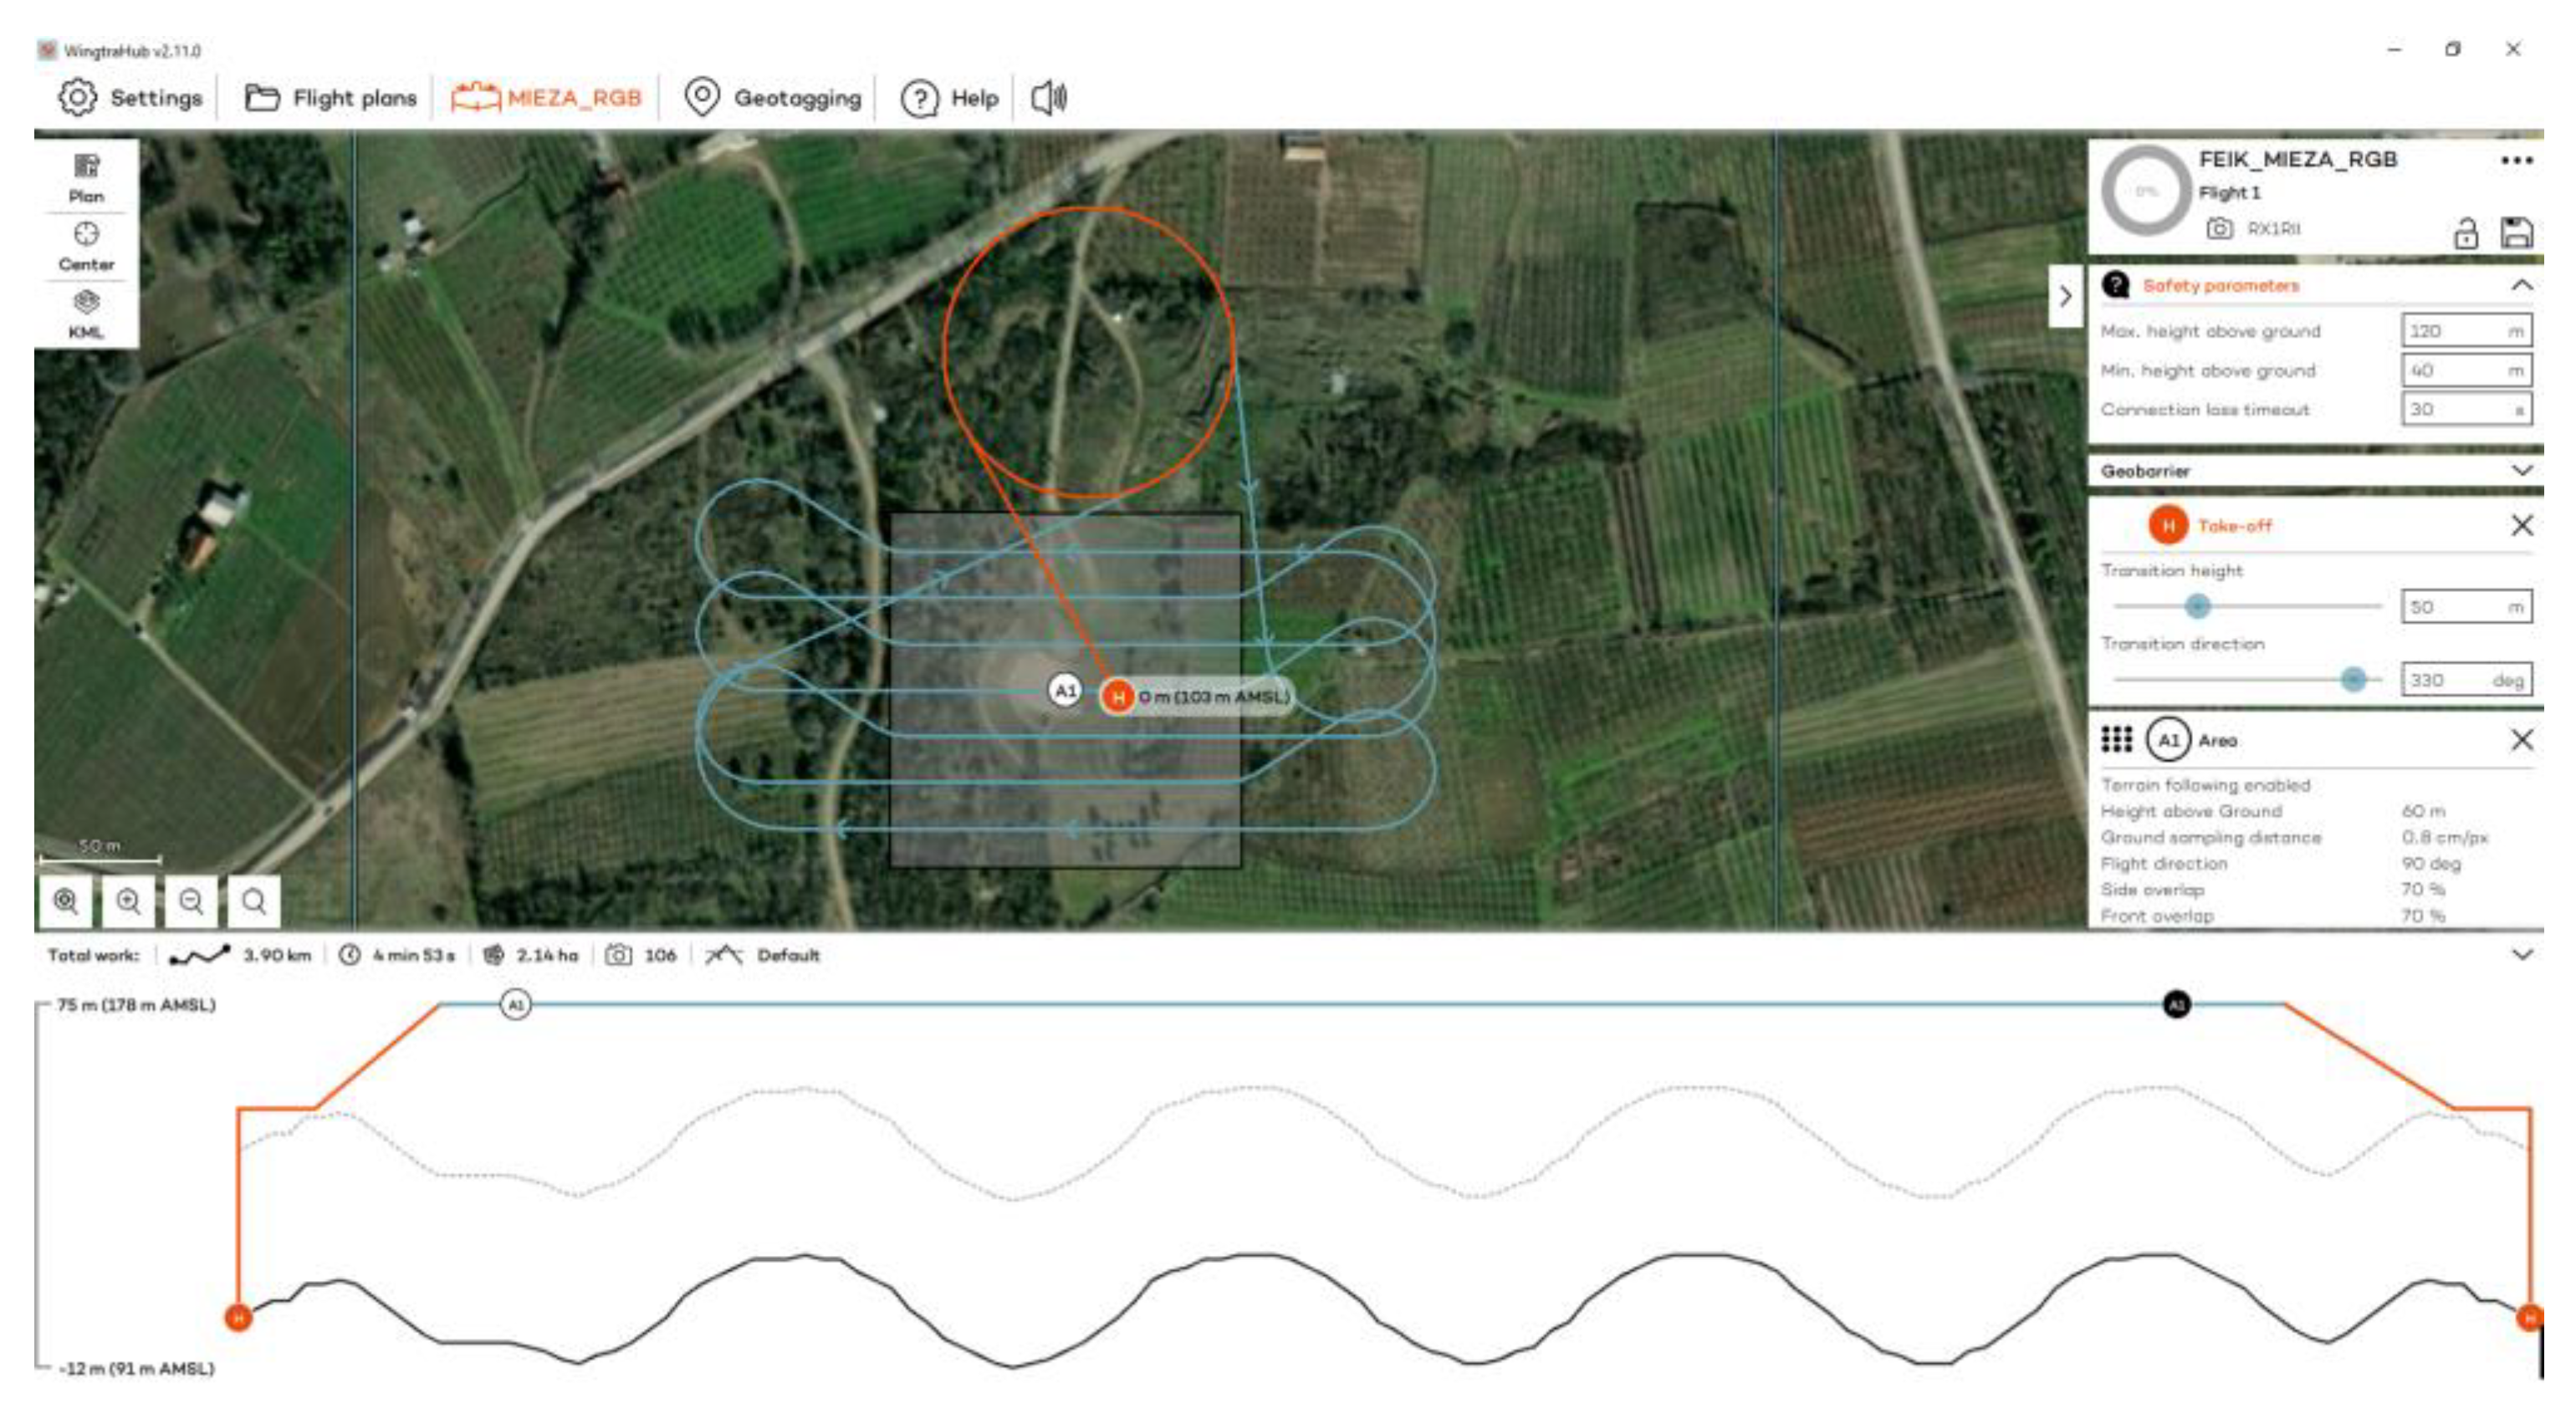
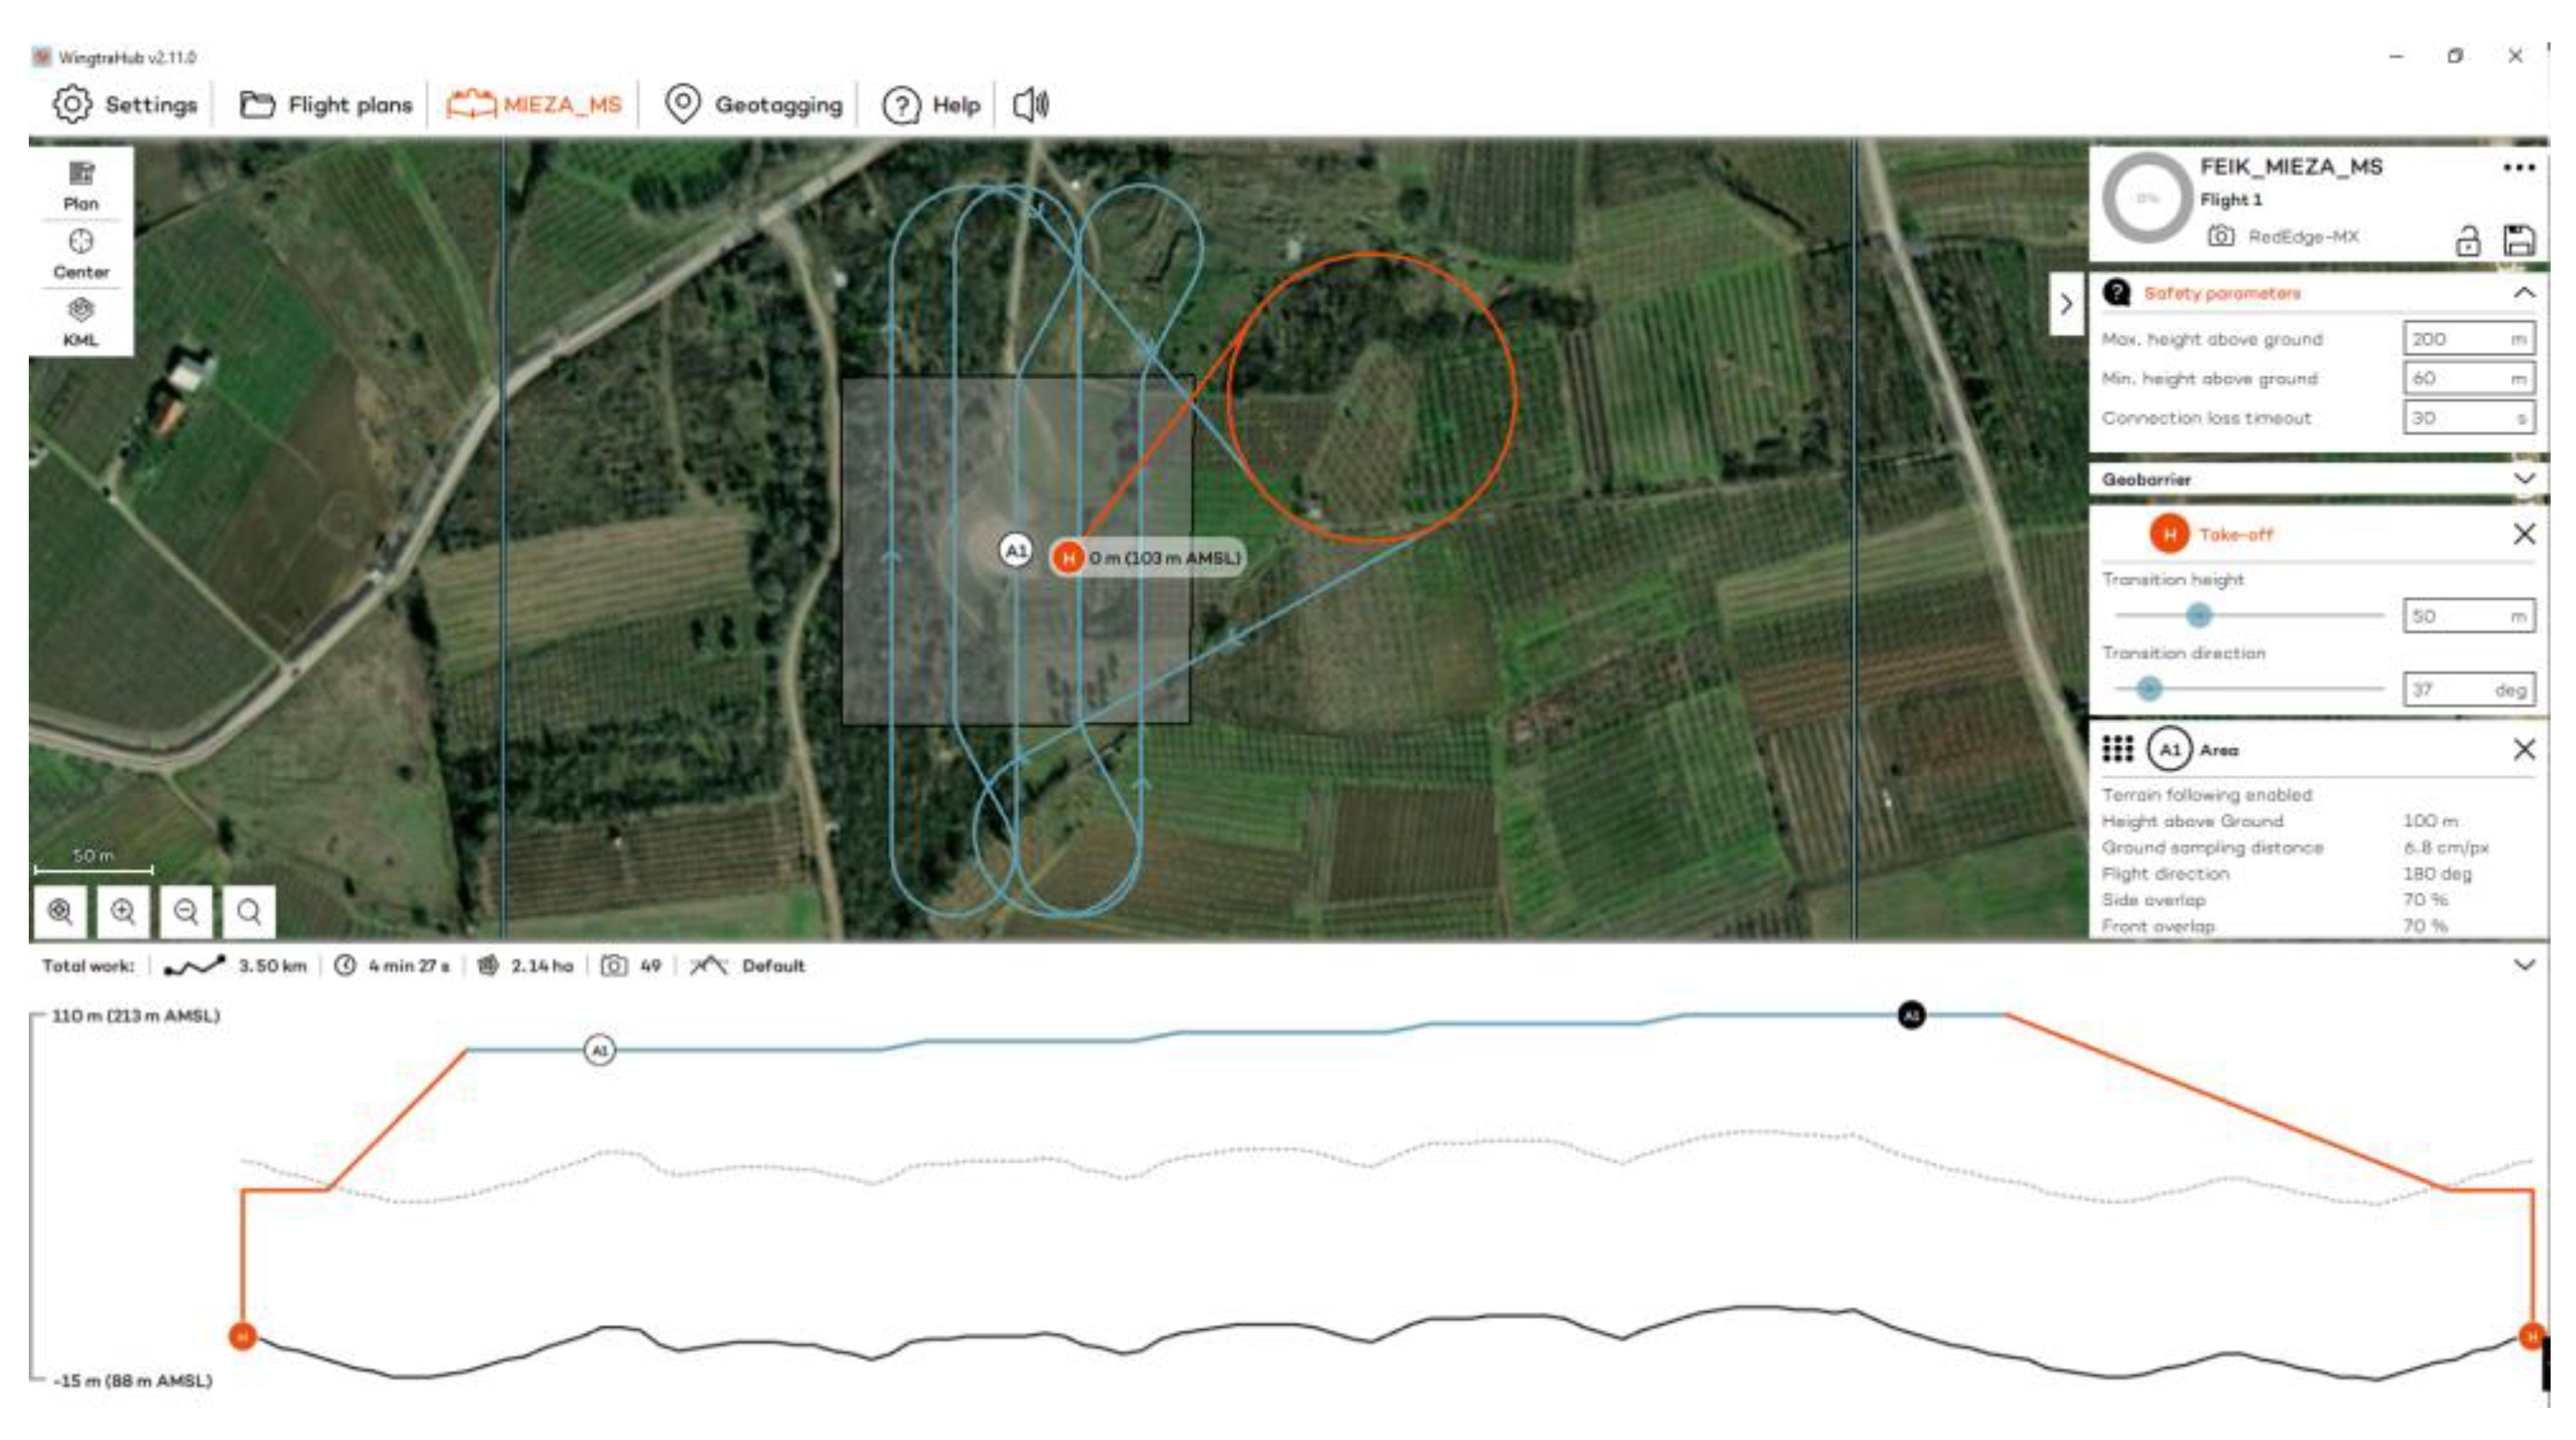
The flights at the Ancient Theater of Mieza took place on 13 October 2023 at 11:00 a.m., using RGB and MS sensors (Figure 6). Flights were designed with 70% side and front image overlap (Figure 7 and Figure 8). Seven strips were developed for the RGB and five strips for the MS sensor. Flight height was 60 m in the case of the RGB and 100 m in the case of the MS sensor. The expected spatial resolution of the RBG images was 0.8 cm and of the MS images 6.8 cm. Flight time was 4 min and 53 s with the RGB sensor and 4 min and 27 s with the MS sensor. The number of collected images was 106 RGB and 49 MS images.
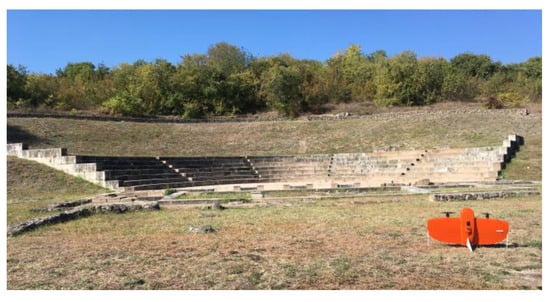
Figure 6.
The Ancient Theater of Mieza and the UAS.
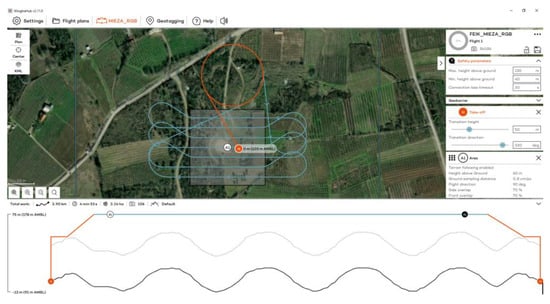
Figure 7.
The flight plan at the Ancient Theater of Mieza for the RGB sensor.
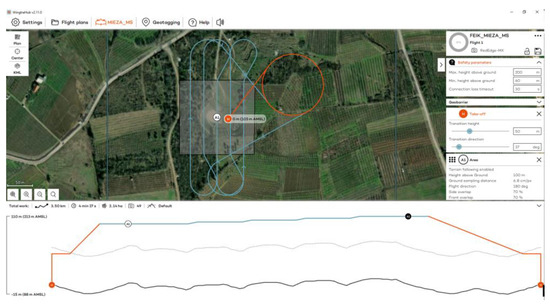
Figure 8.
The flight plan at the Ancient Theater of Mieza for the MS sensor.
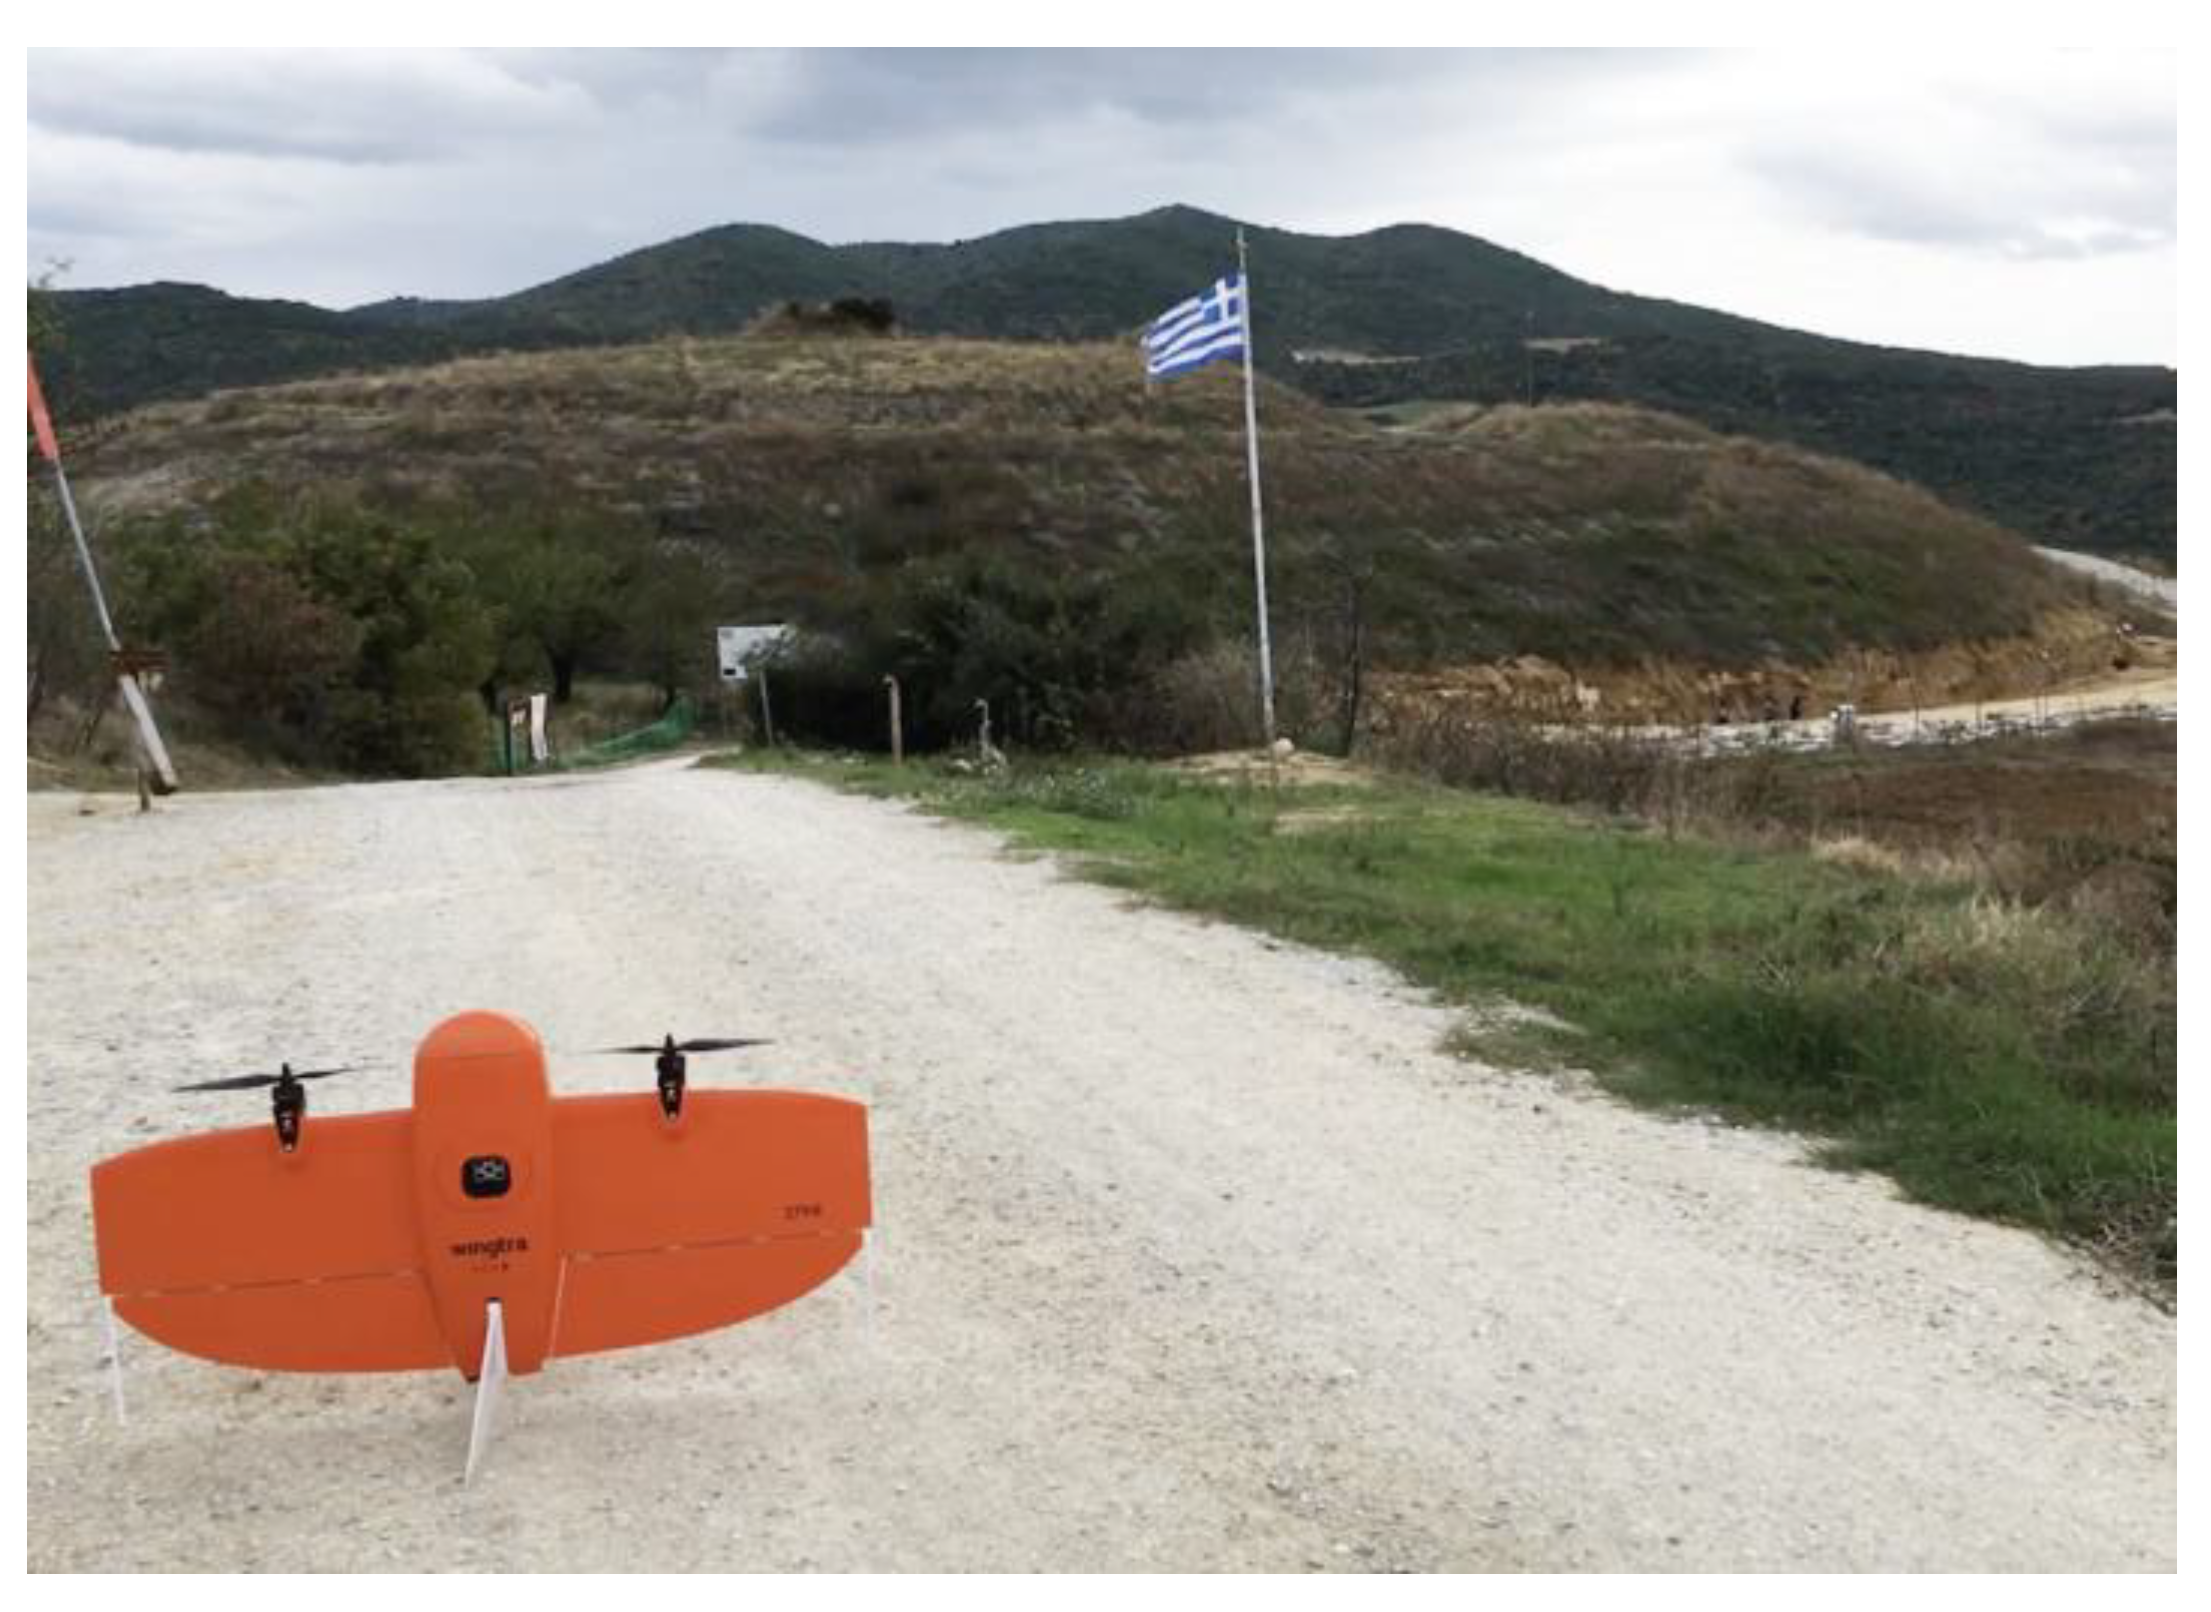
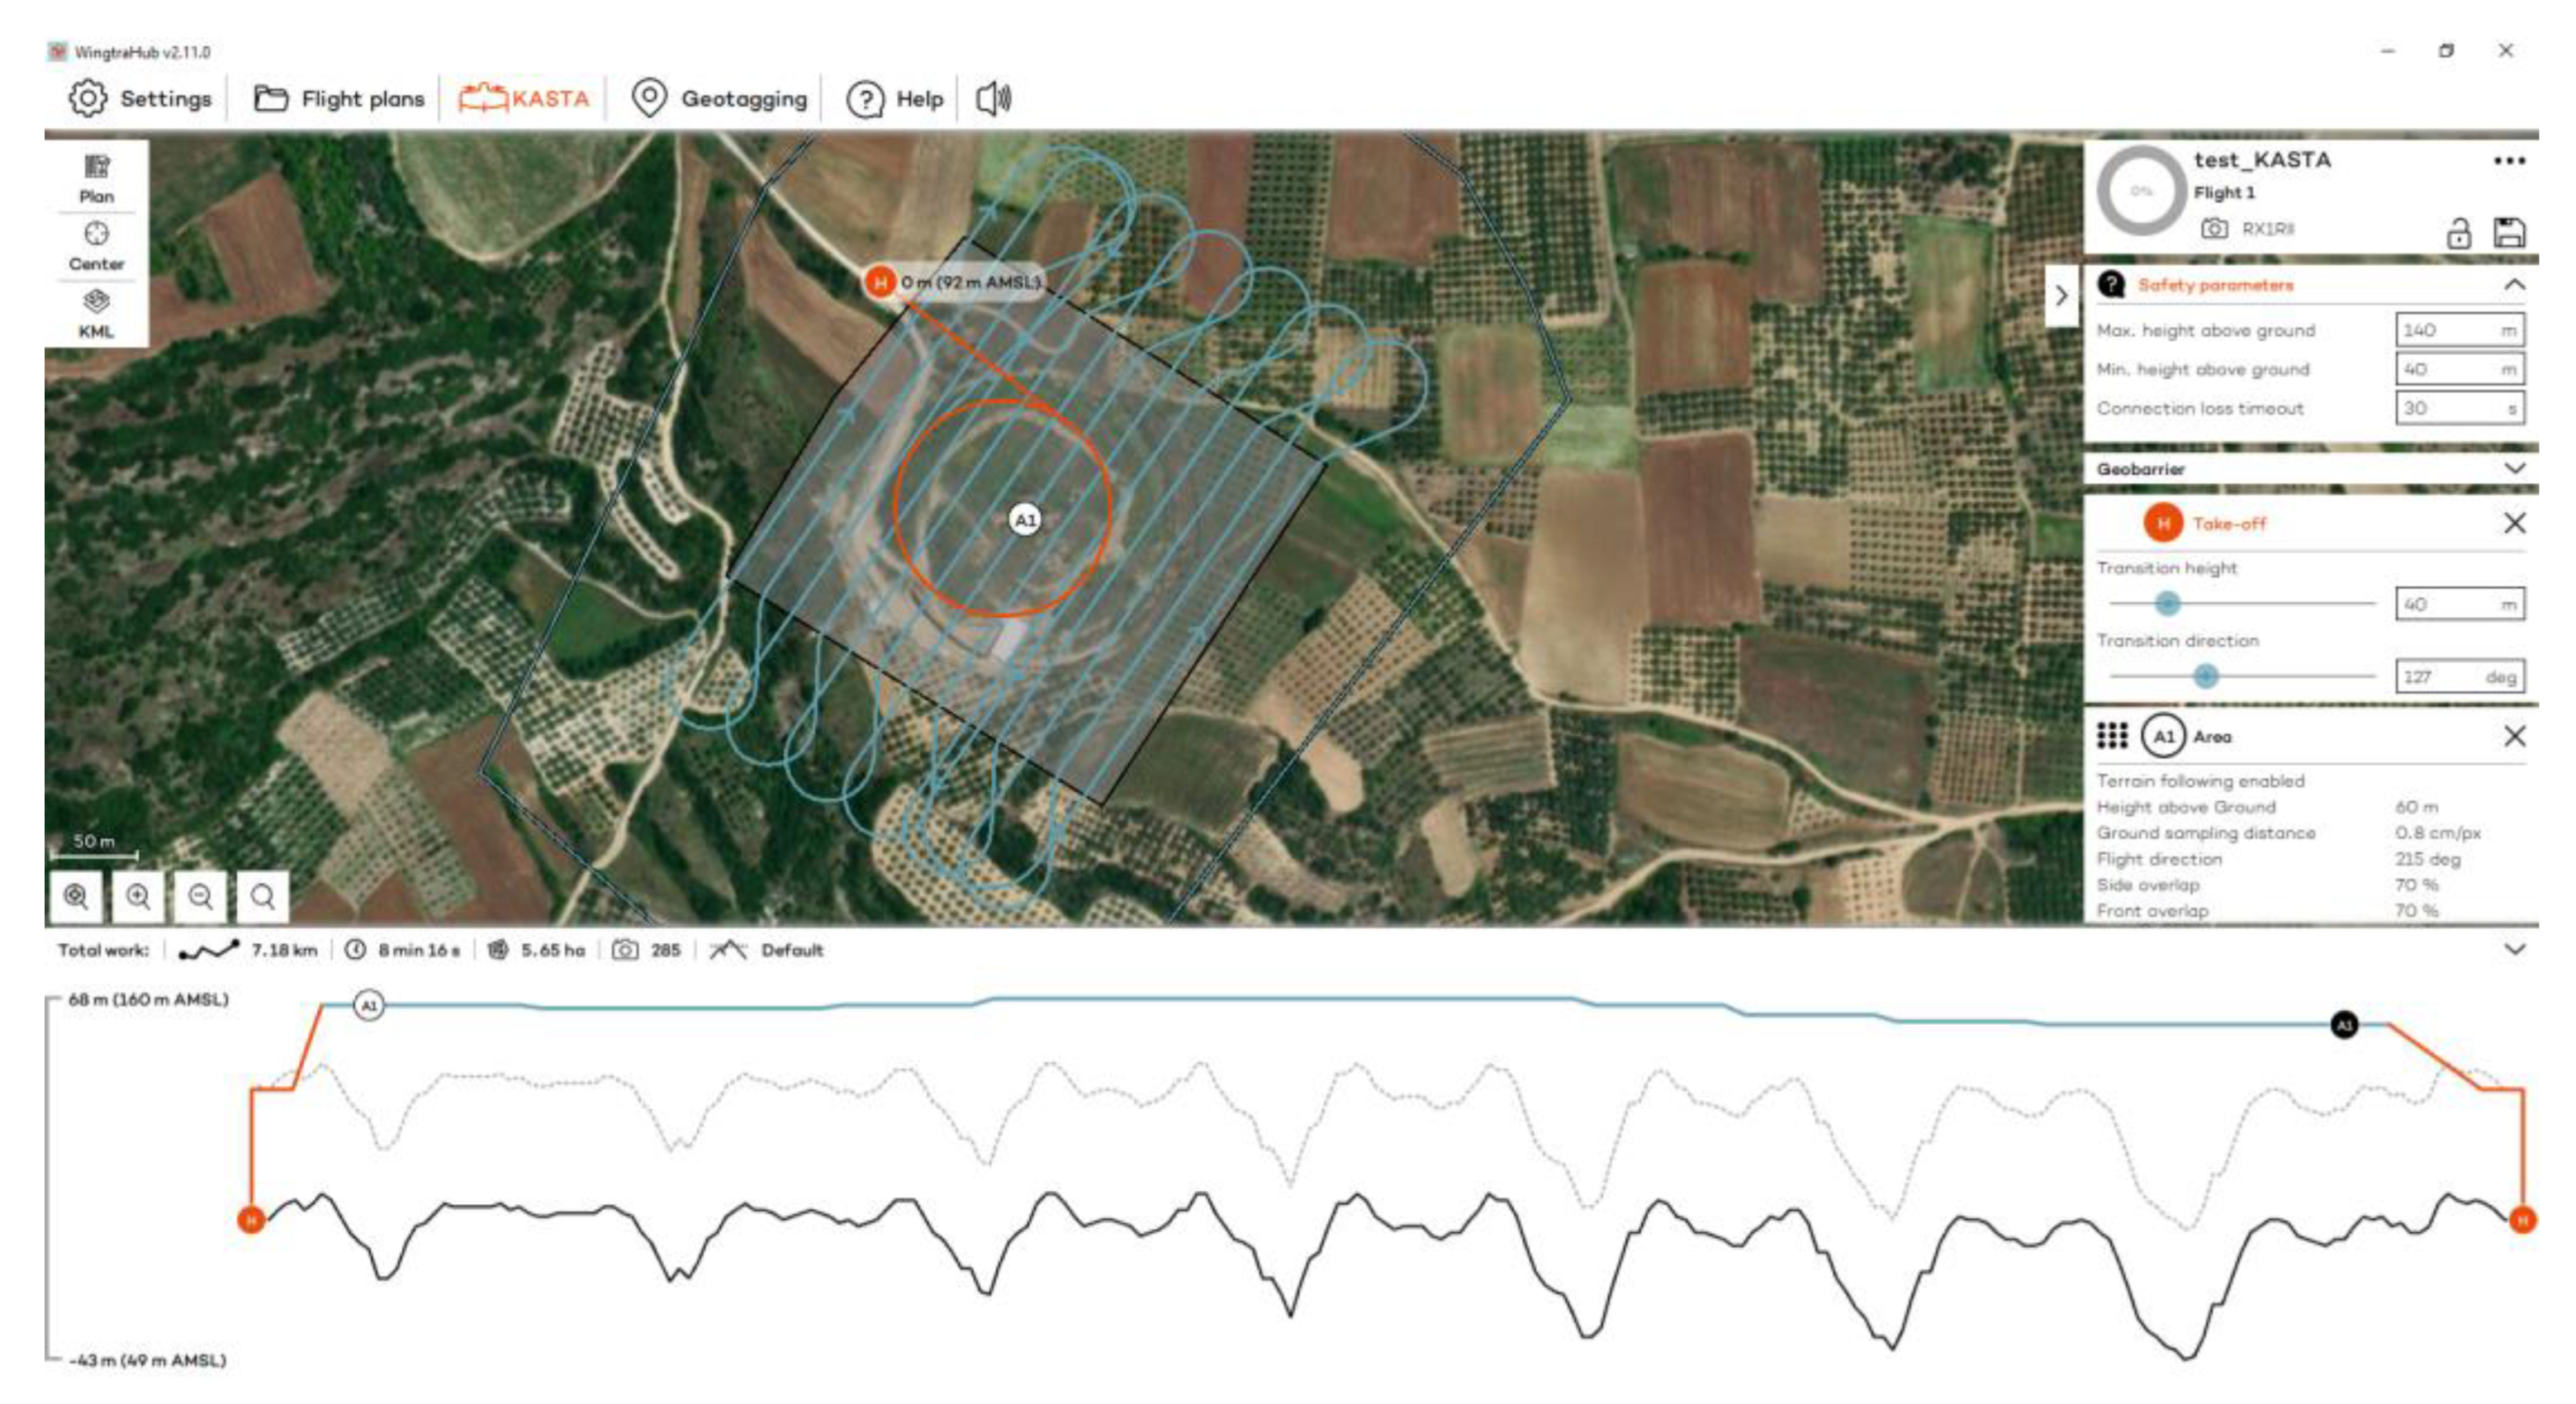
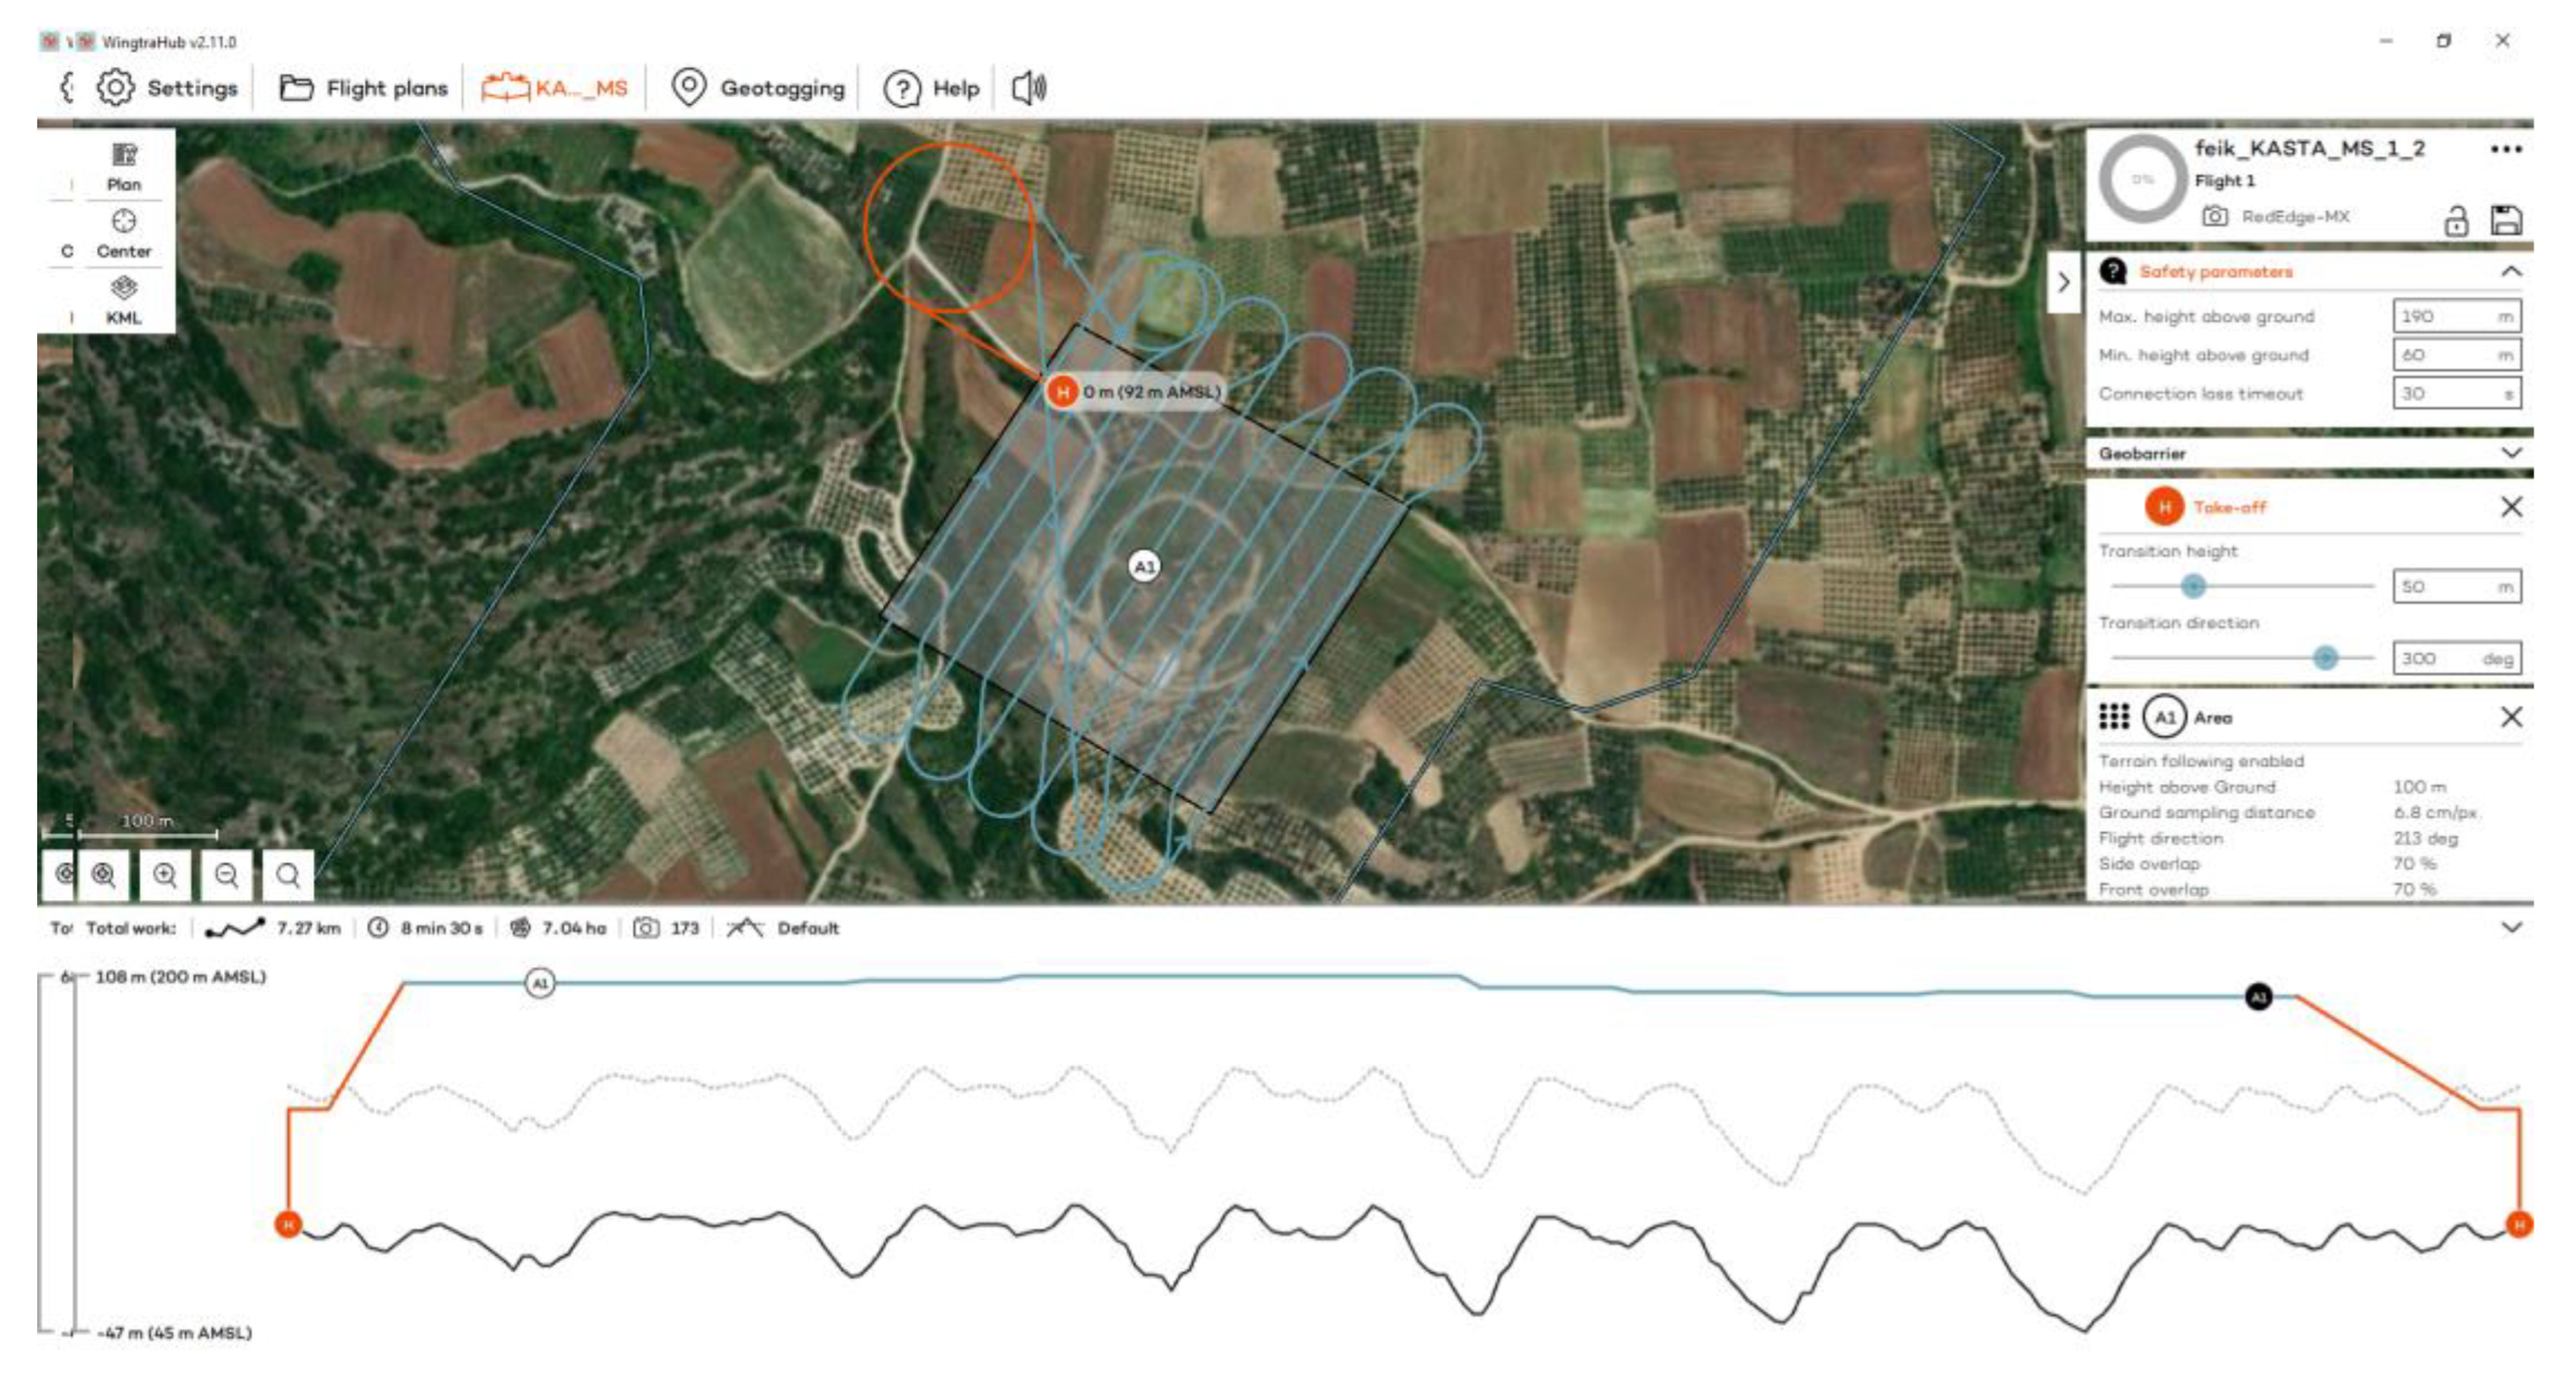
The flights at the Kasta Mound took place on 10 November 2023 at 11:30 a.m., using RGB and MS sensors (Figure 9). Flights were designed with 70% side and front image overlap (Figure 10 and Figure 11). A total of 13 strips were developed for the RGB and 11 strips for the MS sensor. Flight height was 60 m in the case of the RGB and 100 m in the case of the MS sensor. The expected spatial resolution of the RBG images was 0.8 cm, and of the MS images 6.8 cm. Flight time was 8 min and 16 s with the RGB sensor and 8 min and 30 s with the MS sensor. The collected images reached 285 RGB and 173 MS images.
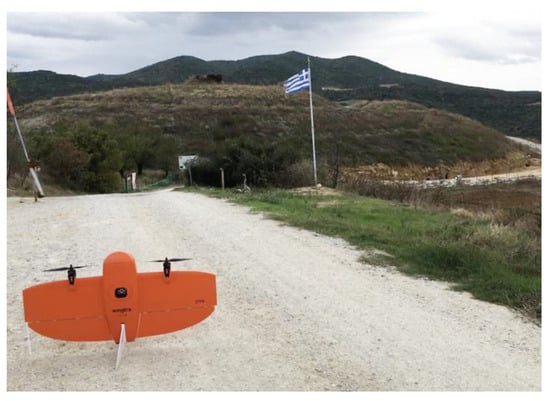
Figure 9.
The Kasta Mound and the UAS.
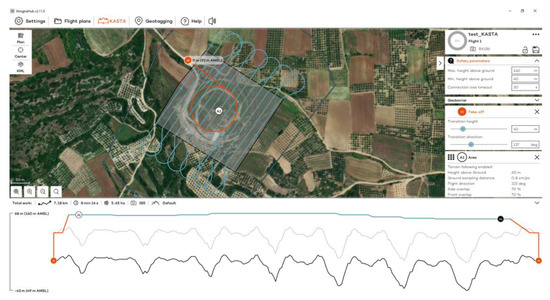
Figure 10.
The flight plan at the Kasta Mound for the RGB sensor.
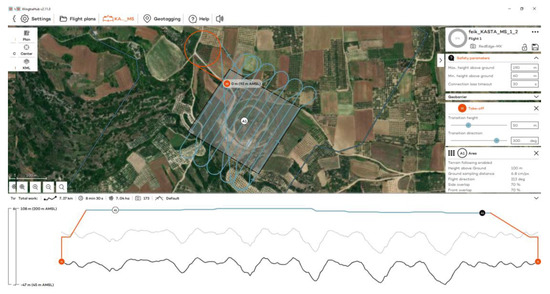
Figure 11.
The flight plan at the Kasta Mound for the MS sensor.
4.2. Terrestrial Data Collection and Processing
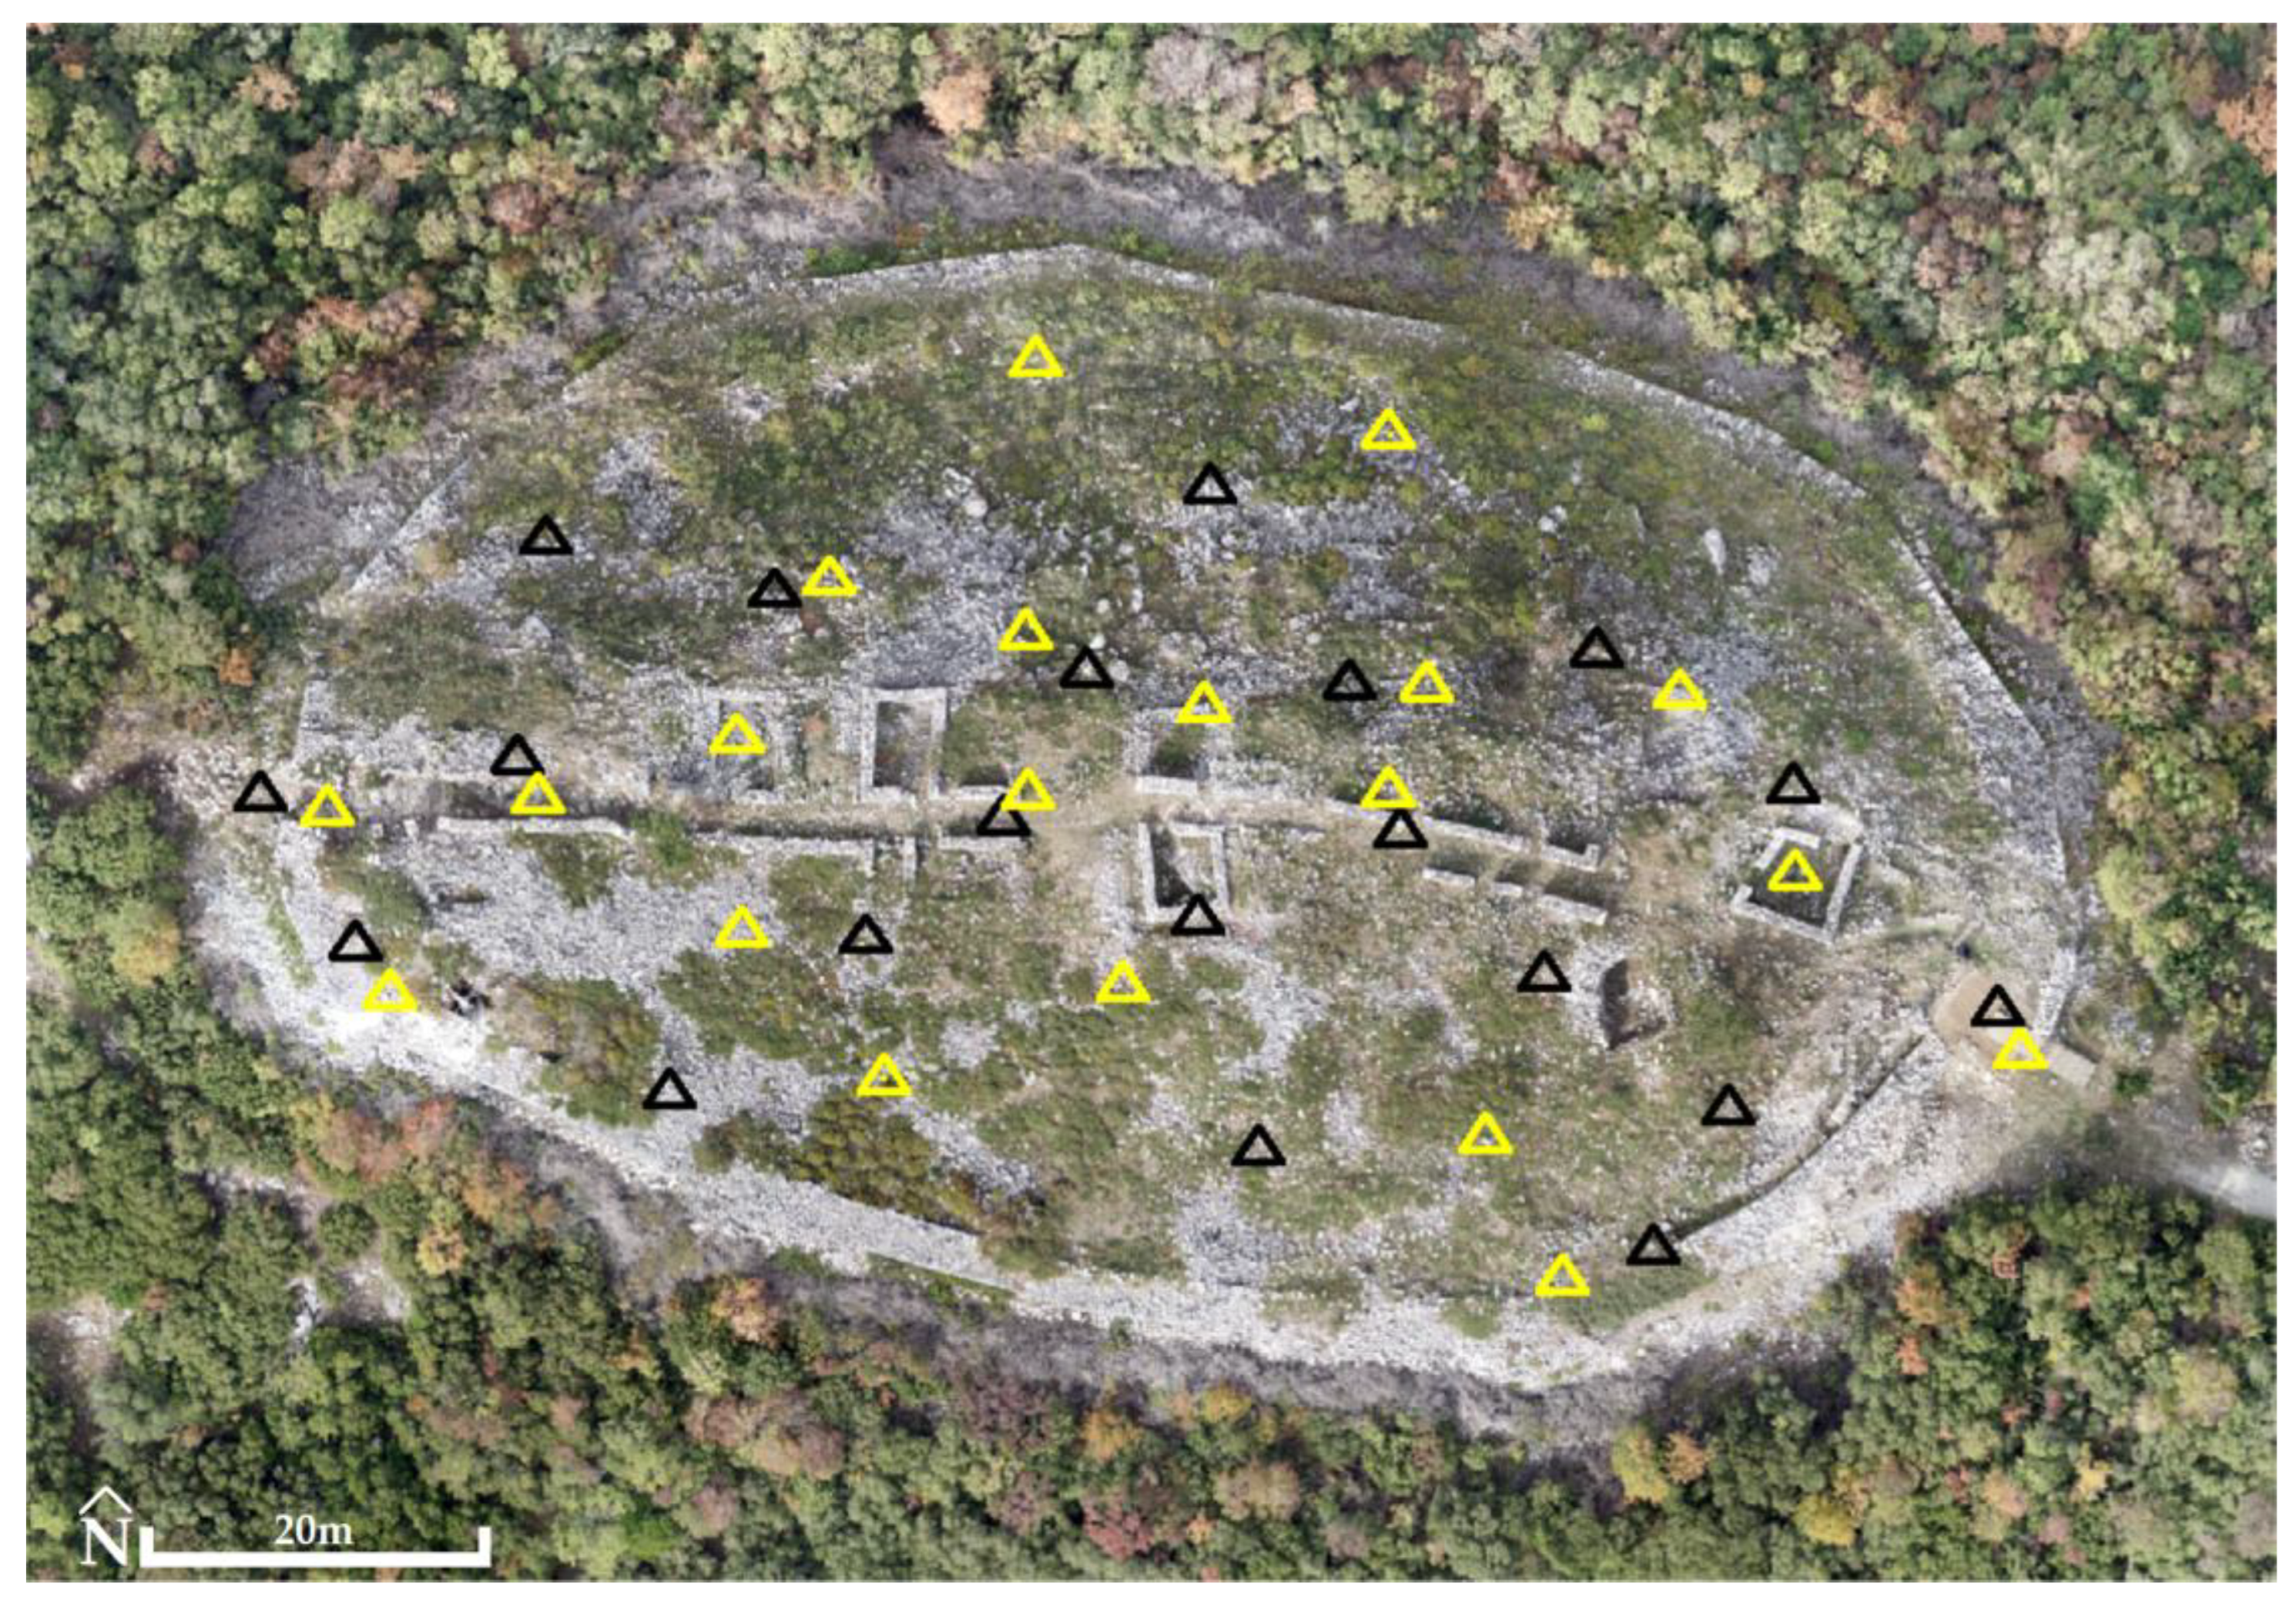
Prior to the flight at the Acropolis of Platanias, 20 GCPs and 20 CPs (Figure 12, Table 2) were recorded using the GNSS Topcon HiPer SR and the RTK method. Their horizontal and altimetric accuracy in the Greek Geodetic Reference System 87 (GGRS87) were 1.6 cm and 2.4 cm, respectively.
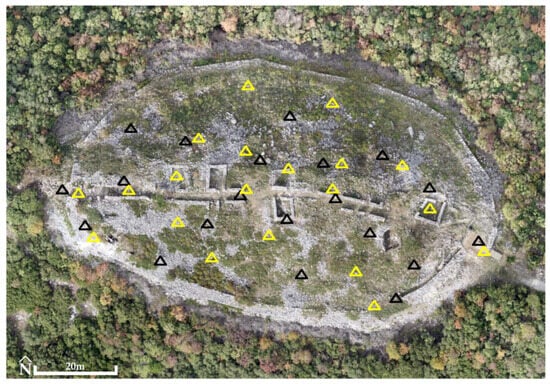
Figure 12.
The Acropolis of Platanias (41°11′05.4″ N 24°26′03.2″ E). The distribution of 20 GCPs (triangles in yellow) and 20 CPs (triangles in black) (background: RGB orthophotomosaic, true color).

Table 2.
Coordinates of GCPs and CPs in the Greek Geodetic Reference System 87 (GGRS87).
Regarding the GNSS (with Topcon HiPer SR) measurements related to the PPK system of the UAS, initially the x, y and z coordinates of a random point (considered as the base for the subsequent measurements) were measured with millimetric accuracy (1.7 cm horizontal and 2.6 cm vertical) at GGRS87, a short distance from the home position of the UAS, using the RTK method and the network of multiple permanent stations in the country provided by Topcon. Then, using the same GNSS at the same point, continuous position measurements were taken using the Static method for 30 min before the start of the flight, during the flight and for 30 min after the end of the flight. Utilizing the high-precision coordinates of the above point, its Static measurements and the in-flight measurements of the built-in multi-frequency PPK GNSS antenna of the UAS, the coordinates (X, Y and Z) of the reception centers of each image were corrected and calculated at the office (with the same UAS manufacturer’s WintraHub© 2.11 software), finally yielding 3D accuracy in GGRS87 of 2 (horizontal) to 3 cm (vertical).
5. Methods and Results
5.1. Processing of Images
Processing in Agisoft Metashape Professional© version 2.0.3 consists of fixed steps. First, the images are imported into the software and the GGRS87 coordinate system is defined.
Solely in the case of using the MS sensor, it is necessary immediately after importing the images into the software to calibrate the spectral information using spectral targets. Therefore, before and after the flight, the suitable calibration target of the Micasense RedEdge-MX was imaged. The target was automatically detected using the Agisoft Metashape Professional© and the reflectance values of all spectral bands were calculated [47,48,49,50,51,52,53,54].
Then, when using either the RGB or MS sensor, the alignment of images is performed (align photos with high accuracy) and at the same time, a sparse point cloud model based on matching pixel groups between images is generated. A difference is found at this point, whether using GCPs or not.
When GCPs are used, the process of identifying and marking the GCPs in each image should be initiated. On completion, the Root Mean Square Error for x coordinate (RMSEx) (and RMSEy, RMSEz), the RMSE for x and y coordinates (RMSExy) and the RMSE for x, y and z coordinates (RMSExyz) for all the GCP locations are calculated [55].
When GCPs are not used, after the alignment of images and the production of a sparse point cloud model, the Root Mean Square Error for X coordinate (RMSEX) (and RMSEY, RMSEZ), the RMSE for X and Y coordinates (RMSEXY) and the RMSE for X, Y and Z coordinates (RMSEXYZ) for all the sensor locations are calculated [55].
It may be assumed that the above RMSE values provide, roughly, a general idea of the accuracy of the produced DSMs and orthophotomosaics, as these values almost never correspond to the actual accuracy values of the products.
It is worth mentioning here that in parallel with the calculation of RMSE, self-calibration of the sensors could be performed, but was not carried out in any of the processing cases studied. This is because a quality sensor pre-calibration feature is not available, so self-calibration may lead to incorrect calculation of the internal orientation parameters and consequently to large errors in the final products (mainly vertical in DSM and less horizontally in orthophotomosaic) [12,17,56].
Then, when using either the RGB or MS sensor, the dense point cloud is created (build dense cloud; high-quality and aggressive depth filtering). Next, the 3D mesh generation (build mesh) follows, where the point cloud is transformed into an actual 3D surface. The following step is to build the texture (build texture), i.e., the colored overlay of the generated 3D mesh. The last step is to generate a DSM and orthophotomosaic.
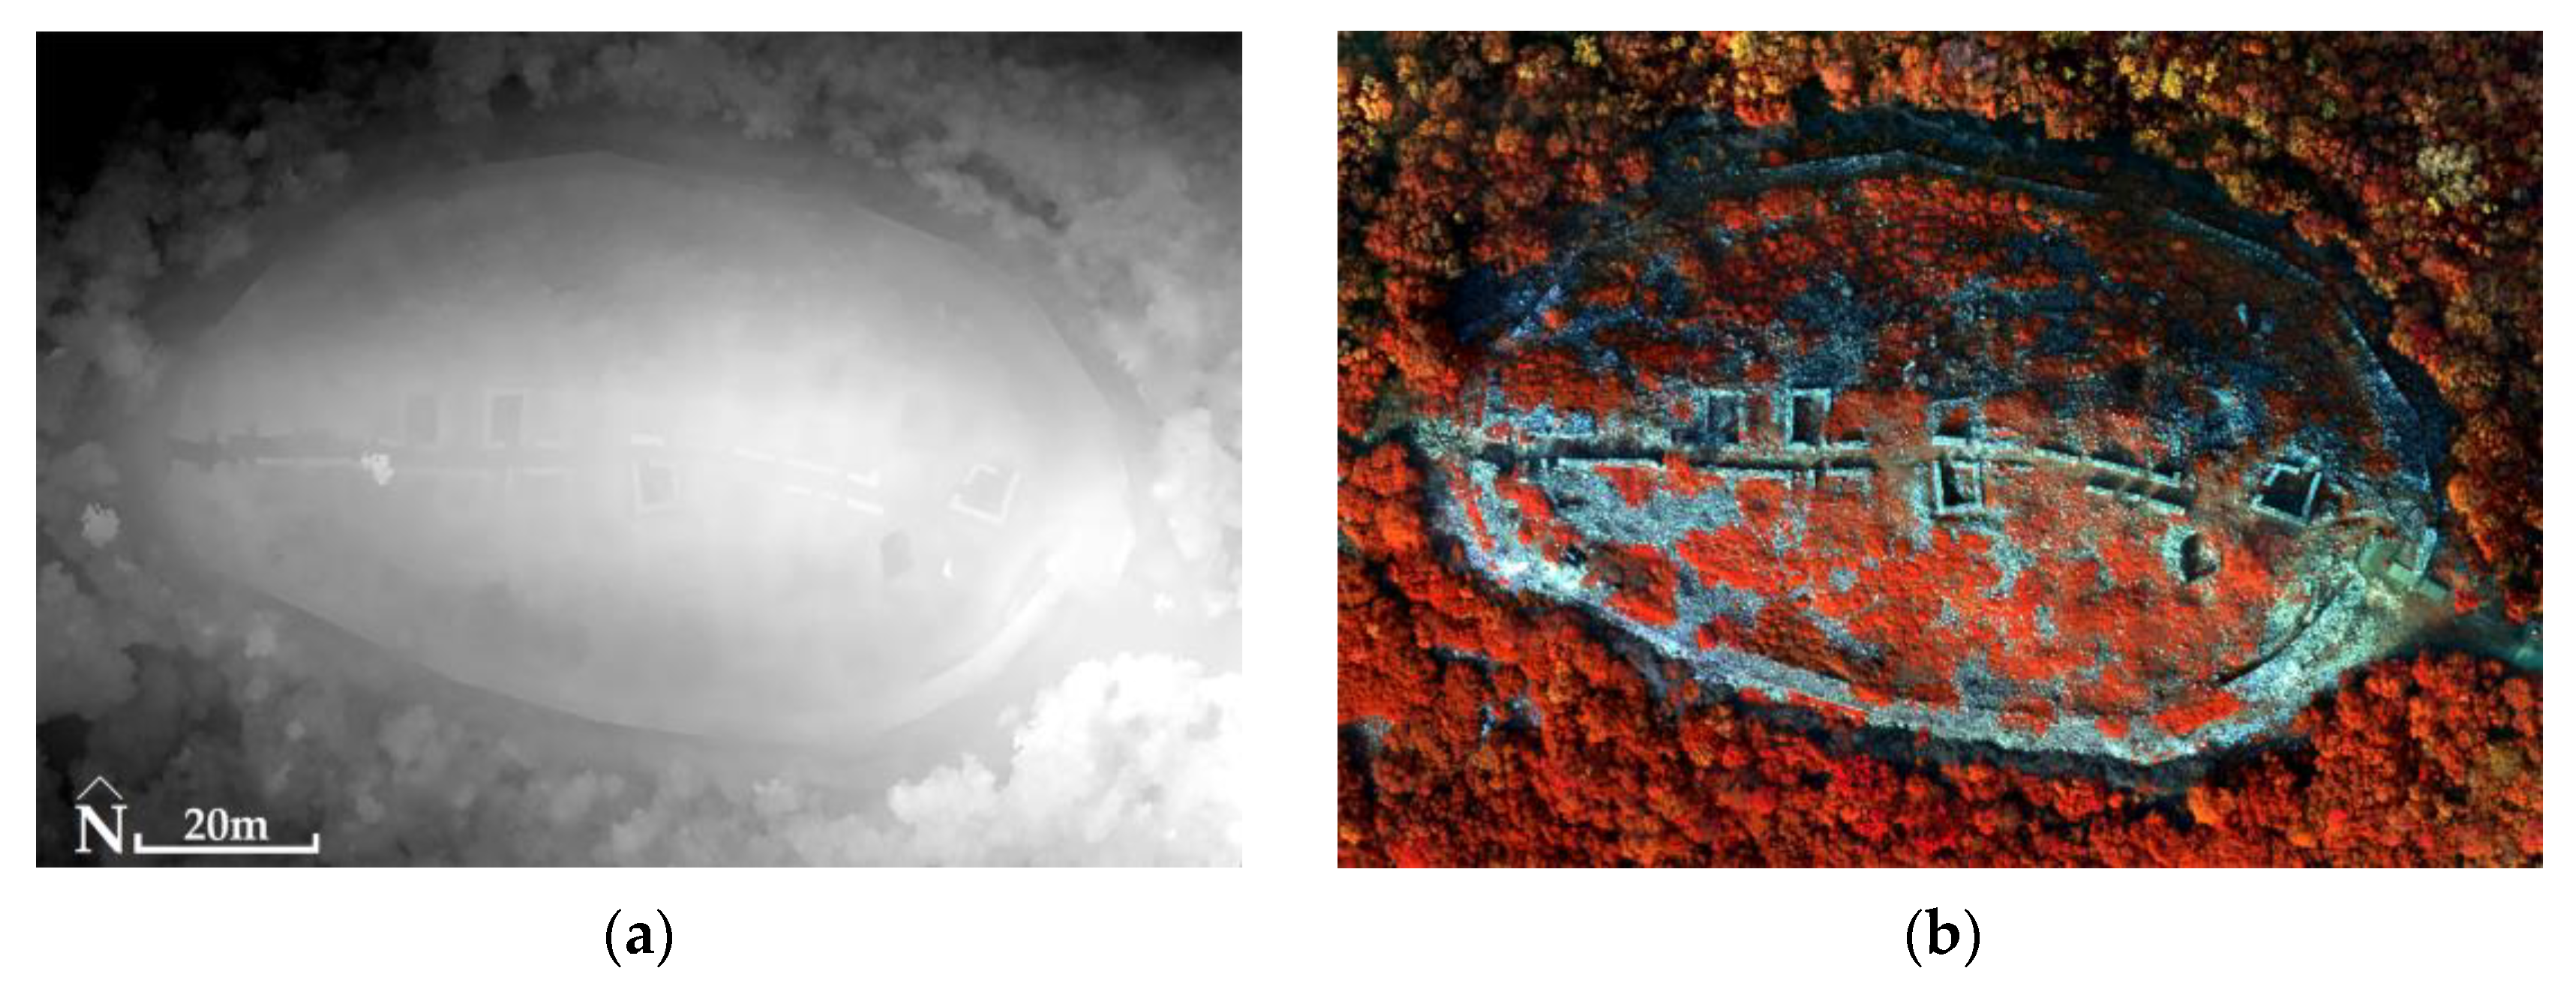
For the Acropolis of Platanias and the RGB images, the RMSExyz was 2.4 cm in the case of using GCPs, while the RMSEXYZ was 1.2 cm in the case of not using GCPs. The generated products had a spatial resolution of 2.1 cm for DSM (Figure 13) and 1 cm for orthophotomosaic in both processing cases (using or not using GCPs). For MS images, the RMSEXYZ was 1.1 cm (not using GCPs). The generated products had a spatial resolution of 16.7 cm for DSM and 8 cm for orthophotomosaic (Figure 13, Table 3).
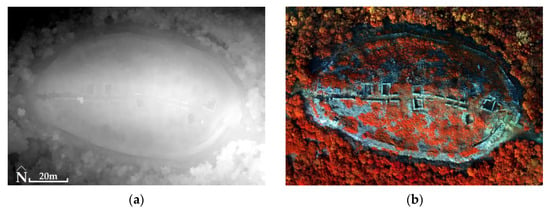
Figure 13.
The Acropolis of Platanias (41°11′05.4″ N 24°26′03.2″ E): (a) DSM (altitudes: from black color 634 m to white color 674 m) using GCPs in the processing of RGB (for example) images; (b) orthophotomosaic (NIR, Green, Blue) without the use of GCPs in the processing of MS (for example) images.

Table 3.
Analysis results in Agisoft Metashape Professional© and the spatial resolutions of the products.
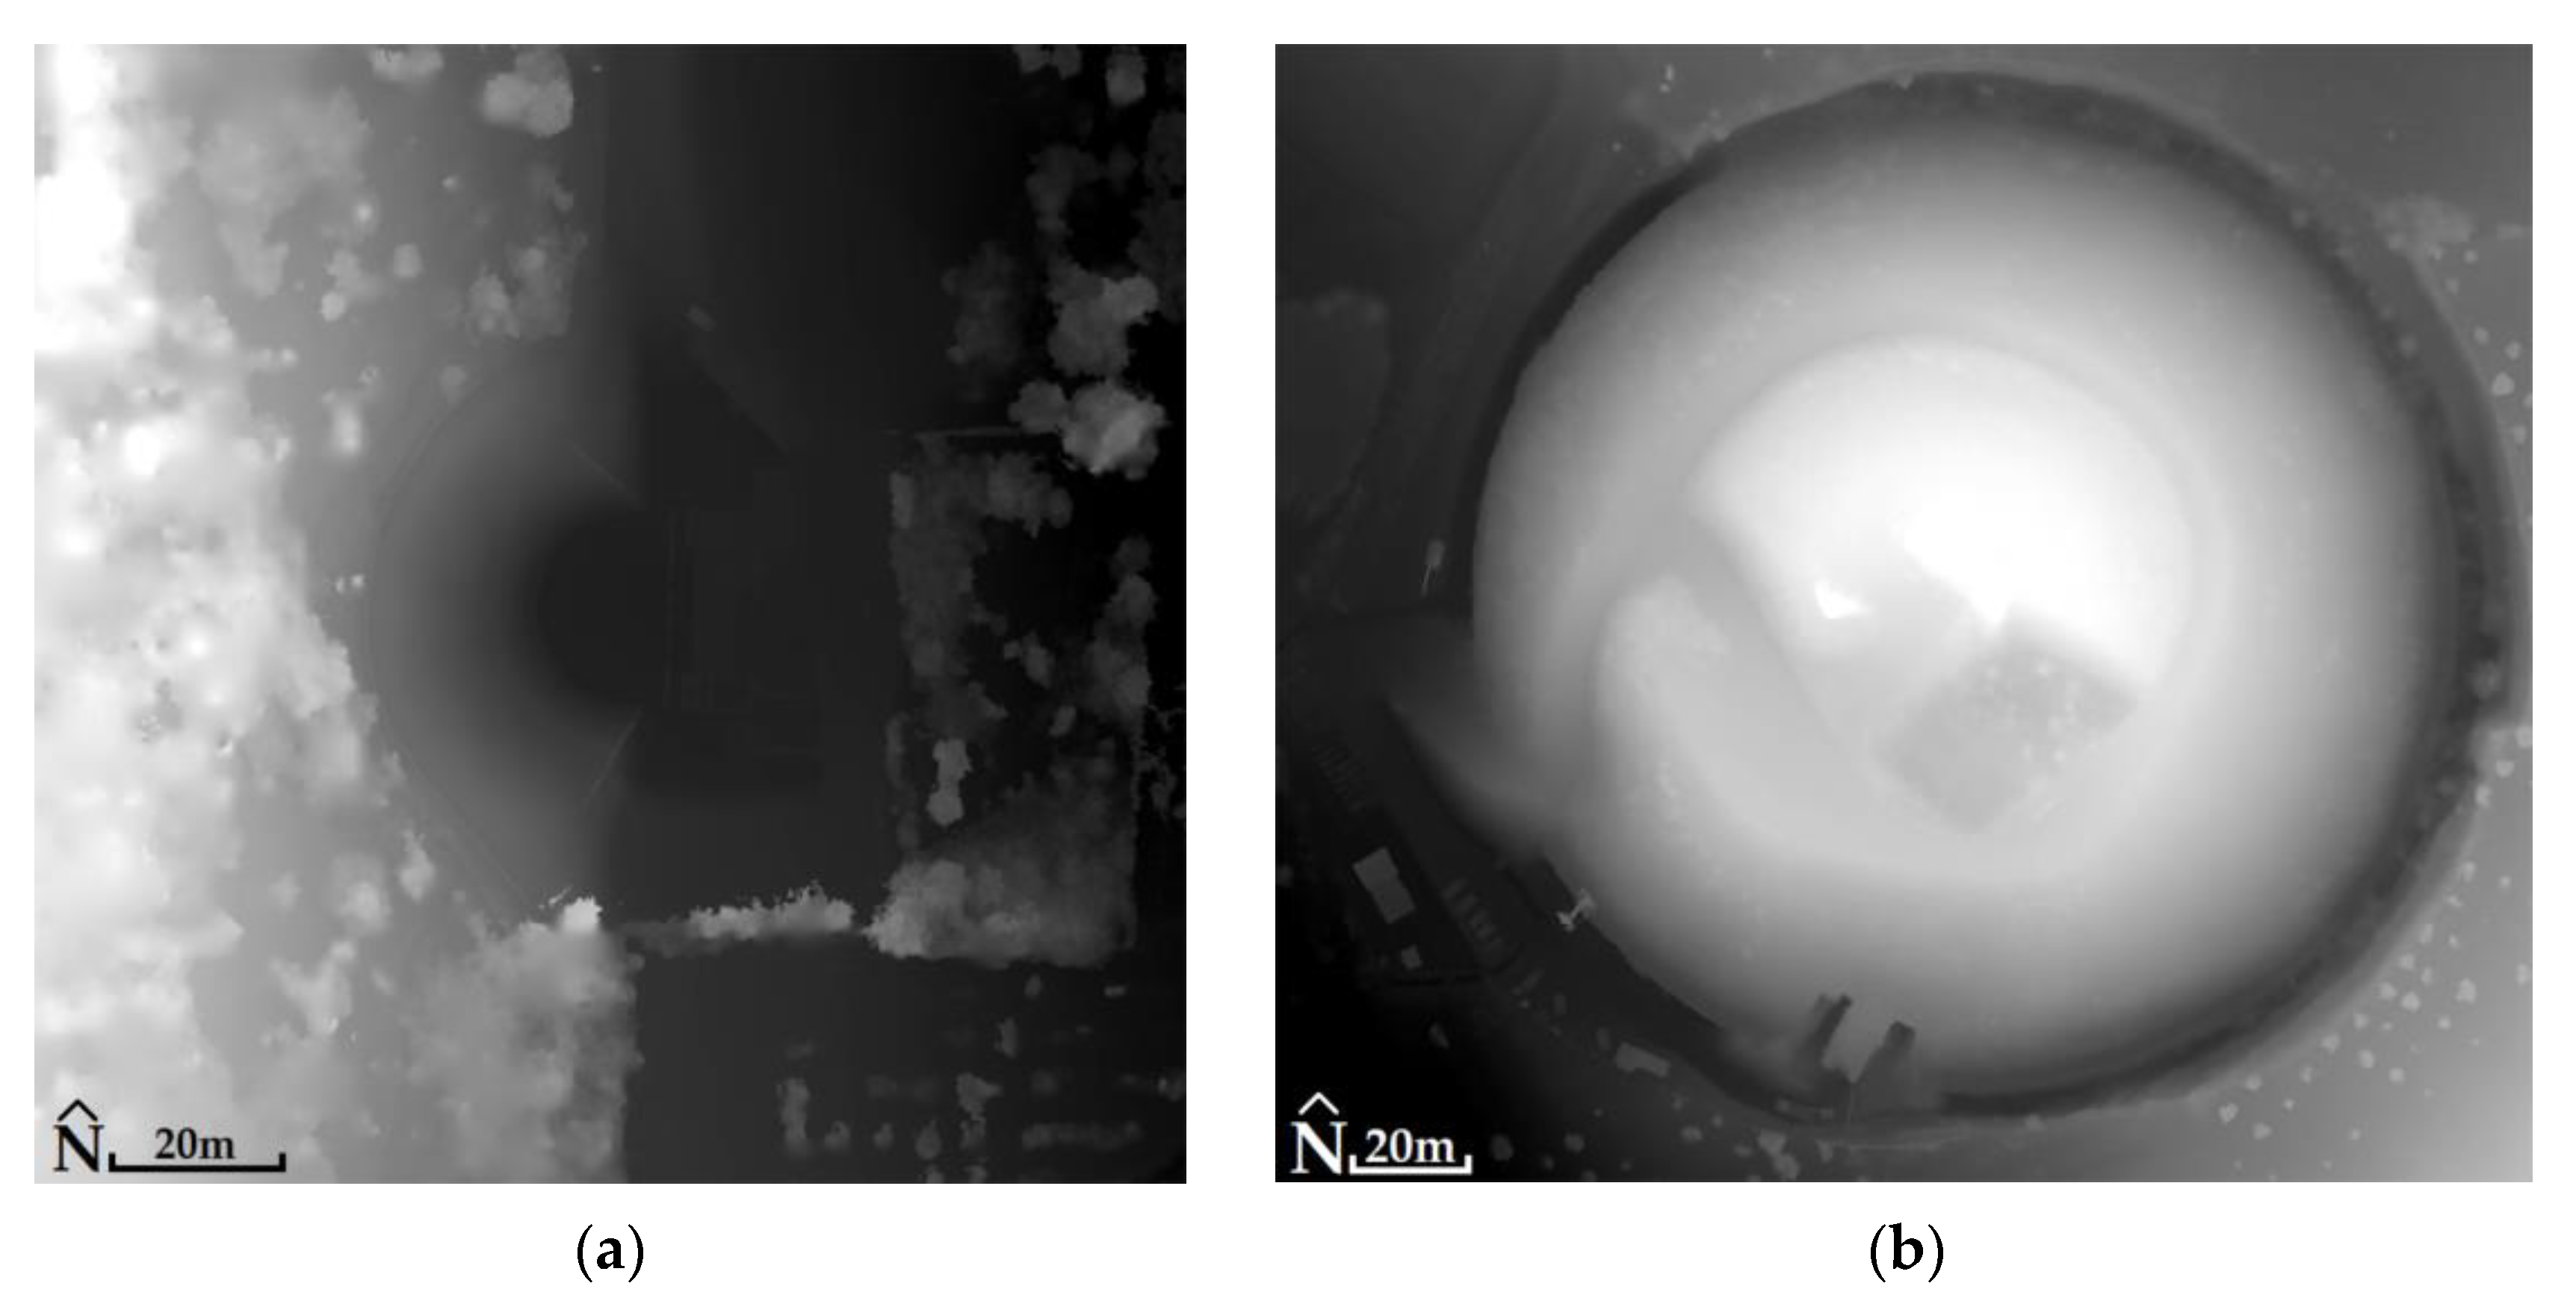
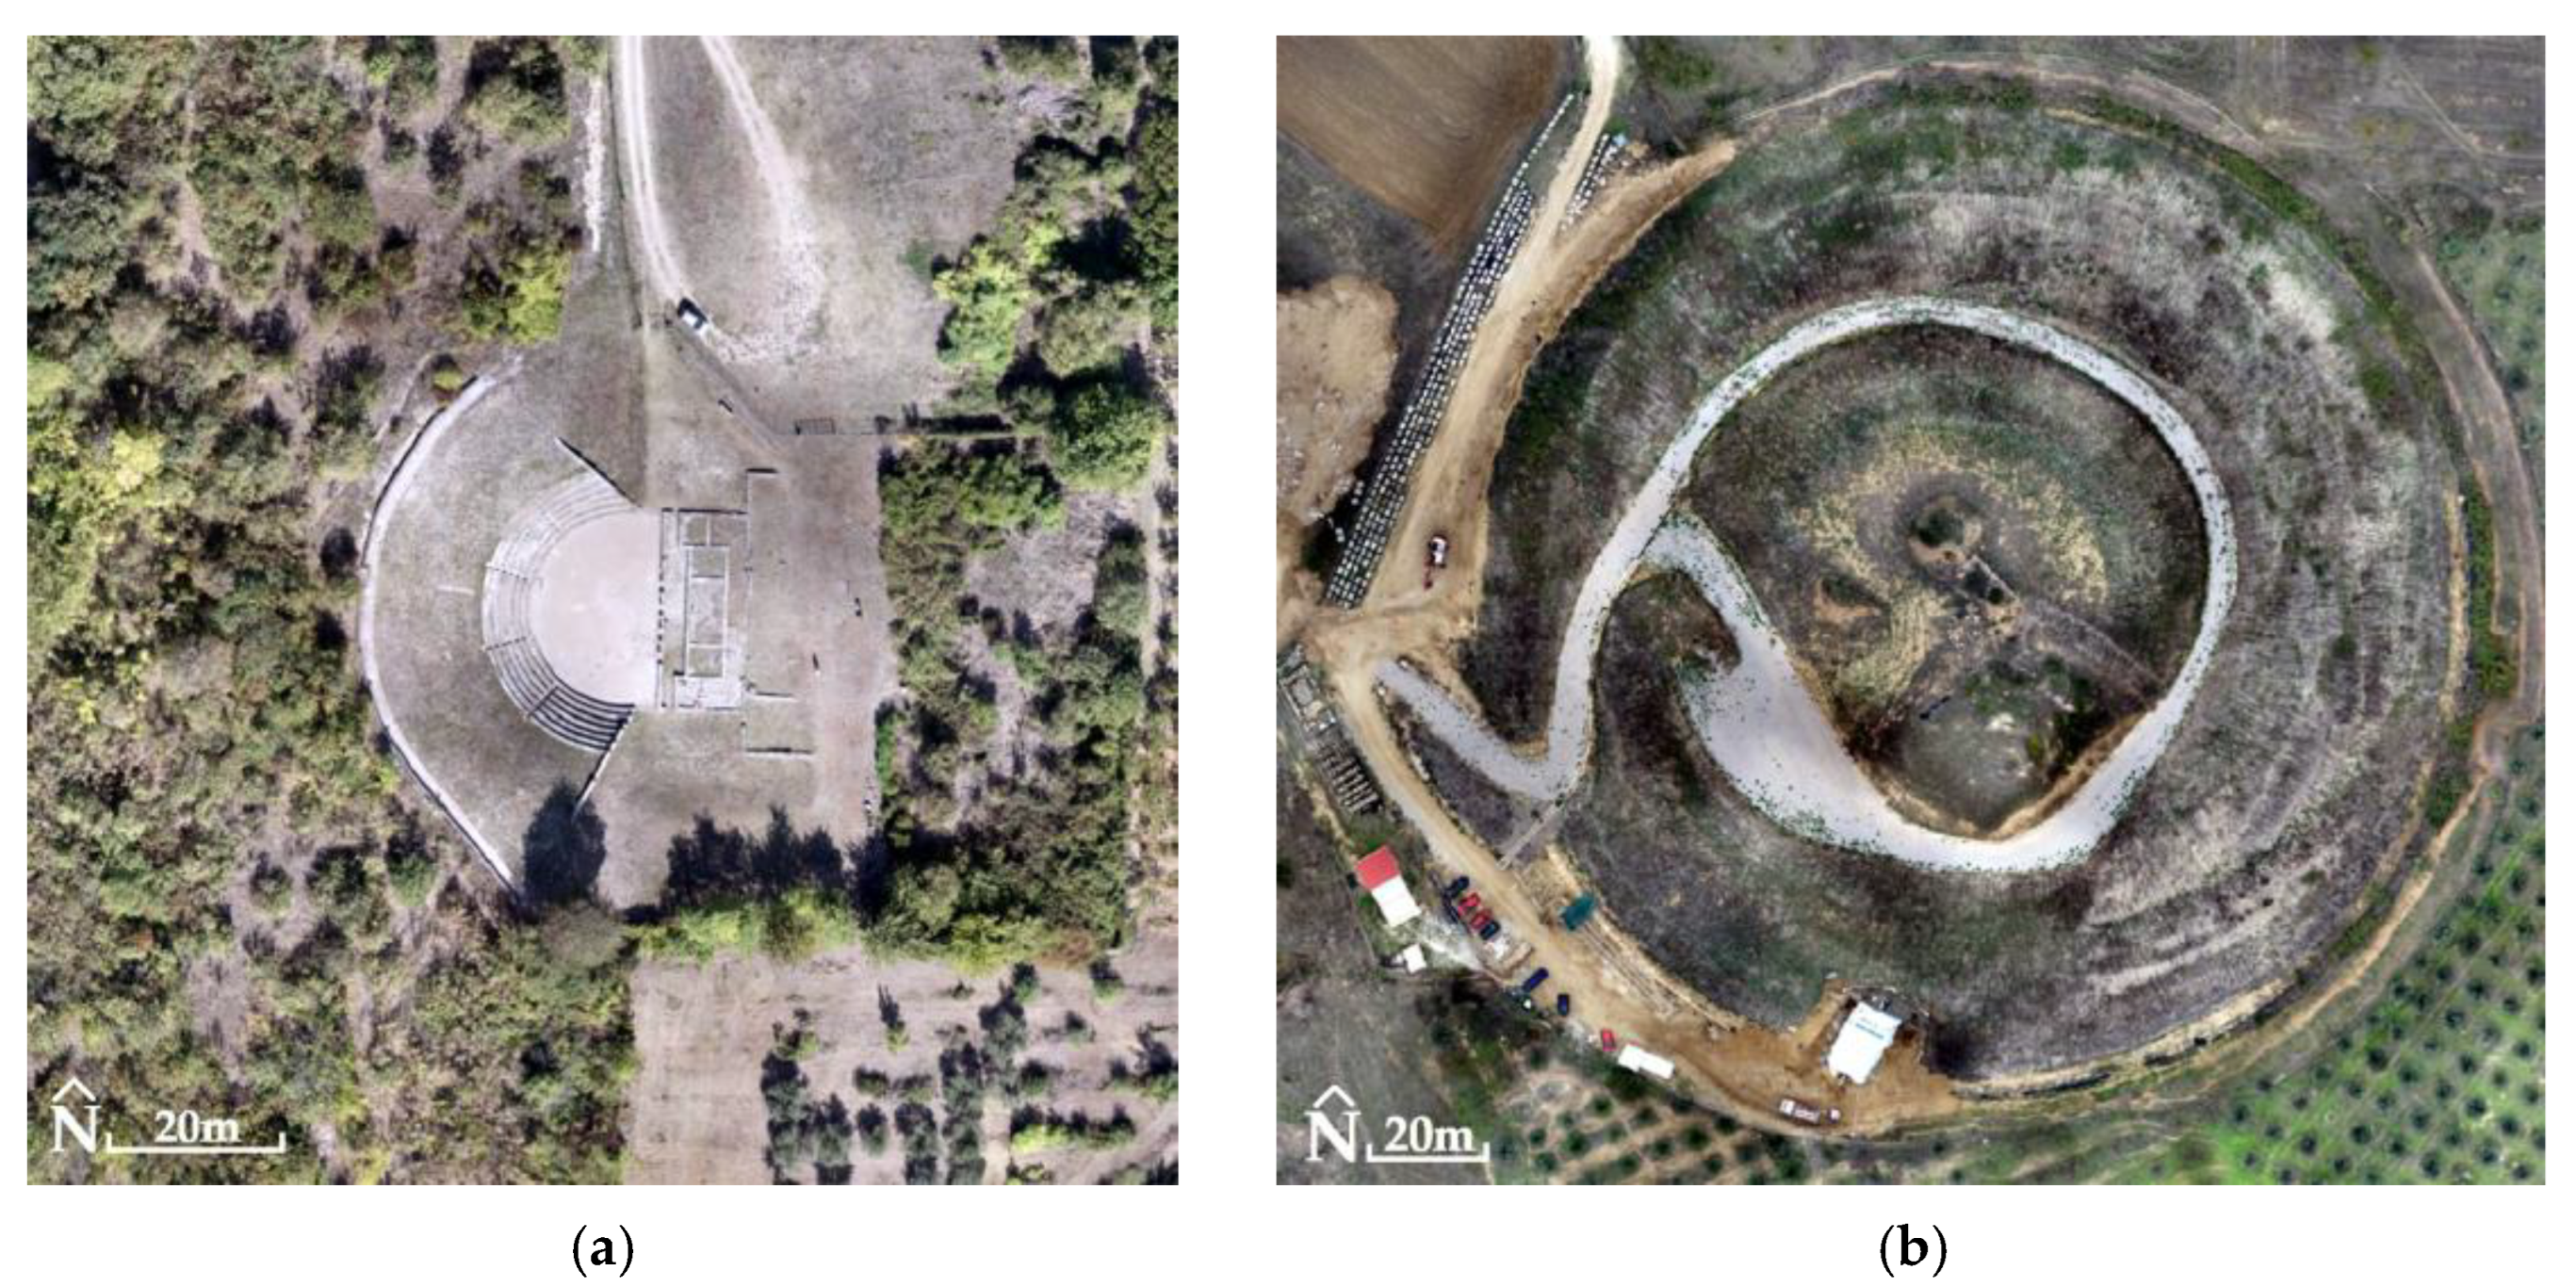
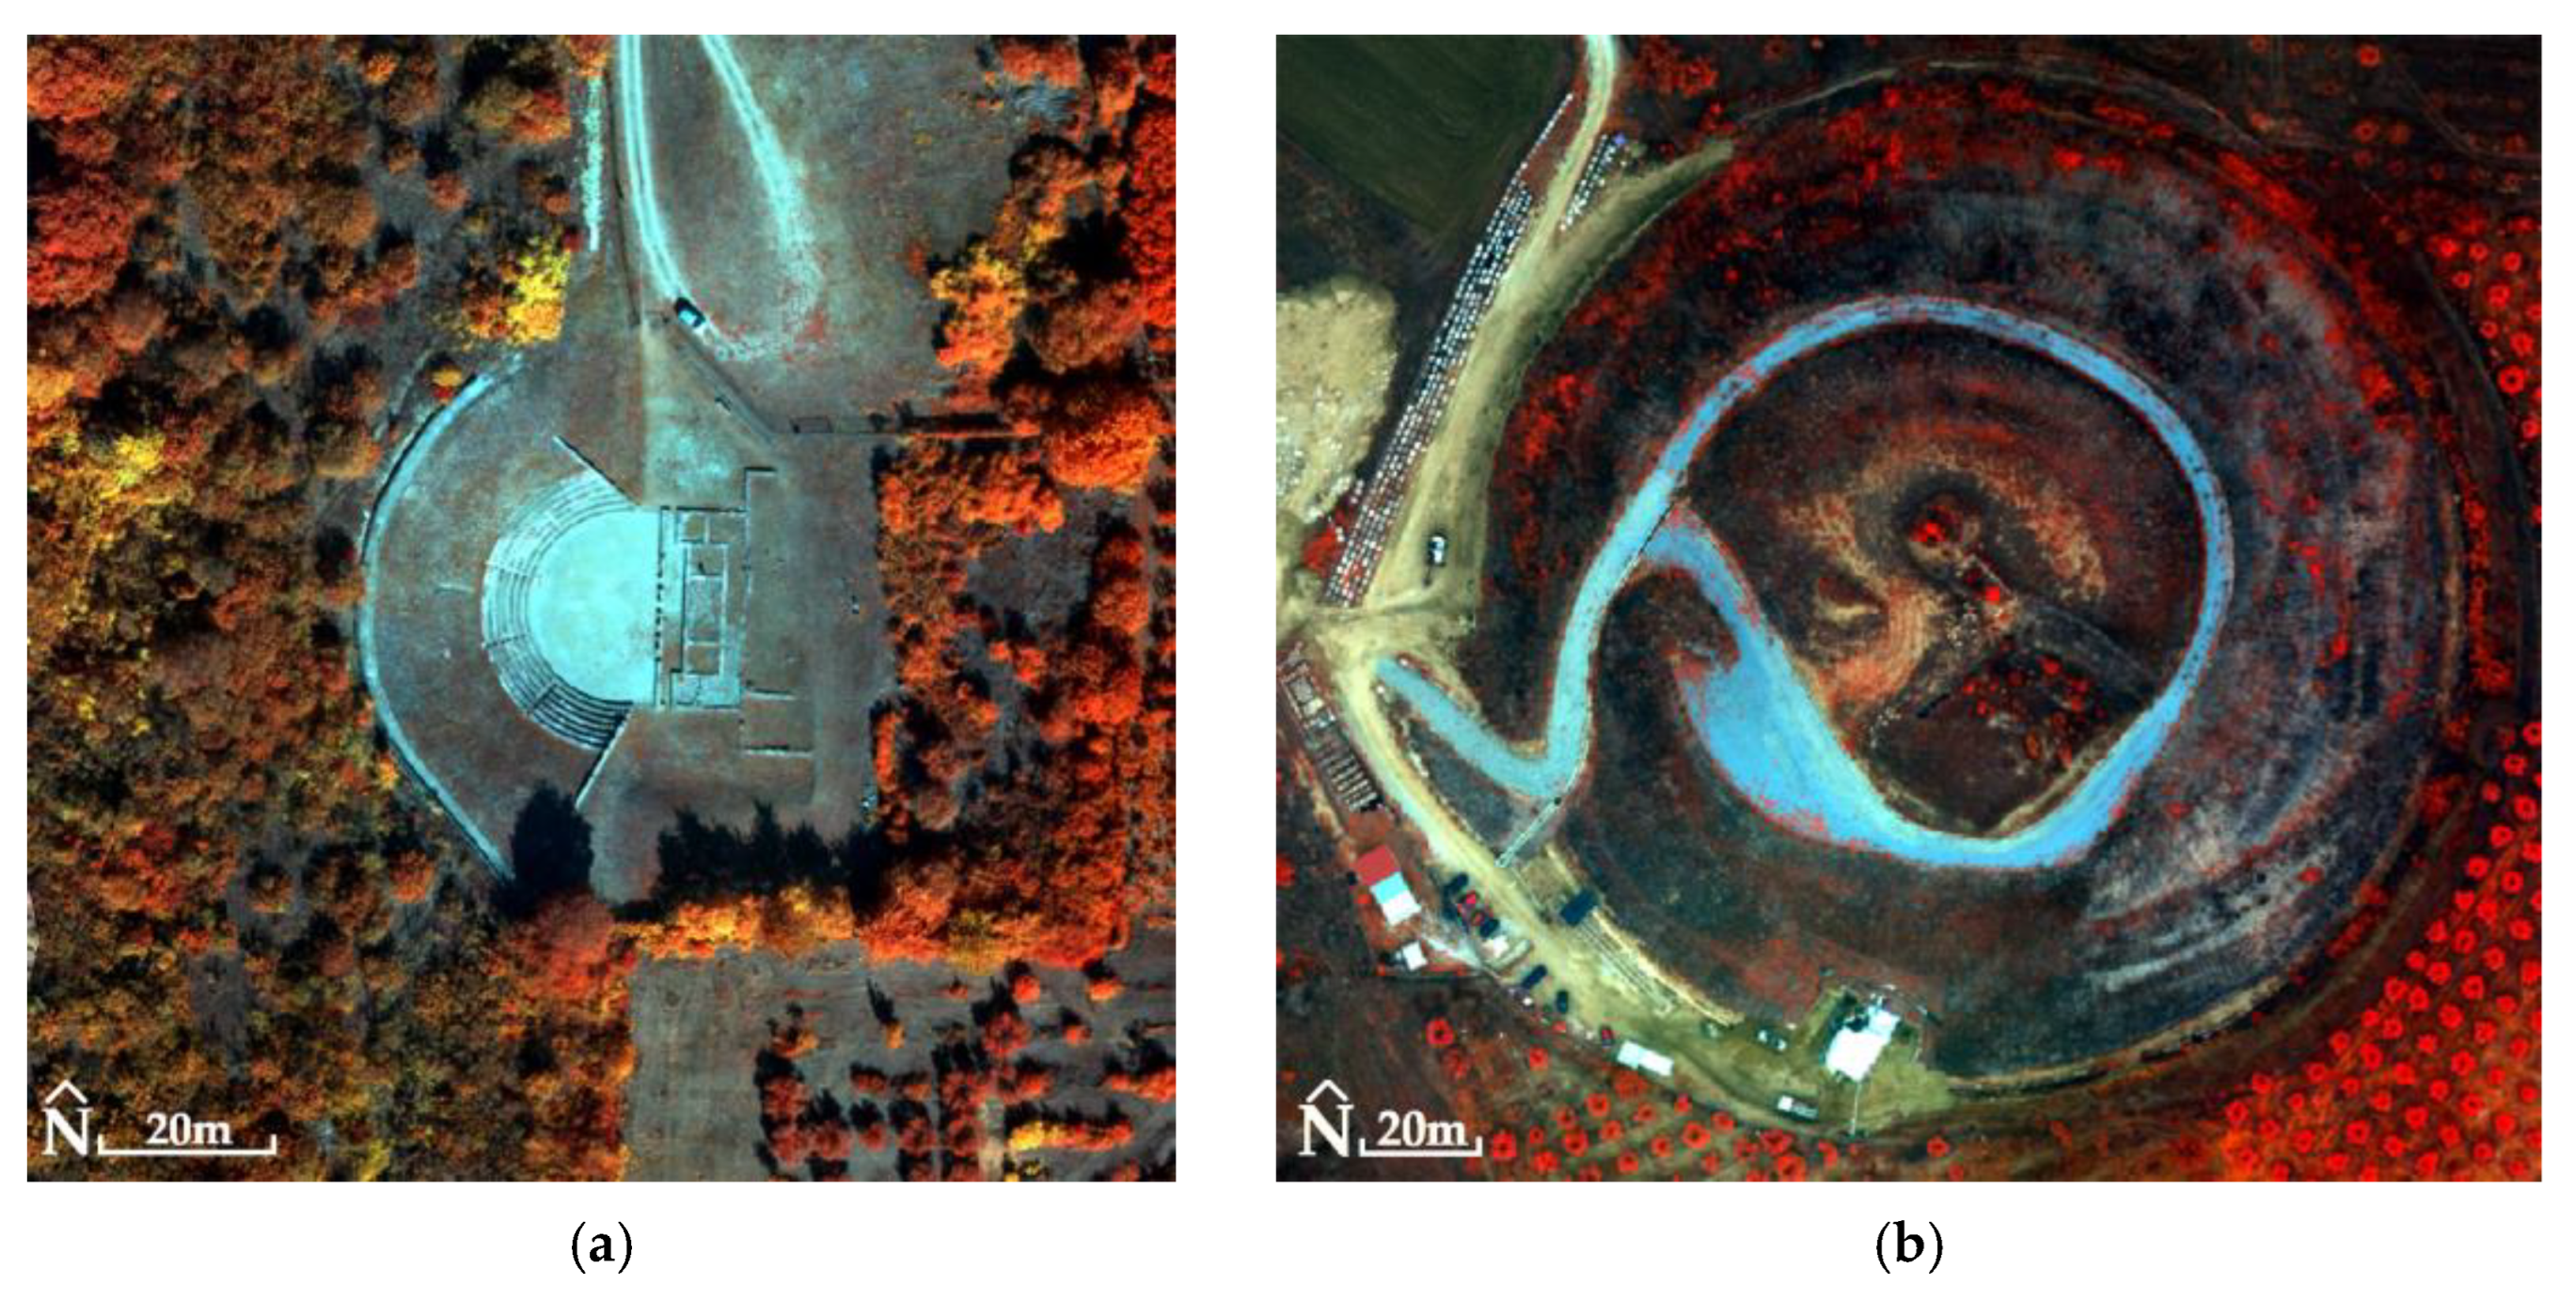
For the Ancient Theater of Mieza and the RGB images, RMSEXYZ was 1.4 cm (not using GCPs). The generated products had a spatial resolution of 2.2 cm for DSM (Figure 14) and 1 cm for orthophotomosaic (Figure 15). For MS images, the RMSEXYZ was 0.8 cm (not using GCPs). The generated products had a spatial resolution of 13.5 cm for DSM and 7 cm for orthophotomosaic (Figure 16, Table 3).
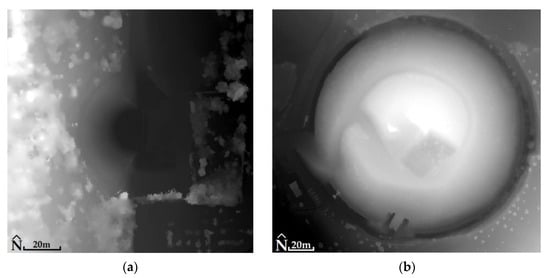
Figure 14.
(a) The Ancient Theater of Mieza (40°38′38.6″ N 22°07′21.3″ E): DSM (altitudes: from black color 90 m to white color 119 m) without the use of GCPs in the processing of RGB (for example) images; (b) the Kasta Mound (40°50′21.5″ N 23°51′44.9″ E): DSM (altitudes: from black color 72 m to white color 107 m) without the use of GCPs in the processing of RGB (for example) images.
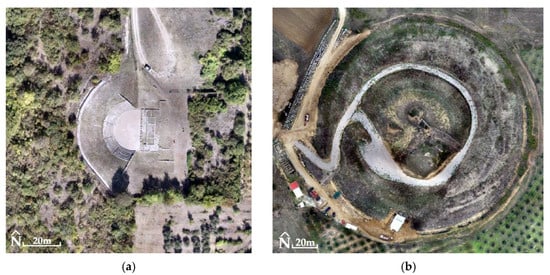
Figure 15.
(a) The Ancient Theater of Mieza (40°38′38.6″ N 22°07′21.3″ E): orthophotomosaic (true color) without the use of GCPs in the processing of RGB images; (b) the Kasta Mound (40°50′21.5″ N 23°51′44.9″ E): orthophotomosaic (true color) without the use of GCPs in the processing of RGB images.
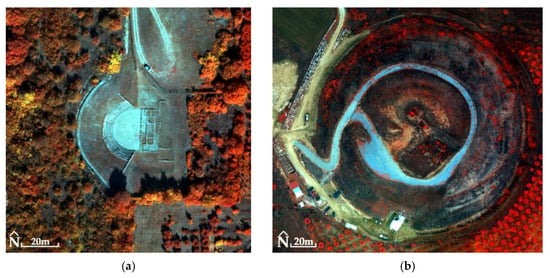
Figure 16.
(a) The Ancient Theater of Mieza (40°38′38.6″ N 22°07′21.3″ E): orthophotomosaic (NIR, Green, Blue) without the use of GCPs in the processing of MS images; (b) the Kasta Mound (40°50′21.5″ N 23°51′44.9″ E): orthophotomosaic (NIR, Green, Blue) without the use of GCPs in the processing of MS images.
For the Kasta Mound and the RGB images, RMSEXYZ was 1.1 cm (not using GCPs). The generated products matched with a spatial resolution of 1.3 cm for DSM (Figure 14) and 0.6 cm for orthophotomosaic (Figure 15). For MS images, the RMSEXYZ was 0.7 cm (not using GCPs). The generated products had a spatial resolution of 14.9 cm for DSM and 7 cm for orthophotomosaic (Figure 16, Table 3).
5.2. Process for Checking the Measuring Accuracy of Products
For the Acropolis of Platanias, the RGB images were processed twice, once with the use of GCPs and once without the use of GCPs. For each of the two processing cases, the final products produced were DSM and orthophotomosaic. By extracting the coordinates (x’, y’ and z’) of the CPs from the products, for both processing cases, it was possible to compare them with the coordinates (x, y, z) of the CPs in the field to evaluate the quality of the products (DSM and orthophotomosaic). The mean value, the standard deviation and the analysis of variance were the tools used for this purpose.
The mean value refers to the value of the sum of the differences between the coordinates of the CPs drawn from the products and their corresponding field measurements, divided by the number of CPs. Since the calculation of the mean is not sufficient to draw safe conclusions, the standard deviation was also calculated. The standard deviation is used to determine the range of dispersion of Δx, Δy and Δz from their mean values. Obviously, the values of the standard deviations ought to be as small as possible, and certainly smaller than the corresponding mean values. The analysis of variance (ANOVA) performs hypothesis tests to determine the differences in the mean values of different data sets. Hypothesis H0 assumes that all samples come from two different data sets (x-measurement in product and x-measurement in field, y-measurement in product and y-measurement in field, z-measurement in product and z-measurement in field) with the same mean value. The alternative HA hypothesis assumes that at least their mean values are different. When the p-value is greater than the constant of 0.05 for a 95% confidence level, then there is no systematic error between the mean values derived from x’ (or y’ or z’) of the products and the actual mean values of these x’ (or y’ or z’, respectively) measured in the field. Thus, any differences between them are considered negligible and are attributed to random errors. When the values of the test statistic F are less than the critical values (F crit), then the standard deviations between x’ (or y’ or z’) and x (or y or z, respectively) do not differ significantly, so that the measurements (field and product) are accompanied only by random errors [8]. Tables with the mean values, standard deviations (Table 4) and the analysis of variance (ANOVA) (Table 5 and Table 6) are presented below (apart from the standard histogram that helped visualize the distribution of the data; we also carried out a number of specific diagnostics such as equality of variances, Skewness and Kurtosis tests; they all pointed to the conclusion that we were dealing with normally distributed data and we therefore proceeded with the ANOVA), and refer to the 3D coordinates of the CPs extracted from the products and compared with the 3D coordinates measured in the field on the corresponding CPs.

Table 4.
Mean values and standard deviations of CPs for the two processing cases.

Table 5.
ANOVA. Comparison of x and x’, y and y’ and z and z’ of CPs (without using GCPs).

Table 6.
ANOVA. Comparison of x and x’, y and y’ and z and z’ of CPs (using GCPs).
5.3. Fused Image Production Process and Control of Thematic Information
The MS sensor (RedEdge-MX) does not include a PAN sensor. Below are the satellite image processing procedures, where the satellites are equipped with a PAN sensor that is utilized in image fusion realization, and the RGB orthophotomosaics of the RBG sensor (RX1R II) are transformed into Pseudo-Panchromatic (PPAN) orthophotomosaics [57,58].
The transformation in Photoshop resulted in the production of black and white (B/W) images, where the intensity value of each pixel stems from maintaining the specific brightness percentages of each band (Red, Green and Blue; details of the algorithm used by Photoshop are not known due to copyright restrictions). Apparently, the PPAN images are not spectrally identical to the PAN images of a sensor that is sensitive to the visible area of the spectrum. Until now, techniques for transforming RGB images into B/W images have been developed based on the optimum visual perception of B/W images by the human eye [59,60,61,62] and not on the spectral approach of real PAN images.
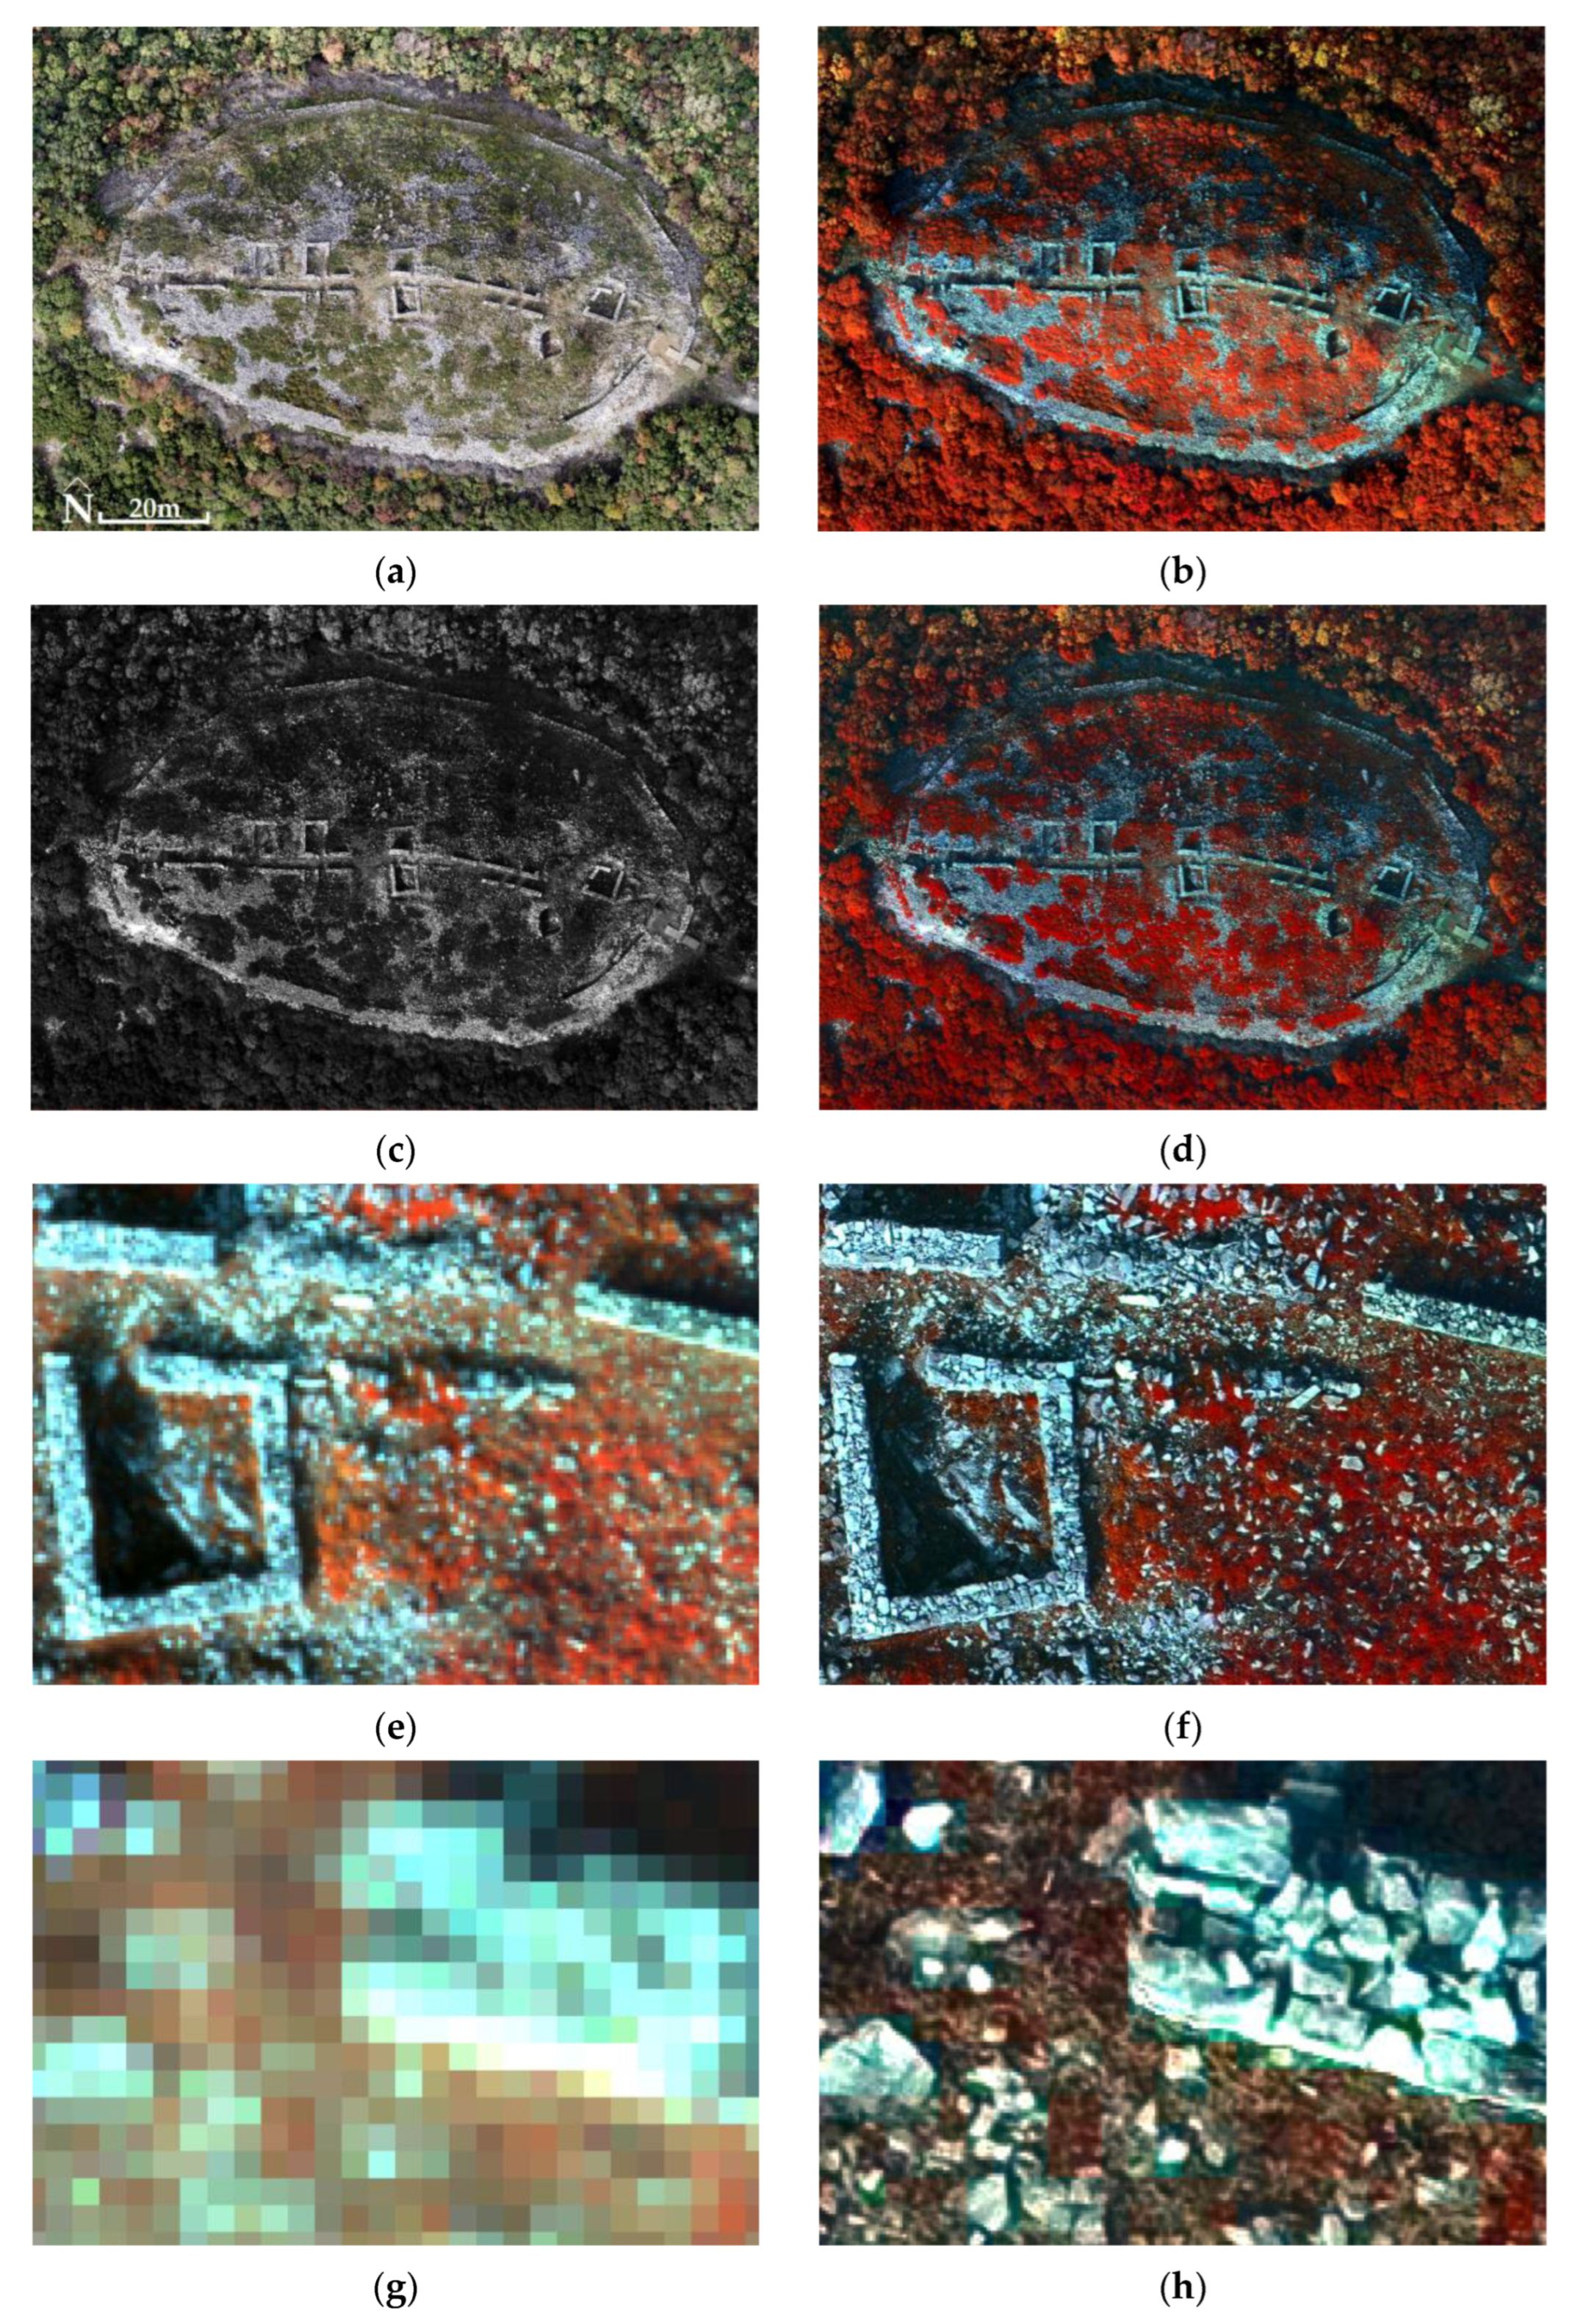
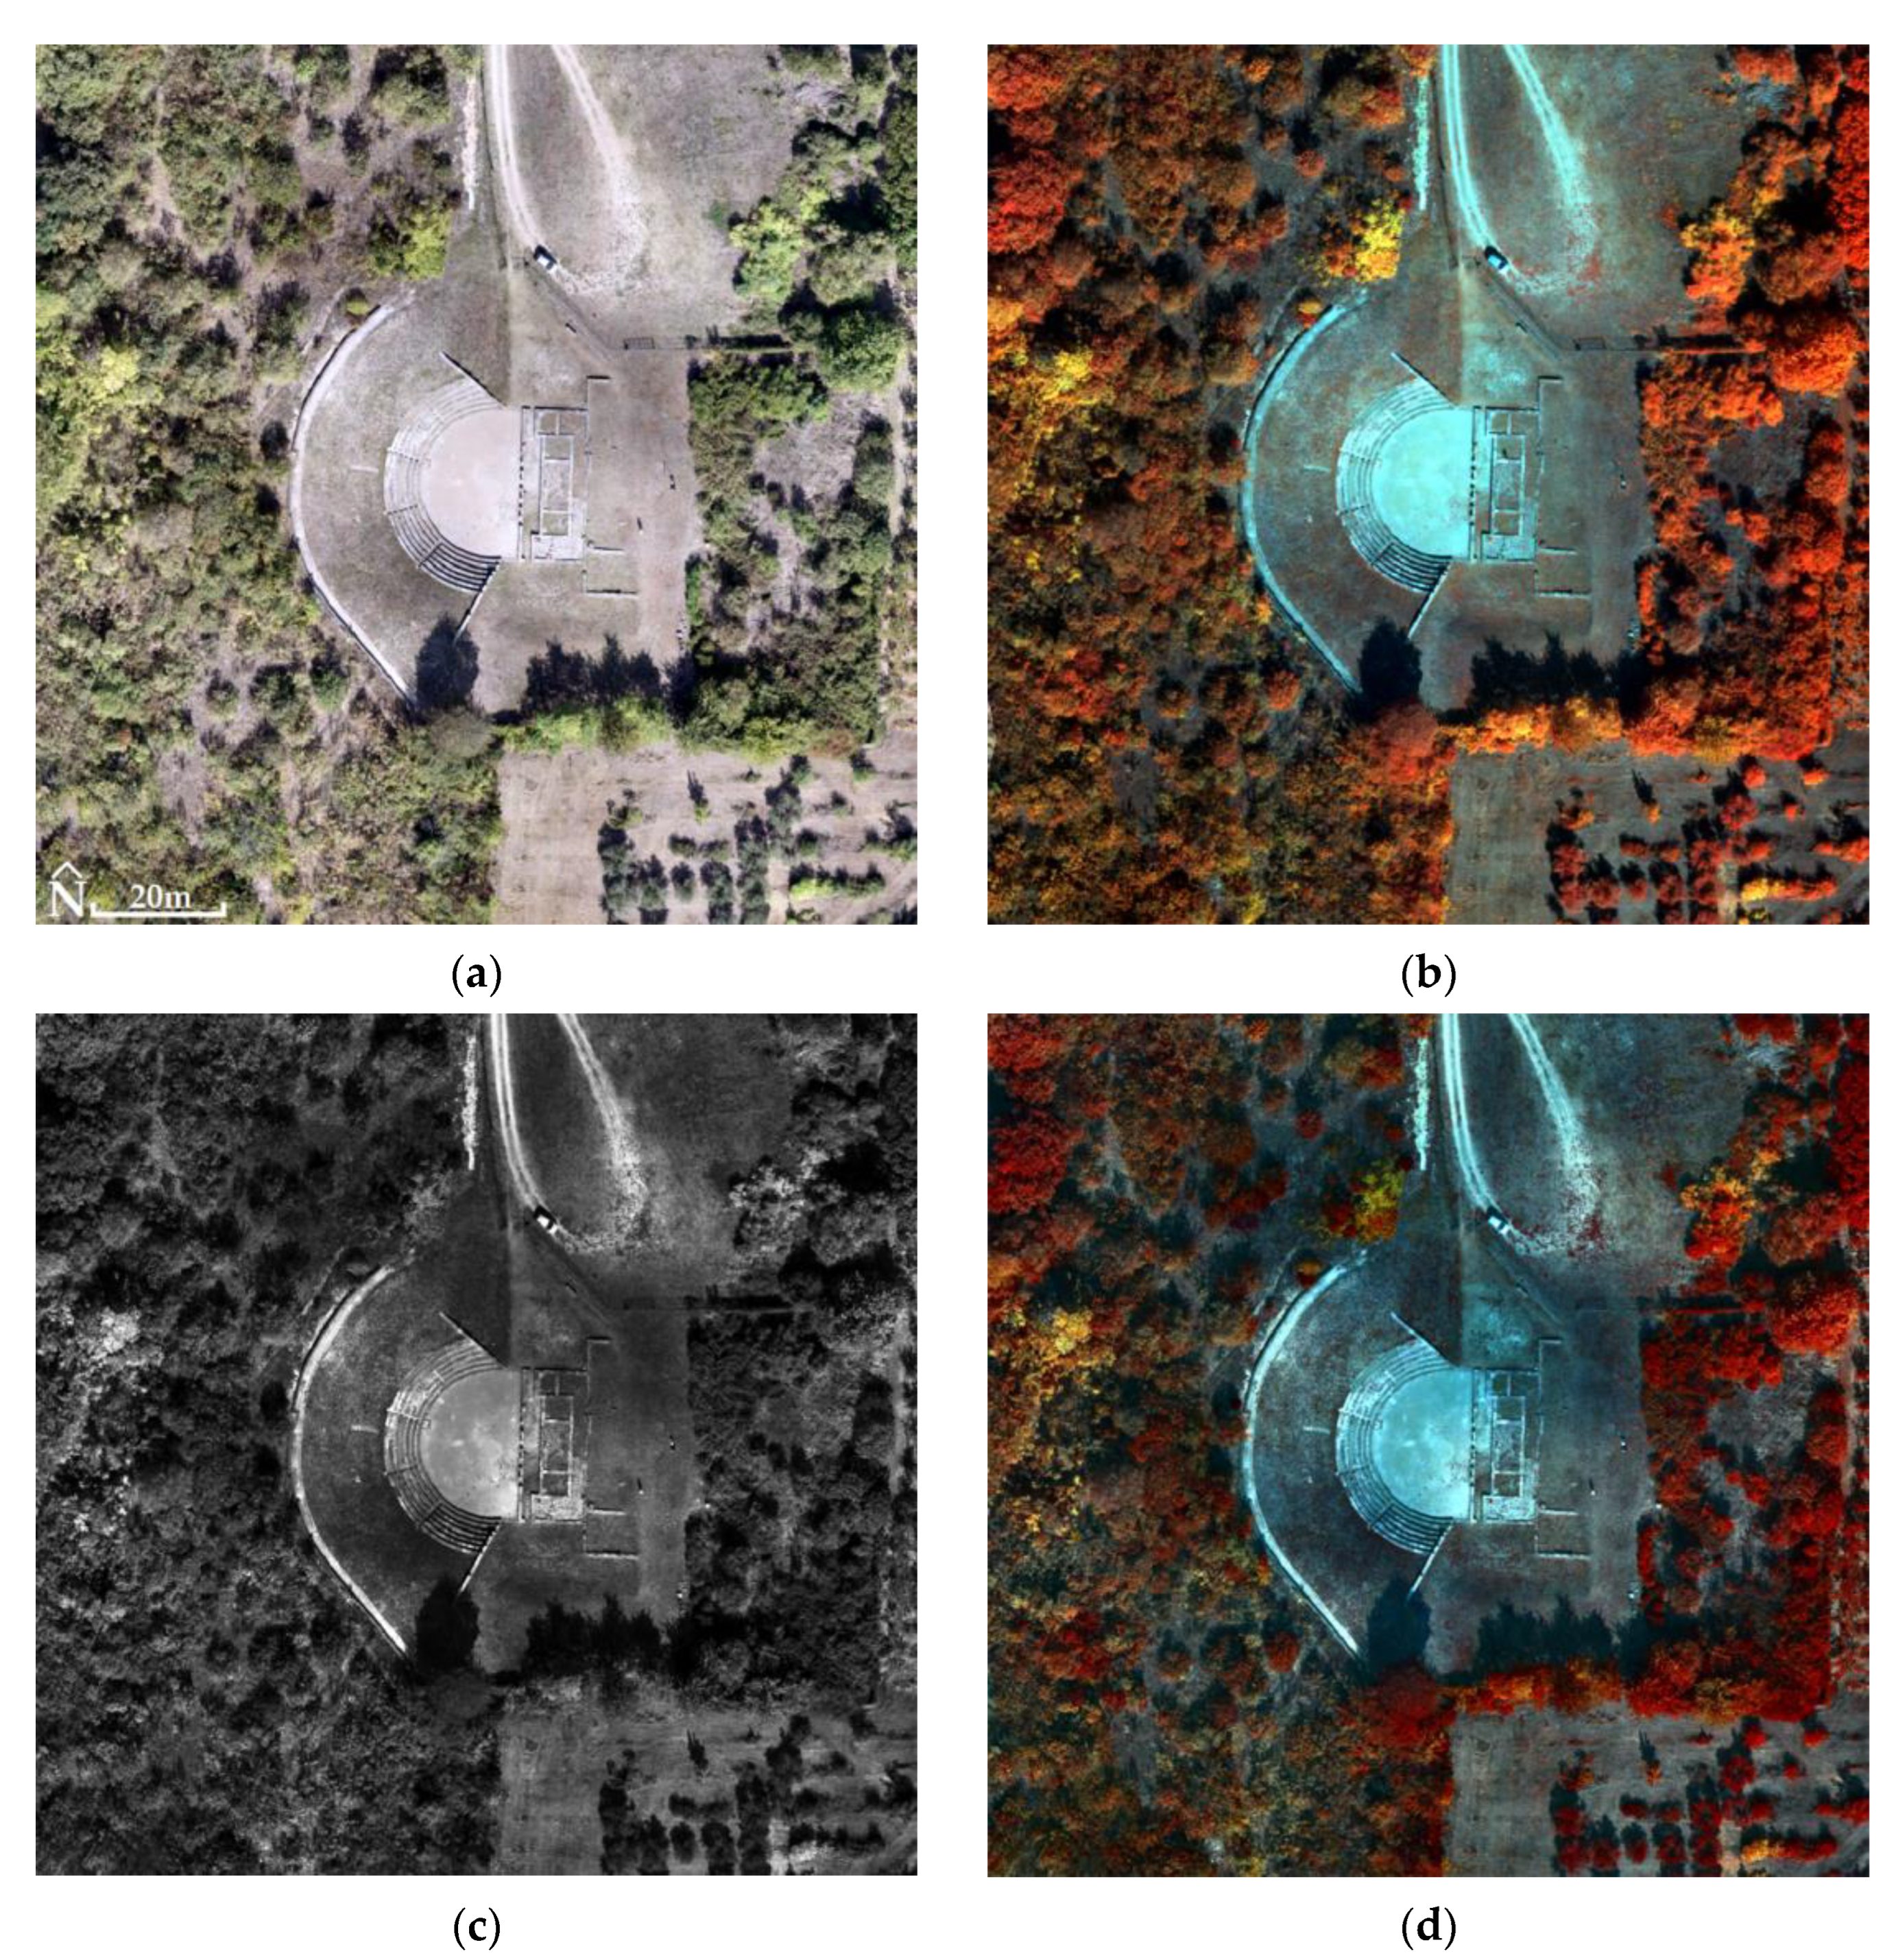
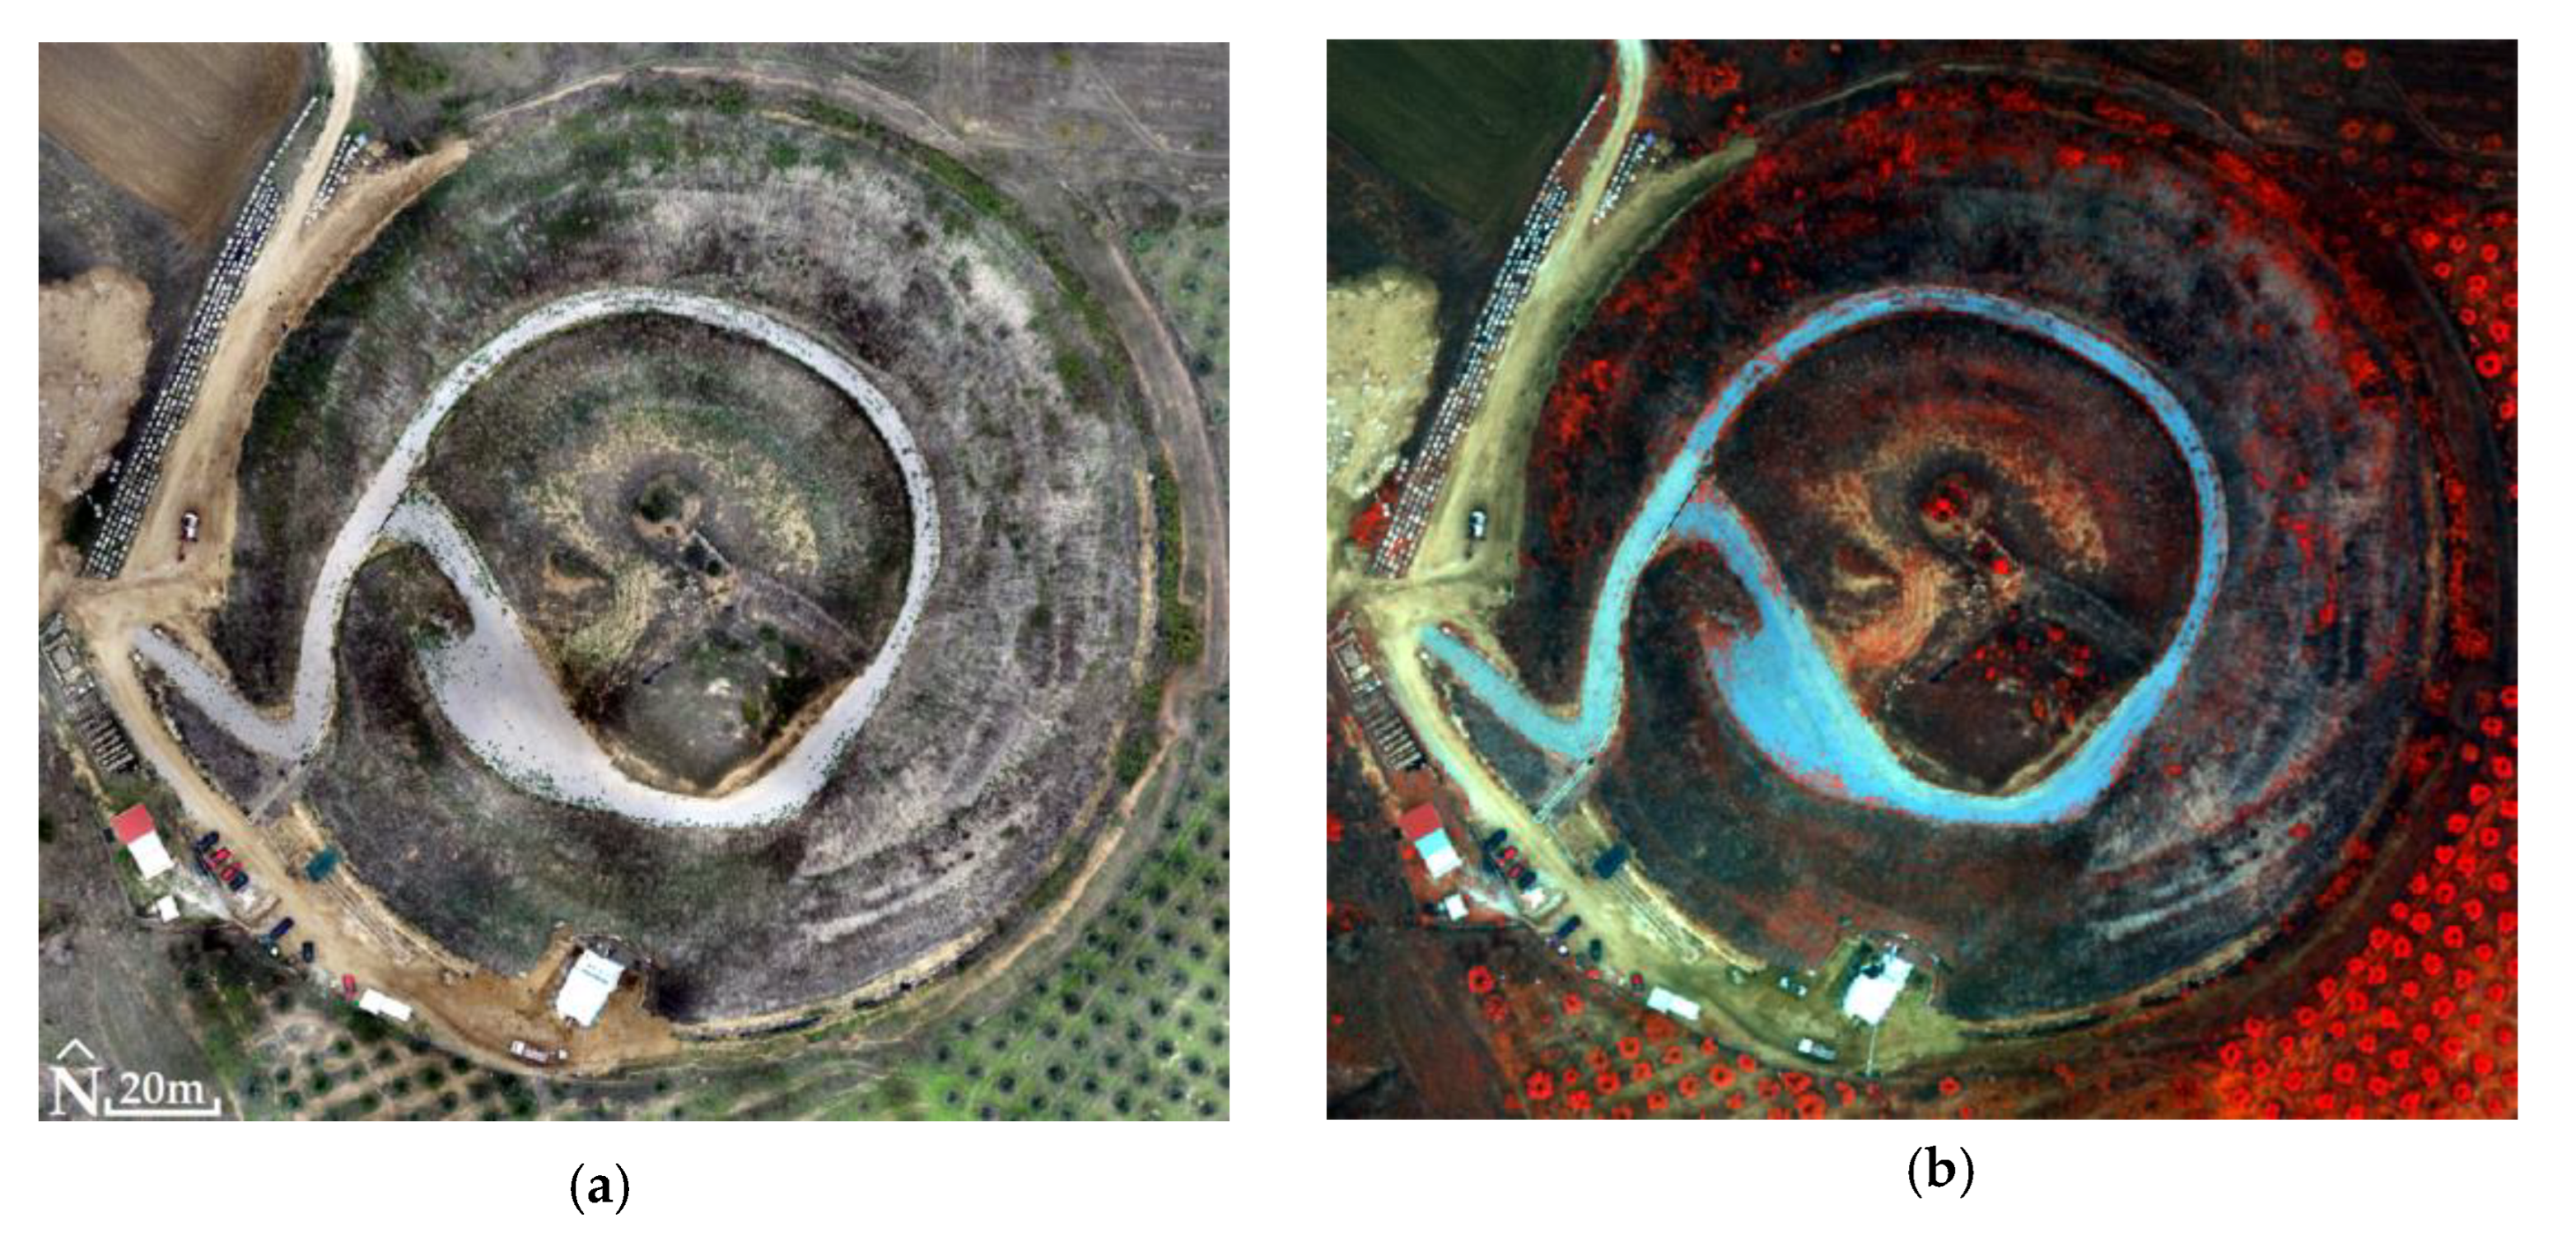
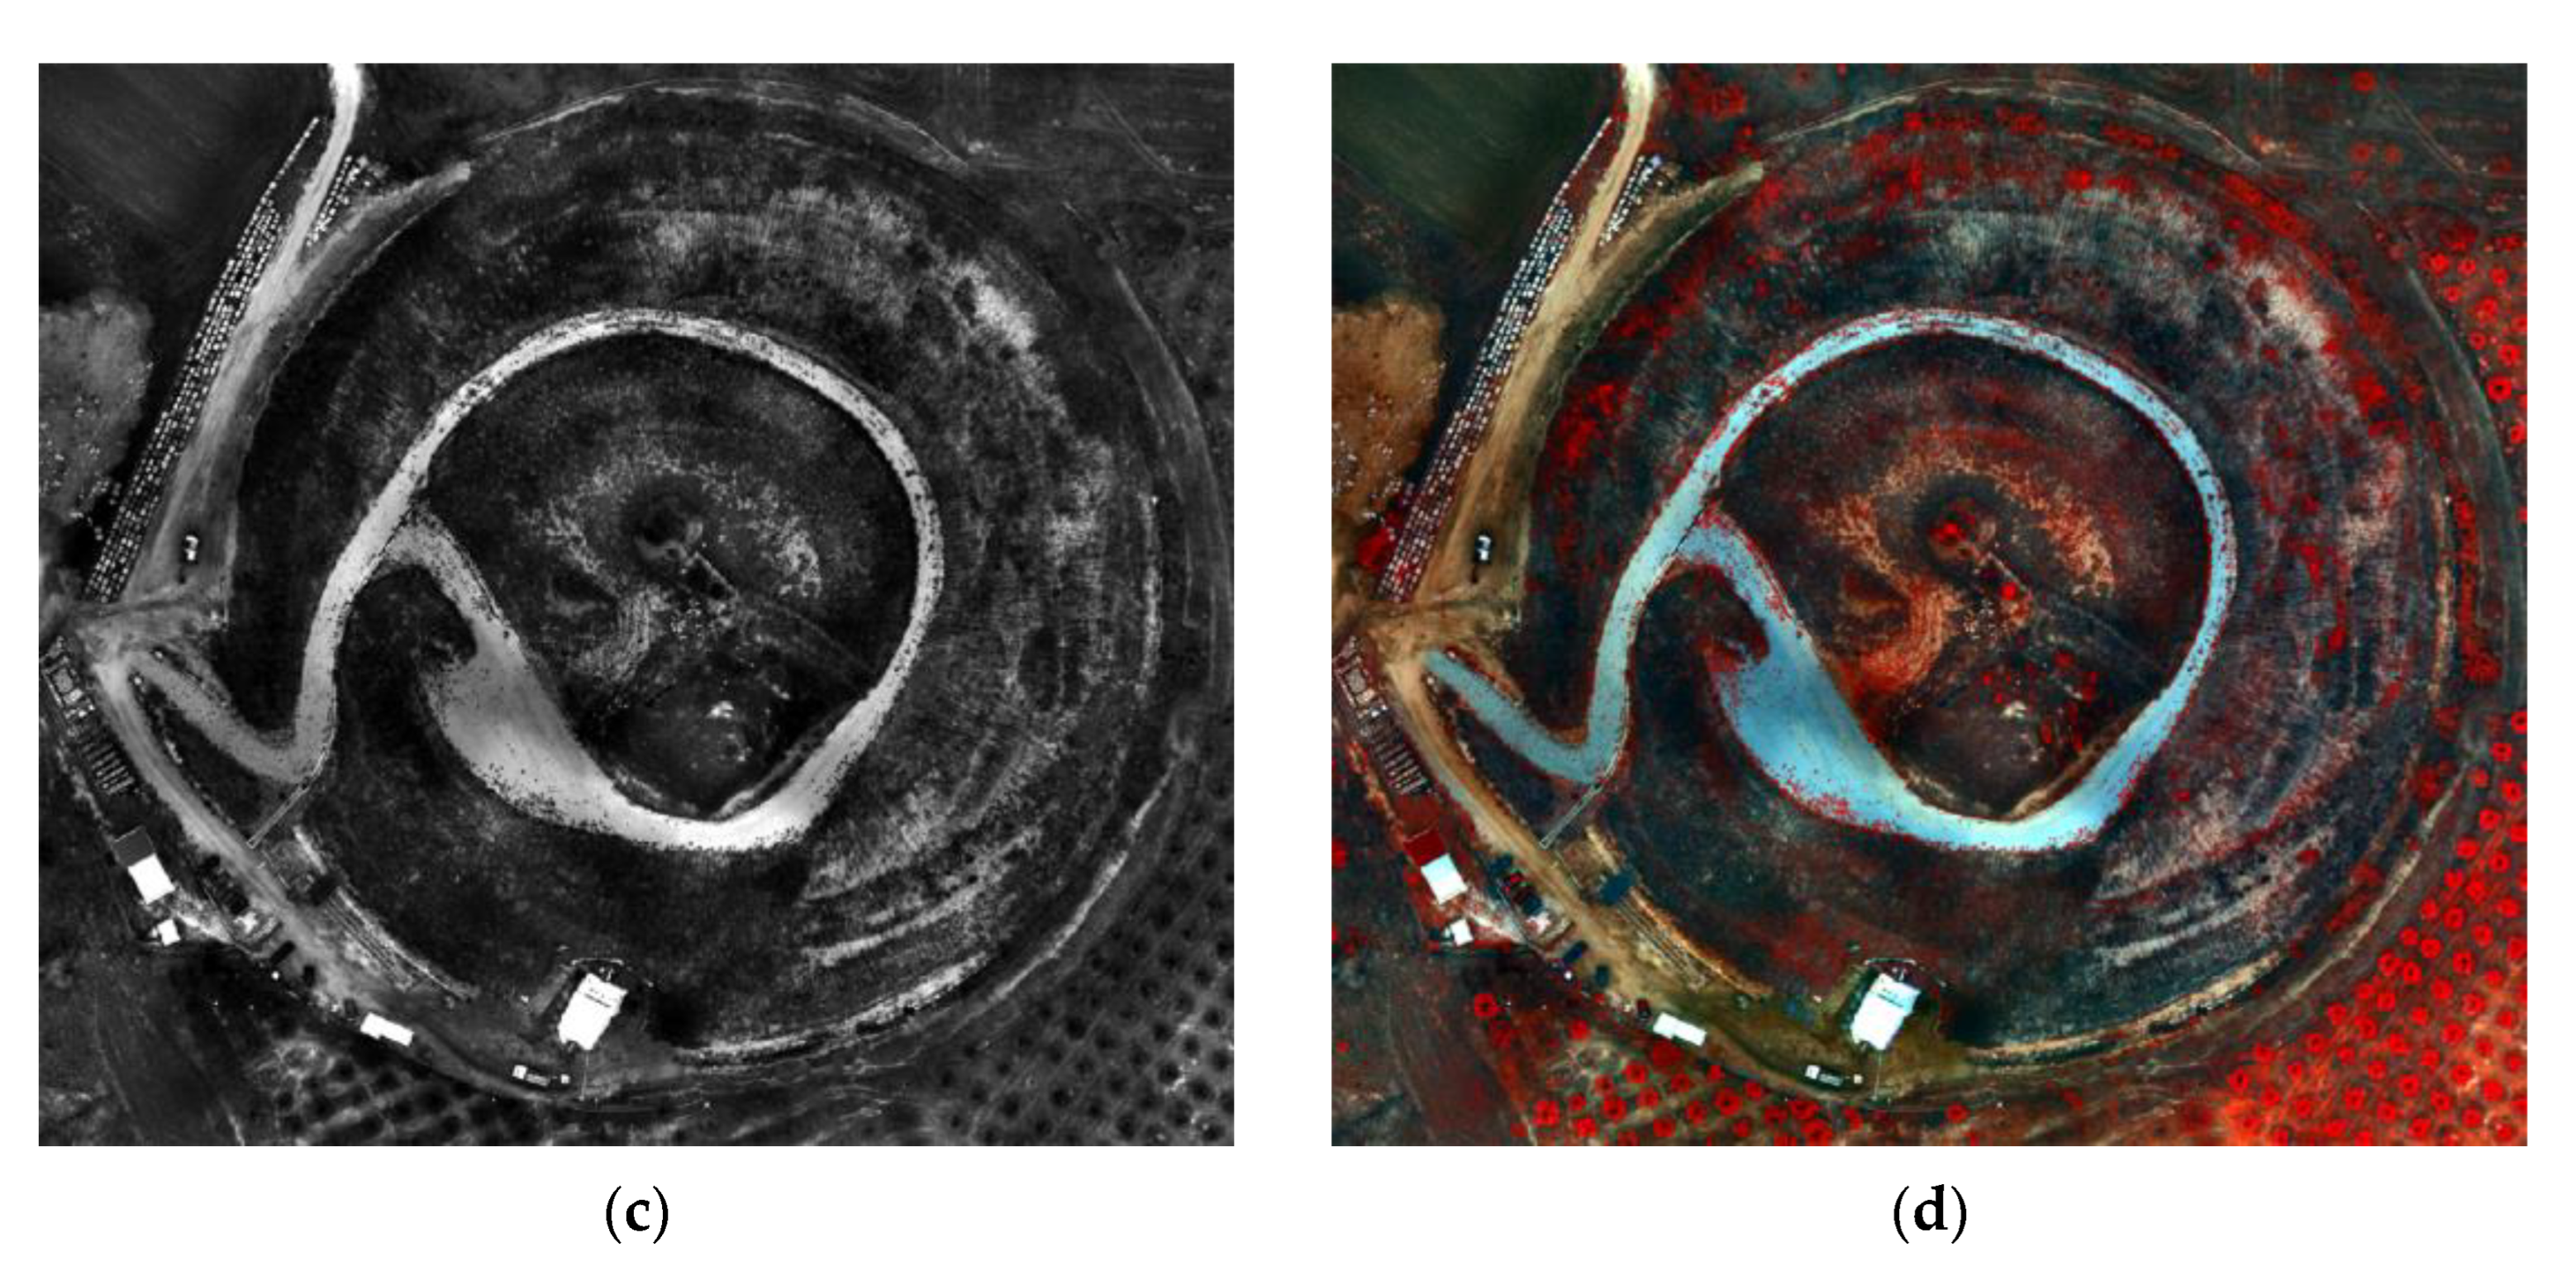
Subsequently, the histogram of each PPAN orthophotomosaic was adjusted to the histogram of the corresponding MS orthophotomosaic (Figure 17, Figure 18 and Figure 19). The fused images (Figure 17, Figure 18 and Figure 19) were created using the Principal Component Analysis (PCA) method. In terms of the output produced, any fused image B*h should be as identical as possible to the image Bh that the corresponding sensor would observe with the highest resolution h, if existent. Therefore, the correlation tables (Table 7, Table 8 and Table 9) of the original MS orthophotomosaics with the fused images reveal the retention rate of the original spectral information (which should be >90%, i.e., >0.9) [63,64,65,66,67] (two other techniques, Multiplacative and Brovey Transform, have also been used [66,67,68,69,70], which did not give better results as to the retention of spectral information, and therefore are not analyzed in the paper).
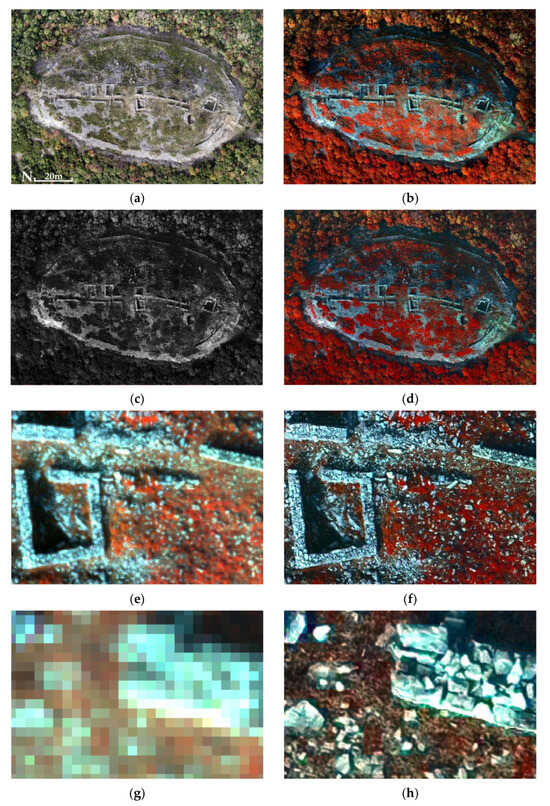
Figure 17.
The Acropolis of Platanias (41°11′05.4″ N 24°26′03.2″ E): (a) the orthophotomosaic (true color) of the RGB sensor; (b) the MS orthophotomosaic (NIR, Green, Blue); (c) the PPAN orthophotomosaic; (d) the fused image (PCA5, PCA2, PCA1); (e,g) MS images with spatial resolution 8 cm (in the center of the study area the widths of the walls are between 0.5 m and 0.7 m) and (f,h) fused images with spatial resolution 1 cm were added at this point to show how important the improvement of the spatial resolution of the MS images is; (e,h) enlargements at the limit of the pixel size (in the other archaeological sites, corresponding figures are missing, as it is necessary to avoid the unnecessary presentation of archaeological information in high spatial resolution).
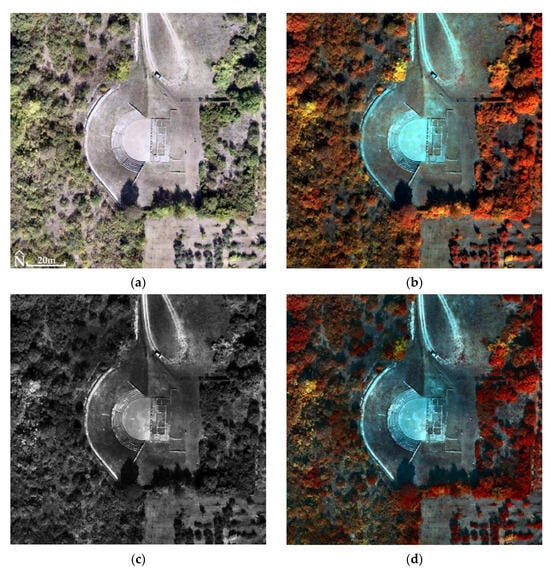
Figure 18.
The Ancient Theater of Mieza (40°38′38.6″ N 22°07′21.3″ E): (a) the orthophotomosaic (true color) of the RGB sensor; (b) the MS orthophotomosaic (NIR, Green, Blue); (c) the PPAN orthophotomosaic; (d) the fused image (PCA5, PCA2, PCA1).
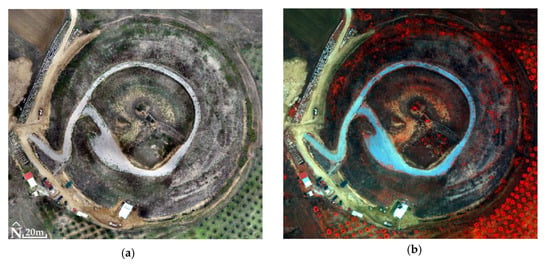
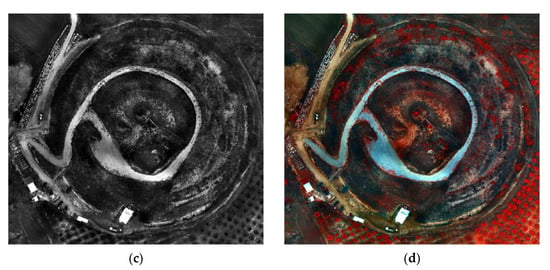
Figure 19.
The Kasta Mound (40°50′21.5″ N 23°51′44.9″ E): (a) the orthophotomosaic (true color) of the RGB sensor; (b) the MS orthophotomosaic (NIR, Green, Blue); (c) the PPAN orthophotomosaic; (d) the fused image (PCA5, PCA2, PCA1).

Table 7.
Correlation table, Acropolis of Platanias.

Table 8.
Correlation table, Ancient Theater of Mieza.

Table 9.
Correlation table, Kasta Mound.
The widespread ERGAS index (Erreur Relative Globale Adimensionnelle de Synthese or Relative Adimensional Global Error in Synthesis), Equation (1), [63] is used to evaluate the quality (quantitative measurement) of the fused image with respect to the MS orthophotomosaic.
where h is the spatial resolution of the high-resolution (fused) images, I is the spatial resolution of the low-resolution (MS) images, N denotes the number of spectral bands and k denotes the index of each band. The RMSE for the k band between the fused and the MS image is shown through RMSE (Bk) (Equation (2)). In the MS image, Mk represents the mean of the k-band.
Values for each spectral band, Pi for MS and Oi for fused images, arise after the selection of random pixels (number of pixels n) at the same coordinates of images.
The limits of the ERGAS index values, which determine the quality of the fused image, are not fixed. They may vary depending on the requirements of each application. For example, when high spectral resolution of images is necessary, then very small index values may be required. In other cases, moderate index values may be acceptable, especially if some factors affect the quality of the fused image (e.g., heavy cloud cover, high levels of atmospheric humidity, etc.). Additionally, the limits of the index are highly dependent on the number and distribution of pixels to be tested (there is no suggested percentage of all pixels of the fused image to be tested), but also on the estimated degree of error acceptance between the two images, which is set solely by the researcher on a case-by-case basis. It follows from the literature that, in general, small index values, close to 0, indicate low relative error between the fused image and MS orthophotomosaic. Therefore, in this case we are dealing with a high-quality fused image. Moderate index values, 0.1 to 1, indicate a moderate relative error. Fused images may be accepted, but there may be small spectral differences between the images (fused image and MS orthophotomosaic). High index values, 1 to 3, indicate high relative error. In this case we are dealing with a low-quality fused image, which differs significantly from the MS orthophotomosaic. All the above limits may, as mentioned above, be modified but in any case, the index values should be less than three in order for a fused image to be characterized in terms of its quality and/or used for classification [63,71,72,73,74,75,76,77,78,79,80,81,82,83,84].
In the Acropolis of Platanias, 31 million of the 120 million pixels of the fused image were checked (using the Model Maker of Erdas Imagine 2015© software to calculate the ERGAS index). The ERGAS index value was 2.8, so there appeared to be a high relative error between the fused image and MS orthophotomosaic. The fused image had a high spectral deviation from the MS orthophotomosaic; therefore, its quality was low.
In the case of the Ancient Theater of Mieza, 54 million of the 169 million pixels of the fused image were examined. The ERGAS index value was 0.5, so there appeared to be a moderate relative error between the fused image and MS orthophotomosaic. The fused image had a moderate spectral deviation from the MS orthophotomosaic, so its quality was good.
Finally, in the case of Kasta Mound, 123 million of the 1 billion pixels of the fused image were examined. The ERGAS index value was 0.2, so there appeared to be a low relative error between the fused image and MS orthophotomosaic. The fused image had a small spectral deviation from the MS orthophotomosaic; therefore, its quality was high.
6. Discussion
6.1. Measurement Content
If this paper was aimed at the production of an, e.g., orthophotomosaic with the best possible spatial accuracy, then we would want better accuracy in the GCPs than the pixel size of the images (or accuracy of the GCPs at least two or three times better than the ground sampling distance (GSD) of the images). The GSD of RGB images is about 8 mm; this means that the accuracy of the GCPs should be 3–4 mm. On the one hand, this product is not the aim of the paper; on the other hand, unfortunately this accuracy in GCPs cannot be achieved with RTK and PPK technologies (for the correction of location data after they are collected and uploaded), which are used in this paper.
Furthermore, the possibility of an internal block adjustment avoiding external observations––as in the case of direct georeferencing (that is, by processing not using GCPs), and the case of processing using GCPs where external observation GCPs have an accuracy two or three times better than the GSD––may not allow the comparison of the products of both methods (using or not using GCPs).
Therefore, in this paper, the accuracy of the resulting products is checked against the existing accuracies of the GCPs and the centers of the images. The same GNSS is used to measure the GCPs and CPs, and to calculate the coordinates of the images’ centers. These coordinates have approximately the same accuracies (we are in the same area and the measurements are made from the same permanent stations). The question is, with these accuracies, what is the accuracy of the products either with the use of GCPs or without the use of GCPs (direct georeferencing)? With these accuracies, should we use GCPs in the field or can we obtain better products just with the UAS’s PPK system measurements? In the following paragraphs, there is a discussion about the metric content and comparison of the products.
In both cases of processing (using or not using GCPs) of the RGB sensor images, the p-values are greater than the constant 0.05 (Table 5 and Table 6), so for a 95% confidence level there appears to be no systematic error between the mean x (or y or z) values of the CPs of the products and the (actual) mean x (or y or z, respectively) values of the CPs measured in the field. Thus, any differences between them are considered negligible and are attributed to random errors. Moreover, in both cases, the values of the test statistic F are below the critical values (F crit), so the standard deviations of x’ (or y’ or z’) and x (or y or z, respectively) do not differ significantly, so that the measurements (field and product) are accompanied only by random errors.
Therefore, the first positive point is that the measurements of CPs (in products and in the field) are not accompanied by systematic errors. Thus, it makes sense to check for the CPs of the means and standard deviations of the differences between the 3D coordinates measured on the products and the 3D coordinates measured in the field.
According to Table 4, the standard deviations of the differences in CPs are smaller than their mean values on all three axes in both processing cases (using or not using GCPs). Therefore, a second positive aspect is that there are small dispersions of Δx, Δy and Δz around their mean values.
A third positive note is that the average values of the CPs’ differences on the horizontal axis are similar and noticeably small, about 1.2 cm, in both processing cases (using or not using GCPs). This implies that the horizontal accuracy of orthophotomosaics is approximately the same and particularly good, whether the processing is performed with or without GCPs. Additionally, the horizontal accuracy is similar to the expected, 1 cm, according to the UAS manufacturer, in the case of RGB sensor image processing without using GCPs [10]. Comparing the above result (1.2 cm) with the values in Table 3, it can be seen that the calculated accuracy values of the CPs are inferior to the software accuracy values in the case of processing without GCPs, and better than the software accuracy values in the case of processing with GCPs. This is understandable since, as already mentioned, the software accuracy values paint a general picture of the accuracy of the products.
A fourth positive note is that in the case of RGB sensor image processing using GCPs, the average value of the CPs’ differences in the vertical axis, 4.5 cm, is that which is theoretically expected (about three times lower than the horizontal accuracy) and very small. However, this is not the case in the case of processing without the use of GCPs. The average value of the CP differences is 7.6 cm, which is below the mean value of the processing using GCPs. In general, this can be described as good, but it does not meet the expected value (3 cm) according to the UAS manufacturer for the case of RGB sensor image processing without using GCPs [10]. In general, the above values, 4.5 cm and 7.6 cm, are below the software accuracy values (Table 3). The large errors on the vertical axis can be reduced (up to half) if a small number of GCPs are used simultaneously in the solution, or if a quality sensor pre-calibration is used from the start, or if more than one GNSS base stations are used to calculate the average of the PPK measurement corrections [4,5,10,17,18,21].
There was no corresponding measurement investigation for the MS sensor. The images of the RGB sensor have a spatial resolution of about 1 cm for a flight height of 60 m and therefore it is possible to identify and mark the GCPs with very good accuracy. Therefore, it is fair to compare the products resulting from the processing of the images with and without the use of GCPs. In the case of the MS sensor, the spatial resolution of the images is about 7 cm for a flight height of 100 m. According to the spatial resolution, it is not possible to identify and mark GCPs with high accuracy, and therefore it would not be fair to compare the products obtained from processing the images with and without the use of GCPs.
6.2. Thematic Content
The remark of Figure 17e–h highlights the need to improve the spatial resolution of the MS images of the UAS, which are collected even from a low flight height (e.g., 100 m). In particular, the spatial resolution of MS orthophotomosaics can be improved seven or even eight times in fused images. However, the question of interest when improving the spatial resolution is whether the spectral information of the MS orthophotomosaics is preserved in the fused images.
According to the correlation tables (Table 7, Table 8 and Table 9), the spectral information of the MS orthophotomosaics is transferred to the fused images at a rate of 77% to 91%, with an average of 83% for all correlations of the respective bands for all three archaeological sites. On top of that, the average percentage of the spectral information of the NIR bands transferred from the MS orthophotomosaics to the fused images is 85%. In general, when a percentage below 90% is observed in any correlation of corresponding bands, then the fused image as a whole is not acceptable for classification. On the other hand, the above percentages are objectively not very low and therefore another index should be used that can calculate the spectral difference between the two images. The values of the ERGAS index could be evaluated in combination with the correlation tables to obtain a more reliable conclusion about the classifiability of the fused images.
7. Conclusions
With 20 years of academic research experience in the construction (Remote Control-RC Helicopter in 2004, RC Balloon in 2011 and RC hexacopter in 2017 [85]) and use of UAS in photogrammetry and remote sensing applications, a brief, comprehensive view of UAS shall be presented first. The WingtraOne GEN II is an extremely stable and reliable flight system, easy to use and with easily processed raw data (RGB, MS images and PPK system measurements). It covers large areas in a short flight time and is capable of capturing high resolution RGB and MS images.
Orthophotomosaic generation from the RGB sensor images after processing them without using GCPs, with horizontal accuracy similar to the accuracy of classical image processing using GCPs, was applied. Furthermore, the calculated horizontal accuracy (without using GCPs) is in line with the accuracy reported by the UAS manufacturer [10]. This is particularly important, as it can allow corresponding applications to minimize the time spent in the field, since no GCPs are placed and measured. Considering that in challenging terrain, the positioning and measurement of GCPs is not an easy process, the above positive finding is further strengthened.
The vertical accuracy obtained by processing the RGB sensor images without using GCPs is twice lower than the theoretically (according to the calculated horizontal accuracy) expected accuracy or the accuracy obtained by processing the RGB sensor images using GCPs (i.e., it seems that the classical image processing procedure using GCPs gives a better result). This vertical accuracy does not seem to affect the horizontal accuracy of the orthophotomosaic of the RGB sensor, but only accompanies the generated DSM of the RGB sensor. In corresponding image processing studies without the use of GCPs [4,11,12,13,14,15,16,17,18], similar or larger differences in vertical accuracy were calculated on the one hand, while on the other hand a noticeable improvement in vertical accuracy, at least up to 50%, is observed in the different regions under study (obviously, in these studies more than one region is studied), and thus the very large difference in vertical accuracy calculated in one region can be considered accidental.
The horizontal and vertical accuracies calculated in this study during the processing of the RGB sensor images without the use of GCPs cannot substantiate the actual accuracy that can be achieved, since on the one hand the research was carried out in only one area (the Acropolis of Platanias), and on the other hand a quality sensor pre-calibration was not employed. They are the first in a series of identical observations already planned in the short term at more archaeological sites, which will allow safe conclusions to be drawn. Furthermore, more than one GNSS base station will be used in the new applications to calculate the average of the corrections of the initial PPK measurements, as well as a quality sensor pre-calibration.
For the Ancient Theater of Mieza and the Kasta Mound, the correlation tables (Table 8 and Table 9) show that the spectral information transferred from the MS orthophotomosaics to the corresponding fused images (correlation test of corresponding bands) is slightly below the 90% threshold (specifically, the average for all correlations of corresponding bands for both archaeological sites is 83%). In addition, the ERGAS index values are 0.5 for the Ancient Theater of Mieza and 0.2 for the Kasta Mound, which means that the fused images are of good and high quality, respectively, as the spectral deviations (between fused images and MS orthophotomosaics) are at a moderate and low level. Combining the above, the two fused images can be used for classification.
Concerning the Acropolis of Platanias, the correlation table (Table 7) shows that the spectral information carried is slightly below the 90% threshold (the average for all correlations of corresponding bands is 82%). However, the ERGAS index value of 2.8 (just below the safety threshold) reveals that the fused image is of low quality and therefore cannot be used for classification.
The improvement of the spatial resolution of the MS orthophotomosaics by producing fused images suitable for classification at two of the three archaeological sites shows that image fusion can be achieved by utilizing the images of the two sensors, the Sony RX1R II (RGB sensor) and MicaSense RedEdge-MX (MS sensor). This remains to be confirmed again in the new observations already planned in the short term at other archaeological sites.
Funding
This research received no external funding.
Institutional Review Board Statement
Not applicable.
Informed Consent Statement
Not applicable.
Data Availability Statement
The figures in this paper have a print resolution similar to or inferior to the images, e.g., of Google Maps or Google Earth. No original images or raw data will be made available on the locations, as they concern archaeological sites.
Acknowledgments
I thank Vasiliki Poulioudi, Director of the Ephorate of Antiquities of Drama, Greece, for the permission to collect data at the Acropolis of Platanias. I thank Grigori Tsoka, Director of the Laboratory of Exploration Geophysics, School of Geology, Aristotle University of Thessaloniki, Greece, for the permission to collect data at the Kasta Mound and the Ancient Theater of Mieza.
Conflicts of Interest
The author declares no conflicts of interest.
References
- Sanz-Ablanedo, E.; Chandle, J.H.; Rodríguez-Pérez, J.; Ordóñez, C. Accuracy of unmanned aerial vehicle (UAV) and SfM photogrammetry survey as a function of the number and location of ground control points used. Remote Sens. 2018, 10, 1606. [Google Scholar] [CrossRef]
- Teppati Losè, L.; Chiabrando, F.; Giulio Tonolo, F. Are measured ground control points still required in UAV based large scale mapping? Assessing the positional accuracy of an RTK multi-roto platform. In Proceedings of the International Archives of the Photogrammetry, Remote Sensing and Spatial Information Sciences, 2020 XXIV ISPRS Congress (2020 edition), Nice, France, 31 August–2 September 2020; Volume XLIII-B1-2020, pp. 507–514. [Google Scholar]
- Tamimi, R.; Toth, C. Assessing the Viability of PPK Techniques for Accurate Mapping with UAS. In Proceedings of the International Archives of the Photogrammetry, Remote Sensing and Spatial Information Sciences, Volume XLVIII-1/W1-2023, 12th International Symposium on Mobile Mapping Technology (MMT 2023), Padua, Italy, 24–26 May 2023. [Google Scholar]
- Žabota, B.; Kobal, M. Accuracy Assessment of UAV-Photogrammetric-Derived Products Using PPK and GCPs in Challenging Terrains: In Search of Optimized Rockfall Mapping. Remote Sens. 2021, 13, 3812. [Google Scholar] [CrossRef]
- Martínez-Carricondo, P.; Agüera-Vega, F.; Carvajal-Ramírez, F. Accuracy assessment of RTK/PPK UAV-photogrammetry projects using differential corrections from multiple GNSS fixed base stations. Geocarto Int. 2023, 38, 2197507. [Google Scholar] [CrossRef]
- Gonçalves, J.A.; Henriques, R. UAV photogrammetry for topographic monitoring of coastal areas. ISPRS J. Photogramm. Remote Sens. 2015, 104, 101–111. [Google Scholar] [CrossRef]
- Kosmatin Fras, M.; Kerin, A.; Mesarič, M.; Peterman, V.; Grigillo, D. Assessment of the quality of digital terrain model produced from unmanned aerial system imagery. In Proceedings of the ISPRS—International Archives of the Photogrammetry, Remote Sensing and Spatial Information Sciences, 2016 XXIII ISPRS Congress, Prague, Czech Republic, 12–19 July 2016; Volume XLI-B1, pp. 893–899. [Google Scholar]
- Kaimaris, D. Image Fusion Capability from Different Cameras for UAV in Cultural Heritage Applications. Drones Auton. Veh. 2023, 1, 10002. [Google Scholar] [CrossRef]
- Sai, S.S.; Tjahjadi, M.E.; Rokhmana, C.A. Geometric Accuracy Assessments of Orthophoto Production from UAV Aerial Images. In Proceedings of the 1st International Conference on Geodesy, Geomatics, and Land Administration 2019, KnE Engineering, Semarang, Indonesia, 24–25 July 2019; pp. 333–344. [Google Scholar]
- WingtraOne GEN II Drone, Technical Specifications. Available online: https://wingtra.com/wp-content/uploads/Wingtra-Technical-Specifications.pdf (accessed on 6 December 2023).
- Forlani, G.; Dall’Asta, E.; Diotri, F.; Cella, U.M.; Roncella, R.; Santise, M. Quality Assessment of DSMs Produced from UAV Flights Georeferenced with On-Board RTK Positioning. Remote Sens. 2018, 10, 311. [Google Scholar] [CrossRef]
- Benassi, F.; Dall’Asta, E.; Diotri, F.; Forlani, G.; Morra di Cella, U.; Roncella, R.; Santise, M. Testing Accuracy and Repeatability of UAV Blocks Oriented with GNSS-Supported Aerial Triangulation. Remote Sens. 2017, 9, 172. [Google Scholar] [CrossRef]
- Hugenholtz, C.; Brown, O.; Walker, J.; Barchyn, T.; Nesbit, P.; Kucharczyk, M.; Myshak, S. Spatial Accuracy of UAV-Derived Orthoimagery and Topography: Comparing Photogrammetric Models Processed with Direct Geo-Referencing and Ground Control Points. Geomatica 2016, 70, 21–30. [Google Scholar] [CrossRef]
- Peppa, M.V.; Hall, J.; Goodyear, J.; Mills, J.P. Photogrammetric Assessment and Comparison of DJI Phantom 4 Pro and Phantom 4 RTK Small Unmanned Aircraft Systems. In Proceedings of the International Archives of the Photogrammetry, Remote Sensing and Spatial Information Sciences, 2019, ISPRS Geospatial Week 2019, Enschede, The Netherlands, 10–14 June 2019; Volume XLII-2/W13, pp. 503–509. [Google Scholar]
- Taddia, Y.; Stecchi, F.; Pellegrinelli, A. Coastal Mapping using DJI Phantom 4 RTK in Post-Processing Kinematic Mode. Drones 2020, 4, 9. [Google Scholar] [CrossRef]
- Kršák, B.; Blišt’an, P.; Pauliková, A.; Puškárová, V.; Kovanič, L’.; Palková, J.; Zelizňaková, V. Use of low-cost UAV photogrammetry to analyze the accuracy of a digital elevation model in a case study. Measurement 2016, 91, 276–287. [Google Scholar] [CrossRef]
- Štroner, M.; Urban, R.; Reindl, T.; Seidl, J.; Brouček, J. Evaluation of the Georeferencing Accuracy of a Photogrammetric Model Using a Quadrocopter with Onboard GNSS RTK. Sensors 2020, 20, 2318. [Google Scholar] [CrossRef]
- Dinkov, D. Accuracy assessment of high-resolution terrain data produced from UAV images georeferenced with on-board PPK positioning. J. Bulg. Geogr. Soc. 2023, 48, 43–53. [Google Scholar] [CrossRef]
- Tomaštík, J.; Mokroš, M.; Surový, P.; Grznárová, A.; Merganič, J. UAV RTK/PPK Method-An Optimal Solution for Mapping Inaccessible Forested Areas? Remote Sens. 2019, 11, 721. [Google Scholar] [CrossRef]
- Gerke, M.; Przybilla, H.J. Accuracy Analysis of Photogrammetric UAV Image Blocks: Influence of Onboard RTK-GNSS and Cross Flight Patterns. Photogramm.—Fernerkund.—Geoinf. 2016, 1, 17–30. [Google Scholar] [CrossRef]
- Zhang, H.; Aldana-Jague, E.; Clapuyt, F.; Wilken, F.; Vanacker, V.; Oost, V.K. Evaluating the potential of post-processing kinematic (PPK) georeferencing for UAV-based structurefrom-motion (SfM) photogrammetry and surface change detection. Earth Surf. Dyn. 2019, 7, 807–827. [Google Scholar] [CrossRef]
- Türk, T.; Tunalioglu, N.; Erdogan, B.; Ocalan, T.; Gurturk, M. Accuracy assessment of UAV-post-processing kinematic (PPK) and UAV-traditional (with ground control points) georeferencing methods. Environ. Monit. Assess. 2022, 194, 476. [Google Scholar] [CrossRef]
- Panda, C.B. Remote Sensing. Principles and Applications in Remote Sensing, 1st ed.; Viva Books: New Delhi, India, 1995; pp. 234–267. [Google Scholar]
- Schowengerdt, R.A. Remote Sensing: Models and Methods for Image Processing, 2nd ed.; Academic Press: Orlando, FL, USA, 1997. [Google Scholar]
- Bethune, S.; Muller, F.; Donnay, P.J. Fusion of multi-spectral and panchromatic images by local mean and variance matching filtering techniques. In Proceedings of the Second International Conference en Fusion of Earth Data, Nice, France, 28–30 January 1998; pp. 31–36. [Google Scholar]
- Wald, L. Some terms of reference in data fusion. IEEE Trans. Geosci. Remote 1999, 37, 1190–1193. [Google Scholar] [CrossRef]
- Gonzalez, R.; Woods, R. Digital Image Processing, 2nd ed.; Prentice Hall: Upper Saddle River, NJ, USA, 2002. [Google Scholar]
- Choodarathnakara, L.A.; Kumar, A.T.; Koliwad, S.; Patil, G.C. Assessment of Different Fusion Methods Applied to Remote Sensing Imagery. Int. J. Comput. Sci. Inf. Technol. 2012, 3, 5447–5453. [Google Scholar]
- Fonseca, L.; Namikawa, L.; Castejon, E.; Carvalho, L.; Pinho, C.; Pagamisse, A. Image Fusion and Its Applications, 1st ed.; IntechOpen: Rijeka, Croatia, 2011; pp. 153–178. [Google Scholar]
- Shi, W.; Zhu, C.; Tian, Y.; Nichol, J. Wavelet-based image fusion and quality assessment. Int. J. Appl. Earth Obs. Geoinf. 2005, 6, 241–251. [Google Scholar] [CrossRef]
- Zhang, H.K.; Huang, B. A new look at image fusion methods from a Bayesian perspective. Remote Sens. 2015, 7, 6828–6861. [Google Scholar] [CrossRef]
- Helmy, A.K.; El-Tawel, G.S. An integrated scheme to improve pan-sharpening visual quality of satellite images. Egypt. Inform. J. 2015, 16, 121–131. [Google Scholar] [CrossRef]
- Jelének, J.; Kopačková, V.; Koucká, L.; Mišurec, J. Testing a modified PCA-based sharpening approach for image fusion. Remote Sens. 2016, 8, 794. [Google Scholar] [CrossRef]
- Chavez, P.S.; Sides, S.C.; Anderson, J.A. Comparison of three different methods to merge multiresolution and multispectral data: Landsat TM and SPOT Panchromatic. Photogramm. Eng. Remote Sens. 1991, 57, 295–303. [Google Scholar]
- Fryskowska, A.; Wojtkowska, M.; Delis, P.; Grochala, A. Some Aspects of Satellite Imagery Integration from EROS B and LANDSAT 8. In Proceedings of the International Archives of the Photogrammetry, Remote Sensing and Spatial Information Sciences, Prague, Czech Republic, 12–19 July 2016; pp. 647–652. [Google Scholar]
- Grochala, A.; Kedzierski, M. A Method of Panchromatic Image Modification for Satellite Imagery Data Fusion. Remote Sens. 2017, 9, 639. [Google Scholar] [CrossRef]
- Pohl, C.; Van Genderen, J.L. Multisensor image fusion in remote sensing: Concepts, methods and applications. Int. J. Remote Sens. 1998, 19, 823–854. [Google Scholar] [CrossRef]
- Aiazzi, B.; Baronti, S.; Selva, M. Improving component substitution pansharpening through multivariate regression of MS + Pan data. IEEE Trans. Geosci. Remote Sens. 2007, 45, 3230–3239. [Google Scholar] [CrossRef]
- Erdogan, M.; Maras, H.H.; Yilmaz, A.; Özerbil, T.Ö. Resolution merge of 1:35000 scale aerial photographs with Landsat 7 ETMimagery. In Proceedings of the International Archives of the Photogrammetry, Remote Sensing and Spatial Information Sciences, Part B7, Beijing, China, 3–11 July 2008; Volume XXXVII, pp. 1281–1286. [Google Scholar]
- Stabile, M.; Odeh, I.; McBratney, A. Fusion of high-resolution aerial orthophoto with Landsat TM image for improved object-based land-use classification. In Proceedings of the 30th Asian Conference on Remote Sensing 2009 (ACRS 2009), Beijing, China, 18–23 October 2009; pp. 114–119. [Google Scholar]
- Siok, K.; Jenerowicz, A.; Woroszkiewicz, M. Enhancement of spectral quality of archival aerial photographs using satellite imagery for detection of land cover. J. Appl. Remote Sens. 2017, 11, 036001. [Google Scholar] [CrossRef]
- Kaimaris, D.; Kandylas, A. Small Multispectral UAV Sensor and Its Image Fusion Capability in Cultural Heritage Applications. Heritage 2020, 3, 1046–1062. [Google Scholar] [CrossRef]
- Puliudi, V. Platania 2009–2013. In Proceedings of the 27th Conference on the Archaeological Project in Macedonia and Thrace, Thessaloniki, Greece, 9-10 March 2013; pp. 411–417, ISSN 1106-5311. [Google Scholar]
- Poulakakis, N.; Asimakopoulou, C.; Kalodimidou, I.; Stergiou, N.; Siamidi, K. Ancient Theater of Mieza 2011–2014: Conservation and Restoration Works during NSRF. In Proceedings of the 28th Conference on the Archaeological Project in Macedonia and Thrace, Thessaloniki, Greece, 26-28 March 2014; pp. 137–150, ISSN 1106–5311. [Google Scholar]
- Peristeri, K.; Lefantzis, M. Architectural and Building Features in the Development of the Monumental Burial Complex of the Kastas Tumulus in Amphipolis. In Proceedings of the 28th Conference on the Archaeological Project in Macedonia and Thrace, Thessaloniki, Greece, 26–28 March 2014; pp. 493–498, ISSN 1106–5311. [Google Scholar]
- RedEdge-MX Integration Guide. Available online: https://support.micasense.com/hc/en-us/articles/360011389334-RedEdge-MX-Integration-Guide (accessed on 6 December 2023).
- Franzini, M.; Ronchetti, G.; Sona, G.; Casella, V. Geometric and radiometric consistency of parrot sequoia multispectral imagery for precision agriculture applications. Appl. Sci. 2019, 9, 5314. [Google Scholar] [CrossRef]
- Ahmed, O.S.; Shemrock, A.; Chabot, D.; Dillon, C.; Williams, G.; Wasson, R.; Franklin, S.E. Hierar-chicalland cover and vegetation classification using multispectral data acquired from an unmanned aerial vehicle. Remote Sens. 2017, 38, 2037–2052. [Google Scholar] [CrossRef]
- Miyoshi, G.T.; Imai, N.N.; Tommaselli, A.M.G.; Honkavaara, E.; Näsi, R.; Moriya, E.A.S. Radio-metric block adjustment of hyperspectral image blocks in the Brazilian environment. Int. J. Remote Sens. 2018, 39, 4910–4930. [Google Scholar] [CrossRef]
- Guo, Y.; Senthilnath, J.; Wu, W.; Zhang, X.; Zeng, Z.; Huang, H. Radiometric calibration for multispectral camera of different imaging conditions mounted on a UAS platform. Sustainability 2019, 11, 978. [Google Scholar] [CrossRef]
- Mafanya, M.; Tsele, P.; Botai, J.O.; Manyama, P.; Chirima, G.J.; Monate, T. Radiometric calibration framework for ultra-highresolution UAS-derived orthomosaics for large-scale mapping of invasive alien plants in semi-arid woodlands: Harrisia pomanensis as a case study. Remote Sens. 2018, 39, 5119–5140. [Google Scholar] [CrossRef]
- Johansen, K.; Raharjo, T. Multi-temporal assessment of lychee tree crop structure using multi-spectral RPAS imagery. In Proceedings of the International Archives of the Photogrammetry, Remote Sensing and Spatial Information Sciences, 2017, International Conference on Unmanned Aerial Vehicles in Geomatics, Bonn, Germany, 4–7 September 2017; Volume XLII-2/W6. [Google Scholar]
- Honkavaara, E.; Khoramshahi, E. Radiometric correction of close-range spectral image blocks captured using an unmanned aerial vehicle with a radiometric block adjustment. Remote Sens. 2018, 10, 256. [Google Scholar] [CrossRef]
- Assmann, J.J.; Kerby, T.J.; Cunliffe, M.A.; Myers-Smith, H.I. Vegetation monitoring using multispectral sensors best practices and lessons learned from high latitudes. J. Unmanned Veh. Syst. 2019, 7, 54–75. [Google Scholar] [CrossRef]
- Agisoft Metashape User Manual, Professional Edition, Version 2.0. Available online: https://www.agisoft.com/pdf/metashape-pro_2_0_en.pdf (accessed on 6 December 2023).
- Forlani, G.; Diotri, F.; Cella, U.M.; Roncella, R. Indirect UAV Strip Georeferencing by On-Board GNSS Data under Poor Satellite Coverage. Remote Sens. 2019, 11, 1765. [Google Scholar] [CrossRef]
- González-Audícana, M.; Saleta, J.L.; Catalán, G.R.; García, R. Fusion of multispectral and panchromatic images using improved IHS and PCA mergers based on wavelet decomposition. IEEE Trans. Geosci. Remote Sens. 2004, 42, 1291–1299. [Google Scholar] [CrossRef]
- Choi, J.; Yu, K.; Kim, Y. A new adaptive component-substitution-based satellite image fusion by using partial replacement. IEEE Trans. Geosci. Remote Sens. 2011, 49, 295–309. [Google Scholar] [CrossRef]
- Kumar, T.; Verma, K. A theory based on conversion of RGB image to Gray image. Int. J. Comput. Appl. 2010, 7, 7–10. [Google Scholar] [CrossRef]
- Kaler, P. Study of grayscale image in image processing. Int. J. Recent Innov. Trends Comput. Commun. 2016, 4, 309–311. [Google Scholar]
- Azzeh, A.L.J.; Alhatamleh, H.; Alqadi, A.Z.; Abuzalata, K.M. Creating a color map to be used to convert a gray image to color image. Int. J. Comput. Appl. 2016, 153, 31–34. [Google Scholar]
- Queiroz, L.R.; Braun, M.K. Color to gray and back: Color embedding into textured gray images. IEEE Trans. Image Process. 2006, 15, 1464–1470. [Google Scholar] [CrossRef] [PubMed]
- Wald, L.; Ranchin, T.M.; Mangolini, M. Fusion of satellite images of different spatial resolutions-Assessing the quality of resulting images. Photogramm. Eng. Remote Sens. 1997, 63, 691–699. [Google Scholar]
- Ranchin, T.; Aiazzi, B.; Alparone, L.; Baronti, S.; Wald, L. Image fusion—The ARSIS concept and some successful implementation schemes. ISPRS J. Photogramm. Remote Sens. 2003, 58, 4–18. [Google Scholar] [CrossRef]
- Otazu, X.; González-Audícana, M.; Fors, O.; Núñez, J. Introduction of sensor spectral response into image fusion methods-application to wavelet-based methods. IEEE Trans. Geosci. Remote Sens. 2005, 43, 2376–2385. [Google Scholar] [CrossRef]
- Liu, J.G. Smoothing filter-based intensity modulation: A spectral preserve image fusion technique for improving spatial details. Int. J. Remote Sens. 2000, 21, 3461–3472. [Google Scholar] [CrossRef]
- Wang, Z.; Ziou, D.; Armenakis, C. A comparative analysis of image fusion methods. IEEE Trans. Geosci. Remote Sens. 2005, 43, 1391–1402. [Google Scholar] [CrossRef]
- Helmy, A.K.; Nasr, H.A.; El-Taweel, S.G. Assessment and evaluation of di_erent data fusion techniques. Int. J. Comput. 2010, 4, 107–115. [Google Scholar]
- Susheela, D.; Pradeep, K.G.; Mahesh, K.J. A comparative study of various pixel based image fusion techniques as applied to an urban environment. Int. J. Image Data Fusion 2013, 4, 197–213. [Google Scholar]
- Jong-Song, J.; Jong-Hun, C. Application effect analysis of image fusion methods for extraction of shoreline in coastal zone using Landsat ETM+. Int. J. Atmos. Ocean. Sci. 2017, 1, 1–6. [Google Scholar]
- Gao, F.; Li, B.; Xu, Q.; Zhong, C. Moving vehicle information extraction from single-pass worldview-2 imagery based on ERGAS-SNS analysis. Remote Sens. 2014, 6, 6500–6523. [Google Scholar] [CrossRef]
- Renza, D.; Martinez, E.; Arquero, A. A New Approach to Change Detection in Multispectral Images by Means of ERGAS Index. IEEE Geosci. Remote Sens. Lett. 2013, 10, 76–80. [Google Scholar] [CrossRef]
- Palubinskas, G. Joint Quality Measure for Evaluation of Pansharpening Accuracy. Remote Sens. 2015, 7, 9292–9310. [Google Scholar] [CrossRef]
- Panchal, S.; Thakker, R. Implementation and comparative quantitative assessment of different multispectral image pansharpening approaches. Signal Image Process. Int. J. 2015, 6, 35–48. [Google Scholar] [CrossRef]
- Dou, W. Image Degradation for Quality Assessment of Pan-Sharpening Methods. Remote Sens. 2018, 10, 154. [Google Scholar] [CrossRef]
- Lerk-U-Suke, S.; Ongsomwang, S. Quantitative evaluation for theos pan-sharpening methods. In Proceedings of the 33rd Asian Conference on Remote Sensing, Pattaya, Thailand, 26–30 November 2012. [Google Scholar]
- Chen, Y.; Zhang, G. A Pan-Sharpening Method Based on Evolutionary Optimization and IHS Transformation. Math. Probl. Eng. 2017, 2017, 1–8. [Google Scholar] [CrossRef]
- Liu, H.; Deng, L.; Dou, Y.; Zhong, X.; Qian, Y. Pansharpening Model of Transferable Remote Sensing Images Based on Feature Fusion and Attention Modules. Sensors 2023, 23, 3275. [Google Scholar] [CrossRef]
- Li, X.; Chen, H.; Zhou, J.; Wang, Y. Improving Component Substitution Pan-Sharpening Through Refinement of the Injection Detail. Photogramm. Eng. Remote Sens. 2020, 86, 317–325. [Google Scholar] [CrossRef]
- Lin, H.; Zhang, A. Fusion of hyperspectral and panchromatic images using improved HySure method. In Proceedings of the 2nd International Conference on Image, Vision and Computing (ICIVC), Chengdu, China, 2–4 June 2017. [Google Scholar]
- Fletcher, R. Comparing Pan-Sharpening Algorithms to Access an Agriculture Area: A Mississippi Case Study. Agric. Sci. 2023, 14, 1206–1221. [Google Scholar] [CrossRef]
- Wald, L. Quality of high resolution synthesised images: Is there a simple criterion? In Proceedings of the Third Conference Fusion of Earth Data: Merging Point Measurements, Raster Maps and Remotely Sensed Images, Sophia Antipolis, France, 26–28 January 2000; Thierry, R., Lucien, W., Eds.; SEE/URISCA: Nice, France, 2009; pp. 99–103. [Google Scholar]
- Alparone, L.; Wald, L.; Chanussot, J.; Thomas, C.; Gamba, P.; Bruce, M.L. Comparison of Pansharpening Algorithms: Outcome of the 2006 GRS-S Data-Fusion Contest. IEEE Trans. Geosci. Remote Sens. 2007, 45, 3012–3021. [Google Scholar] [CrossRef]
- Witharana, C.; Nishshanka, U.S.; Gunatilaka, J. Remote Sensing of Ecological Hotspots: Producing Value-added Information from Multiple Data Sources. J. Geogr. Nat. Disasters 2013, 3, 108. [Google Scholar]
- Kaimaris, D. Ancient theaters in Greece and the contribution of geoinformatics to their macroscopic constructional features. Sci. Cult. 2018, 4, 9–25. [Google Scholar]
Disclaimer/Publisher’s Note: The statements, opinions and data contained in all publications are solely those of the individual author(s) and contributor(s) and not of MDPI and/or the editor(s). MDPI and/or the editor(s) disclaim responsibility for any injury to people or property resulting from any ideas, methods, instructions or products referred to in the content. |
© 2024 by the author. Licensee MDPI, Basel, Switzerland. This article is an open access article distributed under the terms and conditions of the Creative Commons Attribution (CC BY) license (https://creativecommons.org/licenses/by/4.0/).


