
Automatic Segmentation of Mediastinal Lymph Nodes and Blood Vessels in Endobronchial Ultrasound (EBUS) Images Using Deep Learning

 ,
,
Abstract
:1. Introduction
2. Related Work
3. Materials and Methods
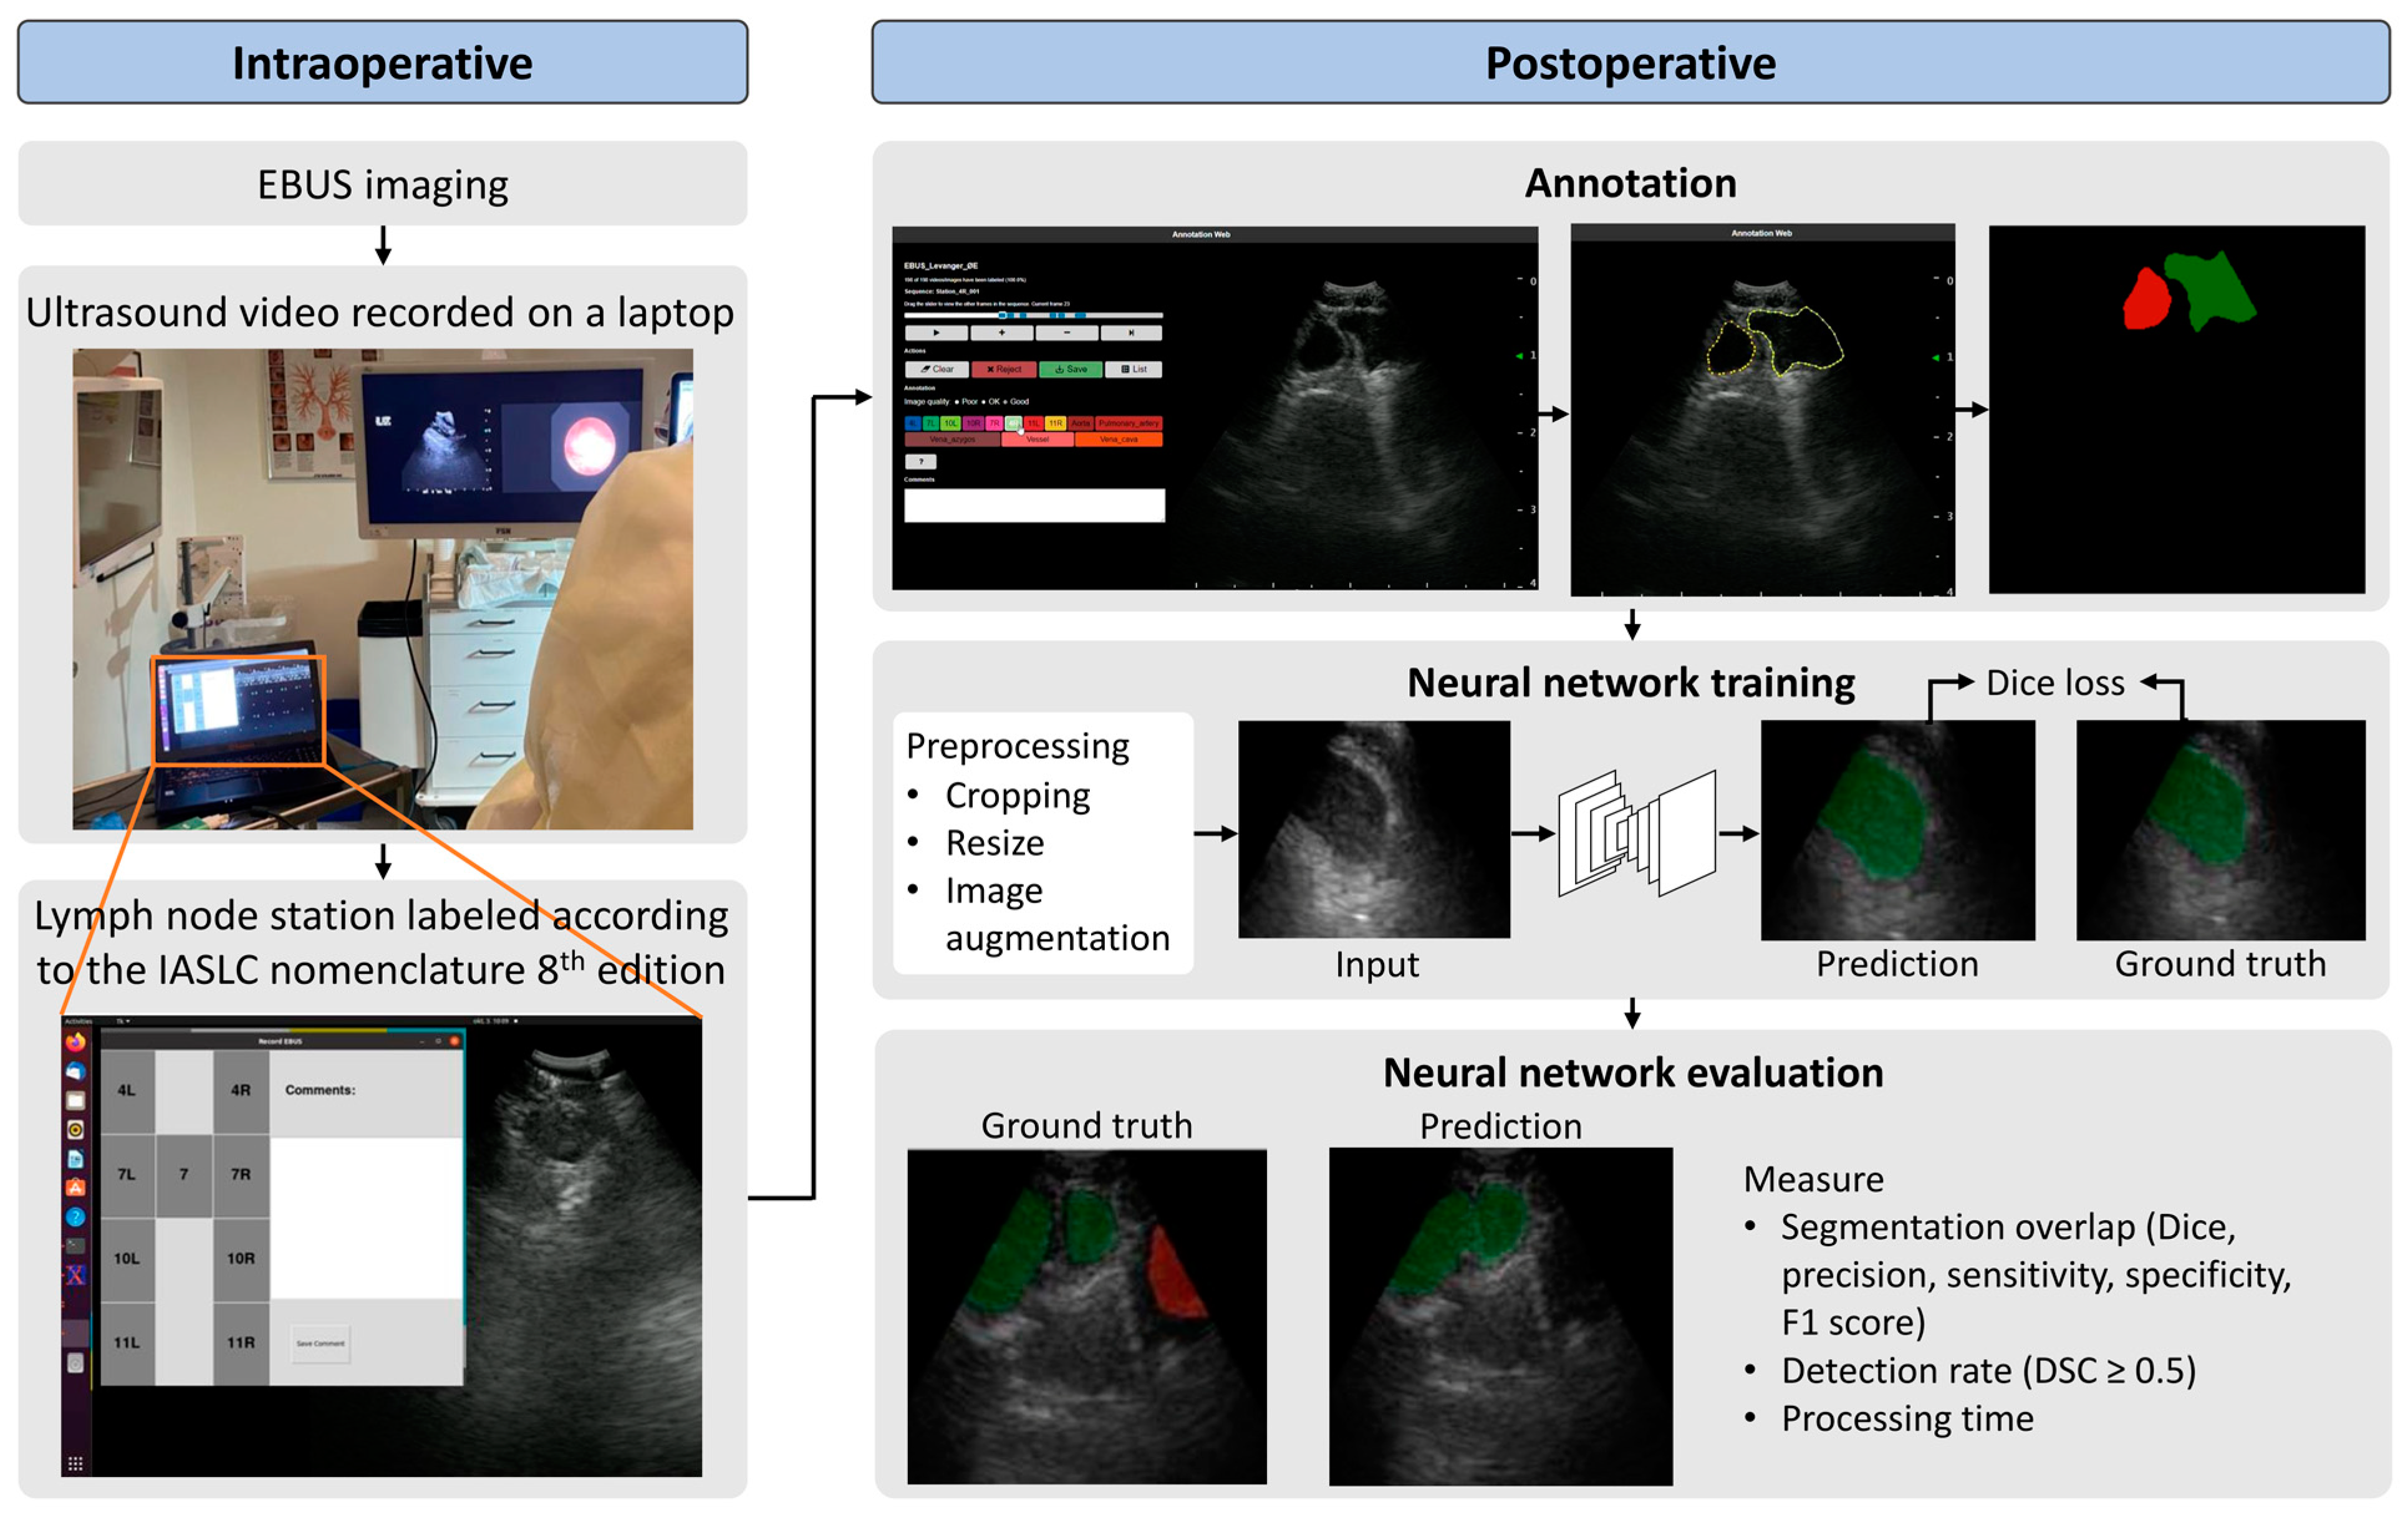
3.1. Study Population and EBUS Procedure
3.2. Preoperative
3.3. Intraoperative
3.4. Postoperative
3.5. Neural Network Architecture, Model Training, and Evaluation
3.5.1. Training Scheme and Architecture
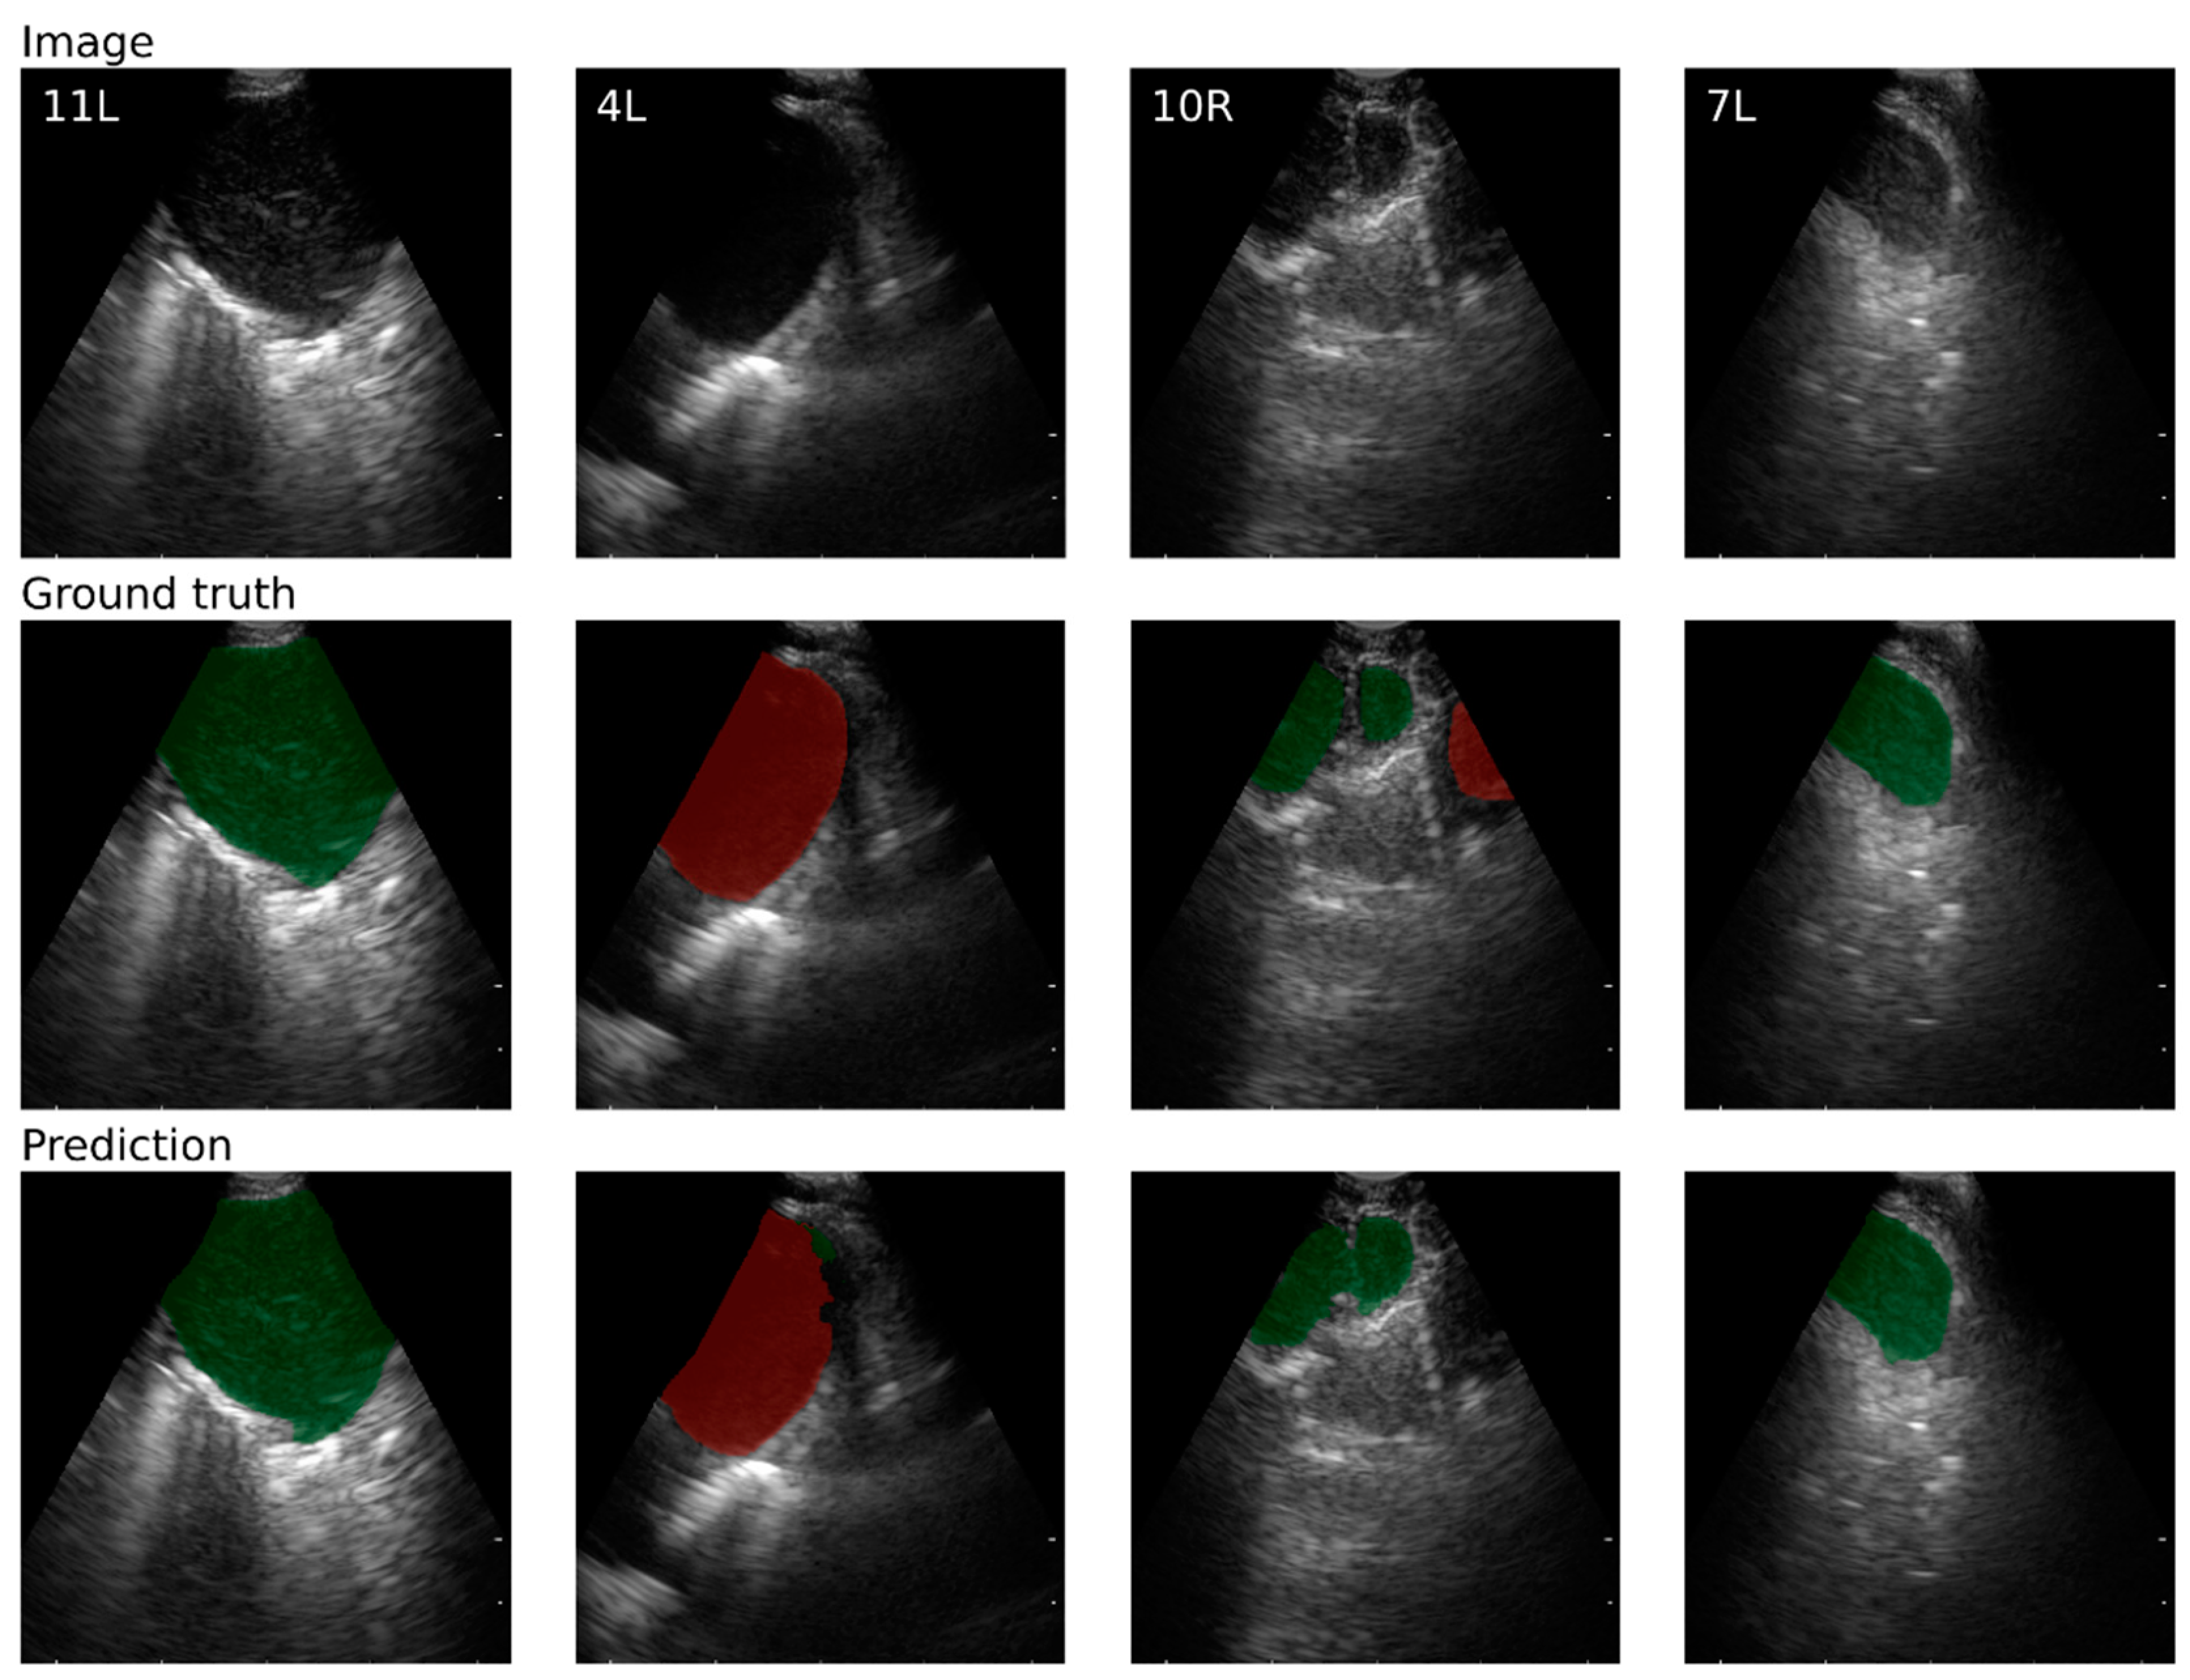
3.5.2. Model Evaluation
4. Results
5. Discussion
6. Conclusions
Author Contributions
Funding
Institutional Review Board Statement
Informed Consent Statement
Data Availability Statement
Acknowledgments
Conflicts of Interest
References
- Sung, H.; Ferlay, J.; Siegel, R.L.; Laversanne, M.; Soerjomataram, I.; Jemal, A.; Bray, F.; Bsc, M.F.B.; Me, J.F.; Soerjomataram, M.I.; et al. Global Cancer Statistics 2020: GLOBOCAN Estimates of Incidence and Mortality Worldwide for 36 Cancers in 185 Countries. CA Cancer J. Clin. 2021, 71, 209–249. [Google Scholar] [CrossRef] [PubMed]
- Rivera, M.P.; Mehta, A.C. Initial diagnosis of lung cancer: ACCP evidence-based clinical practice guidelines (2nd edition). Chest 2007, 132 (Suppl. S3), S131–S148. [Google Scholar] [CrossRef] [PubMed]
- Detterbeck, F.C.; Boffa, D.J.; Kim, A.W.; Tanoue, L.T. The Eighth Edition Lung Cancer Stage Classification. Chest 2017, 151, 193–203. [Google Scholar] [CrossRef] [PubMed]
- Postmus, P.E.; Kerr, K.M.; Oudkerk, M.; Senan, S.; Waller, D.A.; Vansteenkiste, J.; Escriu, C.; Peters, S. Early and locally advanced non-small-cell lung cancer (NSCLC): ESMO Clinical Practice Guidelines for diagnosis, treatment and follow-up. Ann. Oncol. 2017, 28 (Suppl. S4), iv1–iv21. [Google Scholar] [CrossRef] [PubMed]
- Vilmann, P.; Clementsen, P.F.; Colella, S.; Siemsen, M.; De Leyn, P.; Dumonceau, J.M.; Herth, F.J.; Larghi, A.; Vazquez-Sequeiros, E.; Hassan, C.; et al. Combined endobronchial and esophageal endosonography for the diagnosis and staging of lung cancer: European Society of Gastrointestinal Endoscopy (ESGE) Guideline, in cooperation with the European Respiratory Society (ERS) and the European Society of Thoracic Surgeons (ESTS). Endoscopy 2015, 47, 545–559. [Google Scholar] [PubMed]
- Tournoy, K.G.; Maddens, S.; Gosselin, R.; Van Maele, G.; van Meerbeeck, J.P.; Kelles, A. Integrated FDG-PET/CT does not make invasive staging of the intrathoracic lymph nodes in non-small cell lung cancer redundant: A prospective study. Thorax 2007, 62, 696–701. [Google Scholar] [CrossRef]
- De Wever, W.; Stroobants, S.; Coolen, J.; Verschakelen, J.A. Integrated PET/CT in the staging of nonsmall cell lung cancer: Technical aspects and clinical integration. Eur. Respir. J. 2009, 33, 201–212. [Google Scholar] [CrossRef]
- Fernández-Villar, A.; Leiro-Fernández, V.; Botana-Rial, M.; Represas-Represas, C.; Núñez-Delgado, M. The endobronchial ultrasound-guided transbronchial needle biopsy learning curve for mediastinal and hilar lymph node diagnosis. Chest 2012, 141, 278–279. [Google Scholar] [CrossRef]
- Davoudi, M.; Colt, H.G.; Osann, K.E.; Lamb, C.R.; Mullon, J.J. Endobronchial ultrasound skills and tasks assessment tool: Assessing the validity evidence for a test of endobronchial ultrasound-guided transbronchial needle aspiration operator skill. Am. J. Respir. Crit. Care Med. 2012, 186, 773–779. [Google Scholar] [CrossRef]
- Folch, E.; Majid, A. Point: Are >50 supervised procedures required to develop competency in performing endobronchial ultrasound-guided transbronchial needle aspiration for mediastinal staging? Yes. Chest 2013, 143, 888–891. [Google Scholar] [CrossRef]
- Ost, D.E.; Ernst, A.; Lei, X.; Feller-Kopman, D.; Eapen, G.A.; Kovitz, K.L.; Herth, F.J.F.; Simoff, M. Diagnostic yield of endobronchial ultrasound-guided transbronchial needle aspiration: Results of the AQuIRE Bronchoscopy Registry. Chest 2011, 140, 1557–1566. [Google Scholar] [CrossRef]
- Wahidi, M.M.; Hulett, C.; Pastis, N.; Shepherd, R.W.; Shofer, S.L.; Mahmood, K.; Lee, H.; Malhotra, R.; Moser, B.; Silvestri, G.A. Learning experience of linear endobronchial ultrasound among pulmonary trainees. Chest 2014, 145, 574–578. [Google Scholar] [CrossRef] [PubMed]
- Kalata, S.; Mollberg, N.M.; He, C.; Clark, M.; Theurer, P.; Chang, A.C.; Welsh, R.J.; Lagisetty, K.H. The Role of Lung Cancer Surgical Technique on Lymph Node Sampling and Pathologic Nodal Upstaging. Ann. Thorac. Surg. 2022, 115, 1238–1245. [Google Scholar] [CrossRef]
- Merritt, R.E.; Hoang, C.D.; Shrager, J.B. Lymph node evaluation achieved by open lobectomy compared with thoracoscopic lobectomy for N0 lung cancer. Ann. Thorac. Surg. 2013, 96, 1171–1177. [Google Scholar] [CrossRef] [PubMed]
- Norwegian Lung Cancer Registry, Årsrapport 2022 Med Resultater og Forbedringstiltak fra Nasjonalt Kvalitetsregister for Lungekreft; Kreftregisteret: Oslo, Norway, 2023.
- Ernst, A.; Herth, F.J. Endobronchial Ultrasound: An Atlas and Practical Guide; Springer Science & Business Media: Berlin/Heidelberg, Germany, 2009. [Google Scholar]
- Nakajima, T.; Anayama, T.; Shingyoji, M.; Kimura, H.; Yoshino, I.; Yasufuku, K. Vascular image patterns of lymph nodes for the prediction of metastatic disease during EBUS-TBNA for mediastinal staging of lung cancer. J. Thorac. Oncol. 2012, 7, 1009–1014. [Google Scholar] [CrossRef]
- Biondini, D.; Tinè, M.; Semenzato, U.; Daverio, M.; Scalvenzi, F.; Bazzan, E.; Turato, G.; Damin, M.; Spagnolo, P. Clinical Applications of Endobronchial Ultrasound (EBUS) Scope: Challenges and Opportunities. Diagnostics 2023, 13, 2565. [Google Scholar] [CrossRef]
- Li, J.; Zhi, X.; Chen, J.; Wang, L.; Xu, M.; Dai, W.; Sun, J.; Xiong, H. Deep learning with convex probe endobronchial ultrasound multimodal imaging: A validated tool for automated intrathoracic lymph nodes diagnosis. Endosc. Ultrasound 2021, 10, 361–371. [Google Scholar] [PubMed]
- Ozcelik, N.; Ozcelik, A.E.; Bulbul, Y.; Oztuna, F.; Ozlu, T. Can artificial intelligence distinguish between malignant and benign mediastinal lymph nodes using sonographic features on EBUS images? Curr. Med. Res. Opin. 2020, 36, 2019–2024. [Google Scholar] [CrossRef]
- Reynisson, P.J.; Leira, H.O.; Hernes, T.N.; Hofstad, E.F.; Scali, M.; Sorger, H.; Amundsen, T.; Lindseth, F.; Langø, T. Navigated bronchoscopy: A technical review. J. Bronchol. Interv. Pulmonol. 2014, 21, 242–264. [Google Scholar] [CrossRef]
- Criner, G.J.; Eberhardt, R.; Fernandez-Bussy, S.; Gompelmann, D.; Maldonado, F.; Patel, N.; Shah, P.L.; Slebos, D.J.; Valipour, A.; Wahidi, M.M.; et al. Interventional Bronchoscopy. Am. J. Respir. Crit. Care Med. 2020, 202, 29–50. [Google Scholar] [CrossRef]
- Eberhardt, R.; Kahn, N.; Gompelmann, D.; Schumann, M.; Heussel, C.P.; Herth, F.J. LungPoint—A new approach to peripheral lesions. J. Thorac. Oncol. 2010, 5, 1559–1563. [Google Scholar] [CrossRef]
- Sorger, H.; Hofstad, E.F.; Amundsen, T.; Langø, T.; Leira, H.O. A novel platform for electromagnetic navigated ultrasound bronchoscopy (EBUS). Int. J. Comput. Assist. Radiol. Surg. 2016, 11, 1431–1443. [Google Scholar] [CrossRef] [PubMed]
- Sorger, H.; Hofstad, E.F.; Amundsen, T.; Langø, T.; Bakeng, J.B.; Leira, H.O. A multimodal image guiding system for Navigated Ultrasound Bronchoscopy (EBUS): A human feasibility study. PLoS ONE 2017, 12, e0171841. [Google Scholar] [CrossRef] [PubMed]
- Goldstraw, P.; Chansky, K.; Crowley, J.; Rami-Porta, R.; Asamura, H.; Eberhardt, W.E.; Nicholson, A.G.; Groome, P.; Mitchell, A.; Bolejack, V. The IASLC Lung Cancer Staging Project: Proposals for Revision of the TNM Stage Groupings in the Forthcoming (Eighth) Edition of the TNM Classification for Lung Cancer. J. Thorac. Oncol. 2016, 11, 39–51. [Google Scholar] [CrossRef]
- Mountain, C.F.; Dresler, C.M. Regional lymph node classification for lung cancer staging. Chest 1997, 111, 1718–1723. [Google Scholar] [CrossRef]
- Zang, X.; Bascom, R.; Gilbert, C.; Toth, J.; Higgins, W. Methods for 2-D and 3-D Endobronchial Ultrasound Image Segmentation. IEEE Trans. Biomed. Eng. 2016, 63, 1426–1439. [Google Scholar] [CrossRef]
- Zang, X.; Gibbs, J.D.; Cheirsilp, R.; Byrnes, P.D.; Toth, J.; Bascom, R.; Higgins, W.E. Optimal route planning for image-guided EBUS bronchoscopy. Comput. Biol. Med. 2019, 112, 103361. [Google Scholar] [CrossRef]
- Zang, X.; Cheirsilp, R.; Byrnes, P.D.; Kuhlengel, T.K.; Abendroth, C.; Allen, T.; Mahraj, R.; Toth, J.; Bascom, R.; Higgins, W.E. Image-guided EBUS bronchoscopy system for lung-cancer staging. Inform. Med. Unlocked 2021, 25, 100665. [Google Scholar] [CrossRef] [PubMed]
- Zang, X.; Zhao, W.; Toth, J.; Bascom, R.; Higgins, W. Multimodal Registration for Image-Guided EBUS Bronchoscopy. J. Imaging 2022, 8, 189. [Google Scholar] [CrossRef]
- Smistad, E.; Østvik, A.; Haugen, B.O.; Lvstakken, L. 2D left ventricle segmentation using deep learning. In Proceedings of the 2017 IEEE International Ultrasonics Symposium (IUS), Washington, DC, USA, 6–9 September 2017. [Google Scholar]
- Leclerc, S.; Smistad, E.; Pedrosa, J.; Østvik, A.; Cervenansky, F.; Espinosa, F.; Espeland, T.; Berg, E.A.R.; Jodoin, P.M.; Grenier, T.; et al. Deep Learning for Segmentation Using an Open Large-Scale Dataset in 2D Echocardiography. IEEE Trans. Med. Imaging 2019, 38, 2198–2210. [Google Scholar] [CrossRef]
- Teng, Y.; Ai, Y.; Liang, T.; Yu, B.; Jin, J.; Xie, C.; Jin, X. The Effects of Automatic Segmentations on Preoperative Lymph Node Status Prediction Models with Ultrasound Radiomics for Patients with Early Stage Cervical Cancer. Technol. Cancer Res. Treat. 2022, 21, 15330338221099396. [Google Scholar] [CrossRef] [PubMed]
- Jin, J.; Zhu, H.; Zhang, J.; Ai, Y.; Zhang, J.; Teng, Y.; Xie, C.; Jin, X. Multiple U-Net-Based Automatic Segmentations and Radiomics Feature Stability on Ultrasound Images for Patients with Ovarian Cancer. Front. Oncol. 2020, 10, 614201. [Google Scholar] [CrossRef] [PubMed]
- Yong, S.H.; Lee, S.H.; Oh, S.I.; Keum, J.S.; Kim, K.N.; Park, M.S.; Chang, Y.S.; Kim, E.Y. Malignant thoracic lymph node classification with deep convolutional neural networks on real-time endobronchial ultrasound (EBUS) images. Transl. Lung Cancer Res. 2022, 11, 14–23. [Google Scholar] [CrossRef]
- Lin, C.K.; Wu, S.H.; Chang, J.; Cheng, Y.C. The interpretation of endobronchial ultrasound image using 3D convolutional neural network for differentiating malignant and benign mediastinal lesions. arXiv 2021, arXiv:2107.13820. [Google Scholar]
- Ito, Y.; Nakajima, T.; Inage, T.; Otsuka, T.; Sata, Y.; Tanaka, K.; Sakairi, Y.; Suzuki, H.; Yoshino, I. Prediction of Nodal Metastasis in Lung Cancer Using Deep Learning of Endobronchial Ultrasound Images. Cancers 2022, 14, 3334. [Google Scholar] [CrossRef] [PubMed]
- Churchill, I.F.; Gatti, A.A.; Hylton, D.A.; Sullivan, K.A.; Patel, Y.S.; Leontiadis, G.I.; Farrokhyar, F.; Hanna, W.C. An Artificial Intelligence Algorithm to Predict Nodal Metastasis in Lung Cancer. Ann. Thorac. Surg. 2022, 114, 248–256. [Google Scholar] [CrossRef] [PubMed]
- Naur, T.M.H.; Konge, L.; Nayahangan, L.J.; Clementsen, P.F. Training and certification in endobronchial ultrasound-guided transbronchial needle aspiration. J. Thorac. Dis. 2017, 9, 2118–2123. [Google Scholar] [CrossRef] [PubMed]
- Smistad, E.; Østvik, A.; Løvstakken, L. Annotation Web—An open-source web-based annotation tool for ultrasound images. In Proceedings of the 2021 IEEE International Ultrasonics Symposium (IUS), Xi’an, China, 11–16 September 2021. [Google Scholar]
- Michael, A.U. Splines: A perfect fit for medical imaging. In Medical Imaging 2002: Image Processing; SPIE: Bellingham, WA, USA, 2002. [Google Scholar]
- Ronneberger, O.; Fischer, P.; Brox, T. U-Net: Convolutional Networks for Biomedical Image Segmentation. In Medical Image Computing and Computer-Assisted Intervention—MICCAI 2015; Springer International Publishing: Cham, Switzerland, 2015. [Google Scholar]
- Smistad, E.; Østvik, A.; Pedersen, A. High Performance Neural Network Inference, Streaming, and Visualization of Medical Images Using FAST. IEEE Access 2019, 7, 136310–136321. [Google Scholar] [CrossRef]
- Grogan, S.P.; Mount, C.A. Ultrasound Physics and Instrumentation. In StatPearls; StatPearls Publishing LLC.: Treasure Island, FL, USA, 2024. [Google Scholar]
- Koseoglu, F.D.; Alıcı, I.O.; Er, O. Machine learning approaches in the interpretation of endobronchial ultrasound images: A comparative analysis. Surg. Endosc. 2023, 37, 9339–9346. [Google Scholar] [CrossRef]

| Metric | Formula | Description |
|---|---|---|
| Dice similarity coefficient (DSC) | Measures’ overlap between the ground truth (GT) and predicted (P) segmentations. | |
| Precision | The ratio of the number of pixels correctly predicted to belong to the class (TP: true-positive prediction) to the total number of pixels predicted to belong to the class (TP + FP: false-positive prediction). | |
| Sensitivity (recall) | The ratio of the number of pixels correctly predicted to belong to the class (TP) to the true number of pixels belonging to the class (TP + FN: false-negative prediction). | |
| Specificity | The ratio of the number of pixels correctly predicted not to belong to the class (TN: true-negative predictions) to the number of pixels that do not belong to the class (TN + FP). | |
| F1 | The harmonic mean of precision and sensitivity. | |
| Detection | For images with a single lymph node or blood vessel, the lymph node or blood vessel was counted as detected if DSC > 0.5. |
| 4L | 4R | 7L | 7R | 7 | 10L | 10R | 11L | 11R | Sum | |
|---|---|---|---|---|---|---|---|---|---|---|
| Variable | n (%) | n (%) | ||||||||
| Training | 149 (16.9) | 150 (17.0) | 129 (14.6) | 142 (16.1) | 4 (0.5) | 18 (2.0) | 109 (12.4) | 78 (8.8) | 103 (11.7) | 882 (100) |
| Validation | 31 (21.4) | 30 (20.7) | 18 (12.4) | 13 (9.0) | (0.0) | (0.0) | 14 (9.7) | 18 (12.4) | 21 (14.5) | 145 (100) |
| Testing | 29 (21.6) | 21 (15.7) | 26 (19.4) | 19 (14.2) | (0.0) | (0.0) | 8 (6.0) | 14 (10.4) | 17 (12.7) | 134 (100) |
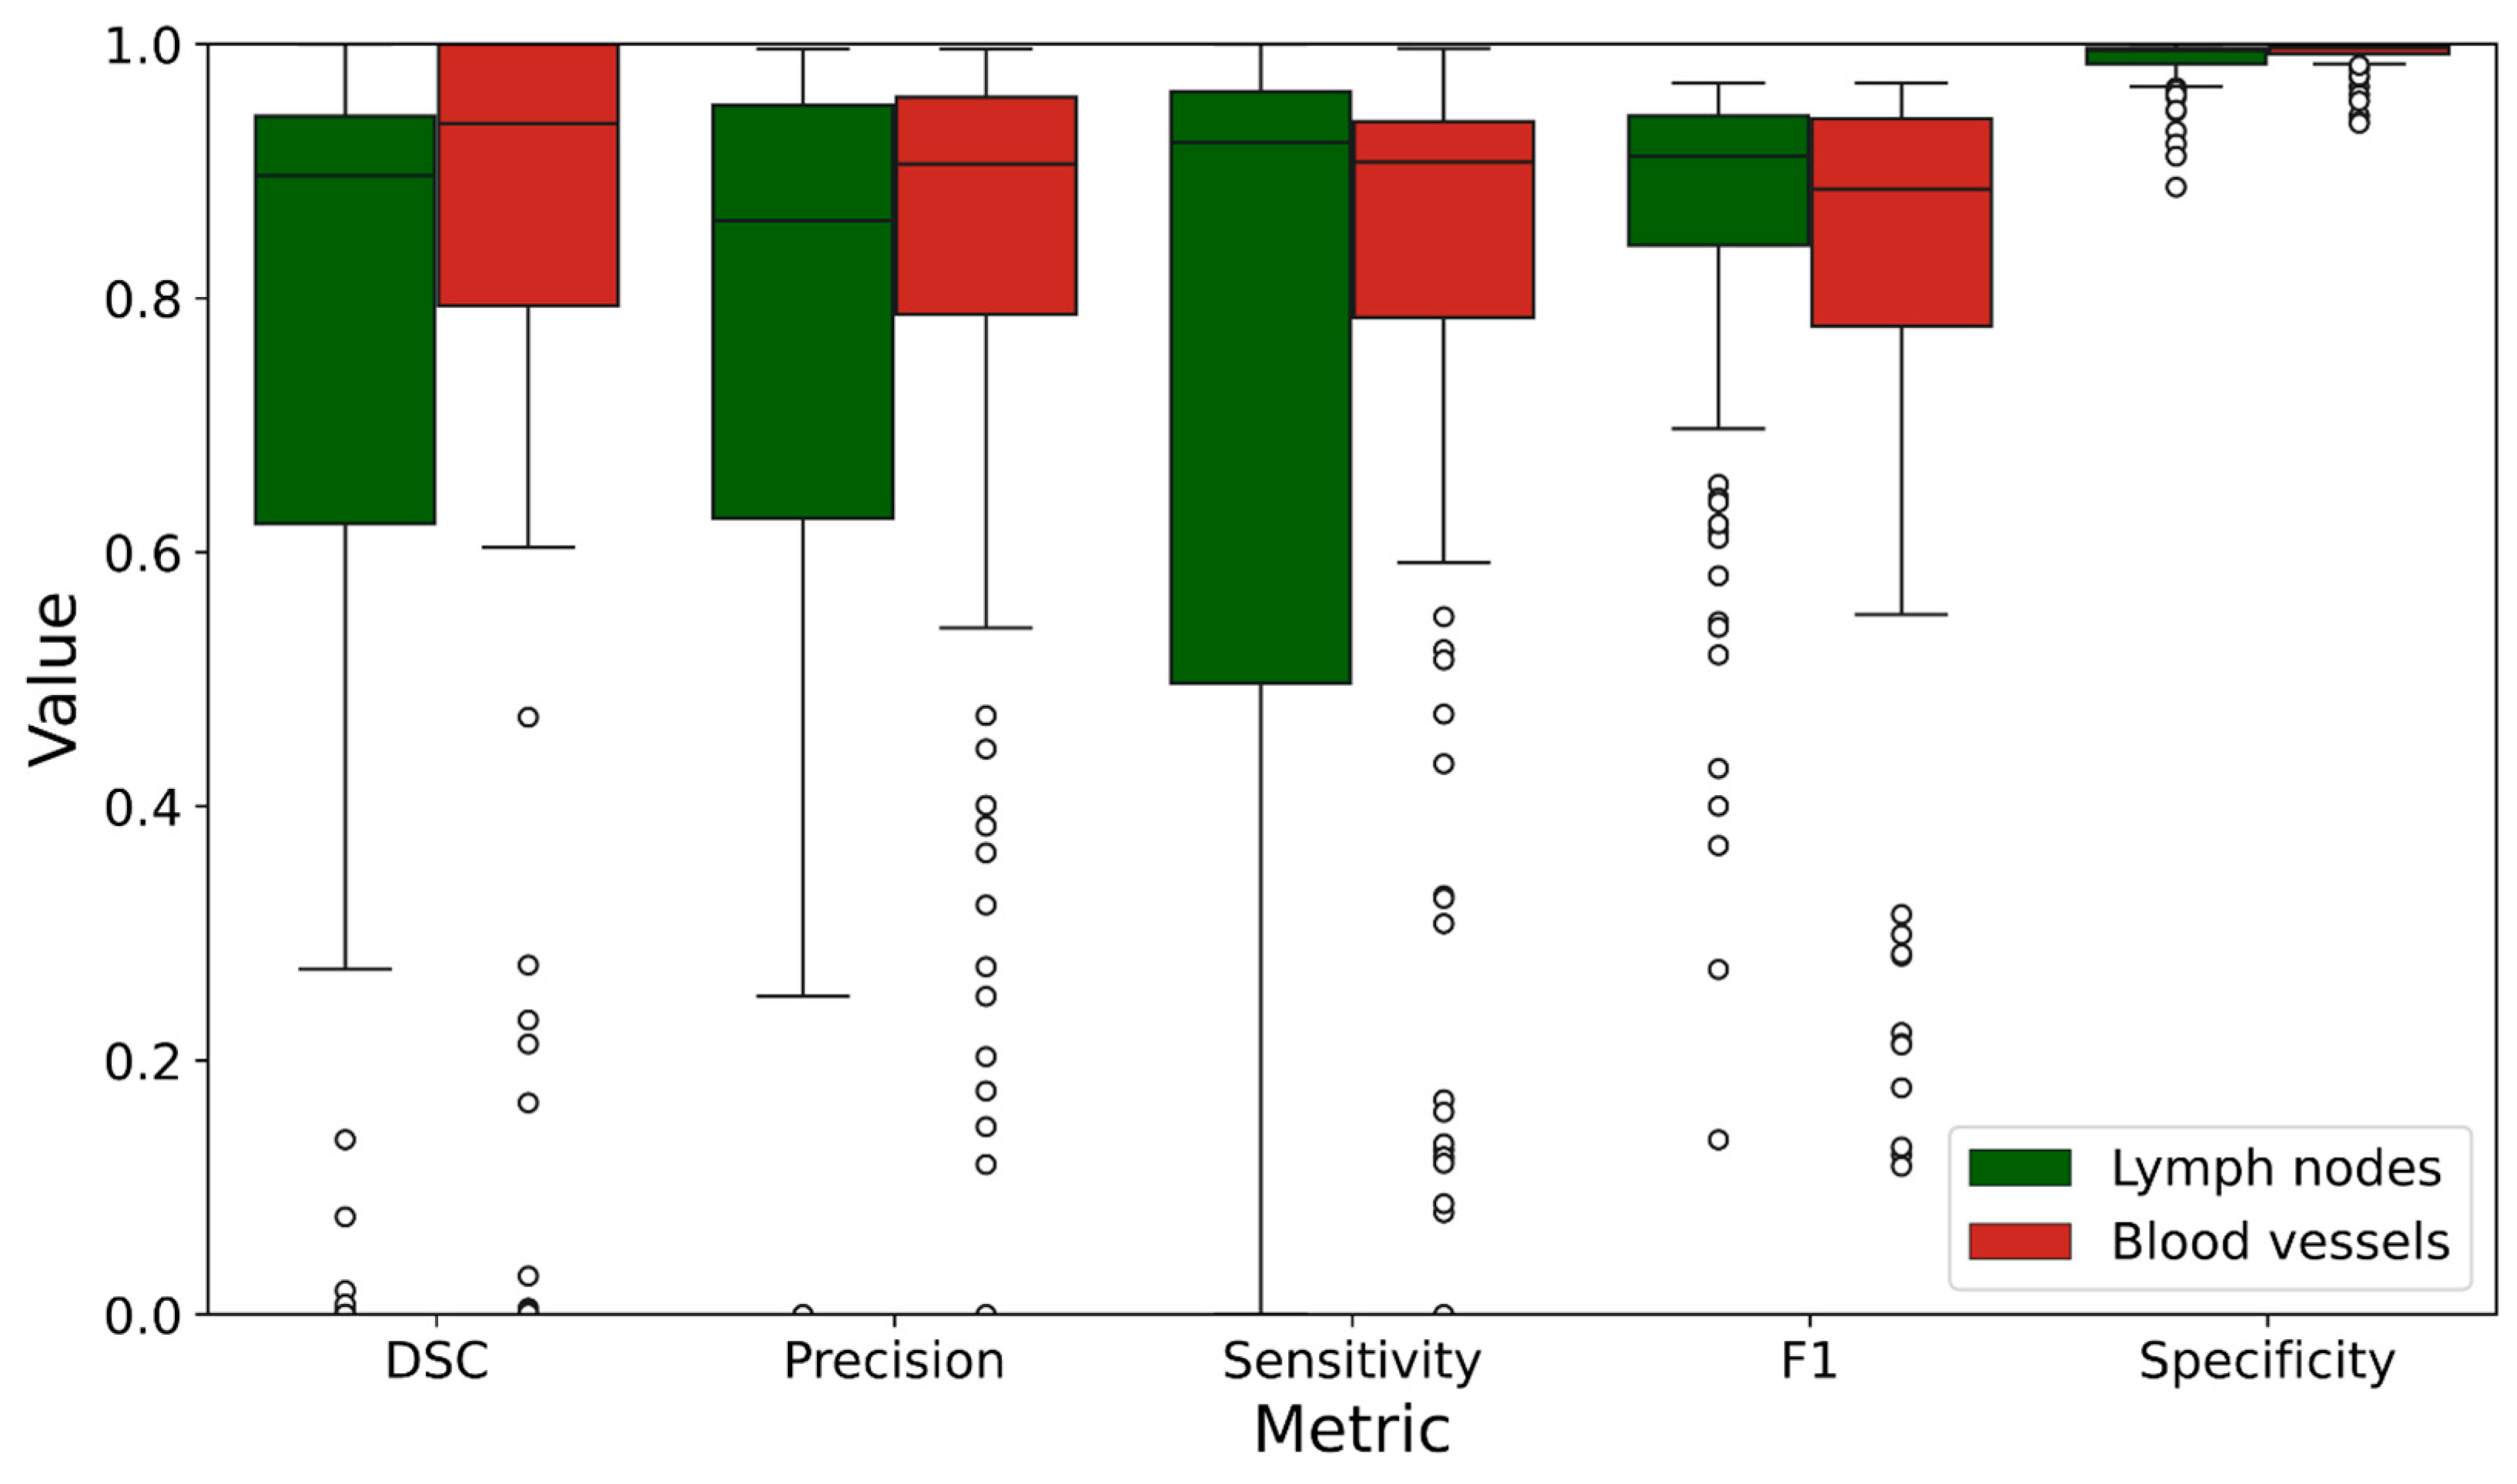
| Lymph Nodes | Blood Vessels | |||
|---|---|---|---|---|
| Mean | SD | Mean | SD | |
| DSC | 0.713 | 0.347 | 0.758 | 0.376 |
| Precision | 0.694 | 0.362 | 0.824 | 0.221 |
| Sensitivity | 0.711 | 0.380 | 0.797 | 0.251 |
| F1 | 0.847 | 0.160 | 0.806 | 0.214 |
| Specificity | 0.987 | 0.018 | 0.992 | 0.011 |
Disclaimer/Publisher’s Note: The statements, opinions and data contained in all publications are solely those of the individual author(s) and contributor(s) and not of MDPI and/or the editor(s). MDPI and/or the editor(s) disclaim responsibility for any injury to people or property resulting from any ideas, methods, instructions or products referred to in the content. |
© 2024 by the authors. Licensee MDPI, Basel, Switzerland. This article is an open access article distributed under the terms and conditions of the Creative Commons Attribution (CC BY) license (https://creativecommons.org/licenses/by/4.0/).
Share and Cite
Ervik, Ø.; Tveten, I.; Hofstad, E.F.; Langø, T.; Leira, H.O.; Amundsen, T.; Sorger, H. Automatic Segmentation of Mediastinal Lymph Nodes and Blood Vessels in Endobronchial Ultrasound (EBUS) Images Using Deep Learning. J. Imaging 2024, 10, 190. https://doi.org/10.3390/jimaging10080190
Ervik Ø, Tveten I, Hofstad EF, Langø T, Leira HO, Amundsen T, Sorger H. Automatic Segmentation of Mediastinal Lymph Nodes and Blood Vessels in Endobronchial Ultrasound (EBUS) Images Using Deep Learning. Journal of Imaging. 2024; 10(8):190. https://doi.org/10.3390/jimaging10080190
Chicago/Turabian StyleErvik, Øyvind, Ingrid Tveten, Erlend Fagertun Hofstad, Thomas Langø, Håkon Olav Leira, Tore Amundsen, and Hanne Sorger. 2024. "Automatic Segmentation of Mediastinal Lymph Nodes and Blood Vessels in Endobronchial Ultrasound (EBUS) Images Using Deep Learning" Journal of Imaging 10, no. 8: 190. https://doi.org/10.3390/jimaging10080190