1. Introduction
Diabetic foot ulcers are thought to affect 15–25% of people with diabetes during their lifetime [
1] and are a major source of suffering and cost. The principal pathological conditions contributing to foot ulceration are peripheral neuropathy, peripheral artery disease, pre-existing deformity, and trauma, but the contributions of each vary considerably. While some ulcers heal relatively quickly, others fail to heal and deteriorate. An accurate prediction of those ulcers least likely to heal quickly can therefore be useful, because it would enable consideration of more intensive intervention at an earlier stage and thereby improve overall outcome.
Peripheral artery disease can both cause ulceration and delay its healing by reducing the delivery of oxygen to peripheral tissues. While there are a number of approaches to assessing the extent of disease in larger arteries (including pulse palpation, pressure measurements, and angiography), none are routinely used to investigate associated dysfunction of smaller arteries, arterioles, and capillaries. One option that has been explored is hyperspectral imaging (HSI).
HSI is a noninvasive technique by which images are formed at different wavelengths to produce a hypercube (x, y, λ). Due to the different absorption spectra of oxy- and deoxyhemoglobin, in biomedical HSI the majority of research has utilized the reflectance hypercube to estimate oxygen saturation (SpO
2) values from peripheral tissue [
2,
3,
4,
5,
6,
7,
8,
9].
Greenman and colleagues used HSI to investigate whether oxygen delivery and muscle metabolism were factors in diabetic foot disease. That study included 108 individuals without ulceration, comparing three groups: volunteers without diabetes, diabetic patients without neuropathy, and patients with both diabetes and neuropathy [
5]. SpO
2 was reduced in people with diabetes, and especially in those with neuropathy. Yudovsky et al. [
6] also used HSI in the visible spectrum (450–700 nm) to predict tissue breakdown. A two-layer (epidermis, dermis) skin model was used to fit to the measured data and obtain an index of SpO
2. The algorithm was able to predict tissue at risk of ulceration with a sensitivity and specificity of 95% and 80% respectively, 58 days before breakdown is visible to the naked eye [
6].
A formula to derive an indication of SpO
2 from HSI was also used by Khaodhiar et al. [
7] to estimate oxyhemoglobin and deoxyhemoglobin of 10 patients with type 1 diabetes with foot ulcers, 13 without ulcers, and 14 subjects without diabetes. A spectrum for each pixel was compared with standard tissue to determine measures of oxyhemoglobin and deoxyhemoglobin. Using this approach, the sensitivity and specificity of HSI in predicting ulcer healing were 93% and 86%, while the positive and negative predictive values for ulceration were calculated as 93% and 86%. Nouvong et al. [
8] used a similar approach to estimate relative values of tissue oxyhemoglobin and deoxyhemoglobin in 66 people with diabetic foot ulcers and reported that the sensitivity of HSI to predict healing within 6 months was 80% and the specificity was 74%. As discussed in our previous work [
9], both of these papers had weaknesses, which helps to explain the differences between results of [
7,
8,
9]. The first study [
7] was very small and acknowledged to be simply a pilot, and both studies based their analysis on outcome per ulcer rather than outcome per person. The population included in the second study [
8] was also highly selected, with a mean age of participants of just over 50 years, much younger than a representative population with diabetic foot ulcers.
Principal component analysis (PCA) is an alternative approach to analyzing HSI data. Although frequently applied in other fields, such as remote sensing and the food industry, mapping of SpO
2 is more common in biomedical HSI. It is therefore valuable to compare the performance of PCA with SpO
2 measurement in the prediction of wound healing. PCA is a process that converts a number of possibly correlated variables into a set of linearly uncorrelated variables called principal components. PCA has been demonstrated to be an effective and efficient preprocessing method, as retaining only the first few principal components significantly reduces data [
10]. In the food industry, PCA and HSI have been applied to tea classification [
11], detection of bruise damage on mushrooms [
12], and estimation of the quality of pork [
13]. Some examples of the application of PCA in in vivo biomedical HSI are provided in useful reviews [
14,
15,
16], with a focus on laparoscopic imaging [
11,
12]. PCA has also been used as a dimension-reduction algorithm for wavelet-based segmentation of hyperspectral colon tissue imagery [
17]. For tissue measurement, the contiguous bands of a hypercube are highly correlated, as they are dominated by the oxy- and deoxyhemoglobin spectra. This has the benefit of being a data-reduction method for the hypercubes obtained from the tissues of feet affected by ulcers.
This study performed a novel investigation by comparing the performance of PCA with more widely used SpO2 measurements in predicting whether a wound will heal within 12 weeks of presentation. More accurate prediction of wound healing will support earlier intervention and better treatment.
2. Method
2.1. Experimental Setup
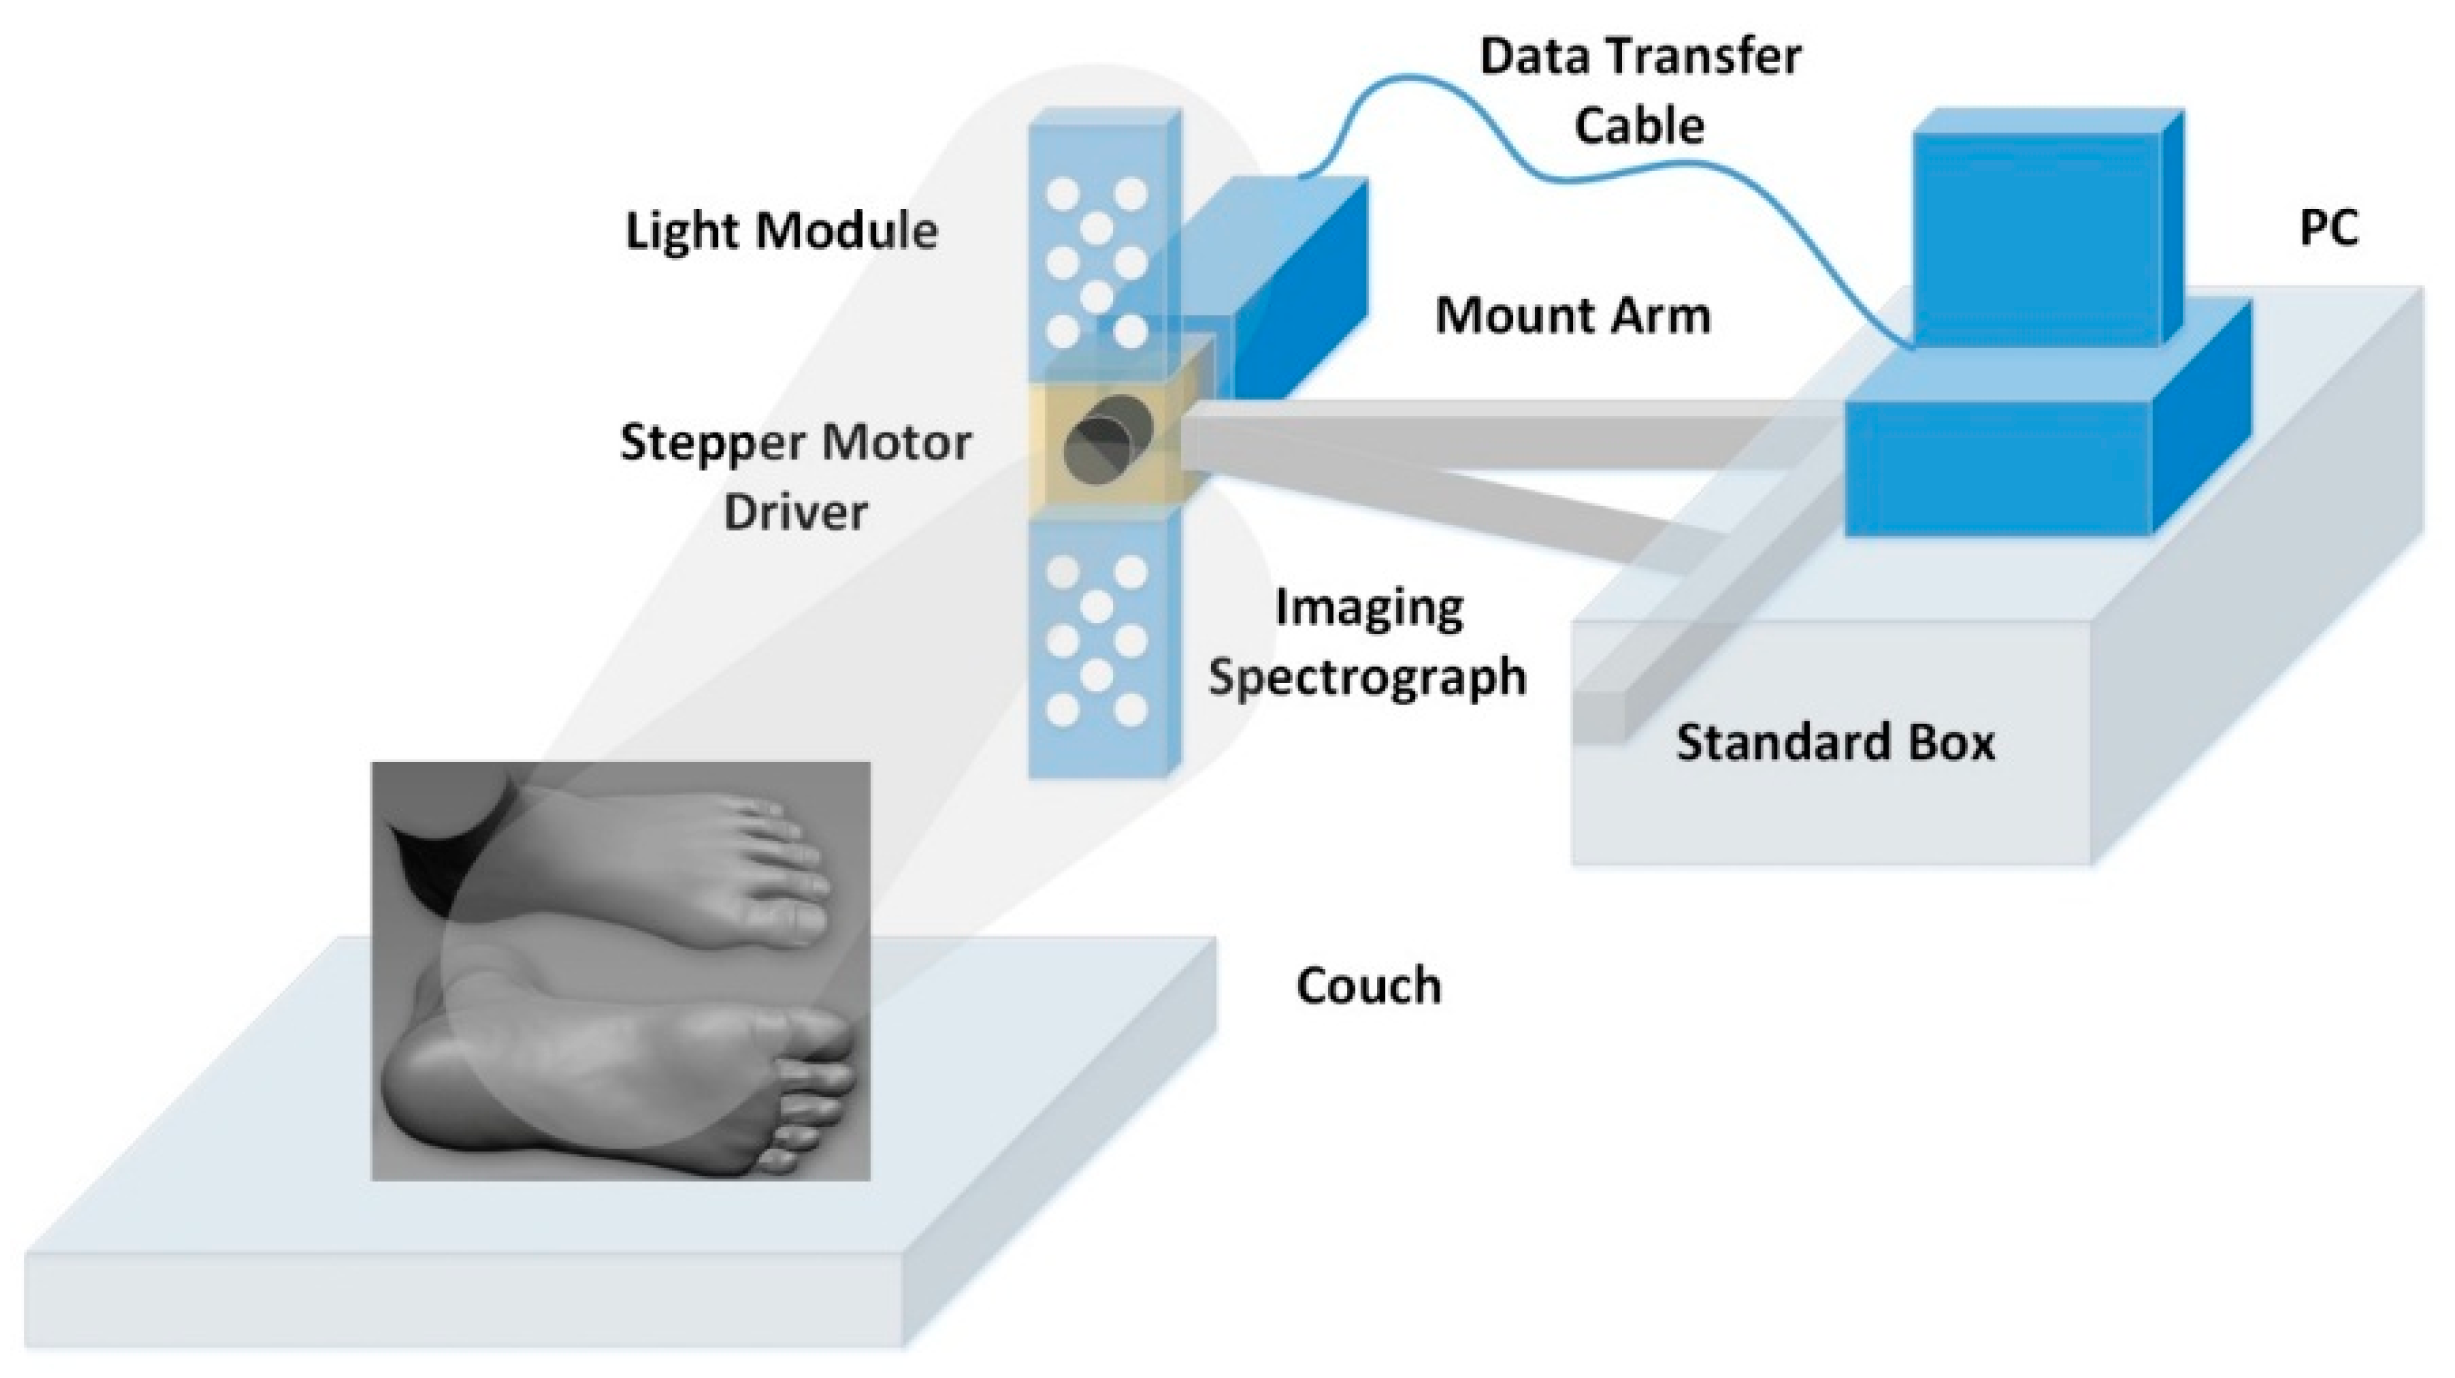
The HSI setup is shown in
Figure 1. Illumination of the foot was via 16 × 1 W white light-emitting diodes (LEDs) (LXHL-MWEC, Lumileds
TM Lighting, San Jose, CA, USA) with 8 units placed on either side of the camera. Light scattered from the foot was passed through an aperture, which controlled the amount of collected light and was focused onto a detector by a C-mount lens (f = 15 mm, f# = 2.2; Schneider).
The HSI camera is a “push-broom” type that images a line from the scene onto a diffraction grating, which splits the light into a range of colors across the photosensor array. The camera comprises a Peltier cooled charge-coupled device (CCD) (Sensicam QE, PCO imaging, Cooke Corporation, Auburn Hills, MI, USA) coupled to an imaging spectrograph (ImSpector V10E, Specim Ltd., Oulu, Finland), which contains an input slit and a prism–grating–prism system. The input slit defines the field of view for the spatial scan, while the prism–grating–prism diffracts the light from the aperture into its spectrum. Scanning the line allows a 3D data cube that is transmitted to a PC via a peripheral component interface (PCI) for storage and future analysis. For the measurements taken in this study, each 3D data cube contained 2D spatial images (120 × 170 pixels) over a wavelength range from 430 nm to 750 nm (272 values). The sweep of the system moves from heel to toe and takes ~30 s to obtain an image, with an exposure time of 100 ms per row. Calibration images of white (99% reflectance Spectralon; Labsphere, Inc., North Sutton, NH, USA) and black (lens cap on camera) targets are recorded to take into account the effects of the nonuniform spectrum of the light source and dark noise, respectively. In order to reduce noise but not lose significant features in the reflected light spectra, a 9 point moving average filter is applied to the spectra.
For a certain position in the image plane (x, y) at a wavelength λ, the calibrated attenuation value is calculated as:
where I
sample is the intensity measured from the raw image, and I
white and I
dark are the intensities of the white and dark references, respectively.
2.2. Clinical Protocol
The data used to compare prediction of wound healing via SpO
2 and PCA were obtained in a clinical study described previously [
9]. The published study received research ethics approval and all participants provided written informed consent. Recruitment was of a consecutive cohort, and the only major prespecified exclusions were those with a unilateral major amputation and those who withheld or were unable to give informed consent [
9]. There was therefore no control of gender balance, as one would expect a predominance of male patients in all studies of foot ulcers. There was also no control of diabetes type, as this is not a recognized significant factor associated with the outcome of diabetic foot ulcers.
Participants attending an imaging session were required to avoid drinking tea or coffee and smoking tobacco for at least 2 hours prior to the visit, as these stimulants could lead to a change in blood flow. Capillary glucose was determined on arrival, and patients who were hypoglycemic were excluded from the study. All the studies were undertaken in a temperature-controlled clinic room at 22 °C and the test time was between 09:00 and 12:00. Prior to any assessments, participants lay on an examination couch for at least 15 minutes after removing their shoes and socks. Intensity hypercubes of the ulcer site were obtained for each participant, and the data were processed using SpO
2 algorithms and PCA, as described in
Section 2.3 and
Section 2.4, respectively.
2.3. SpO2 Data Processing
Oxygen saturation is defined as:
where
HbO2 is the concentration of oxyhemoglobin (mole L
−1) and
Hb is the concentration of deoxyhemoglobin (mole L
−1).
Due to the different absorption spectra of the dominant absorbers, oxy- and deoxyhemoglobin, it is possible to extract information about the oxygen saturation of tissues based on optical measurements such as HSI.
The absorption coefficient (μ
a(λ)) and attenuation (
A(
λ)) can be expressed as [
18]:
where
α(
λ) is the specific absorption of oxyhemoglobin (cm
−1 mole
−1 L),
β(
λ) is the specific absorption of deoxyhemoglobin (cm
−1 mole
−1 L), and
d is the path length of the light (cm).
If μ
a(λ) is known at 2 wavelengths, then it is straightforward to calculate SpO
2 from Equations (3) and (2), as α(λ) and
β(
λ) are known from literature values. A challenge is to relate measurements of A(λ) and μ
a(λ). In the absence of light scattering, the path length is the geometric path length through the sample and the relationship is the Lambert–Beer law. In practice, the relationship between attenuation and absorption is nonlinear due to light scattering. An approximation is therefore needed to relate
A(
λ) and μ
a(λ) in the presence of light scattering. The most commonly applied is the modified Lambert–Beer law [
19,
20]:
where an offset
G is used to take into account attenuation due to scattering. Alternative relationships include a parabolic model [
21]:
where
a and
b are fitting parameters, as well as a power law model derived from photon diffusion theory [
22]:
Here, a model is applied based on the power law approximation [
18]:
where
a and
b are fitting parameters. It should be noted that when
b = 1, this equation is same as the modified Lambert–Beer Law (Equation (5)) and when
b = 0.5 the equation becomes the power law model described in Equation (7). Using Equation (8) to fit to the measured data and applying Equations (3) and (2) enabled images of oxygen saturation to be obtained. The fit is performed with a nonlinear search algorithm that uses the simplex search method [
18,
23]. This is a direct search method that does not use numerical or analytic gradients. For
n unknown parameters of the fitting equation, the simplex in n-dimensional space is characterized by the
n + 1 distinct vectors that are its vertices. At each step of the search, a new point in or near the current simplex is generated. The function’s value at the new point is compared with its values at the vertices of the simplex, and usually one of the vertices is replaced by the new point, giving a new simplex. This step is repeated until the diameter of the simplex is less than the specified tolerance. The fitting algorithm and model have been previously validated using Monte Carlo data that simulate light propagation in tissue [
18]. In the presence of noise, this method was found to be robust and was subsequently applied to tissue measurement.
Similar to [
9], tissue oxygenation was assessed by HSI at a site measuring 1 cm
2 in an area of intact skin adjacent (typically 1–5 mm) to the edge of the ulcer and unaffected by callus.
2.4. Principal Component Analysis
The method applied in the wound study follows a similar approach to that described in the literature for applications in the food industry [
11,
12,
13]. A cropped region of interest of 50 × 50 pixels was selected, as this was found to be sufficient to extract the wound and surrounding tissue for all the images obtained. Where background pixels remained in the image (e.g., when a wound was close to or on a toe), these were removed by thresholding, as the attenuation of the background was lower than that of tissue.
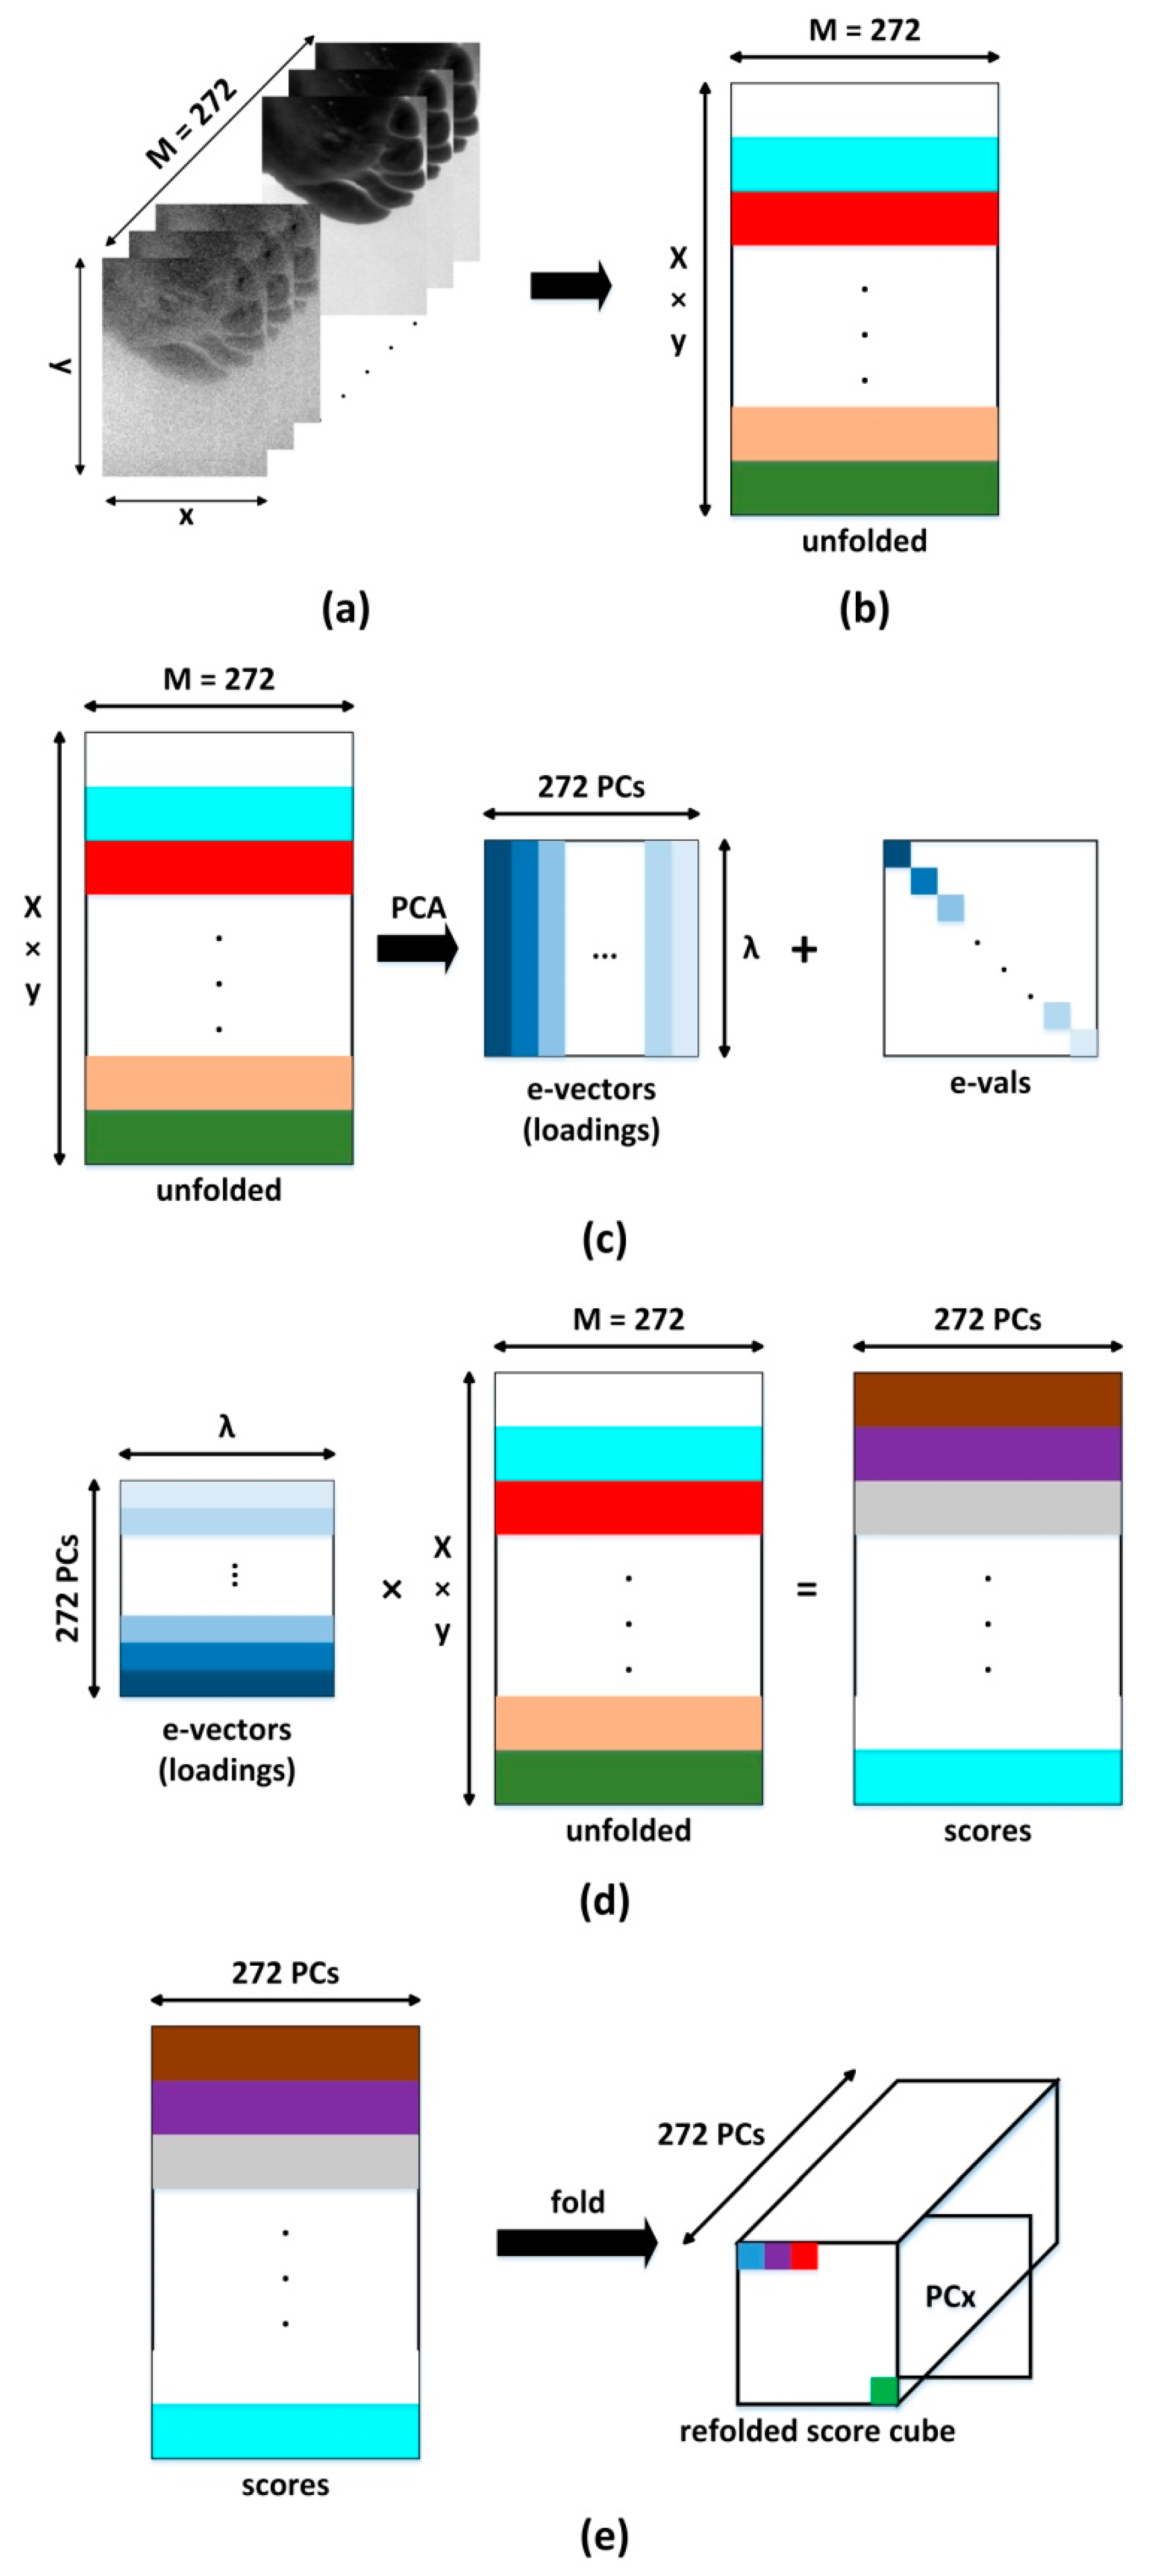
The process of converting the three-dimensional data cube into images of each of the principal components is shown in
Figure 2. The data cube is first unfolded into a two-dimensional matrix, where each column represents all pixels contained in one spectral band of the original image cube and each row represents each pixel’s spectrum (
Figure 2). Mathematically this is expressed as [
24]:
where
N is the total number of pixels in the image,
A(
λi) is the attenuation at each pixel,
i represents the wavelength bin number of the spectrum, and T denotes the transpose.
To calculate the principal components, it is necessary to calculate the eigenvectors and eigenvalues of the 2D matrix (
Figure 2c). The mean vector is given by:
The covariance matrix of
Ai is expressed as:
PCA is dependent on the eigenvalue decomposition of the covariance matrix, and
Cov(x) can be denoted in another form as:
where
D is the diagonal matrix,
P is the eigenvalues of the covariance matrix, and
U is the orthonormal matrix that contains the eigenvectors of the covariance matrix.
Multiplying the 2-D matrix
Ai by the eigenvector matrix provides a score matrix
vi (
Figure 2d), which can then be refolded to form a data cube that represents images of principal components.
Arranging these images according to the magnitude of the eigenvector (P1 ≫ P2 ≫ … ≫ PN) enables data reduction, as usually only information is contained in the first few principal components. In this case, the oxy- and deoxyhemoglobin spectra are correlated and only the first two principal components (PC1 and PC2) are used for image classification.
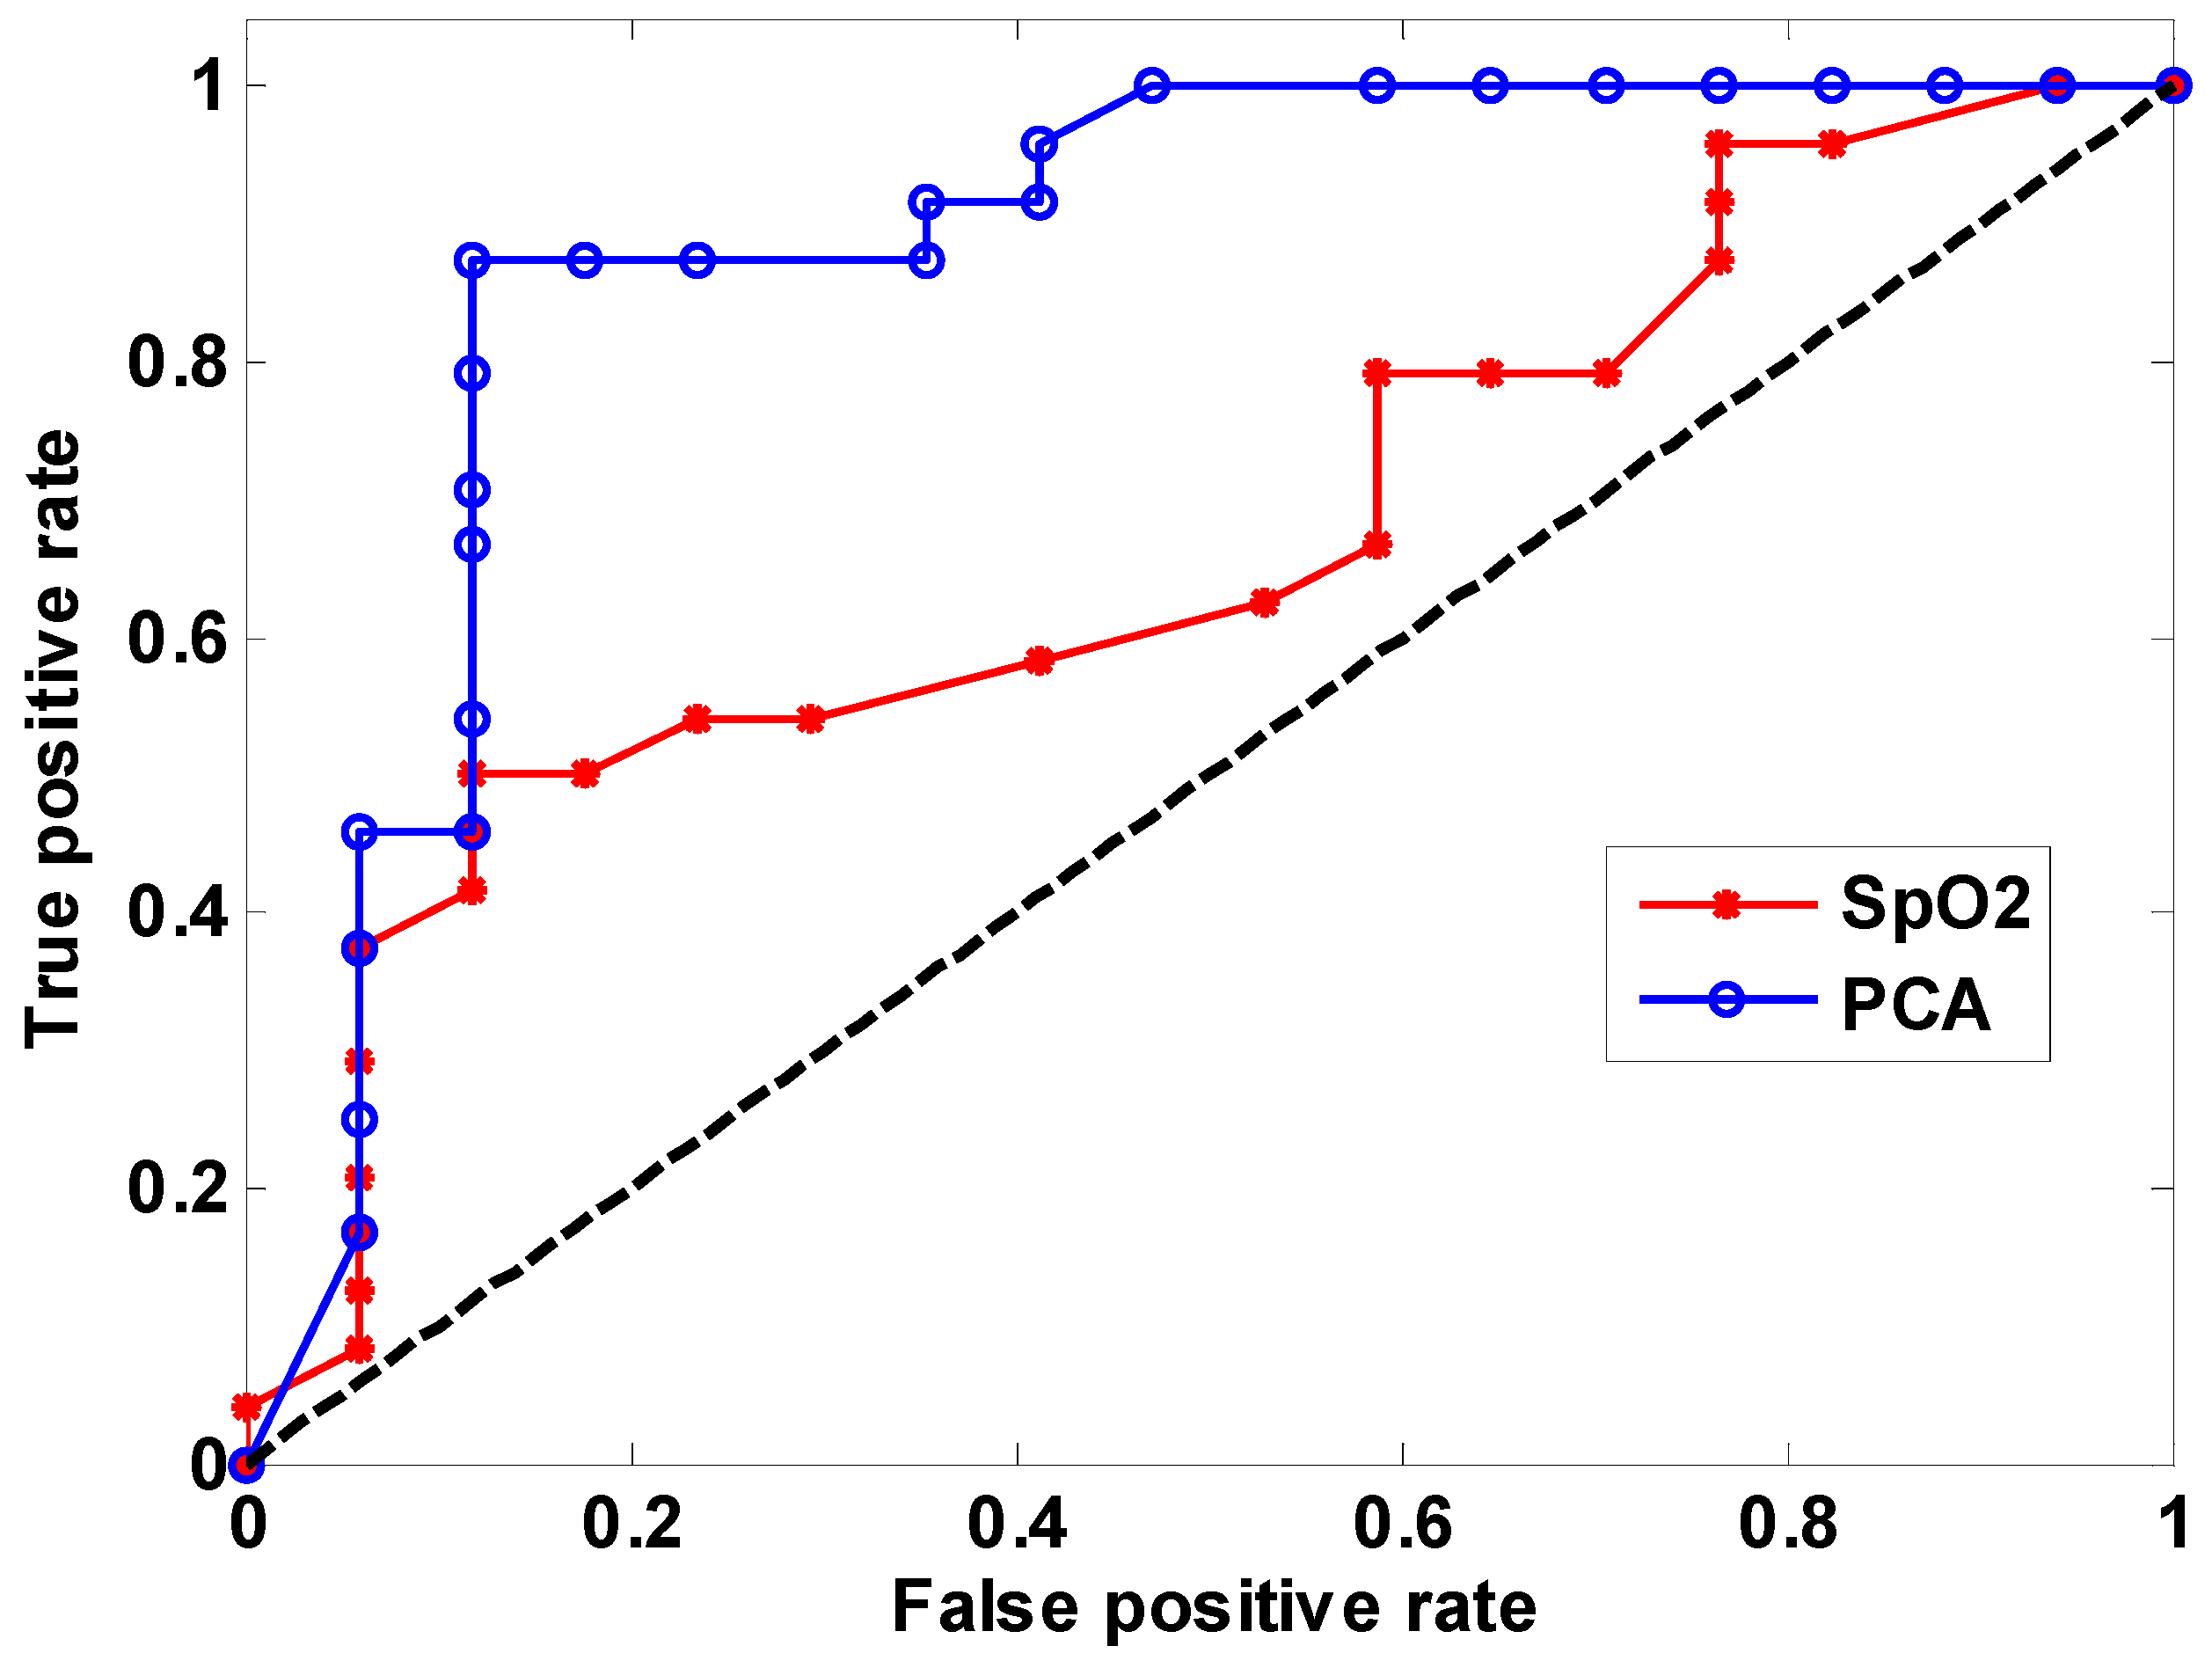
In order to compare the classification performance of using SpO2 values or PCA, receiver operating characteristic (ROC) curves are used to express the performance of a binary classifier system due to a varying discrimination threshold. An ROC curve is obtained by plotting true positive rate (TPR) against false positive rate (FPR). TPR is the fraction of true positives out of the total actual positives. FPR is the fraction of false positives out of the total actual negatives.
4. Discussion and Conclusions
Hyperspectral imaging is a tool that has the potential to predict healing of diabetic foot ulcers. Such a tool would be highly beneficial, as foot ulcers represent a major complication of diabetes and are a considerable burden for both patients and health care providers. Healing often takes many months and accurate prediction of those ulcers least likely to heal quickly can therefore be useful, because it would enable more intensive intervention at an earlier stage, which could improve overall outcome. Due to the different absorption spectra of oxy- and deoxyhemoglobin, biomedical HSI has previously predicted wound healing based on SpO2 values. Principal component analysis is an alternative approach that has not been investigated in the prediction of wound healing. It is therefore of value to investigate whether PCA improves the prediction of wound healing and to compare this with the performance of SpO2 mapping.
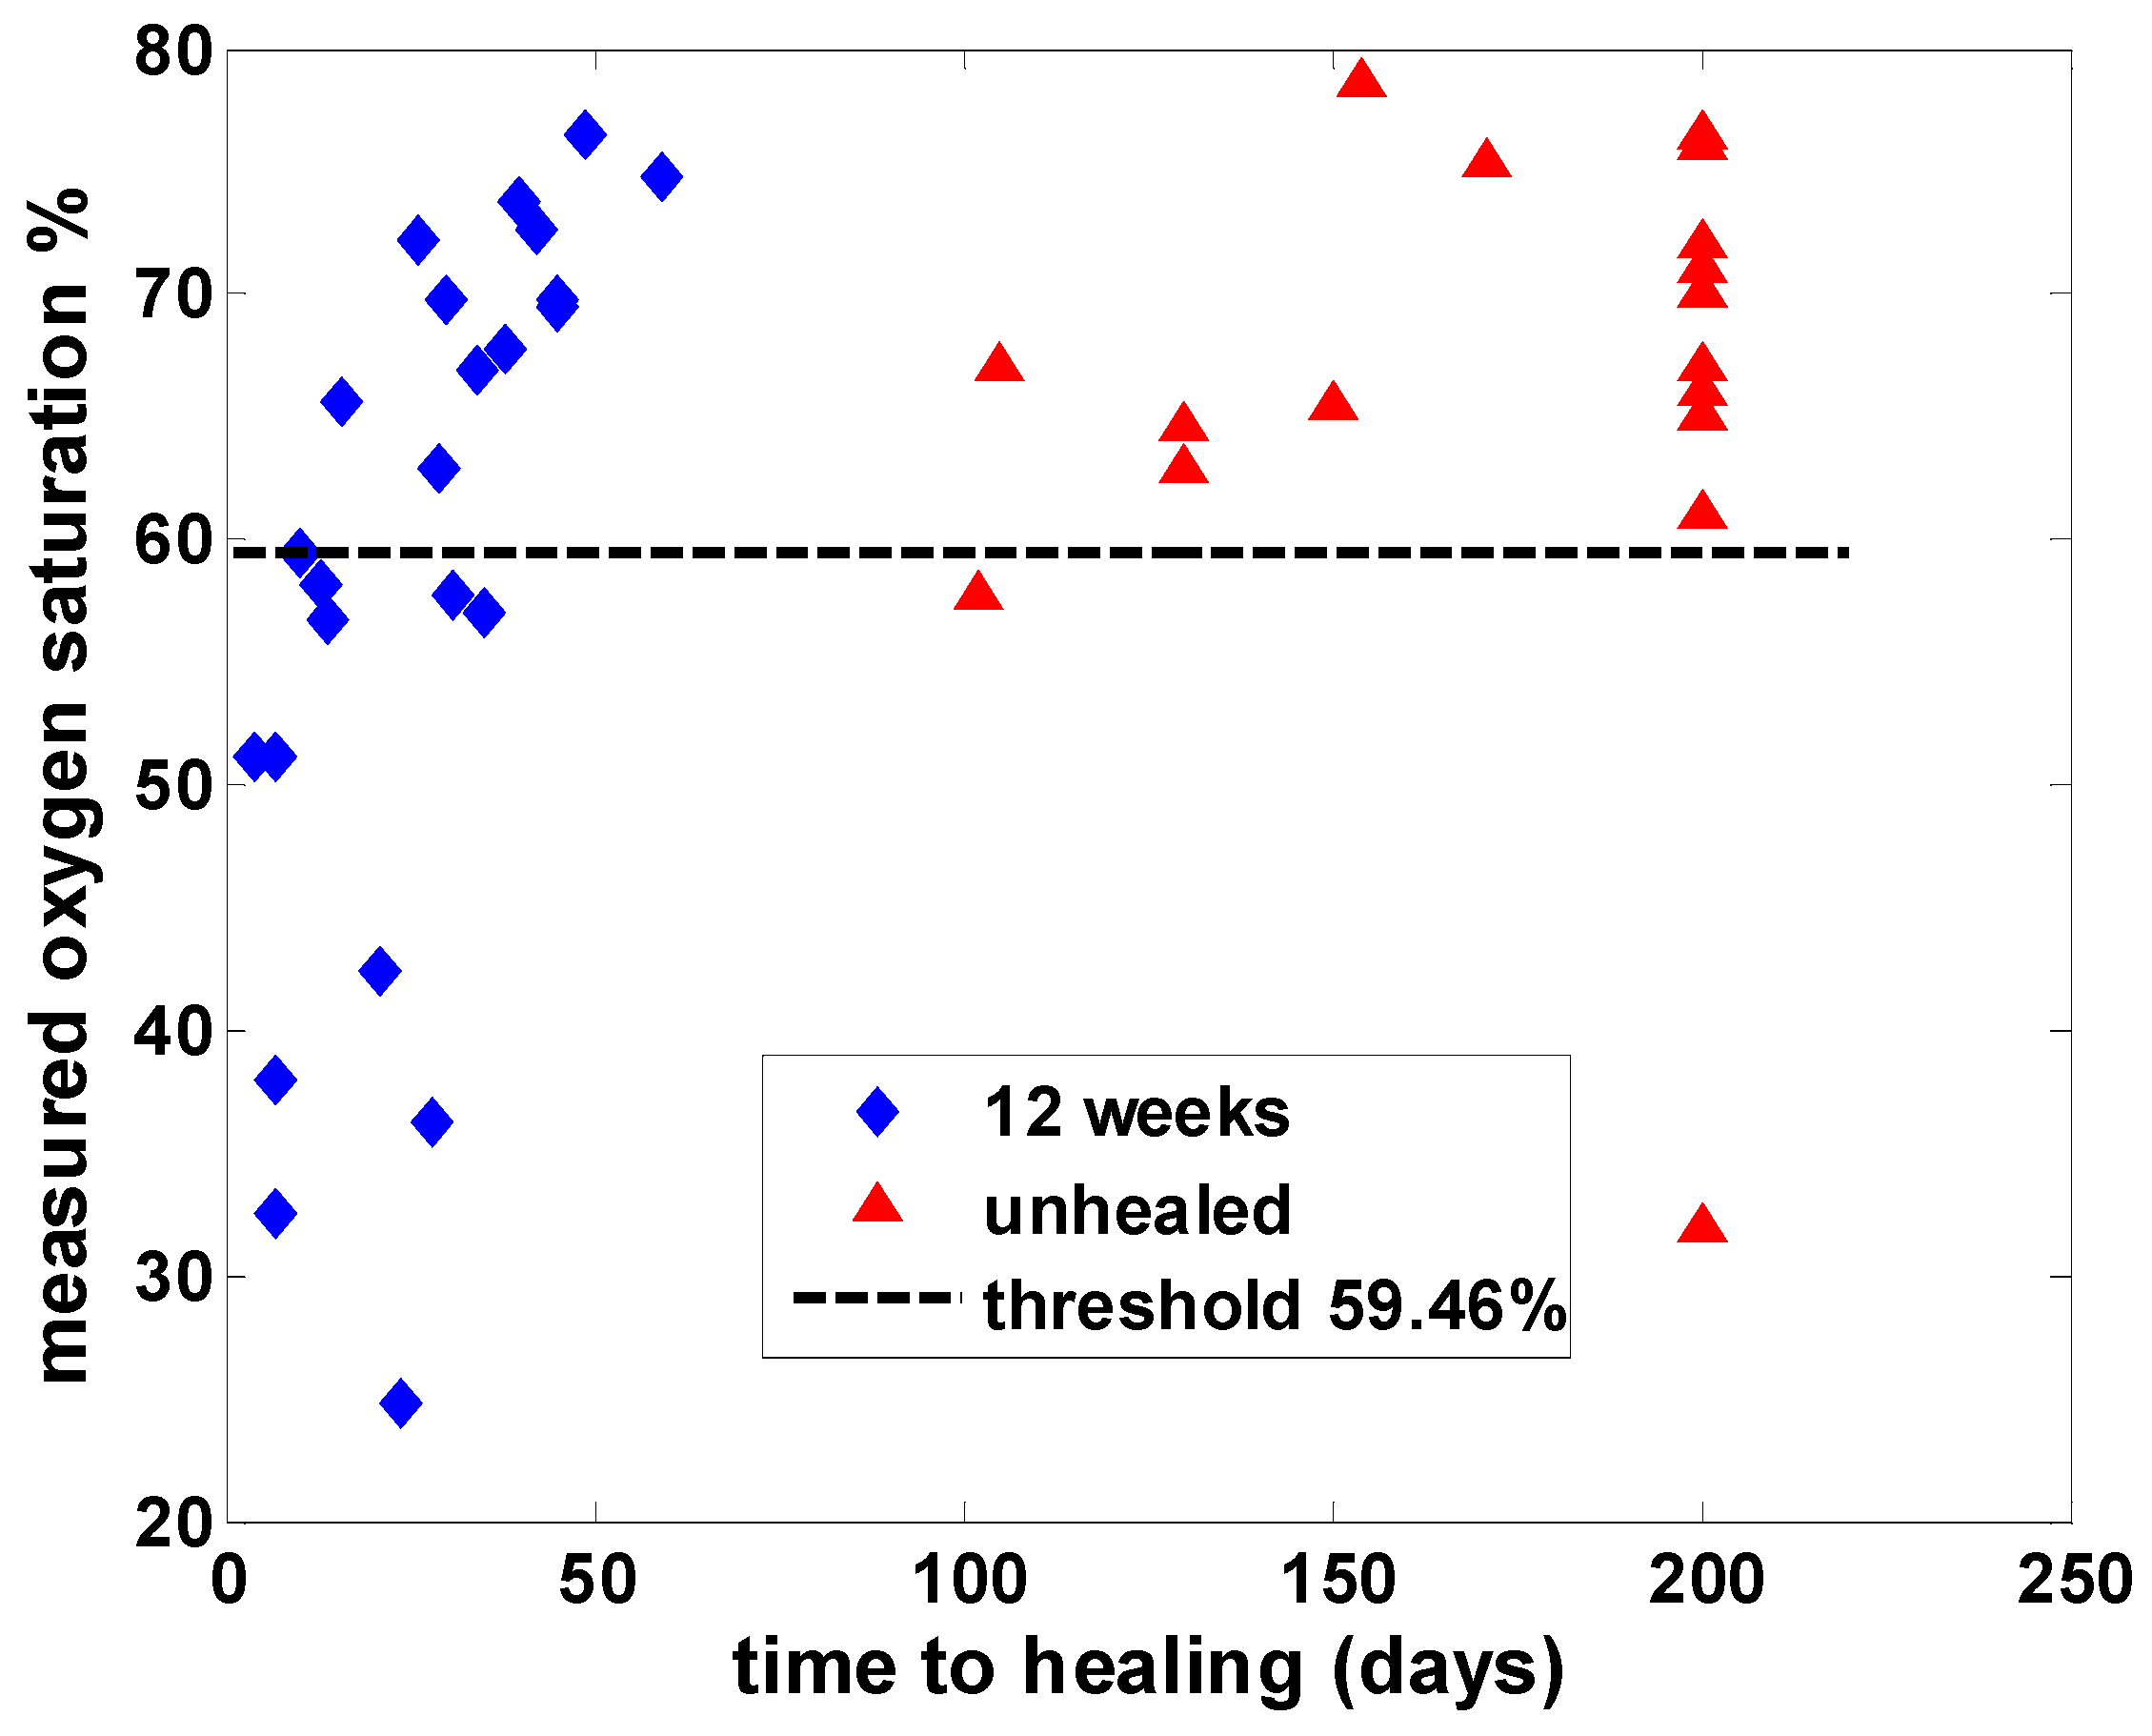
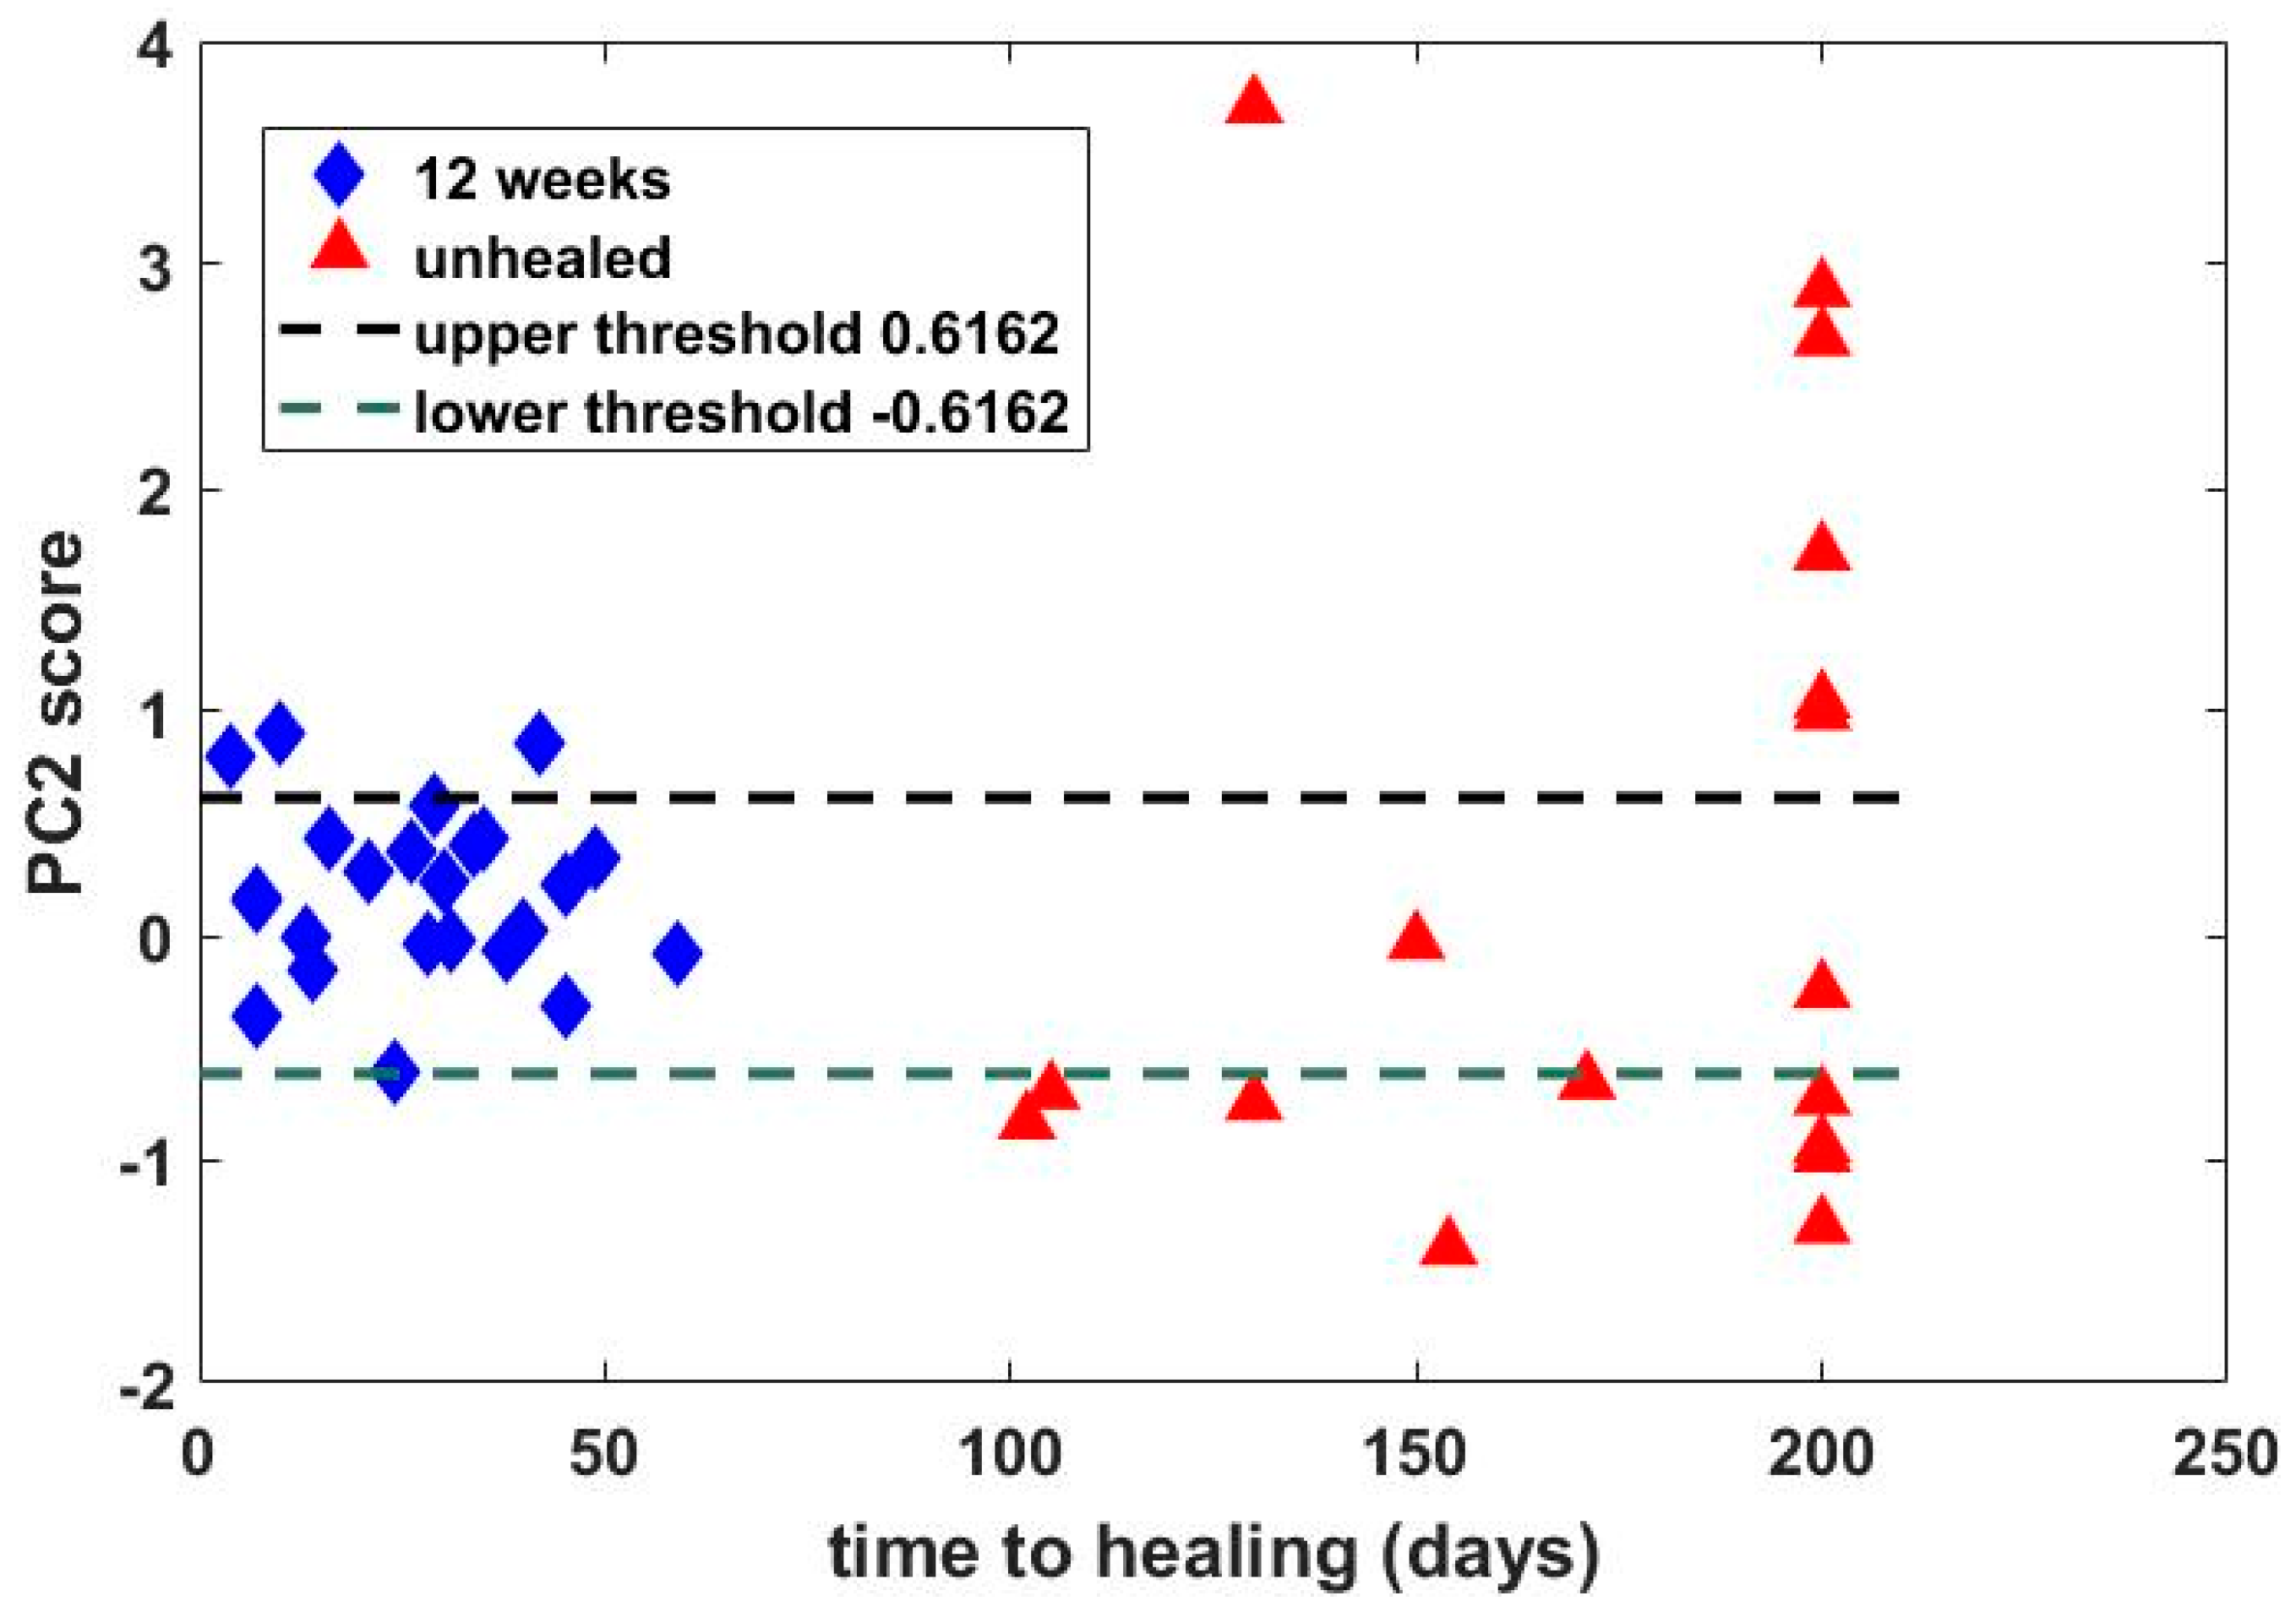
Hyperspectral images from a previous study of 43 patients with wounds were analyzed by using both SpO2 values and PCA, and the principal finding was that classification of time to healing by 12 weeks based on PCA (sensitivity = 87.5%, specificity = 88.2%) outperformed that using SpO2 (sensitivity = 50%, specificity = 88.2%). Comparison by receiver operating characteristic (ROC) analysis revealed an area under the curve of 0.88 for PCA, compared with 0.66 using oxygen saturation analysis. Thus, PCA based on the second principal component appeared superior to analysis using SpO2 values in predicting healing of wounds by 12 weeks based on hyperspectral images taken at baseline.
Although one cannot uniquely map a physical property onto a principal component, it is interesting to consider how physical properties influence PCs. The absorption spectra over the range of interest (430–750 nm) are dominated by oxy- and deoxyhemoglobin. These have broadly similar features, i.e., high absorption in the blue/green region, reducing into the red/near-infrared range. We believe that these features are captured by PC1. Differences in the oxy- and deoxyhemoglobin spectra are then characterized by PC2, which provides discrimination of wound healing with superior performance to that achieved by more widely applied SpO2 measurement approaches. Due to the dominance of oxy- and deoxyhemoglobin, PCs greater than 2 provide no discriminatory value.
The classification performance obtained in this study is slightly better than that of our earlier publication [
9] and is comparable to that obtained by another [
7], which reported estimates of sensitivity and specificity of 93% and 86%, respectively, in a rather smaller group of patients. SpO
2 values may still be useful in cases where a hyperspectral camera is not available (as, for example, when making single point measurements using a lower-cost spectrometer-based method or when making measurements with a wound dressing with a fiber optic probe placed adjacent to the wound site). Furthermore, the previous demonstration that SpO
2 values on the top of the foot are well correlated with those on the underside means that precisely locating the fiber optic probe may not be necessary.

 ,
, 


