1. Introduction
Cell migration is a fundamental cellular process that is essential to life and is linked to many important physiological and pathological events such as the immune response, wound healing, tissue differentiation, embryogenesis, and tumour invasion [
1,
2,
3,
4,
5,
6,
7].
During migration, mechanical processes play a pivotal role, for example cellular biomechanics direct its physical behaviour, as well as its cellular functions in the biological context of health and disease [
8,
9,
10]. Cells also physically interact with their extracellular environments via mechanical forces, for example, cell division, apoptosis, bleb and mitosis [
11,
12,
13]. The strength of the forces varies as the sensitivity of a cell evolves with surrounding biomechanical and biochemical stimulus [
11].
A key determinant of cellular biomechanics is the actin cytoskeleton [
8]. It contains dynamic actin architectures that continuously re-arrange and turnover. The cytoskeletal forces are exerted on a plasma membrane, which define and insure the stability of the interior of the cell [
14]. At the leading edge, a protrusion force is generated by actin architectures. Membrane tension balances these locally imposed forces and ensures rear retraction [
10]. The characteristic time scale is short, often sub-seconds. The measured forces suggest they may range from Pico-Newtons (
) to Micro-Newtons (
) [
10,
14]. The cellular force generation intertwines with many other processes, forming a complex system. In addition, a noticeable change in a single cell behaviour may lead to a significant event on a tissue scale, so unravelling the mutual interplay between physical interactions such as protrusion and retraction forces are essential to understanding cell dynamics [
10].
According to the research by Lieber et al., in 2013 [
10] and Barbieri et al. in 2021 [
8], there is very little understanding and limited ways to quantify cellular forces. The former claims a hypothesis on how membrane tension is set and regulated by cells, but states there is very little evidence to either support or disprove it; the latter describes challenges in quantification due to technical constraints.
Traditionally, our understanding of cell dynamics often comes from visual inspection using high-throughput, high-resolution microscopy and related imaging techniques [
8,
15]. Phase-contrast microscopes utilise partially coherent illumination to extract quantitative phase data [
16,
17]. Interferometric-based techniques make use of the Fourier decomposition [
18,
19]. Other alternative techniques include optical coherence tomography [
20] and digital holographic microscopy [
15,
21]. Additionally to imaging, Simson et al. in [
9] reports an interferometric technique to measure bending modulus, membrane tension and adhesion energy. A mechanic-optical biosensor is described in [
22] to sense local cell adhesive forces. In [
10] the authors discuss about membrane fluctuations and [
23] summarises soft polymers that are typically used to measure cellular forces.
In this study, we propose an alternative theoretical and computational approach whereby, instead of measuring physical quantities in experiments, we describe the underlying rules (and often hypotheses) using mathematical equations, thereby obtaining a model for a migrating cell which incorporates certain assumptions on the physics underlying migration. There have been a number of studies carried out using simulations of such models to model cell migration, e.g., in [
24] and subsequent related works, a phase-field model for keratocyte migrations is developed, in [
25], some quantitative predictions are derived on how adhesion geometry and stiffness change cell behaviour. In this paper, we approach the problem of membrane force estimation during cell migration as the problem of computing forces such that we fit an established model of cell migration [
26,
27] to microscopy data that provides the cell membrane position at a series of time points. Specifically, we use the frames of imaging data to extract the position of the cell membrane at a series of times and use this data in an optimal control model as our target positions for the position of the cells under our mathematical model at the corresponding times. The control which is computed to minimise the difference between the cell positions generated computationally and the data corresponds to the protrusive force active at the cell membrane. This approach, i.e., the optimal control of phase field models albeit in a different context has received recent interest e.g., [
28]. Computational simulations also help to build devices which can then be used to directly measure cellular properties, such as the microsystems summarised in [
11].
The major novelties of the present work with respect to [
26,
27] are threefold: firstly, an application of the optimal control approach to time series data from real experiments, secondly, parameterisation of the model allowing the control problem to be interpreted as an approach for the estimation of forces during cell migration and finally, the application of the approach to the biologically important problem of quantifying cell division (or apoptosis) rates in a population of cells. These novelties, transform the approach from something that is of mainly theoretical interest to something that is of considerably utility to biological practitioners.
This paper is organised as follows. In
Section 2, we describe our theoretical and computational modelling approach. We take experimental observations of cell migration from three different cell types: keratocyte in [
29], epithelial bladder cancer cell from the T24 cell line in [
30], and epithelial kidney cancer cell from the MDCK cell line in [
31]. Using our theoretical model, we re-create the corresponding computational cells and compute the predicted membrane forces. In
Section 3, we present our results. We conclude our results in
Section 5.
3. Results
For each of the biological datasets considered, we treat the initial frame of the video as data used to generate the initial conditions for the model. The remaining frames in the dataset are the target data we seek to fit the model to. Further details on our approach to extracting a phase field representation of the cell from imaging data are given in [
26,
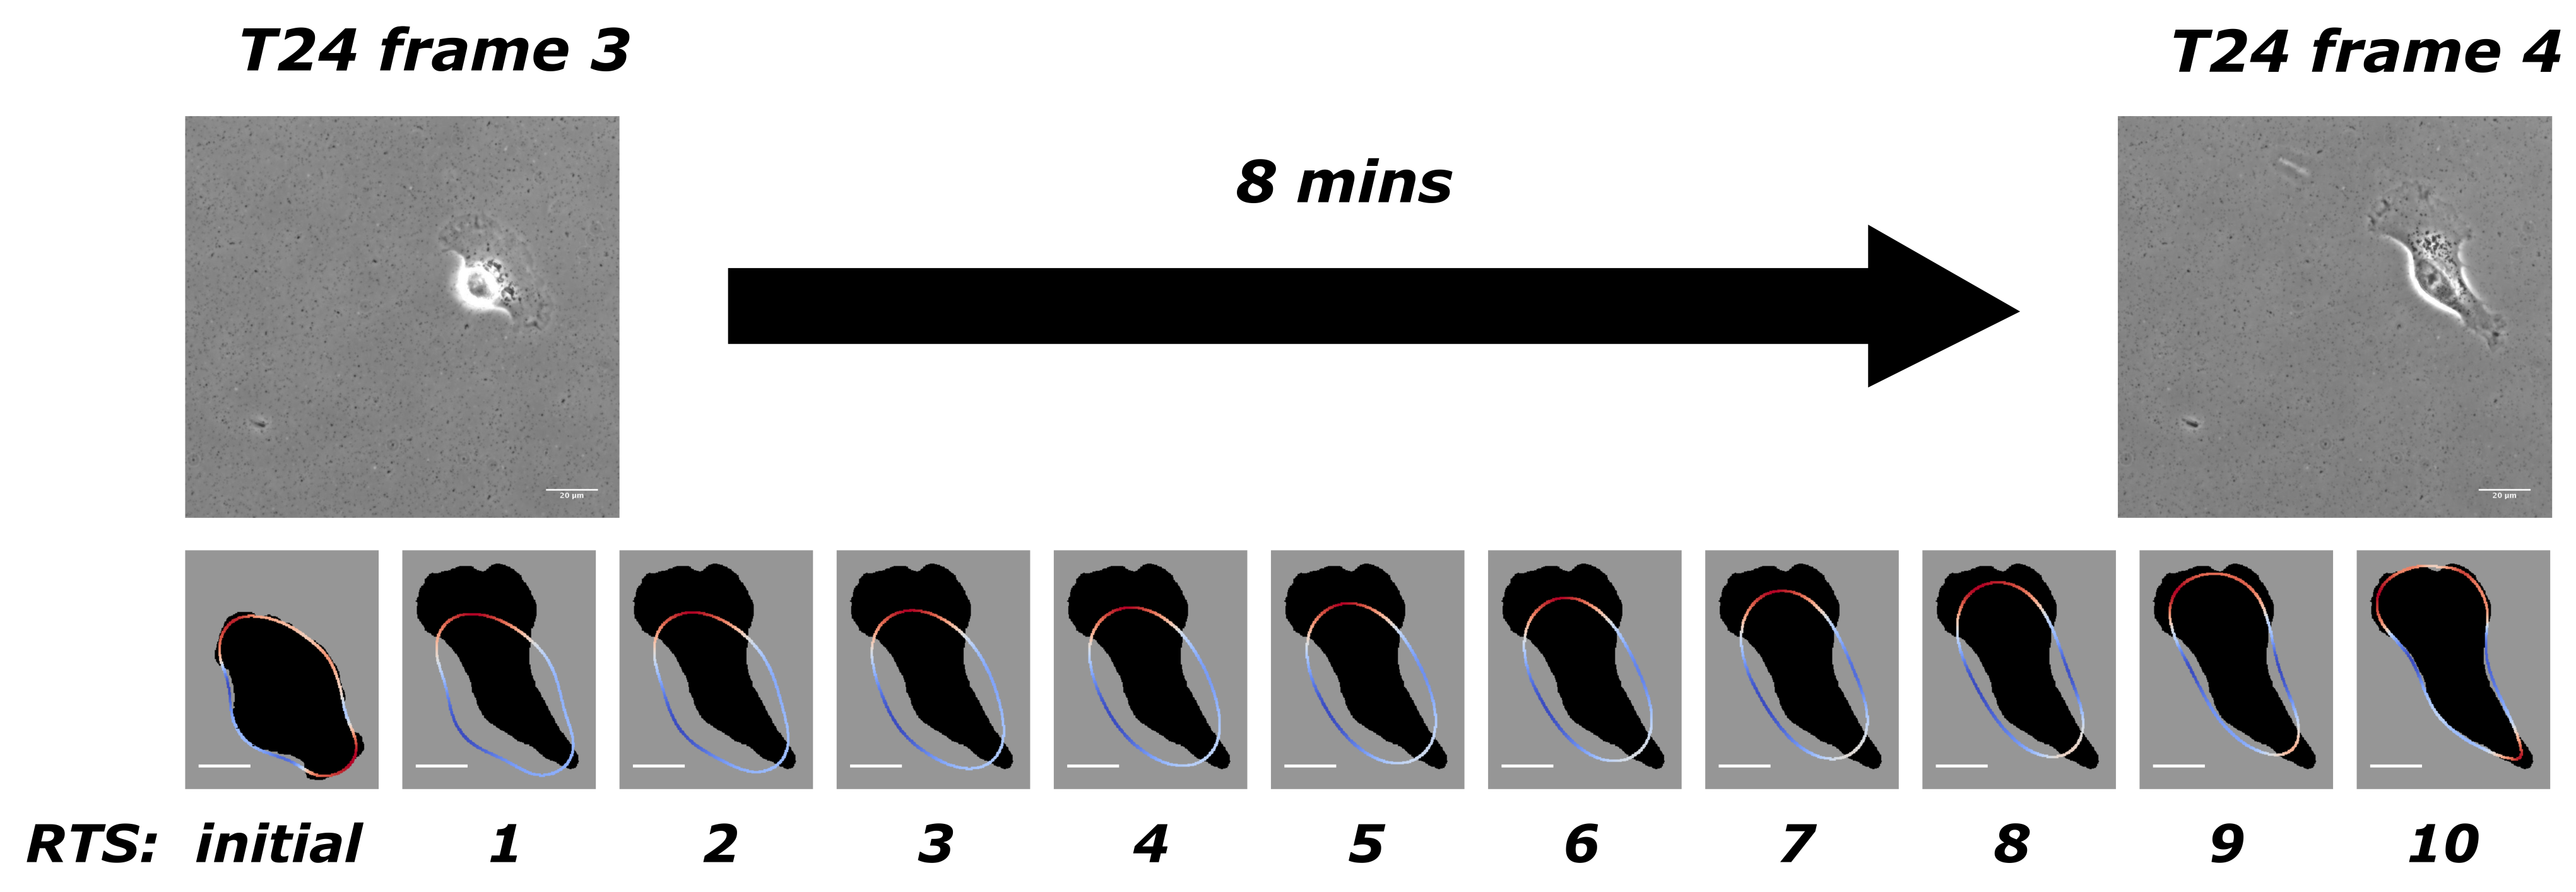
27]. Our approach gives us the computed cell positions together with the estimated force such that the motion of the cells under our model recreates the observed motion from the imaging data. We use
Figure 1 to illustrate our model when applied to experimental data from T24 cell line [
30]. There is an 8-min gap between two adjacent frames in this experiment, and we take frames 3 and 4, for example. Our discretisation yields 10 time steps between these two frames. The first row in
Figure 1 has two adjacent frames from the experimental data, and the second row shows the initial computed cell outline (obtained from the previous computation covering frames 2 to 3) and solutions at the 10 time steps with the computed optimal force. The solution from the 10th time step would then be used as the initial shape to compute the next stretch between frames 4 and 5. The dark shadow in the background shows the target shape as the objective, which is the shape of the cell from frame 4. This process continues successively throughout the full dataset.
As an example in
Figure 2, we present the first frame of our results on T24. We show the original image from T24 experiment [
30] on the top-left; our segmentation of the shape of the T24 cancer cell on the top-right (this segmentation technique is a combination of Otsu and edge detection, we refer the reader to [
27,
37] for more details); on the bottom-left, we demonstrate the interfacial region of the cell, its centroid position, and we continually overlay the cell shapes as the cell migrates. On the bottom right, we show the exerted forces where we use colour coding (red as protrusion and blue as retraction) to illustrate the location and amount of forces exerted on the cellular interfacial region, representing the cell membrane
In
Table 4, we summarise both protrusion and retraction forces re-created during the simulations of keratocyte migration (shown in
Figure 2 and video in
Appendix A). Each experimental image serves as a starting position or a goal. Our estimated forces are evaluated between adjacent frames. For the keratocyte [
29], the actual real-world time between frames is 20 s. In
Table 4, we show the average cell membrane length from our simulation in
m, the accumulated forces, the number of reconstructed time steps (denoted by
throughout), and the percentage of cell membrane where protrusion or retraction forces are exerted.
Our results on the epithelial bladder cancer cell T24 [
30] are shown in
Table 5. The layout of the table and its corresponding video in
Appendix A are very similar to the keratocyte simulation.
The results of the epithelial kidney cancer cell MDCK [
31] are shown in
Table 6 and are presented in the similar manner, apart from an additional diagram shown in the corresponding video in
Appendix A on the right-hand side.
We note that making direct comparisons of our results with experimental studies is challenging since other forces relevant to migration, such as traction forces generated through interactions with the substrate, are neglected in our model and often membrane forces are not directly measured. However, our results are consistent with available experimental results which attempt to measure retractive and/or protrusive forces generated by migrating cells; these results conclude that the total force exerted by the cells is of the order of 10s of Nano-Newtons [
38].
Geometric Quantities That Are of Biological Interest
Based on the computed phase field information, we can compute important and biologically relevant geometric information that is of significant interest to experimentalists. Through simple post-processing of the model outputs, we may obtain geometric quantities such as circularity, curvature and elastic energy of the membrane. We demonstrate one such post-processed quantity of interest by considering a dataset that consists of multiple cells undergoing division and demonstrating how our approach allows us to quantify cell proliferation rates, and also demonstrate geometrically, the cell division process. To proceed, we first state how to compute the Euler number of the cell membranes which in effect corresponds to the total number of cells present in the simulation. The Euler number, in two dimensions in the phase-field formulation is given by [
39]
Here
is the computed phase-field function. As this number corresponds to the number of cells present, it is extremely useful as it gives us the means to automatically track events such as cell division and cell fusion during the process of cell migration. This approach is extremely valuable as it could automate an otherwise laborious task of counting division, fusion or death events and removes the need for genetic manipulations which would be required to highlight such events. We illustrate this in the video in
Appendix A related to the kidney cancer cell MDCK [
31] where a number of cell divisions occur during the video and these are tracked accurately by the Euler number of the computed phase field.
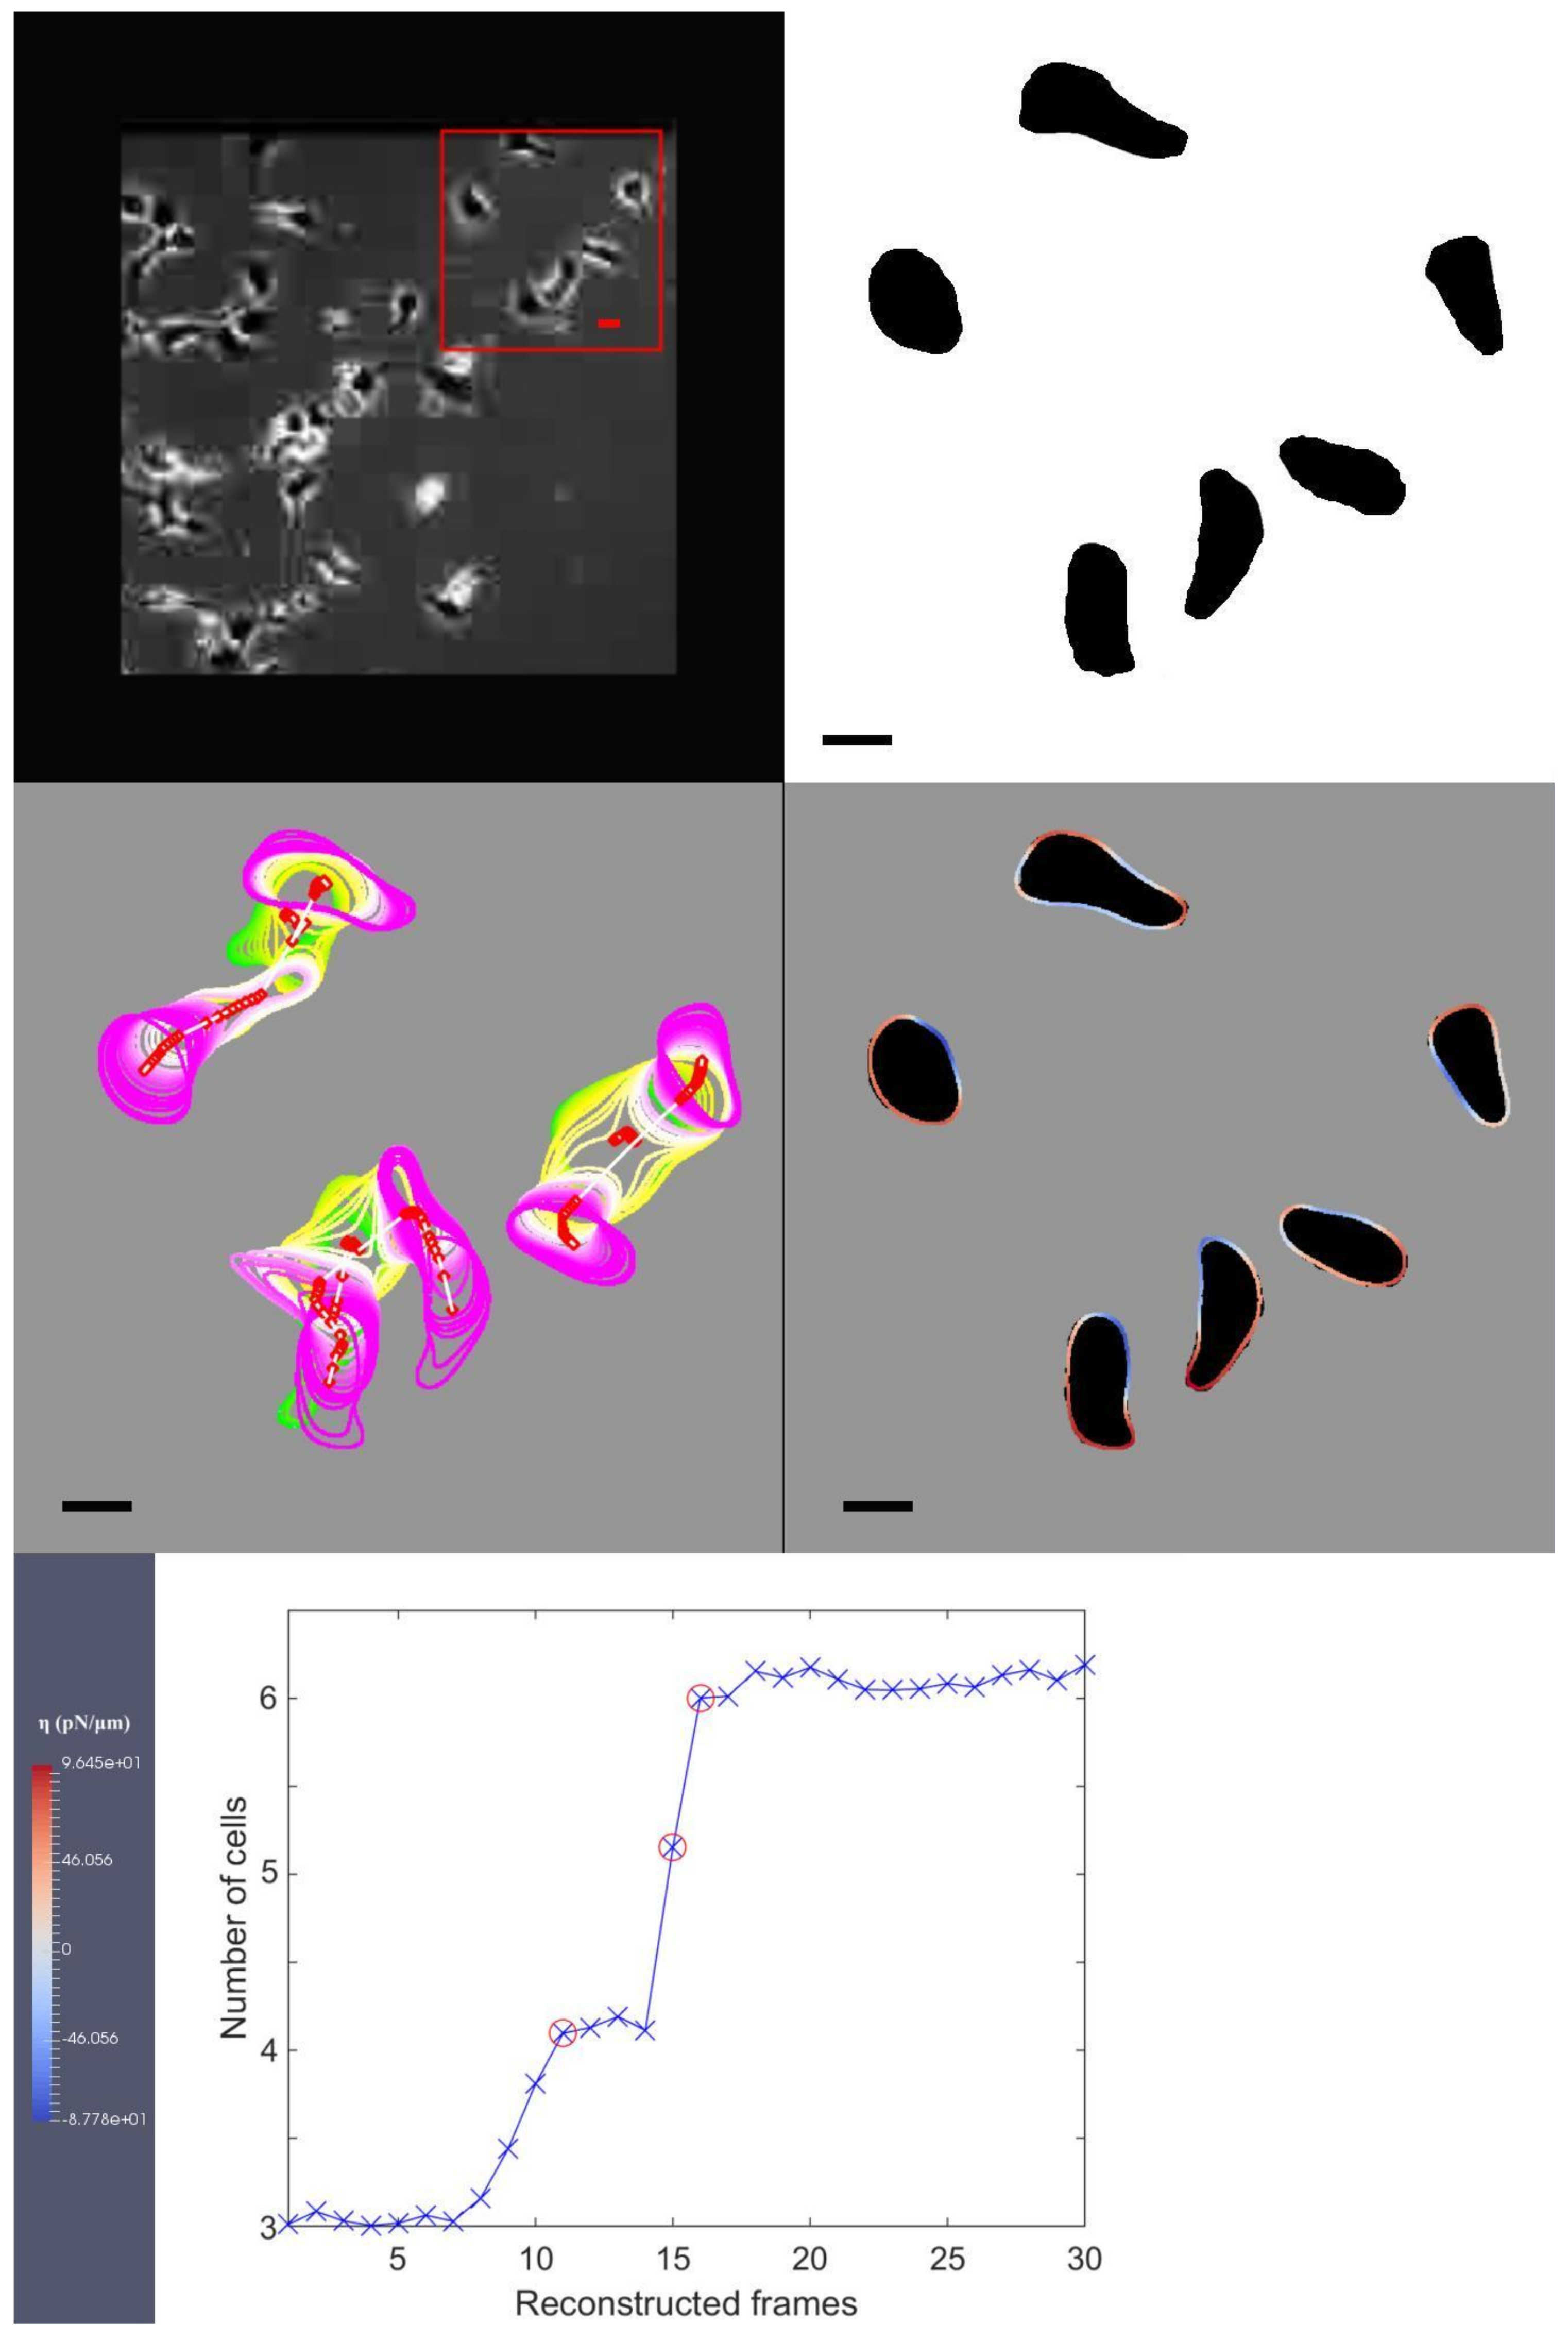
For completeness, we include the final frame of the result video on the kidney cancer cell MDCK in
Figure 3. In this figure, the original image from the experimental observation is shown as the first image on the first row, with a red box highlighting our choice of three cells used in our simulation. The second image on the first row illustrates the segmentation of the corresponding cells in the first image on the first row. The first image on the second row shows the interfacial region of the selected cells and their centroid points. In this sub-figure, we continually overlay the cell shapes and portions as they migrate. We use red for protrusion and blue for retraction forces to identify the regions where they are exerted around the cellular interfacial region. The dark shadows in the background illustrate the targeted shapes our model is replicating, and the bar on the right-hand side shows the maximum and minimum amount of forcing that the colour coding is illustrating. The only image on the third row shows our Euler number from Equation (
5) computed at each RTS. Within this data, the initial three cells are divided into six cells, and we use red circles to indicate the cell division events in this graph.
5. Conclusions
A number of recent studies such as [
10] remark that small changes in mechanical forces generated from individual cells can lead to fundamental changes at tissue levels. However, as [
8] indicates, it is technologically challenging to simply measure those forces during experiments, such as during the process of cell migration.
In this work, we estimate the forces exerted by migrating cells by computing ‘optimal’ forces such that a mathematical model for cell migration best fits observed imaging data. In this paper, we took experimental data of three different cell types: keratocyte in [
29], epithelial bladder cancer cell from the T24 cell line in [
30], and epithelial kidney cancer cell from the MDCK cell line in [
31]. For each case, we demonstrate how we re-create the observed cell migration and summarise the protrusion and retraction forces generated under our model. We also note our approach is applicable to multiple cells and can be applied in three dimensions, given appropriate datasets in 3D. Our approach could also allow us to access biologically relevant quantities such as membrane length, circularity and curvatures. We demonstrate one example using the MDCK cell line dataset [
31] in which a number of cell divisions occur during the evolution. Our approach deals robustly with this setting allowing accurate quantification of cell proliferation rates which is generally cumbersome if carried out manually. Moreover, we provide a means of tracking (automatically) the number of cells present which could be of practical use if one wishes to measure the rate of cell divisions, cell death or cell fusion.
Our proposed approach is amenable to further improvements and these include computing more accurate measurements of parameters such as friction force and surface tension as well as more refined modelling of migration itself. We note that it would be relatively straightforward to extend our simulations to three space dimensions, which would enable the recreation of more accurate cells and their environments [
27] but a major challenge in this case is obtaining sufficiently high-resolution imaging data. As [
43] states, cell-matrix adhesions and cytoskeletal organisation could be different in 2D and 3D measurements, and may alter key cell responses, including morphology, migration and proliferation. We also note that in principle this approach can be adapted to more complex models of cell migration and this is merely a proof-of-concept study illustrating the utility of our approach.


 ,
, 


