
A Framework for Detecting Thyroid Cancer from Ultrasound and Histopathological Images Using Deep Learning, Meta-Heuristics, and MCDM Algorithms

 , , , , , and
Abstract
:1. Introduction
1.1. Background
1.2. Research Gap
- Transformer and Mixer models have not yet explored for thyroid image feature extraction. Most studies took place using CNN models.
- The dimensionality reduction techniques have not been analyzed on extracted features from Transformer and Mixer models.
- The FOX optimization algorithm has neither been applied for feature selection nor for weighted average ensemble learning.
- MEREC weighting with the TOPSIS method has not been evaluated for thyroid cancer application.
- The performance of the CAD model for thyroid cancer diagnosis needs to be improved for much better results.
- The proposed model needs to be evaluated on imbalanced thyroid datasets using a stratified sampling technique for efficient class representation.
1.3. Our Contribution
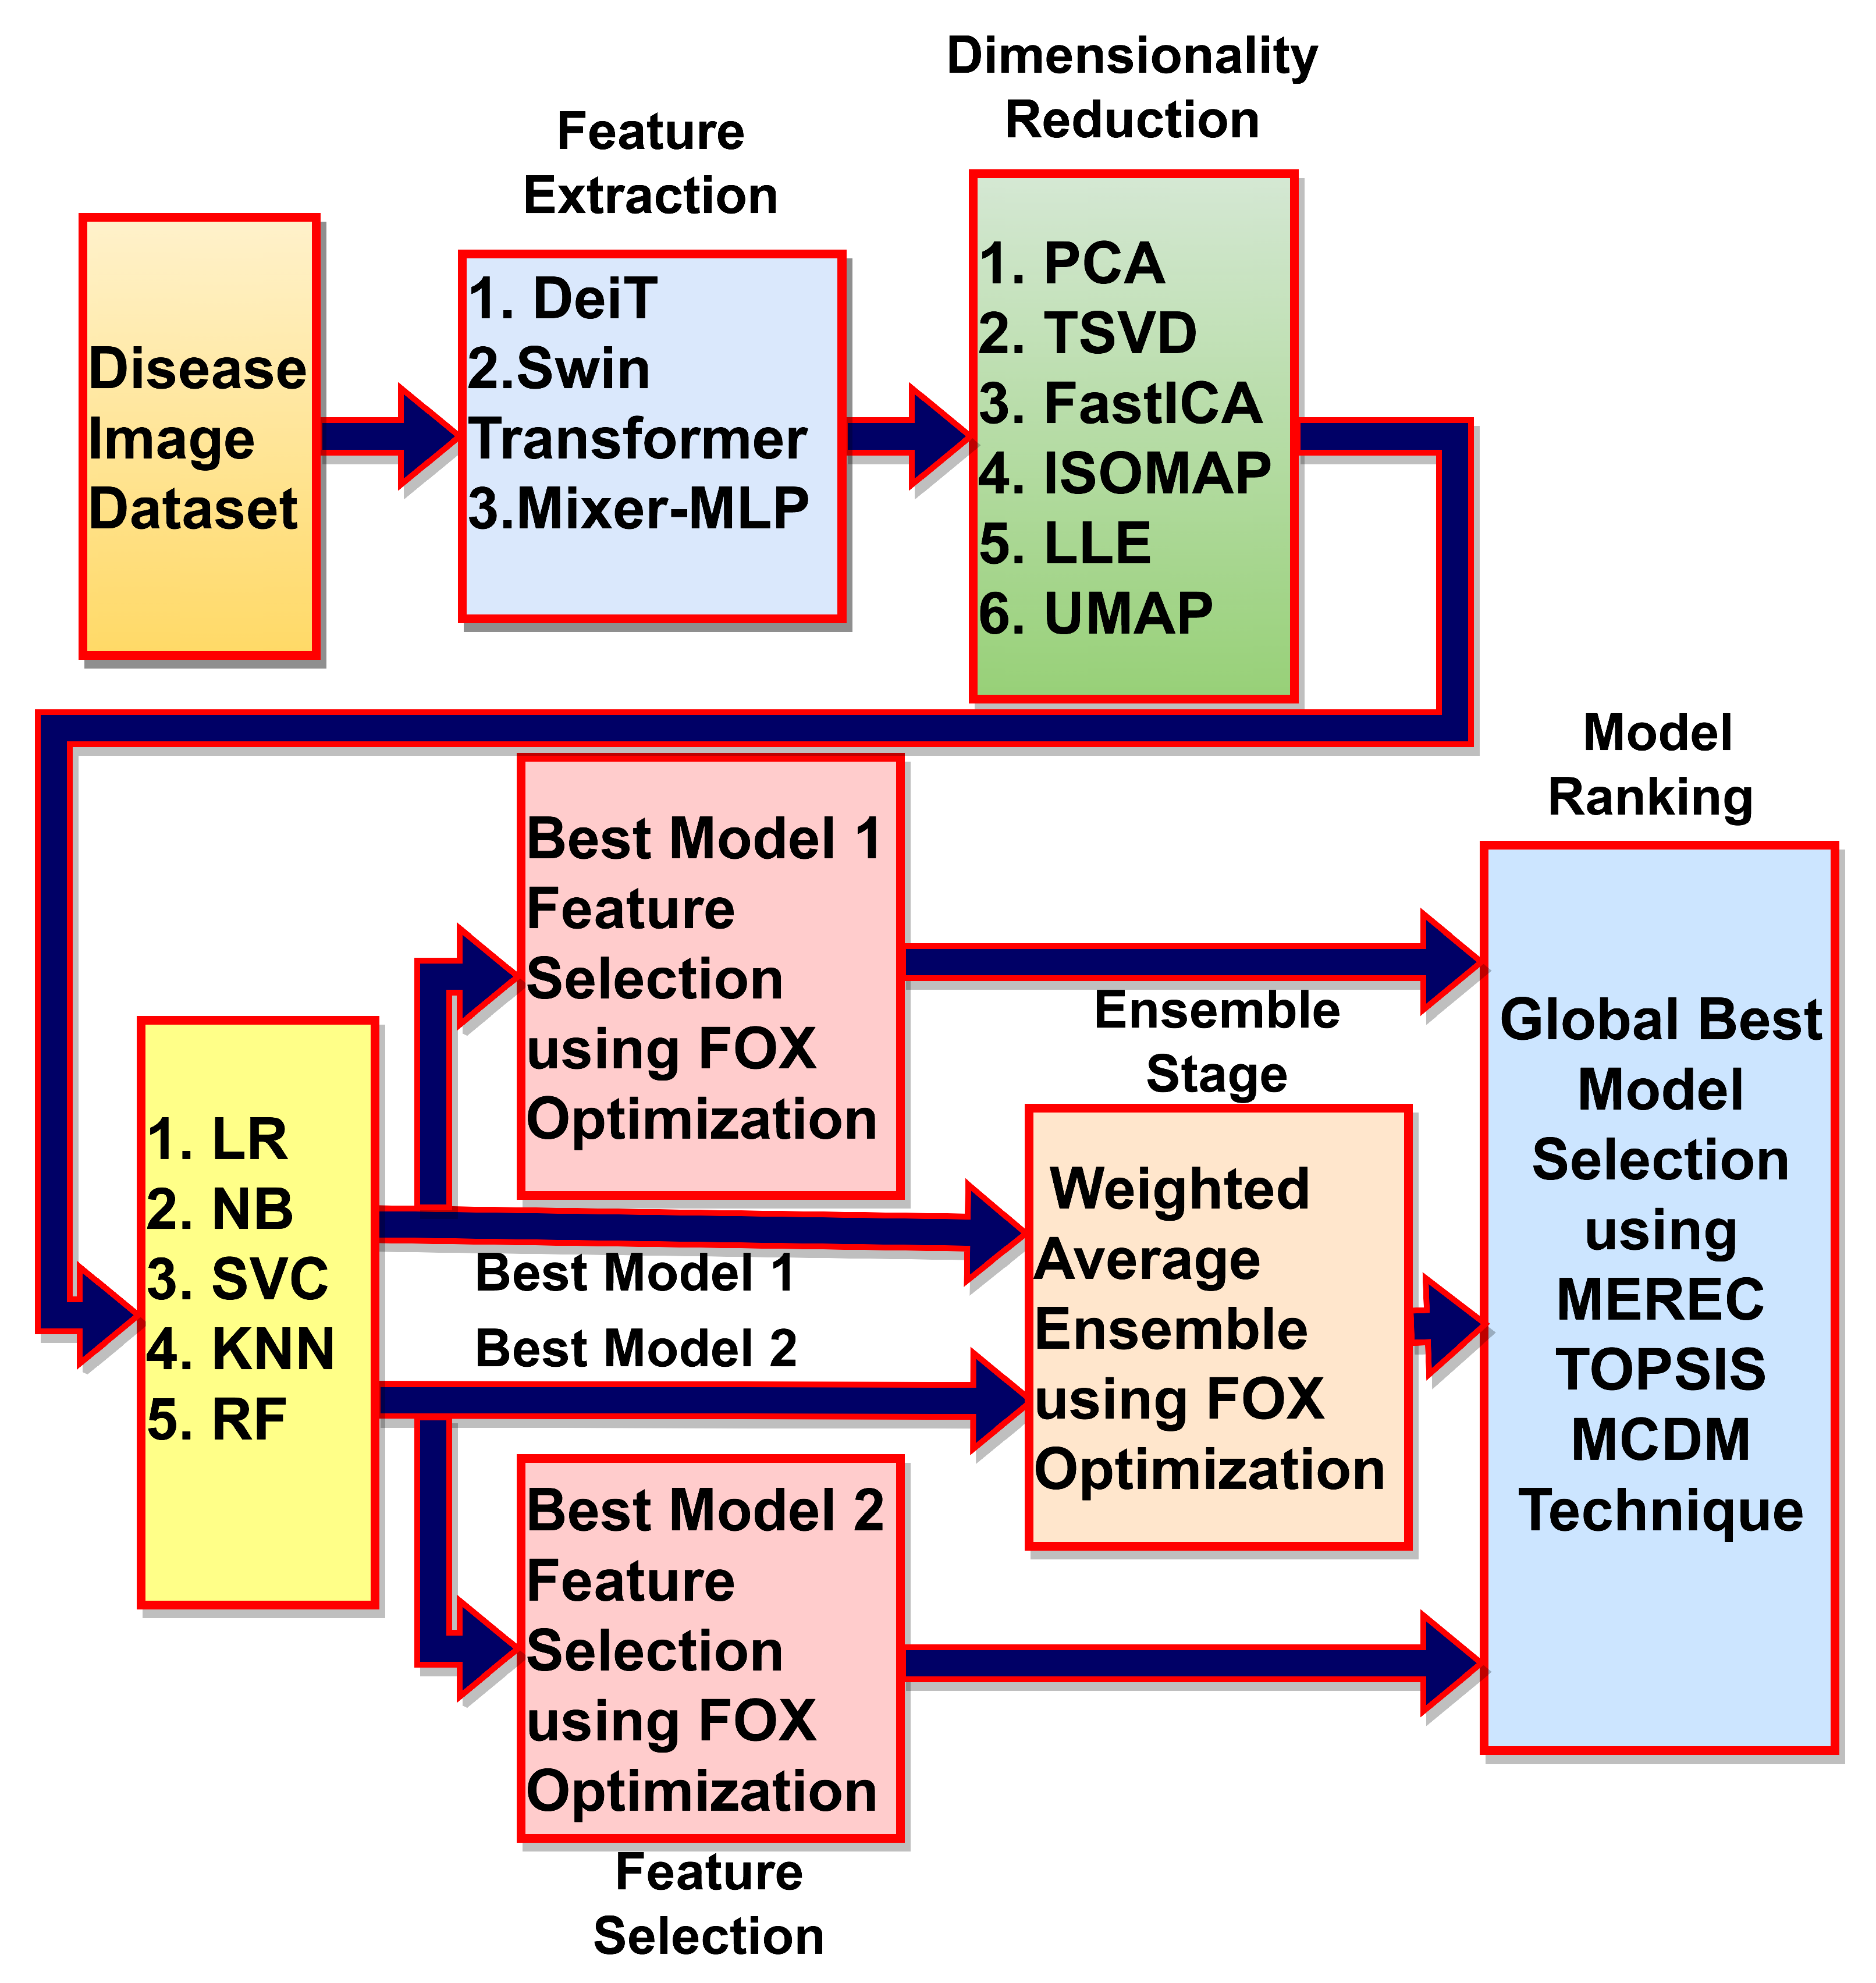
- This work uses three deep learning-based feature extraction techniques (Deit, Swin Transformer, and Mixer-MLP) to extract feature vectors from histopathological and ultrasound images.
- Six feature reductions (PCA, TSVD, FastICA, ISOMAP, LLE, and UMAP) techniques are used to reduce the dimensionality of the extracted feature space.
- The MEREC-TOPSIS technique ranks and selects the best-evaluated models at different stages.
- The recently invented FOX optimization algorithm is used for feature selection and weighted average ensemble learning.
- The ensemble and feature selection-based models are ranked at the last stage, and the best model is compared with the state-of-the-art techniques.The proposed framework demonstrates the analysis as well as the applicability of the Transformer, Mixer, dimensionality reduction, feature selection, FOX optimization, and MEREC-TOPSIS techniques in thyroid cancer detection. The proposed framework also explores the weighted average ensemble using the FOX optimization algorithm, and a comparative study is also shown in this study. The framework showed combinational novelty in the process and outperformed the existing techniques. According to the review of the existing literature, this technique is novel and has not been employed by any researchers previously for detecting thyroid cancer.
2. Materials, Methods and Theoretical Overview
2.1. Materials
- Ultrasound dataset: While several studies have investigated ultrasound imaging for thyroid cancer diagnosis, most data sources used in these studies are not publicly available. Gathering a significant amount of data is challenging due to time constraints, the precise nature of medical modalities, the need for patient involvement, and the cost of image collection equipment. The Thyroid Digital Image Database (TDID) was used in this study to address these difficulties. The TDID dataset, collected by Pedraza et al. [36] and published by the Universidad Nacional de Colombia in 2015, is publicly available. The dataset consists of 298 patients involved in the data collection process. The dataset has previously been used in research to address thyroid nodule classification challenges, and it contains TIRAD scores and nodule localization details for each patient, with one or more samples taken from each patient. Each ultrasound image in the dataset is 560 × 360 pixels in size. The TI-RADS score indicates the health of the thyroid nodule and can range from 1 to 5. Scores 1, 2, and 3 indicate benign thyroid nodules, while scores 4a, 4b, 4c, and 5 show malignant thyroid nodules. The images which contain benign thyroid nodules are treated as cancerous images, whereas the images with malignant nodules are treated as non-cancerous thyroid samples. The dataset is used for binary class classification problems. There are a total of 347 thyroid nodule sample images retrieved from 298 patients. Out of 347 images, 286 images contain thyroid nodules with TI-RADS scores less than 4 and are considered non-cancerous (benign) thyroid cases. The remaining 61 images have TI-RADS scores greater than or equal to 4 and are treated as cancerous (malignant) samples. The dataset is highly imbalanced, and hence stratified oversampling is proposed to evaluate the performance.
- Histopathological Dataset: For histopathological thyroid images, the dataset is provided by Thompson et al. on request. The dataset developed by Tharun and Thompson [37] includes a group of 156 thyroid gland tumors obtained from the pathology archives at the University Clinic Schleswig-Holstein, Campus Luebeck (138 tumors) and the Woodland Hills Medical Center, Woodland Hills, California (18 tumors). A single hematoxylin and eosin-stained section was selected from each tumor and scanned using the Ventana iScan HT (Roche Diagnostics, Basel, Switzerland). The whole slide images were captured at 40× magnification with a resolution of 0.23 μm/px and processed as 8-bit color depth RGB images. Two pathologists independently classified each whole slide image, and any confusion was resolved through discussion to reach a consensus for each case. The dataset comprised five distinct entities: follicular thyroid carcinoma (FTC) with 32 patients, follicular thyroid adenoma (FA) with 53 patients, noninvasive follicular thyroid neoplasm with papillary-like nuclear features (NIFTP) with 9 patients, follicular variant papillary thyroid carcinoma (FVPTC) with 9 patients, and classical papillary thyroid carcinoma (PTC) with 53 patients. Oncocytic neoplasms, which can be easily classified based on cytoplasmic and architectural features, were excluded from the dataset. To facilitate the experiments and make the problem a binary classification task, the five different entities were combined into two groups: non-PTC-like (FTC, FA, 85 patients) and PTC-like (NIFTP, FVPTC, and PTC, 71 patients). From each whole slide image, a pathologist extracted representative images from the neoplastic areas. In 147 out of 156 entities, ten non-overlapping images of size 1916 × 1053 px were extracted from the neoplastic areas. However, only one to six images were available for the remaining nine cases with small neoplasm areas.
2.2. Methodology
2.2.1. Dataset Cleaning
2.2.2. Feature Extraction
2.2.3. Feature Reduction
2.2.4. Feature Selection
2.2.5. Weighted Average Ensemble
2.2.6. Optimal Model Selection
2.3. Theoretical Overview
2.3.1. Feature Extraction Techniques
- Data-efficient image Transformer: The data-efficient Image Transformer (DeiT) was proposed by Touvron et al. [28] and comprises three main components, namely knowledge distillation, regularization, and augmentation. The model involves two models used for training, the teacher model (pre-trained RegNetY-16GF) and the student model (Vision Transformer). Initially, the student network is trained on the dataset, and the cross-entropy loss is calculated. The knowledge distillation component is critical in the DeiT model, wherein a pre-trained model calculates the output probabilities for different classes with the soft-max of a specific temperature parameter. These probabilities are compared with the ground truth, and the distillation loss is calculated. The cross-entropy and distillation losses are added together, and the overall estimated loss function is used to train the student model. Many versions of DeiT models are available, and this study employed the DeiT-Small model with 22 million parameters.
- Swin Transformer: According to Liu et al. [27], the Swin Transformer is an architecture that builds upon the Vision Image Transformer (ViT), but instead of a uniform patch size, it uses a hierarchical patch structure. The Swin Transformer comprises four key components: patch partitioning, linear embedding, Swin Transformer block, and patch merging layer. For feature extraction in our work, a pre-trained Swin Transformer (Swin-S version) is utilized, which has 50 million parameters and a linear projection dimension of 96. In the Swin Transformer, the Transformer layer uses limited attention and replaces the standard multi-head attention with shifted-window multi-head attention (Shifted-MSA). The patch merger layer is utilized to merge neighboring patches. Compared to ViT, the Swin Transformer is better at capturing detailed image descriptions.
- Mixer-MLP: Tolstikhin and colleagues [26] introduced Mixer-MLP for vision tasks. This straightforward design is founded on a multi-layer perceptron. The picture is partitioned into patches and projected into linear embeddings, also known as tokens. Two types of MLP layers are present. The channel mixing layer operates on each token independently, while the token mixing layer enables communication among all the channels. Before classification, the global pooling layer and skip connections are utilized at the output. In this research, the pre-trained B-16 version of mixer-MLP is employed.
2.3.2. Dimensionality Reduction Techniques
- Principal component analysis: PCA is a mathematical method that converts multiple correlated variables into a smaller group of uncorrelated variables known as principal components. This technique identifies linear combinations of variables that capture the most variation in the data. The derived principal components can be further analyzed or visualized.
- Truncated singular value decomposition: TSVD, or truncated singular value decomposition, is a method used to decompose a matrix into its singular values and corresponding vectors. Unlike the full SVD, TSVD only keeps the top singular values and vectors, allowing for more efficient computation and reduced noise and dimensionality. TSVD can also help with ill-conditioned matrices, where the full SVD may fail to converge.
- Fast independent component analysis: Fast independent component analysis (FastICA) is a popular independent component analysis (ICA) method. It is a computational technique that separates a multivariate signal into independent, non-Gaussian components. FastICA identifies the underlying sources of variability in the data by maximizing the independence between the extracted components. FastICA has the advantage of being fast, computationally efficient, and flexible.
- Isometric feature mapping: Isometric feature mapping (ISOMAP) is a nonlinear dimensionality reduction technique preserving the geodesic distances between the data points. It works by constructing a neighborhood graph based on the Euclidean distances between the data points and then approximating the geodesic distances on the manifold by finding the shortest path through this graph. The final embedding is obtained through classical multidimensional scaling (MDS) of the geodesic distances. ISOMAP has been shown to be effective in preserving the global structure of the data, especially in cases where the data lie on a low-dimensional nonlinear manifold embedded in a high-dimensional space.
- Locally linear embedding: Locally linear embedding (LLE) is a nonlinear technique that aims to reduce the dimensionality of data. The method calculates the local relationships between points and their neighbors and uses these relationships to construct a lower-dimensional representation of the data. It is useful for nonlinear manifolds, where linear techniques like PCA may not work well.
- Uniform manifold approximation and projection: Uniform manifold approximation and projection (UMAP) is a non-linear dimensionality reduction technique that constructs a high-dimensional graph of the data points and then optimizes a low-dimensional graph that preserves the topology and geometry of the high-dimensional graph. UMAP can handle complex and non-linear relationships between data points and is often faster and more scalable than other non-linear techniques, like t-SNE.
2.3.3. Meta-Heuristic Algorithm for Feature Selection
- FOX optimization algorithm: This algorithm, proposed in 2022, imitates the behavior of a red fox when it is hunting its prey in the snow [33]. The algorithm consists of five main steps. First, the fox searches for prey randomly as the snow covers the ground. Then, it uses ultrasound to locate the prey and moves closer to it. Next, it determines the distance between itself and the prey by analyzing the sound and time difference. After that, it calculates the necessary jump to catch the prey. Finally, the algorithm performs random walking based on the minimum time and the best position to continue searching for prey. The optimization algorithm considers exploration and exploitation to reach the best global solution.
2.3.4. MCDM Method for Ranking the Models
- Method based on the removal effects of criteria: The method based on the removal effects of criteria (MEREC) method is a new objective weighting method that uses the removal effects of criteria in the decision matrix to determine their importance. Unlike the other methods, MEREC focuses on an exclusion perspective and removal effects to determine the objective criteria weights instead of the inclusion perspective.
- Technique for order of preference by similarity to ideal solution: The technique for order of preference by similarity to ideal solution (TOPSIS) is a decision-making method that evaluates alternatives based on their proximity to an ideal solution and distance to a negative ideal solution. To use TOPSIS, one constructs a normalized decision matrix, weights it, calculates the ideal and negative ideal solutions, and computes the separation measures for each alternative. The technique ranks alternatives by their proximity to the ideal solution and the importance of each criterion. This method is frequently used in fields such as finance, engineering, and management to assist with decision making.
3. Simulation-Based Experimental Results
4. Discussion
5. Conclusions
5.1. Findings
- For both datasets, the RF classifier achieved the best performance results when combined with any of the three feature extraction techniques. The LR has the worst performance parameters with DeiT as a feature extraction model for histopathological datasets, whereas the NB classifier with Swin Transformer provides the worst TOPSIS score value for the ultrasound dataset.
- Swin Transformer has the best feature extraction capabilities and is ranked as the best feature extractor among the three techniques employed in our study.
- The study showed that the PCA outperformed all other five dimensionality reduction techniques for both datasets, whereas UMAP obtained the poorest results.
- The research study also demonstrated the feature selection capabilities of the FOX optimization algorithm. The best model is based on Swin Transformer, PCA, and RF with FOX optimization for feature selection purposes for both datasets. For the histopathological dataset, the LLE dimensionality reduction technique also showed promising results closer to the best PCA-based model, whereas the ISOMAP has a close contest with the PCA for the ultrasound dataset.
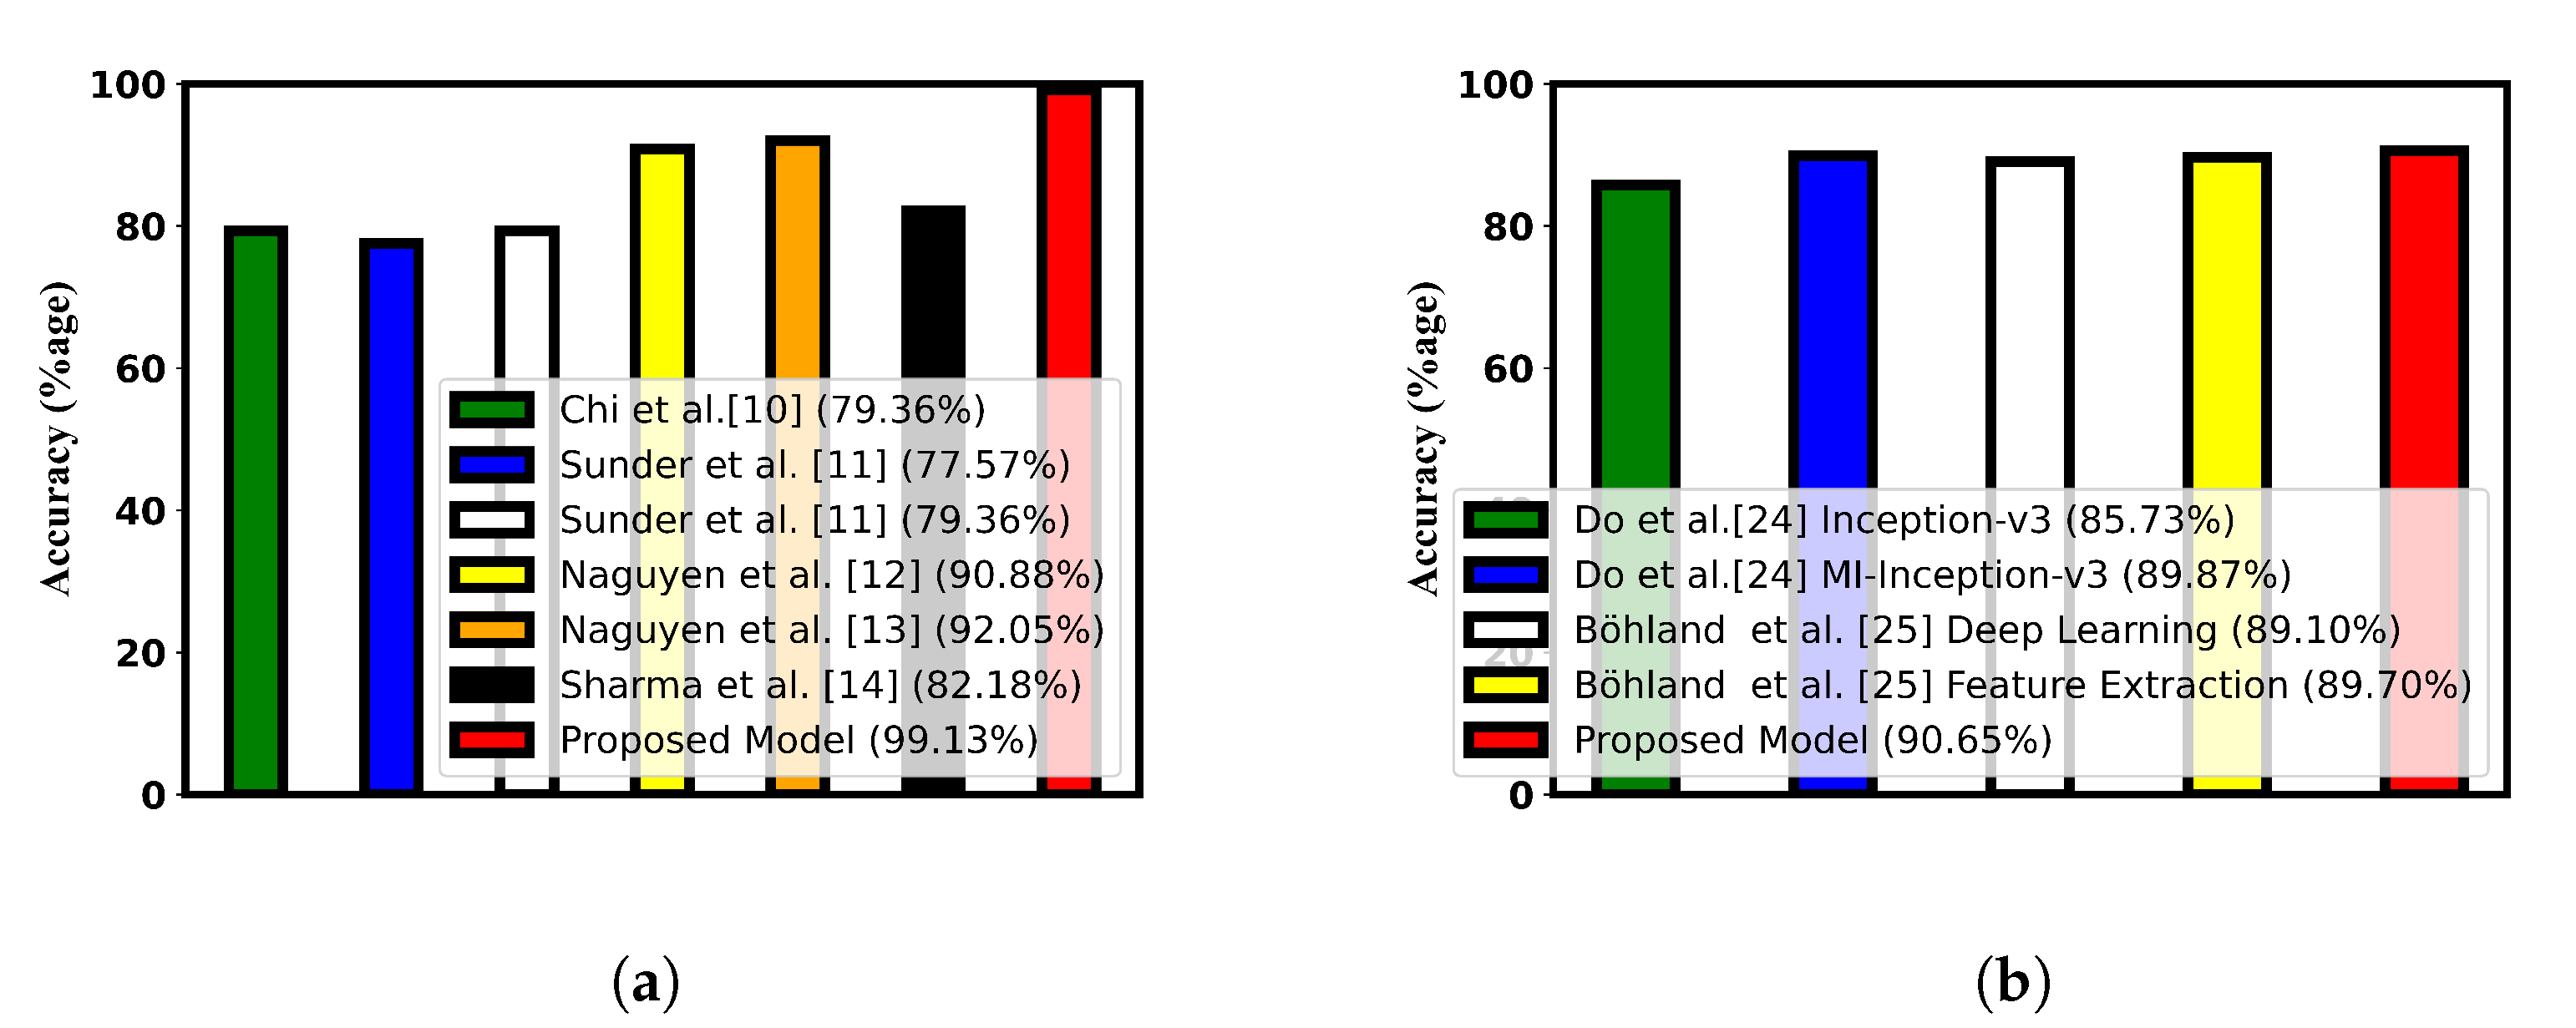
- The proposed framework outperforms all the existing state-of-the-art performance results obtained on both datasets. The F-score comparison showed that the proposed framework can also deal with the class imbalance issue as compared to the available methods proposed in the literature. By achieving higher values of specificity, the proposed model effectively reduced the false positive rate, which can lead to a decrease in the cost of medical procedures and a reduction in mental pressure on patients.
5.2. Limitations
- Although the proposed framework used a generalized process and can be utilized on any image dataset, this article only focused on two thyroid image datasets. This is due to the unavailability of the publicly standard thyroid datasets. Most of the existing studies demonstrated the performance of their proposed models on private datasets.
- The thyroid datasets are heterogeneous in nature and obtained from external sources. However, they are generalized frameworks and can be utilized in disease detection from any medical image dataset.
5.3. Real Life Applicability
5.4. Future Scope
Author Contributions
Funding
Institutional Review Board Statement
Informed Consent Statement
Data Availability Statement
Conflicts of Interest
References
- Evron, J.M.; Reyes-Gastelum, D.; Banerjee, M.; Scherer, L.D.; Wallner, L.P.; Hamilton, A.S.; Ward, K.C.; Hawley, S.T.; Zikmund-Fisher, B.J.; Haymart, M.R. Role of patient maximizing-minimizing preferences in thyroid cancer surveillance. J. Clin. Oncol. 2019, 37, 3042. [Google Scholar] [CrossRef] [PubMed]
- Garg, A.; Mago, V. Role of machine learning in medical research: A survey. Comput. Sci. Rev. 2021, 40, 100370. [Google Scholar] [CrossRef]
- Reading, C.C.; Gorman, C.A. Thyroid imaging techniques. Clin. Lab. Med. 1993, 13, 711–724. [Google Scholar] [CrossRef]
- Abdelsamea, M.M.; Zidan, U.; Senousy, Z.; Gaber, M.M.; Rakha, E.; Ilyas, M. A survey on artificial intelligence in histopathology image analysis. Wiley Interdiscip. Rev. Data Min. Knowl. Discov. 2022, 12, e1474. [Google Scholar] [CrossRef]
- Xu, P.; Du, Z.; Sun, L.; Zhang, Y.; Zhang, J.; Qiu, Q. Diagnostic Value of Contrast-Enhanced Ultrasound Image Features under Deep Learning in Benign and Malignant Thyroid Lesions. Sci. Program. 2022, 2022. [Google Scholar] [CrossRef]
- Zhao, X.; Shen, X.; Wan, W.; Lu, Y.; Hu, S.; Xiao, R.; Du, X.; Li, J. Automatic Thyroid Ultrasound Image Classification Using Feature Fusion Network. IEEE Access 2022, 10, 27917–27924. [Google Scholar] [CrossRef]
- Rehman, H.A.U.; Lin, C.Y.; Su, S.F. Deep learning based fast screening approach on ultrasound images for thyroid nodules diagnosis. Diagnostics 2021, 11, 2209. [Google Scholar] [CrossRef]
- Liang, X.; Yu, J.; Liao, J.; Chen, Z. Convolutional neural network for breast and thyroid nodules diagnosis in ultrasound imaging. BioMed Res. Int. 2020, 2020, 1763803. [Google Scholar] [CrossRef] [PubMed]
- Liu, T.; Guo, Q.; Lian, C.; Ren, X.; Liang, S.; Yu, J.; Niu, L.; Sun, W.; Shen, D. Automated detection and classification of thyroid nodules in ultrasound images using clinical-knowledge-guided convolutional neural networks. Med. Image Anal. 2019, 58, 101555. [Google Scholar] [CrossRef]
- Chi, J.; Walia, E.; Babyn, P.; Wang, J.; Groot, G.; Eramian, M. Thyroid nodule classification in ultrasound images by fine-tuning deep convolutional neural network. J. Digit. Imaging 2017, 30, 477–486. [Google Scholar] [CrossRef]
- Sai Sundar, K.; Rajamani, K.T.; Siva Sankara Sai, S. Exploring Image Classification of Thyroid Ultrasound Images Using Deep Learning. In Proceedings of the International Conference on ISMAC in Computational Vision and Bio-Engineering 2018 (ISMAC-CVB), Palladam, India, 16–17 May 2018; Springer: Berlin/Heidelberg, Germany, 2019; pp. 1635–1641. [Google Scholar]
- Nguyen, D.T.; Pham, T.D.; Batchuluun, G.; Yoon, H.S.; Park, K.R. Artificial intelligence-based thyroid nodule classification using information from spatial and frequency domains. J. Clin. Med. 2019, 8, 1976. [Google Scholar] [CrossRef]
- Nguyen, D.T.; Kang, J.K.; Pham, T.D.; Batchuluun, G.; Park, K.R. Ultrasound image-based diagnosis of malignant thyroid nodule using artificial intelligence. Sensors 2020, 20, 1822. [Google Scholar] [CrossRef] [PubMed]
- Sharma, R.; Kumar Mahanti, G.; Panda, G.; Singh, A. Thyroid Nodules Classification using Weighted Average Ensemble and D-CRITIC based TOPSIS Methods for Ultrasound Images. Curr. Med. Imaging 2023, 20, 18. [Google Scholar]
- Wong, C.M.; Kezlarian, B.E.; Lin, O. Current status of machine learning in thyroid cytopathology. J. Pathol. Inform. 2023, 14, 100309. [Google Scholar] [CrossRef]
- Fiorentino, V.; Pizzimenti, C.; Franchina, M.; Micali, M.G.; Russotto, F.; Pepe, L.; Militi, G.B.; Tralongo, P.; Pierconti, F.; Ieni, A.; et al. The minefield of indeterminate thyroid nodules: Could artificial intelligence be a suitable diagnostic tool? Diagn. Histopathol. 2023, 29, 396–401. [Google Scholar] [CrossRef]
- Hirokawa, M.; Niioka, H.; Suzuki, A.; Abe, M.; Arai, Y.; Nagahara, H.; Miyauchi, A.; Akamizu, T. Application of deep learning as an ancillary diagnostic tool for thyroid FNA cytology. Cancer Cytopathol. 2023, 131, 217–225. [Google Scholar] [CrossRef] [PubMed]
- Kezlarian, B.; Lin, O. Artificial intelligence in thyroid fine needle aspiration biopsies. Acta Cytol. 2021, 65, 324–329. [Google Scholar] [CrossRef] [PubMed]
- Alabrak, M.M.A.; Megahed, M.; Alkhouly, A.A.; Mohammed, A.; Elfandy, H.; Tahoun, N.; Ismail, H.A.R. Artificial intelligence role in subclassifying cytology of thyroid follicular neoplasm. Asian Pac. J. Cancer Prev. APJCP 2023, 24, 1379. [Google Scholar] [CrossRef] [PubMed]
- Girolami, I.; Marletta, S.; Pantanowitz, L.; Torresani, E.; Ghimenton, C.; Barbareschi, M.; Scarpa, A.; Brunelli, M.; Barresi, V.; Trimboli, P.; et al. Impact of image analysis and artificial intelligence in thyroid pathology, with particular reference to cytological aspects. Cytopathology 2020, 31, 432–444. [Google Scholar] [CrossRef]
- Wang, Y.; Guan, Q.; Lao, I.; Wang, L.; Wu, Y.; Li, D.; Ji, Q.; Zhu, Y.; Lu, H.; Xiang, J. Using deep convolutional neural networks for multi-classification of thyroid tumor by histopathology: A large-scale pilot study. Ann. Transl. Med. 2019, 7, 468. [Google Scholar] [CrossRef]
- Chandio, J.A.; Mallah, G.A.; Shaikh, N.A. Decision support system for classification medullary thyroid cancer. IEEE Access 2020, 8, 145216–145226. [Google Scholar] [CrossRef]
- El-Hossiny, A.S.; Al-Atabany, W.; Hassan, O.; Soliman, A.M.; Sami, S.A. Classification of thyroid carcinoma in whole slide images using cascaded CNN. IEEE Access 2021, 9, 88429–88438. [Google Scholar] [CrossRef]
- Do, T.H.; Khanh, H.N. Supporting Thyroid Cancer Diagnosis based on Cell Classification over Microscopic Images. In Proceedings of the 2022 International Conference on Multimedia Analysis and Pattern Recognition (MAPR), Phu Quoc, Vietnam, 13–14 October 2022; pp. 1–5. [Google Scholar]
- Böhland, M.; Tharun, L.; Scherr, T.; Mikut, R.; Hagenmeyer, V.; Thompson, L.D.; Perner, S.; Reischl, M. Machine learning methods for automated classification of tumors with papillary thyroid carcinoma-like nuclei: A quantitative analysis. PLoS ONE 2021, 16, e0257635. [Google Scholar] [CrossRef] [PubMed]
- Tolstikhin, I.O.; Houlsby, N.; Kolesnikov, A.; Beyer, L.; Zhai, X.; Unterthiner, T.; Yung, J.; Steiner, A.; Keysers, D.; Uszkoreit, J.; et al. Mlp-mixer: An all-mlp architecture for vision. Adv. Neural Inf. Process. Syst. 2021, 34, 24261–24272. [Google Scholar]
- Liu, Z.; Lin, Y.; Cao, Y.; Hu, H.; Wei, Y.; Zhang, Z.; Lin, S.; Guo, B. Swin transformer: Hierarchical vision transformer using shifted windows. In Proceedings of the IEEE/CVF International Conference on Computer Vision, Montreal, BC, Canada, 11–17 October 2021; pp. 10012–10022. [Google Scholar]
- Touvron, H.; Cord, M.; Douze, M.; Massa, F.; Sablayrolles, A.; Jégou, H. Training data-efficient image transformers & distillation through attention. In Proceedings of the International Conference on Machine Learning, PMLR, Virtual, 18–24 July 2021; pp. 10347–10357. [Google Scholar]
- Espadoto, M.; Martins, R.M.; Kerren, A.; Hirata, N.S.; Telea, A.C. Toward a quantitative survey of dimension reduction techniques. IEEE Trans. Vis. Comput. Graph. 2019, 27, 2153–2173. [Google Scholar] [CrossRef]
- Yab, L.Y.; Wahid, N.; Hamid, R.A. A Meta-Analysis Survey on the Usage of Meta-Heuristic Algorithms for Feature Selection on High-Dimensional Datasets. IEEE Access 2022, 10, 122832–122856. [Google Scholar] [CrossRef]
- Sagi, O.; Rokach, L. Ensemble learning: A survey. Wiley Interdiscip. Rev. Data Min. Knowl. Discov. 2018, 8, e1249. [Google Scholar] [CrossRef]
- Khademi, F.; Rabbani, M.; Motameni, H.; Akbari, E. A weighted ensemble classifier based on WOA for classification of diabetes. Neural Comput. Appl. 2022, 34, 1613–1621. [Google Scholar] [CrossRef]
- Mohammed, H.; Rashid, T. FOX: A FOX-inspired optimization algorithm. Appl. Intell. 2023, 53, 1030–1050. [Google Scholar] [CrossRef]
- Mohammed, M.A.; Abdulkareem, K.H.; Al-Waisy, A.S.; Mostafa, S.A.; Al-Fahdawi, S.; Dinar, A.M.; Alhakami, W.; Abdullah, B.; Al-Mhiqani, M.N.; Alhakami, H.; et al. Benchmarking methodology for selection of optimal COVID-19 diagnostic model based on entropy and TOPSIS methods. IEEE Access 2020, 8, 99115–99131. [Google Scholar] [CrossRef]
- Nguyen, H.Q.; Nguyen, V.T.; Phan, D.P.; Tran, Q.H.; Vu, N.P. Multi-criteria decision making in the PMEDM process by using MARCOS, TOPSIS, and MAIRCA methods. Appl. Sci. 2022, 12, 3720. [Google Scholar] [CrossRef]
- Pedraza, L.; Vargas, C.; Narváez, F.; Durán, O.; Muñoz, E.; Romero, E. An open access thyroid ultrasound image database. In Proceedings of the 10th International Symposium on Medical Information Processing and Analysis, SPIE, Cartagena de Indias, Colombia, 14–16 October 2015; Volume 9287, pp. 188–193. [Google Scholar]
- Thompson, L.D.; Poller, D.N.; Kakudo, K.; Burchette, R.; Nikiforov, Y.E.; Seethala, R.R. An international interobserver variability reporting of the nuclear scoring criteria to diagnose noninvasive follicular thyroid neoplasm with papillary-like nuclear features: A validation study. Endocr. Pathol. 2018, 29, 242–249. [Google Scholar] [CrossRef] [PubMed]


| Model | Feature Extraction | Classifier | Accuracy | F2-Score | AUC-ROC | TOPSIS Score | Rank |
|---|---|---|---|---|---|---|---|
| Model1 | DeiT | LR | 0.8427 | 0.8023 | 0.8929 | 0.5016 | 9 |
| Model2 | NB | 0.7138 | 0.7036 | 0.8460 | 0.2536 | 13 | |
| Model3 | SVC | 0.9091 | 0.9069 | 0.9590 | 0.8067 | 6 | |
| Model4 | KNN | 0.7797 | 0.7302 | 0.8613 | 0.3233 | 12 | |
| Model5 | RF | 0.9685 | 0.9707 | 0.9884 | 0.9716 | 3 | |
| Model6 | Swin Transformer | LR | 0.8899 | 0.8565 | 0.9283 | 0.6622 | 7 |
| Model7 | NB | 0.7028 | 0.6901 | 0.7684 | 0.0807 | 15 | |
| Model8 | SVC | 0.9231 | 0.9318 | 0.9640 | 0.8621 | 4 | |
| Model9 | KNN | 0.8444 | 0.8432 | 0.9014 | 0.5878 | 8 | |
| Model10 | RF | 0.9790 | 0.9833 | 0.9885 | 1.0000 | 1 | |
| Model11 | Mixer-MLP | LR | 0.8252 | 0.7844 | 0.9019 | 0.4898 | 10 |
| Model12 | NB | 0.7028 | 0.6537 | 0.7993 | 0.0903 | 14 | |
| Model13 | SVC | 0.9126 | 0.9170 | 0.9628 | 0.8319 | 5 | |
| Model14 | KNN | 0.7885 | 0.7555 | 0.8728 | 0.3853 | 11 | |
| Model15 | RF | 0.9455 | 0.9819 | 0.9884 | 0.9968 | 2 |
| Model | Feature Extraction | Classifier | Accuracy | F2-Score | AUC-ROC | TOPSIS Score | Rank |
|---|---|---|---|---|---|---|---|
| Model1 | DeiT | LR | 0.6541 | 0.6142 | 0.7075 | 0.0485 | 15 |
| Model2 | NB | 0.6271 | 0.6083 | 0.7292 | 0.0754 | 12 | |
| Model3 | SVC | 0.7876 | 0.6874 | 0.8878 | 0.4792 | 7 | |
| Model4 | KNN | 0.8076 | 0.7219 | 0.908 | 0.5891 | 6 | |
| Model5 | RF | 0.8712 | 0.8095 | 0.9414 | 0.8764 | 2 | |
| Model6 | Swin Transformer | LR | 0.6376 | 0.6217 | 0.6955 | 0.0656 | 13 |
| Model7 | NB | 0.6188 | 0.6023 | 0.7252 | 0.0633 | 14 | |
| Model8 | SVC | 0.8135 | 0.7402 | 0.9084 | 0.6413 | 5 | |
| Model9 | KNN | 0.8624 | 0.7983 | 0.937 | 0.8384 | 3 | |
| Model10 | RF | 0.8835 | 0.8461 | 0.9463 | 1 | 1 | |
| Model11 | Mixer-MLP | LR | 0.66 | 0.6513 | 0.7249 | 0.1788 | 11 |
| Model12 | NB | 0.6594 | 0.6232 | 0.8443 | 0.2964 | 10 | |
| Model13 | SVC | 0.7889 | 0.649 | 0.8961 | 0.407 | 9 | |
| Model14 | KNN | 0.7859 | 0.6641 | 0.901 | 0.4417 | 8 | |
| Model15 | RF | 0.8541 | 0.7745 | 0.9296 | 0.7595 | 4 |
| Criteria | Accuracy | F2-Score | AUC-ROC |
|---|---|---|---|
| Weights1 (Ultrasound Dataset) | 0.31123 | 0.4062 | 0.2826 |
| Weights2 (Histopathological Dataset) | 0.3694 | 0.2601 | 0.3704 |
| Model | Feature Reduction | Accuracy | F2-Score | AUC-ROC | TOPSIS Scores | Rank |
|---|---|---|---|---|---|---|
| Model10 | PCA | 0.9790 | 0.9832 | 0.9885 | 0.9679 | 1 |
| Model16 | SVD | 0.9720 | 0.9720 | 0.9910 | 0.9465 | 3 |
| Model17 | FAST ICA | 0.9825 | 0.9930 | 0.9815 | 0.9270 | 4 |
| Model18 | ISOMAP | 0.9825 | 0.9930 | 0.9841 | 0.9466 | 2 |
| Model19 | LLE | 0.9335 | 0.9292 | 0.9656 | 0.7418 | 5 |
| Model20 | UMAP | 0.8147 | 0.7015 | 0.9075 | 0.0000 | 6 |
| Model | Feature Reduction | Accuracy | F2-Score | AUC-ROC | TOPSIS Scores | Rank |
|---|---|---|---|---|---|---|
| Model10 | PCA | 0.8835 | 0.8461 | 0.9463 | 0.8871 | 1 |
| Model16 | SVD | 0.8771 | 0.8279 | 0.9443 | 0.7124 | 3 |
| Model17 | FAST ICA | 0.8412 | 0.7871 | 0.9030 | 0.3368 | 6 |
| Model18 | ISOMAP | 0.8188 | 0.8283 | 0.8971 | 0.5819 | 4 |
| Model19 | LLE | 0.8600 | 0.8460 | 0.9245 | 0.8291 | 2 |
| Model20 | UMAP | 0.7988 | 0.8568 | 0.8320 | 0.5377 | 5 |
| Criteria | Accuracy | F2-Score | AUC-ROC |
|---|---|---|---|
| Weights3 (Ultrasound Dataset) | 0.2963 | 0.5711 | 0.1326 |
| Weights4 (Histopathological Dataset) | 0.2868 | 0.2786 | 0.4346 |
| Model | Strategy Used | Accuracy | F2-Score | AUC-ROC | TOPSIS Score | Rank |
|---|---|---|---|---|---|---|
| Model21 | PCA + FOX optimization based | 0.9913 | 0.9882 | 0.9913 | 1.0000 | 1 |
| Feature selection + Random Forest | ||||||
| Model22 | PCA + ISOMAP Weighted Average | 0.9825 | 0.9728 | 0.9880 | 0.0000 | 3 |
| using FOX-optimization + Random Forest | ||||||
| Model23 | ISOMAP + FOX-optimization based | 0.9843 | 0.9818 | 0.9888 | 0.4736 | 2 |
| Feature selection + Random Forest |
| Model | Strategy Used | Accuracy | F2-Score | AUC-ROC | TOPSIS Score | Rank |
|---|---|---|---|---|---|---|
| Model21 | PCA + FOX optimization based | 0.9065 | 0.9201 | 0.9548 | 1.0000 | 1 |
| Feature selection + Random Forest | ||||||
| Model22 | PCA + LLE Weighted Average | 0.8924 | 0.9092 | 0.9464 | 0.5508 | 2 |
| using FOX-optimization + Random Forest | ||||||
| Model23 | LLE + FOX optimization based | 0.8812 | 0.8965 | 0.9259 | 0.0000 | 3 |
| Feature selection + Random Forest |
| Criteria | Accuracy | F2-Score | AUC-ROC |
|---|---|---|---|
| Weights5 (Ultrasound Dataset) | 0.2732 | 0.6216 | 0.1052 |
| Weights6 (Histopathological Dataset) | 0.2000 | 0.3356 | 0.4644 |
Disclaimer/Publisher’s Note: The statements, opinions and data contained in all publications are solely those of the individual author(s) and contributor(s) and not of MDPI and/or the editor(s). MDPI and/or the editor(s) disclaim responsibility for any injury to people or property resulting from any ideas, methods, instructions or products referred to in the content. |
© 2023 by the authors. Licensee MDPI, Basel, Switzerland. This article is an open access article distributed under the terms and conditions of the Creative Commons Attribution (CC BY) license (https://creativecommons.org/licenses/by/4.0/).
Share and Cite
Sharma, R.; Mahanti, G.K.; Panda, G.; Rath, A.; Dash, S.; Mallik, S.; Hu, R. A Framework for Detecting Thyroid Cancer from Ultrasound and Histopathological Images Using Deep Learning, Meta-Heuristics, and MCDM Algorithms. J. Imaging 2023, 9, 173. https://doi.org/10.3390/jimaging9090173
Sharma R, Mahanti GK, Panda G, Rath A, Dash S, Mallik S, Hu R. A Framework for Detecting Thyroid Cancer from Ultrasound and Histopathological Images Using Deep Learning, Meta-Heuristics, and MCDM Algorithms. Journal of Imaging. 2023; 9(9):173. https://doi.org/10.3390/jimaging9090173
Chicago/Turabian StyleSharma, Rohit, Gautam Kumar Mahanti, Ganapati Panda, Adyasha Rath, Sujata Dash, Saurav Mallik, and Ruifeng Hu. 2023. "A Framework for Detecting Thyroid Cancer from Ultrasound and Histopathological Images Using Deep Learning, Meta-Heuristics, and MCDM Algorithms" Journal of Imaging 9, no. 9: 173. https://doi.org/10.3390/jimaging9090173
APA StyleSharma, R., Mahanti, G. K., Panda, G., Rath, A., Dash, S., Mallik, S., & Hu, R. (2023). A Framework for Detecting Thyroid Cancer from Ultrasound and Histopathological Images Using Deep Learning, Meta-Heuristics, and MCDM Algorithms. Journal of Imaging, 9(9), 173. https://doi.org/10.3390/jimaging9090173