Article

Risk Analysis of Underground Tunnel Construction with Tunnel Boring Machine by Using Fault Tree Analysis and Fuzzy Analytic Hierarchy Process

by
Nitidetch Koohathongsumrit
* and
Wasana Chankham
Department of Statistics, Faculty of Science, Ramkhamhaeng University, Bangkok 10240, Thailand
*
Author to whom correspondence should be addressed.
Safety 2024, 10(3), 68; https://doi.org/10.3390/safety10030068
Submission received: 2 June 2024 / Revised: 5 July 2024 / Accepted: 30 July 2024 / Published: 1 August 2024

Abstract

:
Tunnel boring machines (TBMs) are preferred for constructing tunnels, particularly for underground mass transit railways, because of their speed, minimal environmental impact, and increased safety. However, TBM tunneling involves unavoidable risks, necessitating careful assessment and management for successful project completion. This study presents a novel hybrid risk-analysis method for tunnel construction using TBMs. The proposed method integrates fault tree analysis (FTA) and the fuzzy analytic hierarchy process (fuzzy AHP). FTA was employed to calculate the probabilities of risk occurrences, while fuzzy AHP was utilized to determine the consequences of the risks. These probability and consequence values were used to calculate continuous risk levels for more accurate risk analysis. The proposed method was applied to a real case of metro line construction. The results demonstrated that the proposed method effectively analyzes the risks, accurately reflecting decision support data. The risks were categorized based on the continuous risk levels in descending order. The most significant risk was the deterioration of the TBM. The benefits of this study provide project managers and stakeholders involved in underground construction with a new risk-analysis method that enhances work safety and facilitates the timely execution of urban tunnel construction projects.

1. Introduction

Infrastructure development is vital for a country’s sustainable growth, enhancing economic competitiveness, improving citizens’ quality of life, optimizing land use efficiency, and supporting population growth. Infrastructure development, particularly in transportation, includes establishing public transportation systems. These systems offer convenience, accessibility, cost savings, safety, and urban support, encouraging increased use and driving economic centrality [1]. One key element in public transportation development is the construction of underground mass transit railways, which connect cities and regions into an efficient economic network. Tunnel boring machines (TBMs) are essential in building these tunnels due to their high speed, minimal damage, and higher safety [2]. However, TBM construction involves significant and unpredictable risks that must be prioritized and mitigated through risk assessment to ensure project stability and worker safety [3,4].
Numerous methods have been provided to solve the risk analysis of tunnel construction, such as probabilistic modeling, risk assessment, simulation, and geotechnical investigation [5,6,7,8,9]. The simplest method for risk analysis in underground construction using TBMs is risk assessment based on the likelihood of an adverse event occurring (probability) and the potential magnitude of its impact (consequence) [10]. More details can be found in [11,12,13]. Fault tree analysis (FTA) is a part of risk assessment. It can be considered a top-down technique used to elucidate how specific unwanted events within a system may result from various failures. This method facilitates the quantitative probability analysis of risk events by examining the causes of system failures and identifying potential risks in complex systems. By connecting various events through logic gates such as AND and OR gates, FTA creates a tree diagram that shows how these events collectively lead to the top risk [14]. The primary advantage of FTA lies in its ability to provide a clear and structured visual representation of failure pathways, making it easier to understand and analyze risks quantitatively. Some studies employed FTA to analyze the risks associated with underground tunnel construction. Sharafat et al. [15] utilized FTA and event tree analysis (ETA) to prioritize the inherited risks associated with mechanized excavations. Qie and Yan [16] applied an FTA-based Bayesian network to explore subway construction accidents from 2000 to 2020 in China. Yang and Deng [17] identified the top security events in tunnel construction. Their study employed FTA along with the work and risk breakdown structures. However, FTA has several limitations. It does not account for dynamic changes over time or the sequence of risks, which can be crucial in some scenarios. Furthermore, while FTA focuses on calculating the probabilities of risks, it does not adequately address the consequences of these risks. Due to these limitations, it is often necessary to combine FTA with other methods to achieve a comprehensive risk assessment, addressing both the probabilities and impacts of potential risks effectively.
Due to their rationality, ease of understanding, and ability to mimic human decision-making processes, multiple criteria decision-making (MCDM) approaches have been applied to solve such problems and systematically rank many alternatives from most to least suitable. However, each method often exhibits inherent limitations that may hinder their reliability [18]. Hybrid MCDM approaches are more favorable due to the integration of various techniques to overcome each other’s limitations [19]. Many past studies provided hybrid approaches to analyze risks in tunnel construction. For example, Fouladgar et al. [20] introduced the risk evaluation of tunneling operations using fuzzy logic-based MCDM methods. Ehsanifar and Hemesy [21] presented the hybrid method of Shannon’s entropy, decision-making trial, and evaluation laboratory (DEMATEL) and gray complex proportional assessment of alternatives (COPRAS-G) to analyze the risks of tunnel construction. Hou et al. [22] introduced a comprehensive risk assessment of credal networks and an improved evaluation based on the distance from the average solution (EDAS) to enhance metro construction safety. Lin et al. [23] enhanced the identification of high-risk factors in excavation systems using the technique for order preference by the similarity to the ideal solution (TOPSIS) within Spherical fuzzy sets. Koohathongsumrit and Meethom [24] developed the two-stage model of the best-worst method (BWM) and risk model-based data envelopment analysis (DEA) to prioritize risks of metro construction. Zhang et al. [25] analyzed the risks of the utility tunnel construction project, where all the risks were ranked by the improved failure mode and effect analysis (FMEA)-based regret theory and multi-objective optimization ratio analysis plus the full multiplicative form (MULTIMOORA).
The analytic hierarchy process (AHP), developed by Saaty [26,27,28] is popularly used in hybrid MCDM approaches due to its flexibility, reliable comparisons, and comprehensibility [29]. Few studies have used hybrid approaches with AHP to analyze the risks of tunnel construction. For example, Yazdani-Chamzini et al. [30] employed the integrated AHP-fuzzy elimination and choice-expressing reality (ELECTRE) method to rank the risks of underground tunnel construction in Tehran. Gogate et al. [31] integrated AHP and fuzzy TOPSIS to prioritize the risk factors in tunnel construction. However, the use of AHP is influenced by ambiguities in decision-making. These uncertainties can be eliminated by fuzzy logic. Herein, fuzzy AHP was developed to handle the uncertainty and vagueness inherent in decision-making processes. Fuzzy AHP incorporates fuzzy set theory to allow for a more flexible and realistic representation of decision-makers’ judgments. A small number of past studies applied fuzzy AHP to analyze the risks of tunneling projects. Nezarat et al. [32] prioritized the geological risks of mechanized underground tunnel construction based on relative weights acquired from fuzzy AHP with the extent concept. Shaffiee Haghshenas et al. [33] utilized fuzzy AHP to prioritize twelve critical risks in the Emamzadeh Hashem tunnel project. Liu et al. [34] employed fuzzy AHP and VIKOR (VIseKriterijumska Optimizacija I Kompromisno Resenje) to handle an urban excavation project. However, although fuzzy AHP can assess the importance and consequences of risks, it cannot calculate the probabilities of risk occurrences. This necessitates the integration of fuzzy AHP and FTA to provide a comprehensive risk assessment. To date, there is only one study, by Hyun et al. [35], that utilized FTA to estimate the probabilities of risks and applied AHP to determine the consequences of the risks; all the risk levels were calculated based on both probabilities and consequences to rank the risks. Nevertheless, this study did not employ fuzzy AHP in the research procedures and yielded results with duplicate ranks of risks. The current study overcomes these disadvantages by integrating FTA and fuzzy AHP. FTA can effectively calculate the probabilities of risk occurrences, whereas fuzzy AHP can assess the consequences, providing a more comprehensive and accurate risk assessment.
In this study, a new methodology was presented to analyze the risks of tunnel construction. The proposed method integrates FTA and fuzzy AHP. FTA was used to calculate the probabilities of risk occurrences, while Buckley’s fuzzy AHP [36] was applied to compute the consequences of the risks. The proposed method provides continuous risk levels, which can prioritize all the risks. The continuous risk levels improve the accuracy of risk assessment. Finally, the proposed method was applied to a case study of the Purple Line construction project, the Tao Pun–Rat Burana section, to confirm its applicability and reliability. The benefits of this study include the development of an efficient public transportation system, the enhancement of tunneling operations’ safety management, and the promotion of awareness among government agencies regarding underground work safety.
This paper consists of five Sections. Section 2 outlines the proposed methodology. Section 3 includes an analysis of findings. Section 4 discusses the results. Finally, Section 5 concludes the study and indicates future research directions.

2. Materials and Methods

This section presents a novel methodology integrating FTA and fuzzy AHP to analyze risks in tunnel construction. The proposed method offers a comprehensive analysis for evaluating risk probabilities and consequences, thus enhancing precision and accuracy in risk assessment. The details of the proposed method are given below (see also Figure 1):
Step 1: The initial step involves a thorough identification of risks and causes in the context of tunnel construction using TBMs. This process begins with an extensive literature review to gather comprehensive information on the risks and causes associated with tunneling projects. Expert interviews are organized with professionals who have hands-on experience in tunneling projects.
Step 2: The tree diagram is constructed to visually represent the relationships between the risks and their underlying causes. To construct the tree diagram, experts with at least 10 years of experience in underground construction and risk assessment provide valuable insights into the logical connections between different risks. Additionally, historical data are used to support the relationships identified in the diagram.
Step 3: All the decision-makers, who include the experts and practitioners working in the underground construction sites, participate in this step. They assess the probabilities of the lowest-level causes. The probability assessment uses the Delphi method to achieve consensus among the decision-makers [37]. Based on the Delphi method, the data collection is divided into at least three rounds. In the first round of data collection, decision-makers are allowed to fully express their opinions on the likelihood of various causes. This involves assessing the probability of these causes occurring, with values ranging from 0 to 1. The probability value approaching 0 indicates a low likelihood, meaning the cause is quite “very unlikely” to occur. Conversely, the probability value approaching 1 indicates a high likelihood, meaning the cause is quite “very likely” to occur. Importantly, each decision-maker will not be aware of the identities or responses of the other decision-makers. Some questions in the first round are given as follows:
  • What do you believe is the probability that the “cause” will occur?
  • How would you rate the chance of the “cause” occurring in the near future on a scale from 0 to 1?
  • On a scale from 0 to 1, how likely is it that the “cause” will happen?
In the second round, the probability values are averaged to determine the mean probabilities of each cause. The results are then sent back to all decision-makers, who evaluate the appropriateness of the mean probabilities using a 5-point scale, where 5 indicates the highest appropriateness and 1 indicates the lowest. In the third round, decision-makers can revise their opinions if their initial assessments do not align with the consensus. The statistical measures of appropriateness levels are calculated and checked as follows: the mean ( x - ) must be greater than or equal to 3.50; both the interquartile range (IQR) and the absolute difference between the median and mode (|Med − Mod|) must not exceed 1.00; and the standard deviation (SD) must not exceed 1.50 [38,39]. If any statistical measures do not meet the condition, subsequent rounds of data collection are conducted, with decision-makers re-evaluating the probabilities and the appropriateness of their assessments.
Step 4: The probabilities of each risk are calculated by applying the rules of logic gates (AND, OR) as follows [40]:
for AND gate:
R P j = j = 1 n P C   j j ,
for OR gate:
R P j = 1     j = 1 n P C   j j ,
where RPj represents the probability of risk j and PCjj′ denotes the probability of cause j′ for risk j; n′ is the number of causes for risk j′; n is the set of risks; j′ = 1, 2, …, n′; j = 1, 2, …, n. The probability is compared with the interpretation criteria to determine the continuous probability level (PL) as presented in Table 1 [35]. The criteria to determine the probability level are derived using the interpolation method.
Step 5: The decision-maker compares the importance of risks in pairs using linguistic variables and levels of importance assessment, as presented in Table 2. If the decision-maker perceives that the risk in the row has a greater impact than the risk in the column, the normal importance level is used. Conversely, if the risk in the column has a greater impact than the risk in the row, the reciprocal level of importance assessment is applied instead [41]. Additionally, a pairwise comparison matrix for the decision-maker k is created as Ak = [aijk]I×R, where aij is the importance level of the risk at row i and column j, evaluated by decision-maker k; i and j implies the number of risks; K is the total number of decision-makers; i = 1, 2, …, I; j = 1, 2, …, R; k = 1, 2, …, K [42].
Step 6: The aggregated pairwise comparison matrix A ~ k = [ a ~ ij ]I×R is created. Next, the aggregated importance level of risk ( a ~ ij ) is calculated using the geometric mean of the importance levels, as follows [42]:
a ˜ i j = ( a i j 1     a i j 2       a i j K   ) 1 / K ,
Step 7: The fuzzy weights of each risk are computed based on the aggregated importance judgments, as follows [43]:
w ˜ j = r ˜   j   ( r ˜   1   r ˜   2     r ˜ R ) - 1 ,
r ˜   j = ( a ˜ 1 j   a ˜ 2 j       a ˜ R j ) 1 / R ,
where r ~ j imply the geometric mean of the importance levels for risk j.
Step 8: The best non-fuzzy performance values of each dimension are determined using the center of the area method, as follows [44]:
B N P w ˜ j = [ ( U w ˜ j L w ˜ j ) + ( M w ˜ j L w ˜ j ) ] 3 + L w ˜ j ,
where B N P w ~ j is the best non-fuzzy performance values of risk j; L w ~ j , M w ~ j , and U w ~ j represent the lower, middle, and upper values of the fuzzy weight of risk j, respectively. The weights regarding the impact of risk occurrence are calculated by normalizing the best non-fuzzy performance indices, as follows [45]:
w j = B N P w ˜ j B N P w ˜ 1 + B N P w ˜ 2 + + B N P w ˜ R ,
where wj refers to the weights regarding the impact of the occurrence of risk j. The continuous consequence level (CL) is approximated by comparing the weights with the interpretation criteria as presented in Table 3 [35].
Step 9: The consistency ratio (CR) is checked based on Saaty’s thresholds. The CR should not exceed 0.05 for a 3 × 3 matrix, 0.08 for a 4 × 4 matrix, and 0.10 for matrices larger than 5 × 5 [26,27]. If the CR is not acceptable, adjustments must be made by re-evaluating the pairwise comparisons until the value is satisfied.
Step 10: The risk level (RL) for constructing underground tunnels with TBMs can be estimated by multiplying the continuous probability level by the continuous consequence level, as shown below [46]:
RLj = PLj × CLj,
RLj, PLj, and CLj imply the risk level, continuous probability level of risk j, and continuous consequence level of risk j, respectively. The risks are prioritized based on their risk levels in descending order, with the most important risk having the highest risk level. Additionally, the risk assessment matrix of Figure 2 classifies all the risks according to their respective RL values. This classification helps in determining the appropriate risk-mitigation strategies and resource allocation.
Finally, by comparing the discrete risk levels with the continuous risk levels, the precision and accuracy of the proposed method are checked to ensure that the identified risks reflect their true risk levels, calculating the percentage of the discrete risk levels’ increase or decrease from the continuous risk levels.

3. Results

This section presents the outcomes regarding the analysis of risks in the context of underground tunnel construction using TBMs. The proposed method was applied to a case study of the Purple Line construction project, the Tao Poon–Rat Burana section. A total of 60 decision-makers were involved in this study. The participants were divided into two distinct groups. The first group comprised 30 experts from academic institutions or government agencies, each possessing specialized knowledge in underground construction. The second group comprised 30 field practitioners actively engaged in the underground construction project. These participants were carefully selected to provide a comprehensive understanding and diverse perspectives for the current study. The risks and the causes of these risks were identified through literature review and interview, as follows: insufficient tunneling (C1), deterioration of TBM (C2), soil or rock movement (C3), flooding in work area (C4), tunnel segment deterioration (C5), inappropriate working conditions (C6), community complaints (C7), economic fluctuations (C8), human resource problem (C9), and unforeseen event (C10). The relationships between the risks and their causes were identified as presented in Figure 3, Figure 4, Figure 5, Figure 6, Figure 7, Figure 8, Figure 9, Figure 10, Figure 11 and Figure 12. Obviously, the relationships can be represented by the OR gates that indicate the scenarios where the risks occur if one or more of the causes occur. This signifies that multiple independent or dependent events can cause the risk.
In the first round of data collection, all decision-makers independently assessed the probabilities of causes at the lowest level without knowing who the other decision-makers were. In the second round, each decision-maker was informed of the average probabilities. These average probabilities were provided to the decision-makers, who evaluated their appropriateness using a 5-point rating scale, where 5 indicates the highest level of appropriateness and 1 indicates the lowest level. In the third round, decision-makers were allowed to change their opinions and verify whether the consensus probability levels among the group were appropriate. The probabilities of each cause and the related statistical values are shown in Table 4.
Upon examining the statistical values for all the causes, we found that the calculated statistics were satisfactory. The consensus probabilities were appropriate and can be used for further analysis. The probabilities of risks were calculated under the OR gate relations, and the continuous probability levels were determined as presented in Table 5.
Calculating the consequence level of risks started with the decision-makers comparing the importance of risks in pairs. The aggregated pairwise comparison matrix was constructed as presented in Table 6.
Based on the obtained aggregated importance levels, the geometric means of the importance levels for each risk were computed. For example, the calculation of r ~ 1 is given by
r ~ 1 = ( 1 × 0.91 × 0.85 × 1.18 × 0.69 × 0.92 × 0.94 × 1.15 × 1.33 × 1.52 × 1.03 ) 1 / 10 , ( 1 × 1.30 × 1.30 × 1.72 × 0.99 × 1.40 × 1.42 × 1.72 × 1.85 × 2.31 ) 1 / 10 , ( 1 × 1.79 × 1.85 × 2.28 × 1.37 × 1.95 × 1.97 × 2.31 × 2.35 × 3.08 ) 1 / 10 ) = ( 1.03 , 1.46 , 1.92 ) .
Using the same calculation method as above, the geometric means of the importance levels for the other risks were obtained as follows: r ~ 2 = (1.00, 1.42, 1.86), r ~ 3 = (0.92, 1.28, 1.68), r ~ 4 = (0.85, 1.16, 1.52), r ~ 5 = (0.92, 1.27, 1.69), r ~ 6 = (0.76, 1.01, 1.34), r ~ 7 = (0.68, 0.90, 1.22), r ~ 8 = (0.58, 0.76, 1.06), r ~ 9 = (0.50, 0.63, 0.87), and r ~ 10 = (0.47, 0.59, 0.82).
Hence, the fuzzy weights of dimensions were calculated based on the geometric means. For example, the calculation of w ~ 1 is given by
w ~ 1 = ( 1.03 , 1.46 , 1.92 ) ( 1 / ( 1.92 + + 0.82 ) , 1 / ( 1.46 + + 0.59 ) , 1 / ( 1.03 + + 0.47 ) ) = ( 0.07 , 0.14 , 0.25 ) .
Using the same algorithm as above, the fuzzy weights of dimensions for the other risks were acquired as follows: w ~ 2 = (0.07, 0.14, 0.24), w ~ 3 = (0.07, 0.12, 0.22), w ~ 4 = (0.06, 0.11, 0.20), w ~ 5 = (0.07, 0.12, 0.22), w ~ 6 = (0.054, 0.10, 0.17), w ~ 7 = (0.05, 0.09, 0.16), w ~ 8 = (0.04, 0.07, 0.14), w ~ 9 = (0.04, 0.06, 0.11), and w ~ 10 = (0.03, 0.06, 0.11).
To defuzzify the fuzzy weights, the BNP values of each risk were identified. For example, the calculation of B N P w ~ 1 is given by
B N P w ˜ 1 = [ ( 0.25 0.07 ) + ( 0.14 0.07 ) ] 3 + 0.07 = 0.15 .
Similarly, the BNP values of the remaining risks were obtained as follows: B N P w ~ 2 = 0.15, B N P w ~ 3 = 0.14, B N P w ~ 4 = 0.12, B N P w ~ 5 = 0.14, B N P w ~ 6 = 0.11, B N P w ~ 7 = 0.10, B N P w ~ 8 = 0.08, B N P w ~ 9 = 0.07, and B N P w ~ 10 = 0.07. Finally, the weights regarding the impact from risk occurrence and the continuous consequence levels were calculated as presented in Table 7.
The weights and the aggregated middle values were considered in the consistency check. It was found that the CR equals 0.01, which is less than 0.10. Consequently, it can be summarized that the calculated weights are highly reliable and consistent. The risk levels associated with underground tunnel construction using TBMs were calculated by multiplying the continuous probability and consequence levels. Next, the risks were ranked in descending order based on their levels and classified in the risk assessment matrix. The results of the risk analysis are presented in Table 8.
In this case, the deterioration of TBM (C2) was ranked as the highest priority, with a risk level of 11.06. The most important risk must receive special attention before addressing the other risks. Meanwhile, the other risks were prioritized based on their risk levels in descending order. Therefore, the ranks of risks are as follows: C2C1C3C5C6C8C4C7C9C10. The high-risk group includes C2 and C1, with risk levels of 11.18 and 11.06. The moderate-risk group consists of C3, C5, and C6, with risk levels ranging from 6.70 to 9.06. The low-risk group comprises C8, C4, C7, C9, and C10, all with risk levels below 4.43.
Furthermore, the overall risk level of the project was calculated by averaging the continuous risk levels. Therefore, the project’s risk level was equal to 6.58. This result can be more informative using the concept of confidence interval for the project’s risk level. The range of this level was calculated to indicate the degrees of measurement and calculation. In the case of a small sample, not knowing the population variance and confidence level at 95%, the lower and upper bounds for the risk level of the project equaled 5.87 and 7.30, respectively. When comparing these results with the risk matrix, it can be summarized that the project is at a moderate risk level.

4. Discussion

The findings assist decision-makers in systematically assessing, analyzing, and prioritizing the risks associated with underground tunnel construction using TBMs. The proposed methodology yields the results that align with the decision-makers’ opinions. If the risk has a high probability, it will be assigned a high likelihood of occurrence. Similarly, if the risk has a significant impact, it will be assigned a high weight. These probabilities and weights are utilized to calculate the overall continuous risk levels of negative events, enhancing the accuracy of risk analysis. It can be observed that the calculated levels of risks are in the form of continuous values, and no risks have the same levels, thereby enabling more precise ranks of risks. Decision-makers can determine from the risk analysis that measures or guidelines should be established to prevent the most significant risk first.
According to the obtained findings, it is essential to mitigate the most important risk from the various causes. After consulting with the executives and construction supervisors in the project case, the following guidelines have been provided to prevent the deterioration of TBM, as follows:
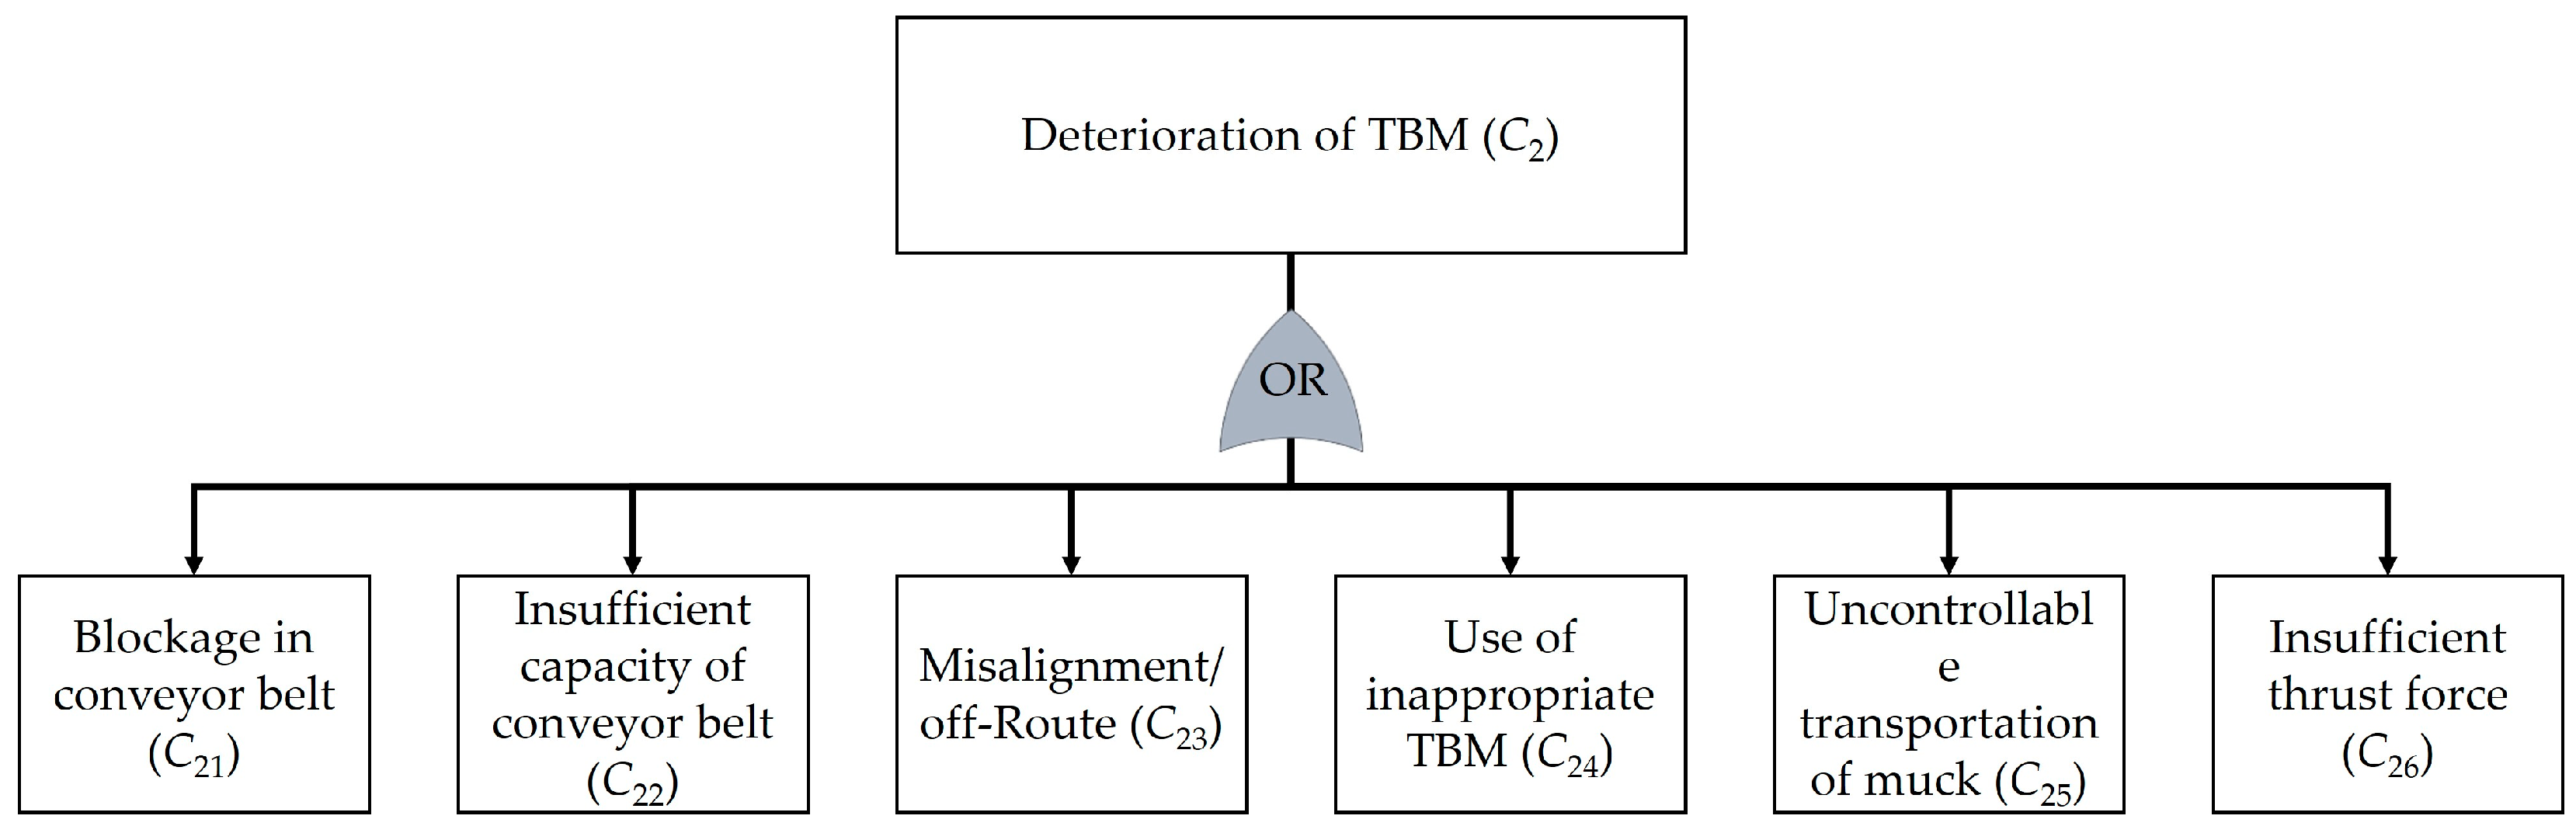
  • Inspections should be conducted to identify and remove potential blockages. The size of excavated material should be controlled through the use of rock crushers or grinders. Implementing a strict maintenance schedule to clean and service the conveyor system, along with establishing emergency protocols for addressing blockages, can effectively mitigate this issue.
  • Assessments of capacity requirements are necessary, along with the installation of load monitoring systems to track real-time loads and prevent overloading. Upgrading equipment or adding additional conveyors may be required if the current system consistently reaches its capacity limits.
  • Utilizing advanced global positioning and laser guidance systems, frequently calibrating navigation systems, and conducting comprehensive geotechnical surveys can help maintain accurate alignment. Developing protocols for re-aligning the TBM in case of deviation is also important.
  • Clear criteria for TBM selection should be established. Consultations with TBM manufacturers and experts should be conducted to ensure a suitable machine is chosen. Leasing or modular TBMs that can adapt to different conditions may also be considered.
  • Optimized muck handling systems can be implemented. Muck transportation must be continuously monitored and disposal plans can be developed to address this issue. Training operators and clear protocols for managing transportation issues are necessary.
  • Maintenance and checks on hydraulic systems, upgrading hydraulic systems when necessary, and verifying machine setup parameters before operations can ensure that thrust force requirements are met.
To accommodate various unexpected circumstances, it is necessary to conduct sensitivity analysis, which involves experimentally altering the values of the most significant parameter. In this study, the sensitivity analysis includes three experiments: changes to the highest probability, changes to the greatest weight, and changes to the highest probability and the greatest weight, while the other parameters are adjusted to optimal ratios [19,47]. Each experiment includes the normal scenario and nine additional scenarios. The new ranks of each risk were examined to check the robustness of the results. The sensitivity analysis results are shown in Figure 13, Figure 14 and Figure 15. The sensitivity results showed that changes in probabilities, weights, or both significantly affect the risk levels. Any alteration in parameter values resulted in corresponding changes in risk levels. For scenarios 8 and 9 in experiment 3, some risks are in the same ranks. These situations were simulated solely to demonstrate the sensitivity of the proposed method; it is impossible for these situations to happen in real-life scenarios. Furthermore, the sensitivity of results to different aggregation rules was checked. The proposed method was validated by aggregating the decision-makers’ judgments on the importance levels using the arithmetic mean. It can be found that although there has been a change in the method of totaling the decision-maker’s judgments, the ranks of risks have not changed. This ensures that our assessment of the risks remains accurate and is not affected by the change in the aggregation method. Therefore, we can conclude that the proposed method effectively responds to dynamic situations.
Furthermore, the proposed method was compared with the traditional calculations of probability and consequence levels proposed by Hyun, Min, Choi, Park, and Lee [35]. Herein, the calculations of probabilities and weights followed the proposed procedures. However, interpreting these probabilities and weights to determine the probability and consequence levels did not rely on continuous values, as shown in Table 9. Next, the discrete levels of each risk were calculated by multiplying the discrete probability and consequence levels. For example, the discrete PL1 equals 2 due to an RP1 of 0.39; the discrete CL1 equals 4 due to a w1 of 0.14; therefore, the discrete risk level of C1 (DRL1) = 2 × 4 = 8. Similarly, the DRLs of the others are DRL2 = 12, DRL3 = 8, DRL4 = 3, DRL5 = 8, DRL6 = 6, DRL7 = 2, DRL8 = 4, DRL9 = 2, and DRL10 = 1. Then, the ranks of each risk derived from the DRLs were determined in descending order and compared with the continuous risk levels, as presented in Figure 16.
The proposed method clearly demonstrates its ability to accurately rank the risks, ensuring that no risks are of the same order. This allows decision-makers to clearly understand which risks are more important. In contrast, the traditional method is inefficient due to duplicate risk results; for example, C1, C3, and C5 are in the same rank. The above findings demonstrate the effectiveness and reliability of the proposed method.
Based on the comparison, the proposed method provides risk levels that are higher than the discrete risk levels. For example, in the proposed method, C1 has a risk level of 11.06, whereas in the original method, C1 has a risk level of 8; this increase in risk level is 38.23%. When considering all the risks, the proposed method provides a significantly higher average risk level of about 47.75%. The traditional method underestimates risk levels, resulting in discrepancies in risk analysis. Hence, it can be summarized that the proposed method yields more accurate risk results with no data loss.

5. Conclusions

Developing a more accurate prediction model for risk analysis in tunnel construction is essential due to the significant and unpredictable risks associated with using TBMs. Traditional risk-assessment methods often fall short in calculating risk levels and prioritizing the risks effectively. The existing methods usually provide unclear results and cannot clearly distinguish between different risks.
This study introduces a novel methodology for analyzing the risks associated with tunnel construction using TBMs. The proposed method offers a comprehensive framework by leveraging the strengths of both FTA and fuzzy AHP. FTA effectively calculates the probabilities of various risk occurrences, while fuzzy AHP determines the consequences of these risks. The integration of FTA, which calculates the probabilities of risks from the lowest-level causes, and fuzzy AHP, which determines the impacts of risk occurrences, results in a robust and reliable risk assessment framework. The continuous risk levels are calculated by multiplying these probability and consequence levels, enhancing the accuracy and precision of risk analysis and assessment.
The proposed method was applied to the empirical case study of the metro construction project in Thailand. This application demonstrated the proposed method’s ability to effectively prioritize risks and enhance the accuracy of risk analysis. Continuous risk calculation not only improves the precision of risk analysis but also provides a more detailed and accurate analysis, where the limitations of the existing methods have been addressed. The advantages of FTA are utilized to calculate the probabilities of risks from the lowest-level causes. At the same time, the strengths of fuzzy AHP are employed to calculate the impacts of risk occurrences. The combination of both methods effectively solves risk-analysis problems. Each method’s strengths can compensate for the weaknesses of the other method efficiently. The benefits of this study contribute to theory and practice. Combining FTA and fuzzy AHP generates new insights for the precision and accuracy of risk analysis. Project managers and stakeholders can benefit from improved accuracy in prioritizing risks for better resource allocation to address the most significant risks. Furthermore, the robust risk assessment data support more informed decision results to make strategic choices based on accurate risk evaluations. Since the decision-makers have robust risk analysis data, they can make strategic choices based on accurate risk evaluations. This can lead to more efficient project planning and execution, reducing the likelihood of costly delays and accidents.
Nonetheless, the proposed method has notable limitations in analyzing the interdependencies between and within groups of risks; it cannot capture the complex relationships between risk groups or clusters that might influence each other in terms of probability and/or consequence. Another limitation is that the proposed method relies on the expertise of decision-makers. If the decision-makers evaluating the probability and consequence lack sufficient knowledge and understanding of the problem, it will result in inaccurate outcomes. Future studies can explore integrating FTA and fuzzy AHP with other MCDM methods. Geographical and geological contexts should be considered in the proposed risk analysis to provide a more holistic view of risks. Similarly, other factors, such as environmental impacts, long-term maintenance risks, and socio-economic consequences, should be examined to enhance the robustness and comprehensiveness of the risk assessment framework. These models should incorporate a broader range of variables and interdependencies, utilizing advanced mathematical techniques to handle the increased complexity. Consequently, the results of risk analysis will more accurately reflect the multifaceted nature of tunnel construction projects, leading to better-informed decision-making and improved risk-management strategies. Additionally, user-friendly software tools based on the proposed methodology should be developed to facilitate practical implementation in underground construction projects.

Author Contributions

Conceptualization, N.K.; methodology, N.K.; software, N.K. and W.C.; validation, N.K. and W.C.; formal analysis, N.K.; investigation, N.K.; resources, N.K.; data curation, N.K.; writing—original draft preparation, N.K. and W.C.; writing—review and editing, N.K. and W.C.; visualization, N.K.; supervision, N.K.; project administration, N.K.; funding acquisition, N.K. All authors have read and agreed to the published version of the manuscript.

Funding

This research was funded by Ramkhamhaeng University, grant number 84/2566.

Institutional Review Board Statement

Ethics approval for the study was sought from the Ethics Review Committee (ERC) from the Institute of Research and Development, Ramkhamhaeng University. The Authors were informed by the ERC that the research proposed does not require ethical review according to the university’s regulations and the regulations and guidelines for research involving human subjects proposed by the National Research Council of Thailand (NRCT) and the Ministry of Higher Education, Science, Research and Innovation, Thailand. Nevertheless, the Authors conducted the study in accordance with the Declaration of Helsinki’s ethical principles involving human subjects.

Informed Consent Statement

Not applicable.

Data Availability Statement

The data presented in this study are available on request from the corresponding authors.

Acknowledgments

The authors would like to thank all the decision-makers who participated in this work.

Conflicts of Interest

The authors declare no conflicts of interest.

References

  1. Ma, F.; Ren, F.; Yuen, K.F.; Guo, Y.; Zhao, C.; Guo, D. The spatial coupling effect between urban public transport and commercial complexes: A network centrality perspective. Sustain. Cities Soc. 2019, 50, 101645. [Google Scholar] [CrossRef]
  2. Xu, C.; Liu, X.; Wang, E.; Wang, S. Prediction of tunnel boring machine operating parameters using various machine learning algorithms. Tunn. Undergr. Space Technol. 2021, 109, 103699. [Google Scholar] [CrossRef]
  3. Liu, W.; Zhao, T.; Zhou, W.; Tang, J. Safety risk factors of metro tunnel construction in China: An integrated study with EFA and SEM. Saf. Sci. 2018, 105, 98–113. [Google Scholar] [CrossRef]
  4. Hosseini, N.; Givehchi, S.; Maknoon, R. Cost-based fire risk assessment in natural gas industry by means of fuzzy FTA and ETA. J. Loss Prev. Process Ind. 2020, 63, 104025. [Google Scholar] [CrossRef]
  5. Wang, T.; Cao, J.; Liu, J.; Xu, J.; Zhou, G. Characterizing anisotropic spatial variations of uncertain mechanical parameters for clay layer using incomplete probability data. Probabilistic Eng. Mech. 2024, 76, 103623. [Google Scholar] [CrossRef]
  6. Cao, J.; Wang, T.; Zhou, G.; Feng, X.; Zhu, C. Parameter estimation of grouting pressure and surface subsidence on the reliability of shield tunnel excavation under incomplete probability information. Comput. Geotech. 2024, 173, 106530. [Google Scholar] [CrossRef]
  7. Zhou, H.; Zhao, Y.; Shen, Q.; Yang, L.; Cai, H. Risk assessment and management via multi-source information fusion for undersea tunnel construction. Autom. Constr. 2020, 111, 103050. [Google Scholar] [CrossRef]
  8. Yu, J.; Zhong, D.; Ren, B.; Tong, D.; Hong, K. Probabilistic Risk Analysis of Diversion Tunnel Construction Simulation. Comput. Aided Civil Infrastruct. Eng. 2017, 32, 748–771. [Google Scholar] [CrossRef]
  9. Gangrade, R.; Grasmick, J.; Trainor-Guitton, W.; Mooney, M. Risk-based methodology to optimize geotechnical site investigations in tunnel projects. Tunn. Undergr. Space Technol. 2022, 127, 104589. [Google Scholar] [CrossRef]
  10. Qin, G.; Zhang, P.; Hou, X.; Wu, S.; Wang, Y. Risk assessment for oil leakage under the common threat of multiple natural hazards. Environ. Sci. Pollut. Res. Int. 2020, 27, 16507–16520. [Google Scholar] [CrossRef]
  11. Moradi, M.R.; Farsangi, M.A.E. Application of the Risk Matrix Method for Geotechnical Risk Analysis and Prediction of the Advance Rate in Rock TBM Tunneling. Rock Mech. Rock Eng. 2014, 47, 1951–1960. [Google Scholar] [CrossRef]
  12. Yazdani-Chamzini, A. Proposing a New Methodology Based on Fuzzy Logic for Tunnelling Risk Assessment. J. Civ. Eng. Manag. 2014, 20, 82–94. [Google Scholar] [CrossRef]
  13. Liu, G.-F.; Feng, X.-T.; Feng, G.-L.; Chen, B.-R.; Chen, D.-F.; Duan, S.-Q. A Method for Dynamic Risk Assessment and Management of Rockbursts in Drill and Blast Tunnels. Rock Mech. Rock Eng. 2016, 49, 3257–3279. [Google Scholar] [CrossRef]
  14. Relkar, A.S. Risk Analysis of Equipment Failure through Failure Mode and Effect Analysis and Fault Tree Analysis. J. Fail. Anal. Prev. 2021, 21, 793–805. [Google Scholar] [CrossRef]
  15. Sharafat, A.; Latif, K.; Seo, J. Risk analysis of TBM tunneling projects based on generic bow-tie risk analysis approach in difficult ground conditions. Tunn. Undergr. Space Technol. 2021, 111, 103860. [Google Scholar] [CrossRef]
  16. Qie, Z.; Yan, H. A Causation Analysis of Chinese Subway Construction Accidents Based on Fault Tree Analysis-Bayesian Network. Front. Psychol. 2022, 13, 887073. [Google Scholar] [CrossRef] [PubMed]
  17. Yang, R.; Deng, Y. Analysis on Security Risks in Tunnel Construction Based on the Fault Tree Analysis. IOP Conf. Ser. Earth Environ. Sci. 2021, 638, 012089. [Google Scholar] [CrossRef]
  18. Koohathongsumrit, N.; Meethom, W. A fuzzy decision-making framework for route selection in multimodal transportation networks. Eng. Manag. J. 2022, 34, 689–704. [Google Scholar] [CrossRef]
  19. Koohathongsumrit, N.; Chankham, W. Route selection in multimodal supply chains: A fuzzy risk assessment model-BWM-MARCOS framework. Appl. Soft Comput. 2023, 137, 110167. [Google Scholar] [CrossRef]
  20. Fouladgar, M.M.; Yazdani-Chamzini, A.; Zavadskas, E.K. Risk evaluation of tunneling projects. Arch. Civil Mech. Eng. 2012, 12, 1–12. [Google Scholar] [CrossRef]
  21. Ehsanifar, M.; Hemesy, M. A new hybrid multi-criteria decision-making model to prioritize risks in the construction process under fuzzy environment (case study: The Valiasr Street underpass project). Int. J. Constr. Manag. 2021, 21, 508–523. [Google Scholar] [CrossRef]
  22. Hou, W.-H.; Wang, X.-K.; Zhang, H.-Y.; Wang, J.-Q.; Li, L. Safety risk assessment of metro construction under epistemic uncertainty: An integrated framework using credal networks and the EDAS method. Appl. Soft Comput. 2021, 108, 107436. [Google Scholar] [CrossRef]
  23. Lin, S.-S.; Zhou, A.; Shen, S.-L. Safety assessment of excavation system via TOPSIS-based MCDM modelling in fuzzy environment. Appl. Soft Comput. 2023, 138, 110206. [Google Scholar] [CrossRef]
  24. Koohathongsumrit, N.; Meethom, W. Risk analysis in underground tunnel construction with tunnel boring machines using the Best-Worst method and data envelopment analysis. Heliyon 2024, 10, e23486. [Google Scholar] [CrossRef] [PubMed]
  25. Zhang, P.; Zhang, Z.-J.; Gong, D.-Q. An improved failure mode and effect analysis method for group decision-making in utility tunnels construction project risk evaluation. Reliab. Eng. Syst. Saf. 2024, 244, 109943. [Google Scholar] [CrossRef]
  26. Saaty, T.L. The Analytic Hierarchy Process; McGraw-Hill: New York, NY, USA, 1980. [Google Scholar]
  27. Saaty, T.L. How to make a decision: The analytic hierarchy process. Interfaces 1994, 24, 19–43. [Google Scholar] [CrossRef]
  28. Saaty, T.L. A scaling method for priorities in hierarchical structures. J. Math. Psychol. 1977, 15, 234–281. [Google Scholar] [CrossRef]
  29. Koohathongsumrit, N.; Chankham, W. A hybrid approach of fuzzy risk assessment-based incenter of centroid and MCDM methods for multimodal transportation route selection. Cogent Eng. 2022, 9, 2091672. [Google Scholar] [CrossRef]
  30. Yazdani-Chamzini, A.; Yakhchali, S.H.; Mahmoodian, M. Risk ranking of tunnel construction projects by using the ELECTRE technique under a fuzzy environment. Int. J. Manag. Sci. Eng. Manag. 2013, 8, 1–14. [Google Scholar] [CrossRef]
  31. Gogate, N.G.; Shelake, A.G.; Band, P. Selection of most significant risk factors for Indian tunnel projects: An integrated fuzzy-based MCDM approach. Int. J. Constr. Manag. 2024, 24, 161–176. [Google Scholar] [CrossRef]
  32. Nezarat, H.; Sereshki, F.; Ataei, M. Ranking of geological risks in mechanized tunneling by using Fuzzy Analytical Hierarchy Process (FAHP). Tunn. Undergr. Space Technol. 2015, 50, 358–364. [Google Scholar] [CrossRef]
  33. Shaffiee Haghshenas, S.; Shaffiee Haghshenas, S.; Abduelrhman, M.A.; Zare, S.; Mikaeil, R. Identifying and Ranking of Mechanized Tunneling Project’s Risks by Using A Fuzzy Multi-Criteria Decision Making Technique. J. Soft Comput. Civil Eng. 2022, 6, 29–45. [Google Scholar] [CrossRef]
  34. Liu, X.; Zhou, X.-H.; Wang, Y.-J. Risk analysis for urban excavation: A FAHP-VIKOR hybrid method. Geomat. Nat. Hazards Risk 2023, 14, 2282944. [Google Scholar] [CrossRef]
  35. Hyun, K.-C.; Min, S.; Choi, H.; Park, J.; Lee, I.-M. Risk analysis using fault-tree analysis (FTA) and analytic hierarchy process (AHP) applicable to shield TBM tunnels. Tunn. Undergr. Space Technol. 2015, 49, 121–129. [Google Scholar] [CrossRef]
  36. Buckley, J.J. Fuzzy hierarchical analysis. Fuzzy Sets Syst. 1985, 17, 233–247. [Google Scholar] [CrossRef]
  37. Tamošaitienė, J.; Khosravi, M.; Cristofaro, M.; Chan, D.W.M.; Sarvari, H. Identification and Prioritization of Critical Risk Factors of Commercial and Recreational Complex Building Projects: A Delphi Study Using the TOPSIS Method. Appl. Sci. 2021, 11, 7906. [Google Scholar] [CrossRef]
  38. Meethom, W.; Koohathongsumrit, N. A decision support system for road freight transportation route selection with new fuzzy numbers. Foresight 2020, 22, 505–527. [Google Scholar] [CrossRef]
  39. Kongchasing, N.; Sua-Iam, G. The Major Causes of Construction Delays Identified Using the Delphi Technique: Perspectives of Contractors and Consultants in Thailand. Int. J. Civil Eng. 2021, 19, 319–338. [Google Scholar] [CrossRef]
  40. Kabir, S.; Aslansefat, K.; Sorokos, I.; Papadopoulos, Y.; Konur, S. A Hybrid Modular Approach for Dynamic Fault Tree Analysis. IEEE Access 2020, 8, 97175–97188. [Google Scholar] [CrossRef]
  41. Aoun, J.; Quaglietta, E.; Goverde, R.M.P.; Scheidt, M.; Blumenfeld, M.; Jack, A.; Redfern, B. A hybrid Delphi-AHP multi-criteria analysis of Moving Block and Virtual Coupling railway signalling. Transp. Res. Part C Emerg. Technol. 2021, 129, 103250. [Google Scholar] [CrossRef]
  42. Gupta, S.; Raj, S.; Gupta, S.; Sharma, A. Prioritising crowdfunding benefits: A fuzzy-AHP approach. Qual. Quant. 2023, 57, 379–403. [Google Scholar] [CrossRef] [PubMed]
  43. Rouyendegh, B.D.; Savalan, Ş. An Integrated Fuzzy MCDM Hybrid Methodology to Analyze Agricultural Production. Sustainability 2022, 14, 4835. [Google Scholar] [CrossRef]
  44. Thapar, S.S.; Sarangal, H. Quantifying reusability of software components using hybrid fuzzy analytical hierarchy process (FAHP)-Metrics approach. Appl. Soft Comput. 2020, 88, 105991. [Google Scholar] [CrossRef]
  45. Koohathongsumrit, N.; Luangpaiboon, P. An integrated FAHP–ZODP approach for strategic marketing information system project selection. Manag. Decis. Econ. 2021, 43, 1792–1809. [Google Scholar] [CrossRef]
  46. Sanni-Anibire, M.O.; Mahmoud, A.S.; Hassanain, M.A.; Salami, B.A. A risk assessment approach for enhancing construction safety performance. Saf. Sci. 2020, 121, 15–29. [Google Scholar] [CrossRef]
  47. Koohathongsumrit, N.; Luangpaiboon, P. Strategic marketing information system planning: An integrated BWM–ELECTRE approach. Group Decis. Negot. 2024, 33, 267–289. [Google Scholar] [CrossRef]
Figure 1. Procedure of proposed method.
Safety 10 00068 g001
Figure 2. Risk assessment matrix for continuous risk level.
Safety 10 00068 g002
Figure 3. Fault tree diagram for insufficient tunneling.
Safety 10 00068 g003
Figure 4. Fault tree diagram for deterioration of TBM.
Safety 10 00068 g004
Figure 5. Fault tree diagram for soil or rock movement.
Safety 10 00068 g005
Figure 6. Fault tree diagram for flooding in work area.
Safety 10 00068 g006
Figure 7. Fault tree diagram for tunnel segment deterioration.
Safety 10 00068 g007
Figure 8. Fault tree diagram for inappropriate working conditions.
Safety 10 00068 g008
Figure 9. Fault tree diagram for community complaints.
Safety 10 00068 g009
Figure 10. Fault tree diagram for economic fluctuations.
Safety 10 00068 g010
Figure 11. Fault tree diagram for human resource problem.
Safety 10 00068 g011
Figure 12. Fault tree diagram for unforeseen event.
Safety 10 00068 g012
Figure 13. Sensitivity results of experiment 1.
Safety 10 00068 g013
Figure 14. Sensitivity results of experiment 2.
Safety 10 00068 g014
Figure 15. Sensitivity results of experiment 3.
Safety 10 00068 g015
Figure 16. Comparison of the proposed method and the traditional method.
Safety 10 00068 g016
Table 1. Criteria to determine probability level.
Probability LevelDefinitionProbability
Greater than 4.20Very likelyGreater than 0.68
3.41–4.20Likely0.54–0.68
2.61–3.40Possible0.40–0.53
1.81–2.60Unlikely0.25–0.39
Less than 1.81Very unlikelyLess than 0.25
Table 2. Linguistic variables and importance level.
Linguistic VariablesImportance Level
Equally preferred(1, 1, 1)
Equally to moderately preferred(1, 2, 3)
Moderately preferred(2, 3, 4)
Moderately to Strongly preferred(3, 4, 5)
Strongly preferred(4, 5, 6)
Strongly to very strongly preferred(5, 6, 7)
Very strongly preferred(6, 7, 8)
Very strongly to extremely preferred(7, 8, 9)
Extremely preferred(8, 9, 9)
Table 3. Criteria to determine consequence level.
Consequence LevelDefinitionWeights
Greater than 4.20Very high impactGreater than 0.14
3.41–4.20High impact0.12–0.14
2.61–3.40Moderate impact0.10–0.11
1.81–2.60Low impact0.07–0.09
Less than 1.81Very low impactLess than 0.07
Table 4. Probabilities of cause.
CauseProbability x ~ ≥ 3.50IQR ≤ 1.00|Med − Mod| ≤ 1.00 SD ≤ 1.50
C110.074.151.000.000.76
C120.083.731.000.001.06
C130.083.531.000.001.16
C140.084.101.000.000.90
C150.094.051.001.001.02
C160.084.271.001.000.80
C210.083.531.000.001.14
C220.093.551.000.001.11
C230.083.521.000.001.00
C240.083.581.000.001.11
C250.093.681.000.001.03
C260.093.571.000.001.09
C310.083.621.000.01.12
C320.083.631.001.001.04
C330.093.521.000.001.16
C340.093.571.000.001.13
C350.093.621.000.001.14
C410.083.521.000.001.08
C420.093.601.000.001.14
C510.083.651.001.001.12
C520.083.581.001.001.05
C530.083.551.000.001.14
C540.083.531.000.001.20
C550.083.581.000.001.06
C610.083.621.000.001.15
C620.083.651.000.001.16
C630.083.671.000.001.11
C640.093.551.000.001.19
C650.073.631.000.001.15
C710.083.521.000.001.03
C720.093.701.000.001.11
C730.083.701.001.000.96
C810.093.621.000.001.12
C820.083.521.000.001.13
C830.083.950.250.000.77
C840.083.621.001.000.96
C910.084.401.000.000.83
C920.083.521.000.001.19
C930.083.731.000.001.09
C940.084.101.001.001.02
C1010.073.901.000.000.84
C1020.073.601.000.001.11
C1030.083.521.000.501.03
Table 5. Probability of risk and continuous probability level.
RPProbabilityPL
11 − ((1 − 0.07) × (1 − 0.08) × (1 − 0.08) × (1 − 0.08) × (1 − 0.09) × (1 − 0.08)) = 0.392.61
21 − ((1 − 0.08) × (1 − 0.09) × (1 − 0.08) × (1 − 0.08) × (1 − 0.09) × (1 − 0.09)) = 0.412.72
31 − ((1 − 0.08) − (1 − 0.08) − (1 − 0.09) − (1 − 0.09) − (1 − 0.09)) = 0.362.46
41 − ((1 − 0.08) − (1 − 0.09)) = 0.161.34
51 − ((1 − 0.08) − (1 − 0.08) − (1 − 0.08) − (1 − 0.08) − (1 − 0.08)) = 0.342.30
61 − ((1 − 0.08) − (1 − 0.08) − (1 − 0.08) − (1 − 0.09) − (1 − 0.08)) = 0.342.33
71 − ((1 − 0.08) − (1 − 0.09) − (1 − 0.08)) = 0.221.69
81 − ((1 − 0.09) − (1 − 0.08) − (1 − 0.08) − (1 − 0.08)) = 0.292.05
91 − ((1 − 0.08) − (1 − 0.08) − (1 − 0.08) − (1 − 0.08)) = 0.292.20
101 − ((1 − 0.08) − (1 − 0.07) − (1 − 0.08)) = 0.211.62
Table 6. Aggregated pairwise comparison matrix.
C1C2C3C4C5C6C7C8C9C10
C1(1,1,1)(0.91,
1.30,
1.79)
(0.85,
1.30,
1.85)
(1.18,
1.72,
2.28)
(0.69,
0.99,
1.37)
(0.92,
1.40,
1.95)
(0.94,
1.42,
1.97)
(1.15,
1.72,
2.31)
(1.33,
1.85,
2.35)
(1.52,
2.31,
3.08)
C2(0.56,
0.77,
1.10)
(1,1,1)(1.03,
1.56,
2.17)
(1.02,
1.50,
2.05)
(0.85,
1.25,
1.72)
(1.01,
1.50,
2.03)
(1.08,
1.54,
1.99)
(1.09,
1.58,
2.08)
(1.26,
1.92,
2.53)
(1.35,
2.12,
2.83)
C3(0.54,
0.77,
1.17)
(0.46,
0.64,
0.98)
(1,1,1)(1.02,
1.47,
1.92)
(0.73,
1.06,
1.49)
(1.18,
1.62,
2.03)
(1.06,
1.57,
2.07)
(1.12,
1.67,
2.25)
(1.46,
2.12,
2.70)
(1.18,
1.69,
2.15)
C4(0.44,
0.58,
0.85)
(0.49,
0.66,
0.98)
(0.52,
0.68,
0.98)
(1,1,1)(0.88,
1.26,
1.69)
(0.98,
1.45,
1.99)
(1.10,
1.55,
1.96)
(1.07,
1.60,
2.16)
(1.35,
1.93,
2.44)
(1.29,
1.83,
2.30)
C5(0.73,
1.01,
1.44)
(0.58,
0.80,
1.18)
(0.67,
0.94,
1.36)
(0.59,
0.79,
1.14)
(1,1,1)(1.26,
1.77,
2.20)
(1.11,
1.70,
2.26)
(1.18,
1.80,
2.39)
(1.24,
1.87,
2.45)
(1.25,
1.86,
2.39)
C6(0.51,
0.71,
1.09)
(0.49,
0.67,
0.99)
(0.49,
0.62,
0.84)
(0.50,
0.69,
1.02)
(0.45,
0.57,
0.79)
(1,1,1)(1.23,
1.74,
2.24)
(1.14,
1.70,
2.19)
(1.15,
1.62,
2.01)
(1.36,
1.98,
2.53)
C7(0.51,
0.70,
1.07)
(0.50,
0.65,
0.93)
(0.48,
0.64,
0.94)
(0.51,
0.64,
0.91)
(0.44,
0.59,
0.90)
(0.45,
0.57,
0.81)
(1,1,1)(1.20,
1.72,
2.19)
(1.25,
1.92,
2.55)
(1.19,
1.66,
2.15)
C8(0.43,
0.58,
0.87)
(0.48,
0.63,
0.91)
(0.44,
0.60,
0.89)
(0.46,
0.63,
0.94)
(0.42,
0.56,
0.84)
(0.46,
0.59,
0.88)
(0.46,
0.58,
0.83)
(1,1,1)(1.17,
1.72,
2.22)
(1.04,
1.51,
1.95)
C9(0.43,
0.54,
0.75)
(0.39,
0.52,
0.79)
(0.37,
0.47,
0.69)
(0.41,
0.52,
0.74)
(0.41,
0.54,
0.81)
(0.50,
0.62,
0.87)
(0.39,
0.52,
0.80)
(0.45,
0.58,
0.85)
(1,1,1)(1.09,
1.40,
1.68)
C10(0.32,
0.43,
0.66)
(0.35,
0.47,
0.74)
(0.47,
0.59,
0.85)
(0.43,
0.55,
0.78)
(0.42,
0.54,
0.80)
(0.39,
0.51,
0.73)
(0.46,
0.60,
0.84)
(0.51,
0.66,
0.96)
(0.59,
0.72,
0.92)
(1,1,1)
Table 7. Weights and continuous consequence level.
wWeightCL
10.15/(0.15 + 0.15 + 0.14 + 0.12 + 0.14 + 0.11 + … + 0.07) = 0.144.23
20.15/(0.15 + 0.15 + 0.14 + 0.12 + 0.14 + 0.11 + … + 0.07) = 0.134.12
30.14/(0.15 + 0.15 + 0.14 + 0.12 + 0.14 + 0.11 + … + 0.07) = 0.123.69
40.12/(0.15 + 0.15 + 0.14 + 0.12 + 0.14 + 0.11 + … + 0.07) = 0.113.31
50.14/(0.15 + 0.15 + 0.14 + 0.12 + 0.14 + 0.11 + … + 0.07) = 0.123.69
60.11/(0.15 + 0.15 + 0.14 + 0.12 + 0.14 + 0.11 + … + 0.07) = 0.102.88
70.10/(0.15 + 0.15 + 0.14 + 0.12 + 0.14 + 0.11 + … + 0.07) = 0.092.57
80.08/(0.15 + 0.15 + 0.14 + 0.12 + 0.14 + 0.11 + … + 0.07) = 0.072.16
90.08/(0.15 + 0.15 + 0.14 + 0.12 + 0.14 + 0.11 + … + 0.07) = 0.061.73
100.08/(0.15 + 0.15 + 0.14 + 0.12 + 0.14 + 0.11 + … + 0.07) = 0.061.61
Table 8. Continuous level, rank, and classification of risk.
RiskPLCLRL RankClassification
Insufficient tunneling (C1)2.614.2311.062High
Deterioration of TBM (C2)2.724.1211.181High
Soil or rock movement (C3)2.463.699.063Moderate
Flooding in work area (C4)1.343.314.437Low
Tunnel segment deterioration (C5)2.303.698.504Moderate
Inappropriate working conditions (C6)2.332.886.705Moderate
Community complaints (C7)1.692.574.358Low
Economic fluctuations (C8)2.052.164.436Low
Human resource problem (C9)2.201.733.519Low
Unforeseen event (C10)1.621.612.6110Low
Table 9. Criteria to determine discrete probability and consequence levels.
Discrete Probability LevelProbabilityDiscrete Consequence LevelWeight
5Greater than 0.685Greater than 0.14
40.54–0.6840.12–0.14
30.40–0.5330.10–0.11
20.25–0.3920.07–0.09
1Less than 0.251Less than 0.07
Disclaimer/Publisher’s Note: The statements, opinions and data contained in all publications are solely those of the individual author(s) and contributor(s) and not of MDPI and/or the editor(s). MDPI and/or the editor(s) disclaim responsibility for any injury to people or property resulting from any ideas, methods, instructions or products referred to in the content.

