Article

Clearing the Path: Overcoming Barriers to Prevention through Design (PtD) Utilization in the US Construction Industry

by
Ahmed Jalil Al-Bayati
1,*,
Karim Bazzi
2,
Ali A. Karakhan
3 and
Elin Jensen
4
1
Construction Safety Research Center, Department of Civil and Architectural Engineering, Lawrence Technological University, 21000 West Ten Mile Rd., Southfield, MI 48075, USA
2
Lawrence Technological University, 21000 West Ten Mile Rd., Southfield, MI 48075, USA
3
Department of Reconstruction and Projects, University of Baghdad, Baghdad 10071, Iraq
4
Department of Civil and Architectural Engineering, Lawrence Technological University, 21000 West Ten Mile Rd., Southfield, MI 48075, USA
*
Author to whom correspondence should be addressed.
Safety 2024, 10(3), 74; https://doi.org/10.3390/safety10030074
Submission received: 26 June 2024 / Revised: 3 August 2024 / Accepted: 14 August 2024 / Published: 20 August 2024
(This article belongs to the Special Issue Safety Performance Assessment and Management in Construction)

Abstract

:
The construction industry presents significant high risks of injury and fatality to its workforce. Adopting prevention through design (PtD) principles is reported to have high potential for mitigating such risks and improving safety outcomes. PtD seeks to assess and reduce workplace hazards during the design phase, minimizing unsafe construction conditions. Despite its potential benefits, the construction industry encounters challenges in effectively utilizing PtD. Thus, the implementation of PtD in the US construction industry is limited, and designers’ awareness remains low. This evident lack of utilization warrants further examination of the contributing factors. The goal of this study is to identify and rank PtD utilization barriers in the United States (US) construction industry. This study pinpointed 12 pivotal barriers to PtD implementation through a systematic literature review. These barriers were categorized into industry-, project-, designer-, and client-related domains. Furthermore, they were grouped into three clusters based on their influence on PtD implementation from the most to the least influence, based on an expert matter questionnaire. This study also compared the experts’ rankings of the identified barriers with their citation frequencies in the reviewed articles. Among other observations, this study found that the lack of PtD professional training and formal education for project stakeholders negatively impacts the likelihood of PtD utilization and exacerbates several other barriers. Therefore, it is advisable to prioritize addressing this barrier by allocating the necessary resources and efforts to efficiently address it. Construction industry stakeholders with a vested interest in advancing PtD applications are encouraged to leverage the insights this study provides to expedite the adoption of PtD.

1. Introduction

The construction industry is widely recognized as one of the most hazardous work environments for employees and, by proxy, society. The construction industry consistently exhibits higher fatality and incident rates than most other industries [1,2,3,4,5]. In the United States (US), construction workers are 5.5 times more likely to be fatally injured than workers from other industries [6]. These hazardous working conditions necessitate increased efforts to mitigate workplace hazards and improve safety performance, thereby curbing the occurrence of workplace injuries and fatalities [7,8]. The hierarchy of controls is used to reduce occupational risk to a level that is considered as low as reasonably practicable [9,10]. The hierarchy of controls is a method to identify and rank controls that can be utilized to mitigate workplace hazards [11,12]. The safeguards/controls are arranged from the most effective to the least effective, as shown in Figure 1.
Personal protective equipment (PPE) is the least effective way to mitigate workplace hazards. The next level is the administrative controls, which aim to positively change the way employees work in a safer manner. For example, behavior-based safety (BBS) could be classified as an administrative control [13]. Higher in the hierarchy is the engineering controls. Engineering controls aim to isolate employees from potential hazards in order to keep them unharmed [11]. For instance, installing guardrails around the entire perimeter of a roof could significantly reduce the likelihood of falling, hazards especially if they are properly designed and installed in accordance with the Occupational Safety and Health Administration (OSHA) regulations (construction standards 29 CFR 1926) [11]. On top of these levels of controls are the elimination and substitution of hazards, which are considered the most effective ways to mitigate occupational hazards as they either physically remove the hazards from the workplace or replace them with safer alternatives [11]. The difficulty with the use of elimination and substitution methods is that they require designers’ involvement, where the designer should be willing to address workplace safety early on during the design and planning phases [10]. The elimination and substitution of workplace hazards, when utilized during the design phase, is referred to as prevention through design (PtD) [14].
Haslam et al. suggested that a design change could have mitigated up to half of the incidents they examined [15]. Similarly, Behm found that more than 40% of the examined fatalities were connected to the design aspect [16]. To provide an example, designers could envision that the construction process of a project would require the installation of guardrails to reduce the likelihood of falling hazards. For example, the designer could slightly modify the design to include a tall parapet around the entire parameter of the roof to act as a permanent protection against falling hazards. Construction standards (29 CFR 1926) within OSHA regulations require a guardrail to be made of any composite material and installed at a height of at least 1 m (39 inches) above the working surface [17,18]. Accordingly, the parapet would satisfy OSHA requirements. This minor design modification would eliminate falling hazards and is considered more effective than other mitigation measures such as engineering (e.g., metal or wooden guardrails) and administrative (e.g., safety monitoring and control access zone) controls. It should be noted that the term “designers” refers to architects and engineers (A/Es) responsible for project design.
The PtD technique has been gaining attention all around the world. In 1992, the Council of the European Communities (CEC) incorporated PtD principles into Council Directive 92/57/EEC, which mandates safety reviews during the design phase (CEC 1992). Accordingly, the United Kingdom’s (UK) Construction Design and Management Regulations were established to comply with the EU directive in 1994 (UK Government 1994). Based on these regulations, designers must ensure their designs prioritize health and safety by avoiding foreseeable risks, combating risks at the source, and protecting all workers and affected persons. Additionally, designers must provide adequate information about the project’s potential health and safety impacts and work with other project stakeholders to address them. Since then, the injury and fatality rates in the UK have significantly decreased. On the other hand, the International Organization for Standardization (ISO) has included prevention through design (PtD) concepts in occupational health and safety management systems. Notably, ISO 45001:2018 emphasizes the importance of considering risk reduction and safety improvements from the design stage [19]. Similarly, the American National Standards Institute (ANSI) and the American Society of Safety Professionals (ASSP) developed the ANSI/ASSP Z590.3-2011 standard entitled “Prevention through Design: Guidelines for Addressing Occupational Hazards and Risks in Design and Redesign Processes” to provide specific guidelines and methodologies for addressing safety in the design phase, targeting designers, engineers, and safety professionals directly involved in design processes [20].
However, the application of PtD in the US construction industry remains scarce, and awareness of this approach is still limited [21]. The goal of this research is to explore barriers hindering the adoption and implementation of PtD in the US construction industry. To achieve the research goal, the following two objectives were pursued:
  • To identify barriers that hinder the utilization of PtD within the construction industry;
  • To rank the identified PtD barriers based on their criticality for PtD adoption and implementation.
The remainder of this paper is structured as follows. The research methodology and findings are presented in Section 2, which has two subsections: the literature review and survey methodology. Section 3 discusses the implications of the study findings and how industry stockholders can utilize them to enhance PtD utilization. Finally, this research’s concluding remarks are presented in Section 4.

2. Research Methodology and Findings

A two-phase approach was utilized to achieve the research objectives. A literature review of existing studies on the topic was performed during phase one to identify barriers hindering the adoption and implementation of PtD in the US construction industry. Phase two involved a survey questionnaire used to rank the influence of identified barriers based on the experience of industry practitioners.

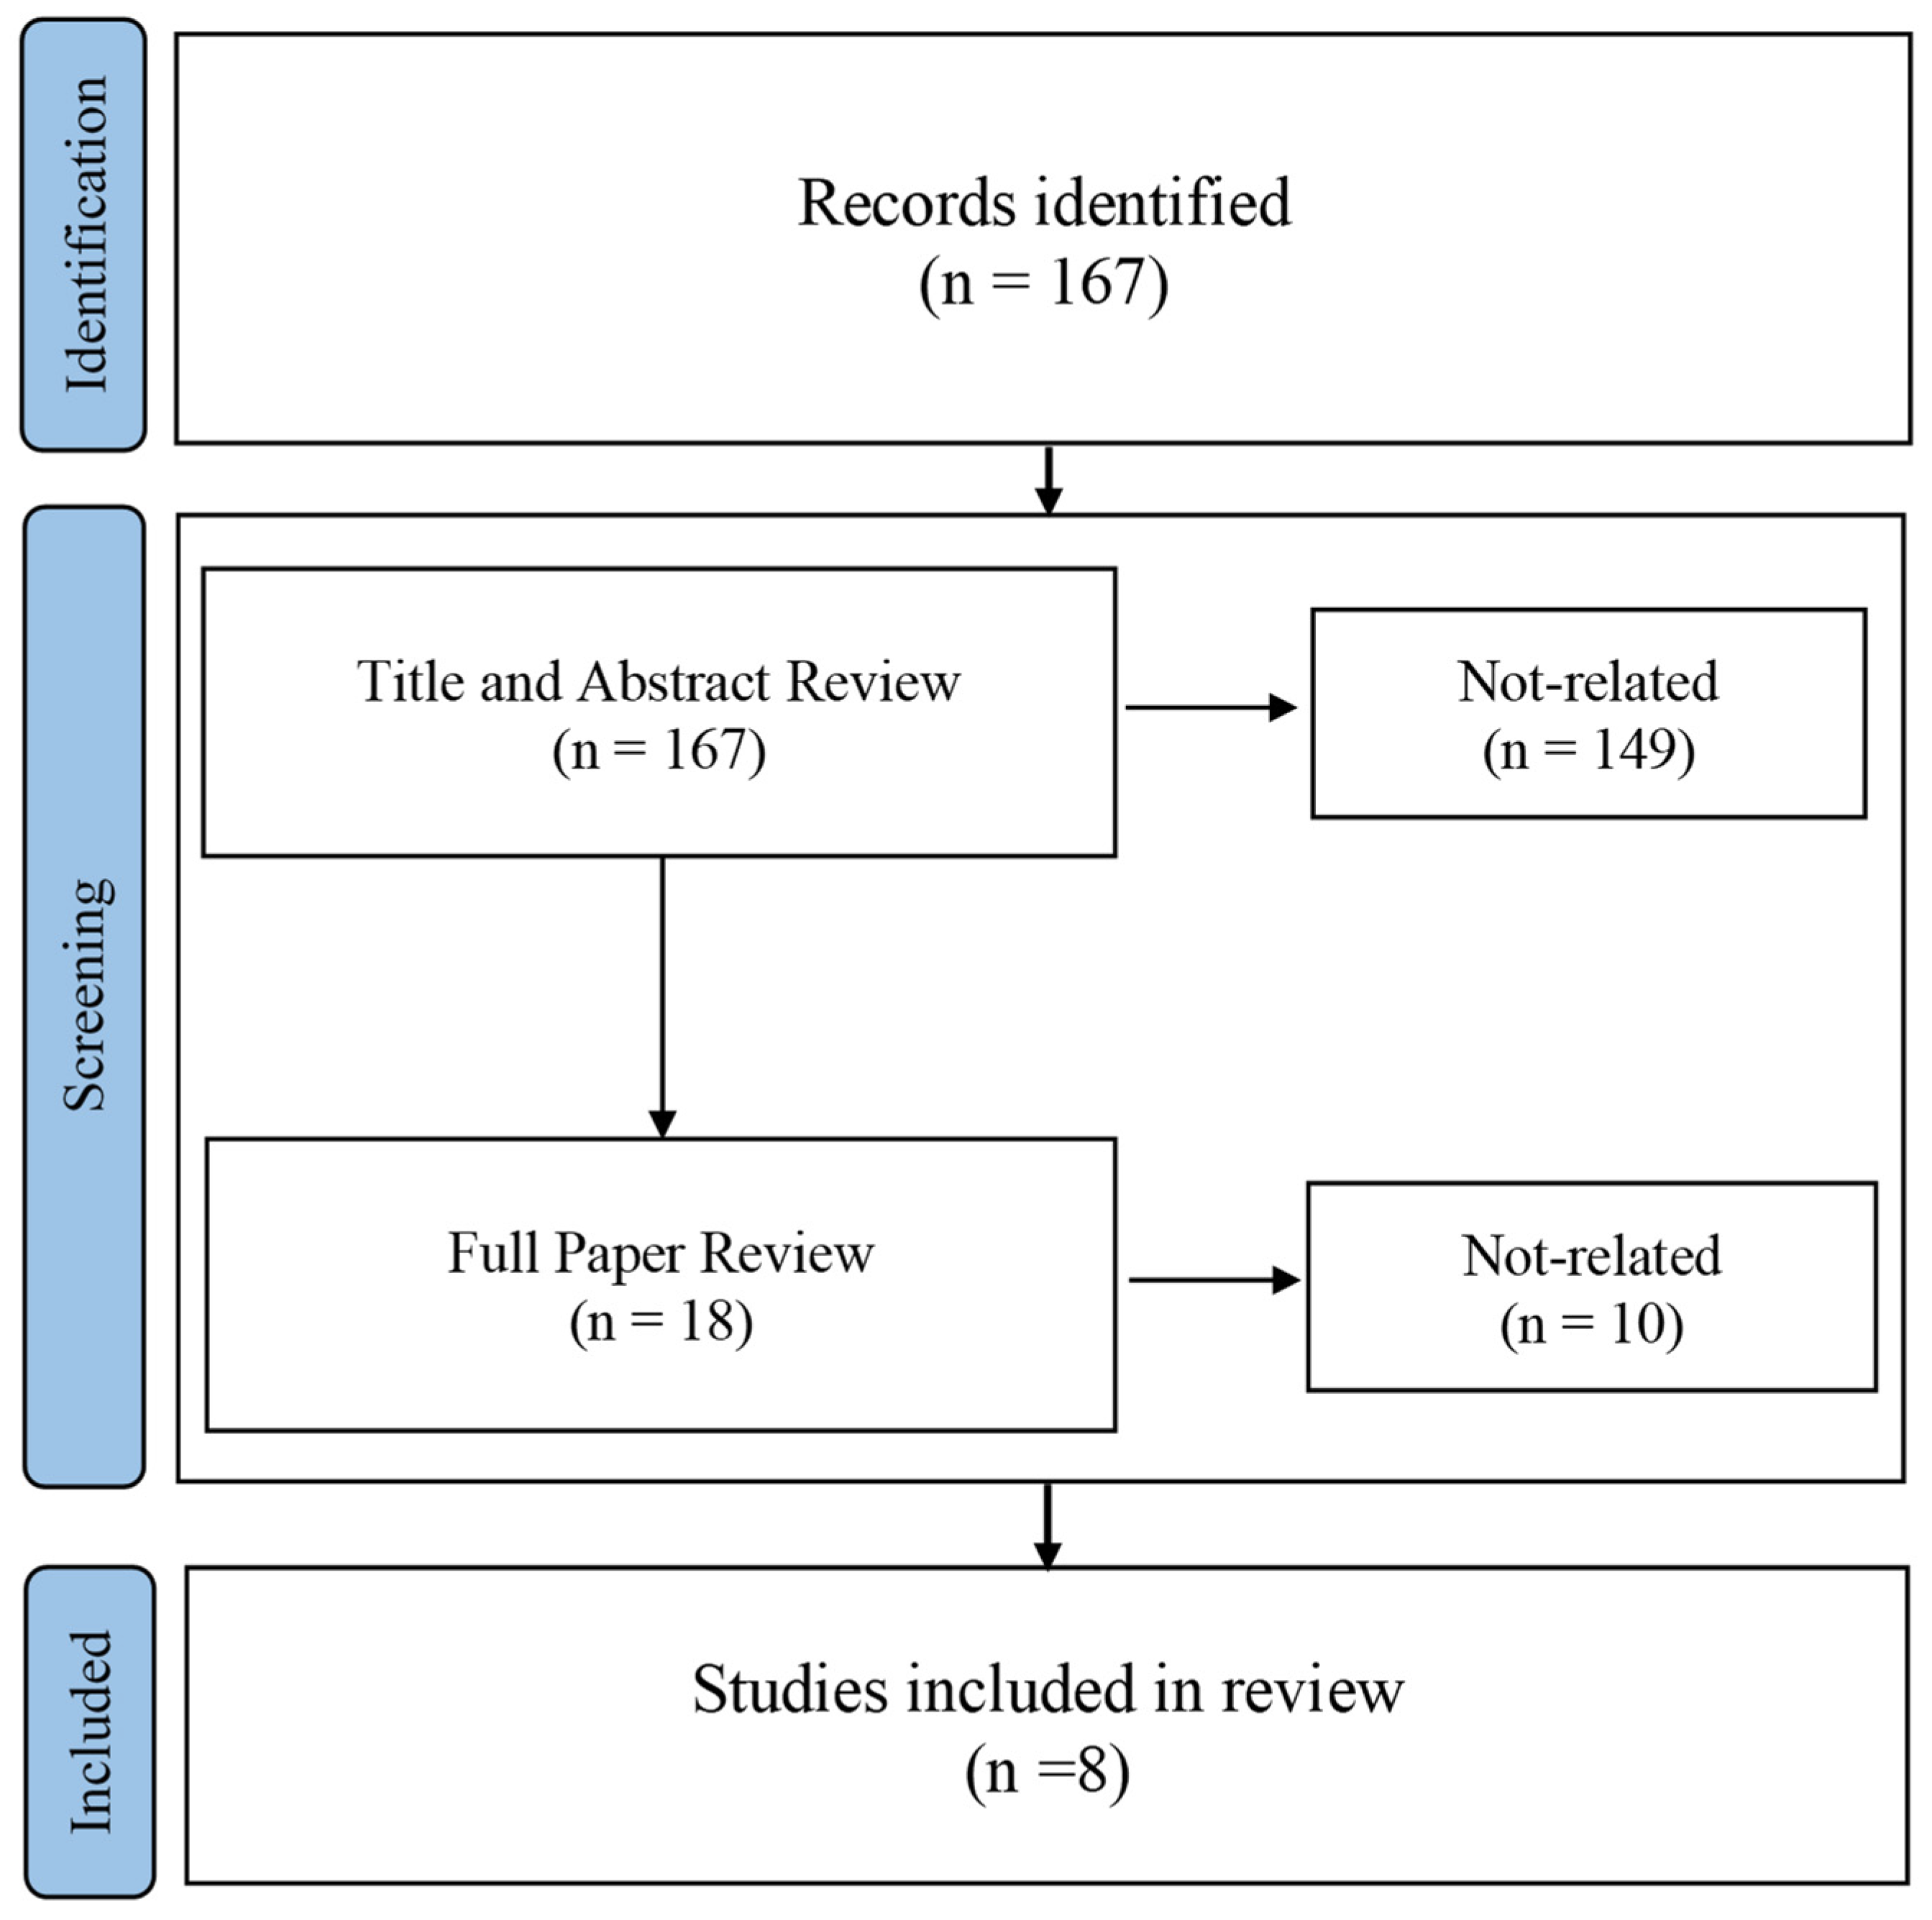
2.1. Phase 1: Literature Review Methodology and Findings

A systematic literature review was conducted to achieve the first research objective (to identify barriers that hinder the utilization of PtD within the construction industry). In particular, the Preferred Reporting Items for Systematic Reviews and Meta-Analyses (PRISMA) flow chart was utilized to identify relevant publications on the topic. PRISMA is an evidence-based minimal set of components for systematic review and meta-analysis reporting [22]. This technique consists of four primary steps: identification, screening, eligibility, and inclusion [22]. Figure 2 illustrates the process used to identify and include existing and relevant papers on the topic.
Initially, two databases were used to identify relevant papers, the American Society of Civil Engineers (ASCE) online library and ScienceDirect. As a starting point, a web search was conducted with keywords related to the subject with relevant keywords such as PtD, prevention through design, and design for safety. Only papers published from 2010 to 2023 were included in the search to ensure that the review captures current practices related to PtD. In addition, only studies conducted within the US were included in the literature review. This focus on peer-reviewed articles from the US acknowledges the unique challenges different countries face in implementing PtD. While the US is still progressing in PtD implementation, the UK, for example, has demonstrated more advanced progress in this area. This disparity highlights that different regions encounter distinct barriers and contexts, resulting in varying levels of advancement and adaptation of PtD practices.
The initial review encompassed an examination of the research title and keywords, and this examination of the identified 167 papers determined that all papers were deemed relevant to the topic, as shown in Figure 2. A content analysis was performed by examining the papers’ titles and abstracts. This process revealed that only 18 papers discussed PtD barriers and other papers focused on different topics related to PtD. Then, the identified 18 papers were thoroughly reviewed. The review included multiple aspects of the paper, such as the research methodology, results, findings, and conclusion sections. This revealed that only eight papers discussed PtD barriers. Accordingly, these eight papers were extensively reviewed to produce a list of PtD barriers. It is important to note that the research team did not control the final number of papers; instead, the research question dictated which articles were to be included in the final review.
  • PtD Utilization Barriers
The analysis uncovered 12 obstacles that impede PtD adoption among stakeholders in the construction sector; see Table 1. The 12 identified barriers were categorized into four main groups based on relevance—industry, project, designer, and client-related. Industry-related barriers include four obstacles that are relevant to the whole construction industry: (1) lack of PtD regulation and industry standards, (2) absence of contractual clauses to arrange PtD application, (3) absence of PtD professional development training, and (4) absence of PtD education on a college level. Because there are no regulations or industry standards requiring construction worker safety to be considered in project designs, the implementation of PtD is a voluntary practice [23]. Most of the time, designers delegate health and safety concerns to the contractors.
On the other hand, the absence of PtD-related contractual clauses raises uncertainties about scope modifications, change orders, dispute resolution, and increased responsibility for the designer. This barrier is a significant obstacle to their capacity to properly participate in safety constructability evaluations or other safety efforts required for PtD implementation [21]. In addition, the architectural, engineering, and construction (AEC) community lacks training programs for building a strong safety culture [23]. Such programs should typically include education, workshops, and professional development opportunities for understanding workplace hazards and applying PtD practices [24]. Specifically, Toole et al. found that PtD is rarely taught to undergraduate and graduate students in the area of civil and construction engineering [25].
Project-related barriers include potential increased costs and time spent on design work, and project delivery methods. It has been suggested that there is occasionally insufficient funding or time available for designing for worker health and safety since other important elements must be taken into account during the design process [23]. Implementing PtD may result in excessive costs [23]. Moreover, project delivery methods influence communication between stakeholders, especially between designers and constructors, which can impact PtD utilization positively or negatively. For example, the traditional project delivery method (i.e., design–bid–build) encourages separation between designers and contractors; it discourages collaboration since the contractor is chosen once the design is complete. The construction industry’s reputation for fragmentation and disconnection is exacerbated by limited communication between designers and builders during the design phase, particularly when employing the design–bid–build project delivery method [24].
Designer-related barriers included four barriers: a lack of PtD knowledge among designers, an absence of PtD training and education for designers, designers’ fear of liability and lack of insurance coverage, and an absence of motivation and incentives. Designers were found to be, to a large extent, unaware of the PtD practices and tools. Karakhan and Gambatese found that most of the designers who participated in their study neither studied the PtD concept at college nor were invited to participate in professional development courses related to PtD [21]. They stated that they were unaware of and typically do not participate in any effort involving construction means and methods. Regarding fear of liability, designers asserted that addressing workplace safety issues could increase their professional responsibility for injuries and may cause problems with their insurance providers. Designers also claimed that their lawyers advised them not to take part in safety procedures or be in charge of workplace safety to avoid legal liability for safety injuries [21]. Designers have typically steered away from involvement in safety due to liability worries because of traditional practices in the design and construction industries that explicitly outsource responsibility for site safety to the contractor [23]. Another barrier that was highlighted is the lack of motivation and incentives. This fact makes it difficult for designers to prioritize safety over other design requirements if there are no rewards or incentives for doing so. The absence of PtD implementation in the AEC sector has led to designers’ lack of interest in participating in any safety initiative, indeed besides the fear of liability concerns [21].
Client-related barriers include two barriers: lack of understanding of PtD among project owners/clients and lack of client encouragement for PtD implementation. The results of this study showed that there is a lack of client understanding of PtD implementation. This lack of knowledge has led to a lack of encouragement from clients and owners for PtD implementation. This makes sense because clients/owners cannot promote something they lack understanding of in the first place. It is agreed that PtD implementation relies primarily on designers. Still, it was also acknowledged that clients/owners were the most relevant party among industry stakeholders to influence the designers’ position on whether they would utilize PtD or not [23]. PtD implementation requires owners to be aware of PtD and communicate their interest in PtD to the design team. However, Toole et al. found that most owners are not aware of PtD. They also found that owners would not anticipate significant barriers to its implementation if they were aware of it [25]. Accordingly, it is believed that increasing clients’ awareness of PtD could increase PtD diffusion within the AEC industry.
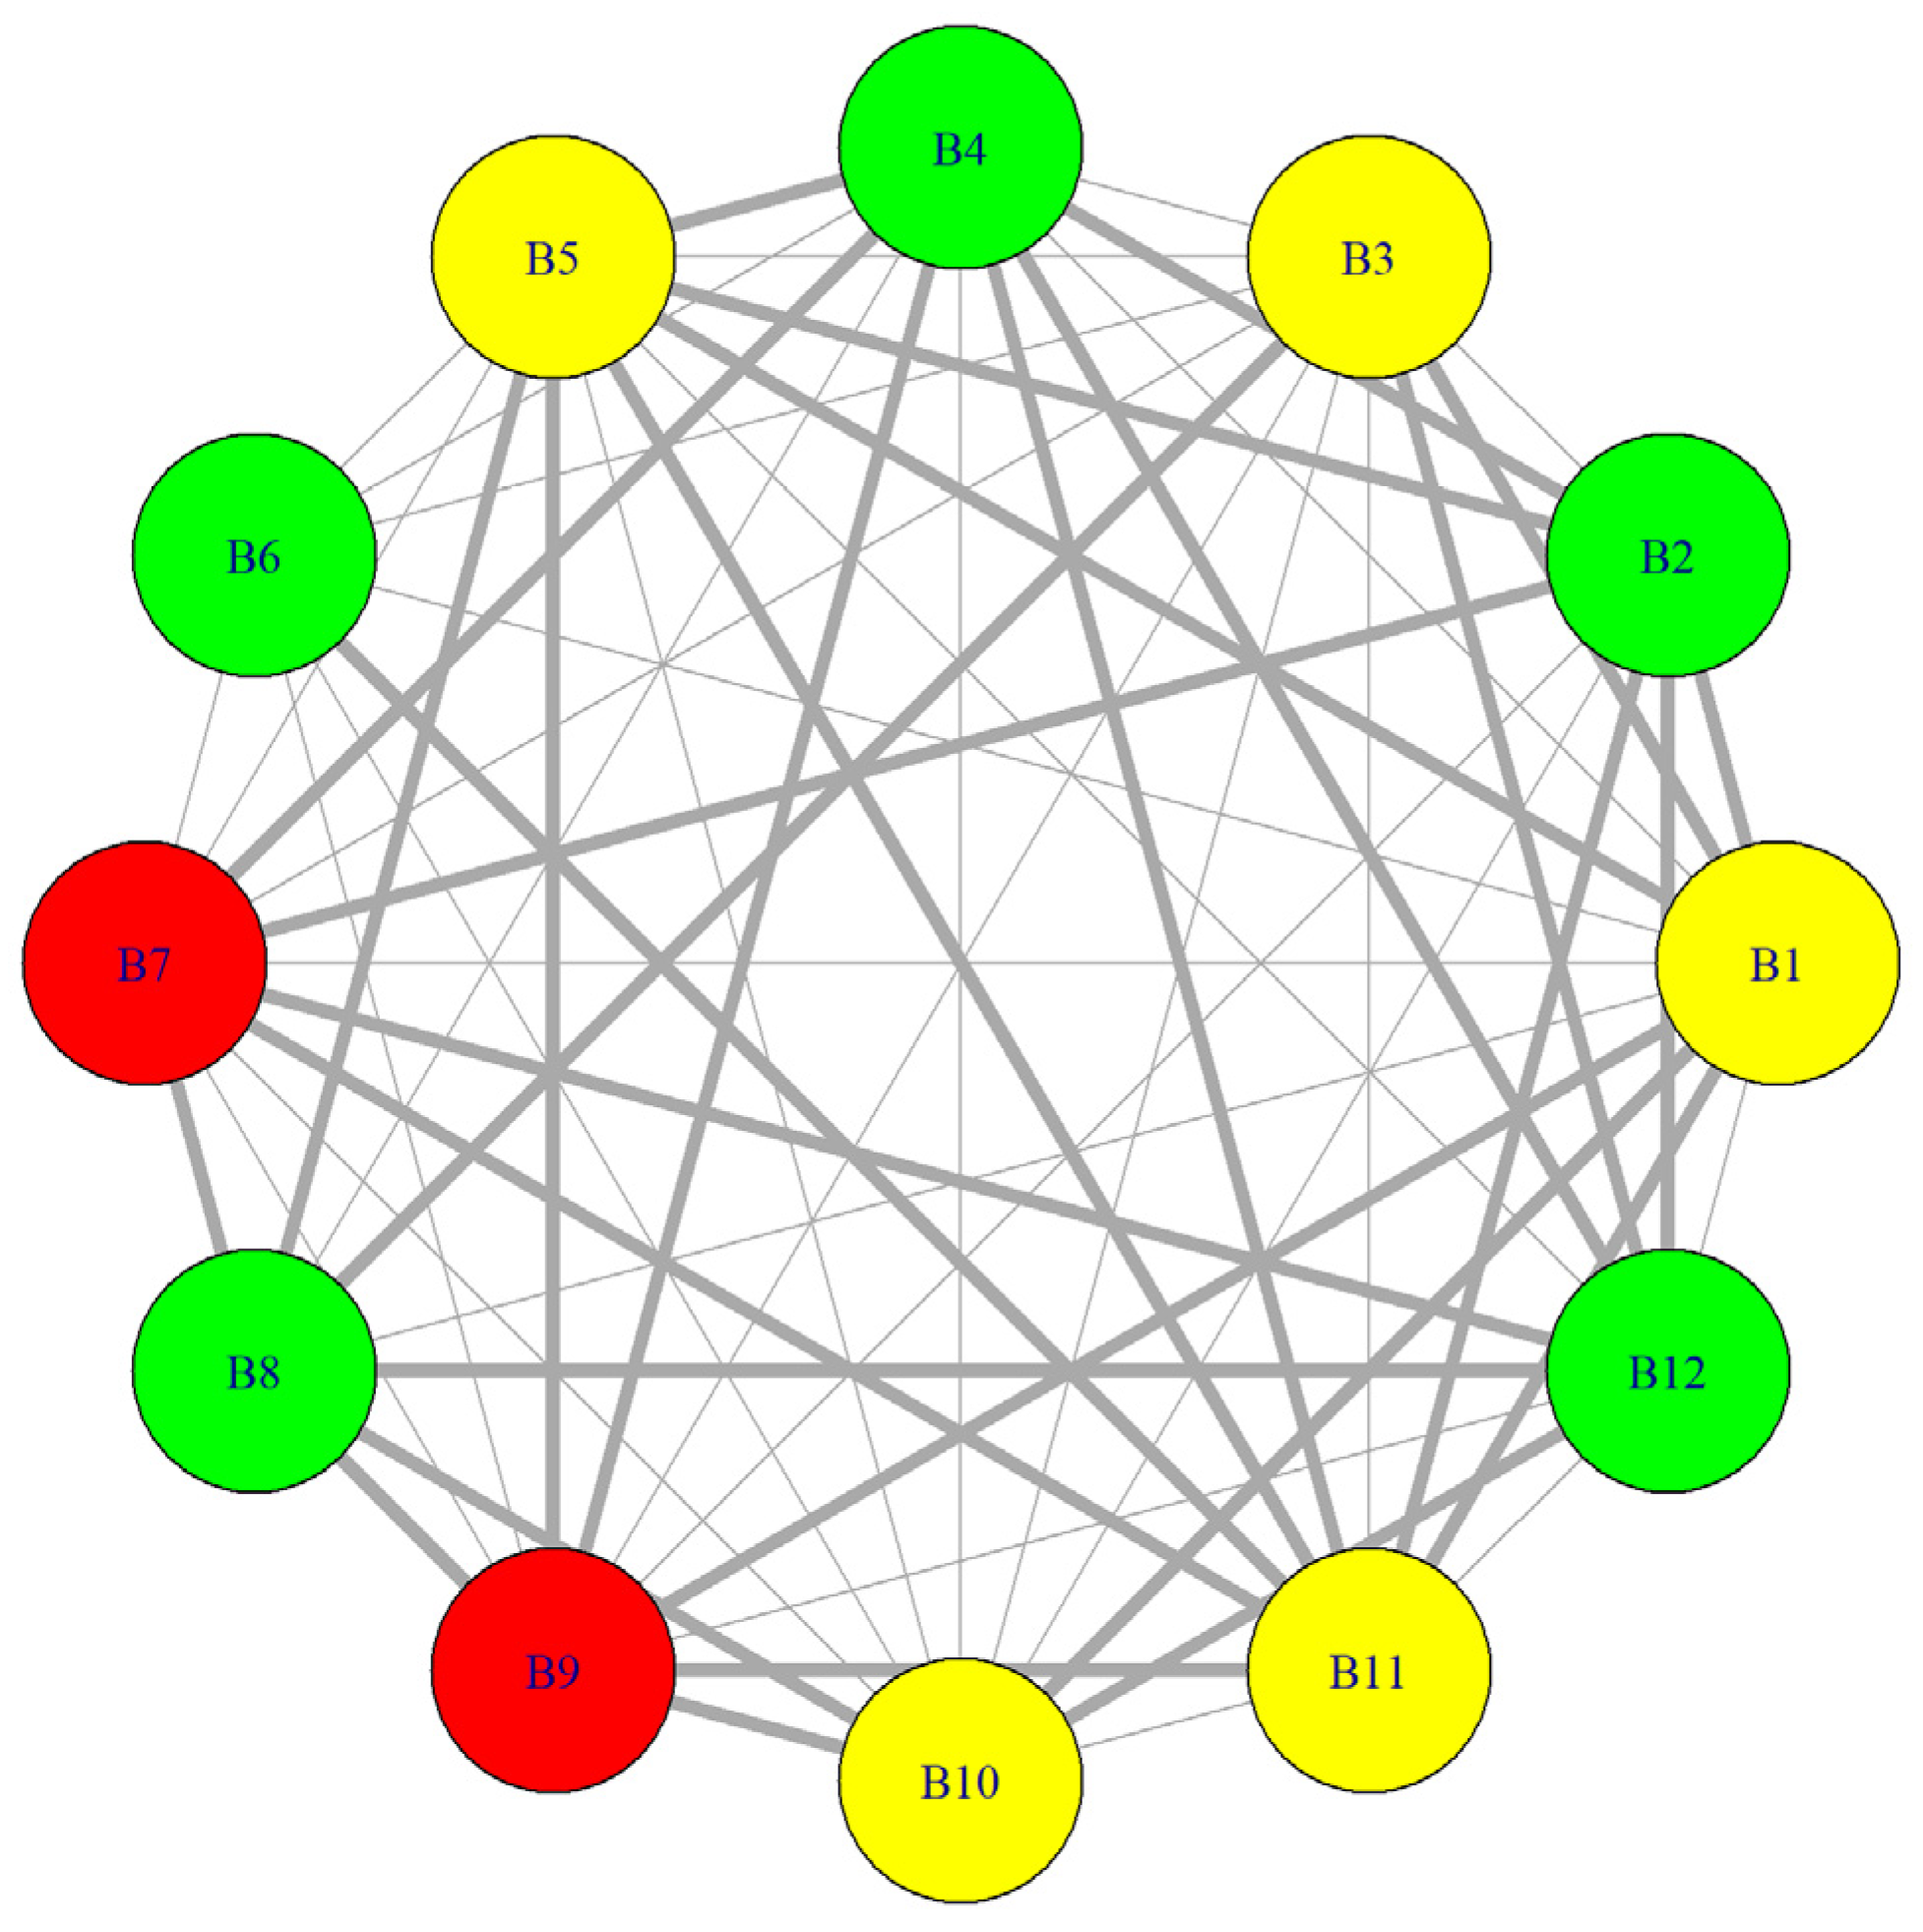
  • Social Network Analysis (SNA) and Clustering
The second step in this phase was conducting a social network analysis (SNA) to visualize the relationships between the identified barriers and references. This technique aids in comprehending both barriers that have been extensively studied and those that have not. Conducting SNA starts with creating an incidence matrix, a binary matrix representing the relationship between two sets of nodes. In this way, this study illustrates the connection between references and barriers based on the information presented in Table 1. Accordingly, barrier frequencies were calculated to determine how often each barrier is mentioned across all references. Then, a bipartite graph was created to visualize relationships between references and barriers. Bipartite graphs are usually used to understand and analyze the relationships between two different types of entities; see Figure 3. The nodes in Figure 3 represent the identified impeding barriers. In contrast, the edges (i.e., connections) between the nodes represent the number of articles that mention the barriers. A thicker edge means that the two connected barriers are mentioned together more often, and vice versa.
Furthermore, the barriers were categorized based on their frequency. Quantiles were used to divide the barriers into three equal-sized groups: “Least Referenced,” “Moderate Referenced,” and “Most Referenced.” Each group was then assigned a color, resulting in the following three groups, as shown in Figure 3:
  • Red nodes: Barriers with the highest frequency of mentions (most referenced).
  • Yellow nodes: Barriers with a moderate frequency of mentions.
  • Green nodes: Barriers with the lowest frequency of mentions (least referenced).
The results suggest that the barriers impeding PtD utilization that are most commonly referenced are B7 and B9 (i.e., six times or more). The results also suggest that the least referenced barriers are B2, B4, B6, B8, and B12 (3 times or fewer). This analysis was performed using the R programming environment for all calculations and visualizations.

2.2. Phase 2: Survey Methodology and Findings

A questionnaire was designed to rank and cluster the PtD barriers identified in the literature review. Approval from the Human Subject Institutional Review Board (HSIRB) was obtained. Invitations to participate in the study were sent utilizing a convenience sample, which is a widespread research methodology in construction research due to the infeasibility of other sampling plans, such as probability-based sampling [29]. Participants were presented with the study description and consent form, which led to the questionnaire being distributed only after the respondents voluntarily agreed to participate. The survey was administered over a three-month period, beginning in June 2023 and ending in August 2023.
The criteria for deeming a response as valid for this study were as follows: (1) respondents must be located in the US, (2) they should be construction practitioners with a minimum of five years of industry experience, and (3) they should possess knowledge of the PtD concept. Furthermore, the questionnaire incorporated a quality check question to ensure respondents’ full engagement. In particular, the quality check required respondents to select a specific option from multiple-choice answers. In this study, the quality check question instructed participants to choose the ‘minor impact’ option from a list of four choices (i.e., minor, moderate, high, and extremely high). Only participants who answered the quality check question correctly were allowed to complete the survey. Finally, the last filter involved examining the responses to the open-ended questions. If a nonsensical (i.e., gibberish) answer was provided, the whole response was rejected. The main goal of these filters was to objectively remove low-quality and unresponsive responses.
As a result, only 58 responses out of the 1584 received were considered valid for analysis. The number of responses deleted due to the responder having less than five years of experience was 679. The second filter was general knowledge about PtD, resulting in the deletion of 549 responses. The research team deleted 180 responses for responders who did not pass the quality check question. Finally, 118 responses were deleted due to nonsensical answers in the open-ended questions.
The respondents came from various types of construction specializations throughout the US, including residential construction (24.14%), commercial construction (37.93%), civil and heavy construction (32.76%), and industrial construction (5.17%). Responses from different job titles were collected. To be specific, the majority (48.28%) of responses came from structural engineers. A quarter (24.14%) of the respondents were architects, and another quarter (24.14%) were architectural engineers. The remaining 4% of the respondents were either civil or other engineers. Regarding respondents’ years of experience, the result indicated that 58.62% of the respondents had more than 10 years of experience, and 41.38% had 5 to 10 years of experience.
  • Data Analysis Method—Fuzzy Set Theory
To improve the accuracy of the criticality assessment, fuzzy set theory (FS) was applied. The FS is a robust system that does not necessitate precise inputs, as responses can be subjective and based on imprecise judgments. Accordingly, a FS was used in this study to quantify the opinions of participants. The respondents were asked to assess the impact of each identified PtD barrier on the overall industry’s resistance to PtD utilization. The questions were displayed using a four-point scale, where one indicated minor impact, two denoted moderate impact, three represented high impact, and four signified extremely high impact. The scale deliberately excludes a neutral standpoint to ensure the data can be ranked, categorized, and evenly spaced (i.e., interval scale of measurement).
A fuzzy number, P(θ), refers to a continuous set of possible values, where each value has a membership function that varies between 0 and 1. Typically, P(θ) is represented by triangular, Gaussian, or trapezoidal fuzzy numbers to convert verbal/linguistic expressions by participants into fuzzy numbers. Triangular fuzzy numbers provide more precise descriptions and accurate results than the other representations [29,30]. A triangular P(θ) includes three values, where P(θ) ≅ (θ1, θ2, θ3), where θ2 has the membership function of 1, and the values between θ2 and θ1 or θ3 have membership functions between 1 and 0. Values less than θ1 or greater than θ3 have a membership function of zero [31].
The triangular fuzzy numbers were selected by including three components for each linguistic term (i.e., fuzzification). The participants were asked to choose the impact level of each barrier affecting PtD utilization using the scale of linguistic terms (i.e., minor, moderate, high, and extremely high). The assessments of participants were combined using the linear opinion pool (LOP), where P i ( θ ) is a fuzzy triangular number [denoted by P θ = ( a , b , c ) ] assigned by the participants, and w i is the percentage of experts who were assigned P i ( θ ) .
P ( θ ) i = 0 n     w i P i θ
The fuzzy triangular number, P θ , resulting from Equation (1) can be represented by a crisp number, Val ( θ ), using Equations (2) and (3) as follows:
V a l   θ = 0 1 A v e r a g e   θ α ( · ) . d α
where θ α = { x | F ( x ) α } is the α-level of θ . The generalized formulation of a crisp number (i.e., defuzzification), Val ( θ ), can be achieved as shown in Equation (3):
V a l   θ = 1 2 0 1 [ b   a × α + a + c c b   × α ] 0 1 d α = a + 2 b   + c 4
For example, 13 out of the 58 respondents selected “extremely high impact” for barrier B1, yielding fuzzy numbers of (0.6, 0.8, and 1.00); 27 respondents selected “high impact”, yielding fuzzy numbers of (0.4, 0.6, and 0.8); 17 respondents selected “moderate impact”, yielding fuzzy numbers of (0.2, 0.4, and 0.6); and only one respondent selected “minor impact”, yielding fuzzy numbers of (0.00, 0.2, and 0.6). The aggregated fuzzy number, P(θ), for this barrier (B1) was calculated to be (0.379, 0.579, 0.779). This result indicates that the most likely value of P(θ) is 0.579, the highly likely value of P(θ) is 0.779, and the less likely value of P(θ) is 0.379. The resulting values for B1 are fuzzy triangular numbers, represented by P(θ) ≅ (a,b,c). However, it is necessary to transform fuzzy numbers into crisp values for the purpose of barrier evaluation. To achieve this goal, the defuzzification process was applied. The fuzzy triangular numbers, P(θ), are represented by crisp numbers, Val (θ), using Equation (3). For example, when calculating the crisp number, Val (θ), for barrier B1 with the values of a = 0.379, b = 0.579, and c = 0.779, the resulting crisp Val (θ) is 0.579. Table 2 shows the average crisp number of each barrier. The barriers are sorted from the highest crisp score to the lowest, (Al-Bayati, 2021) [29].
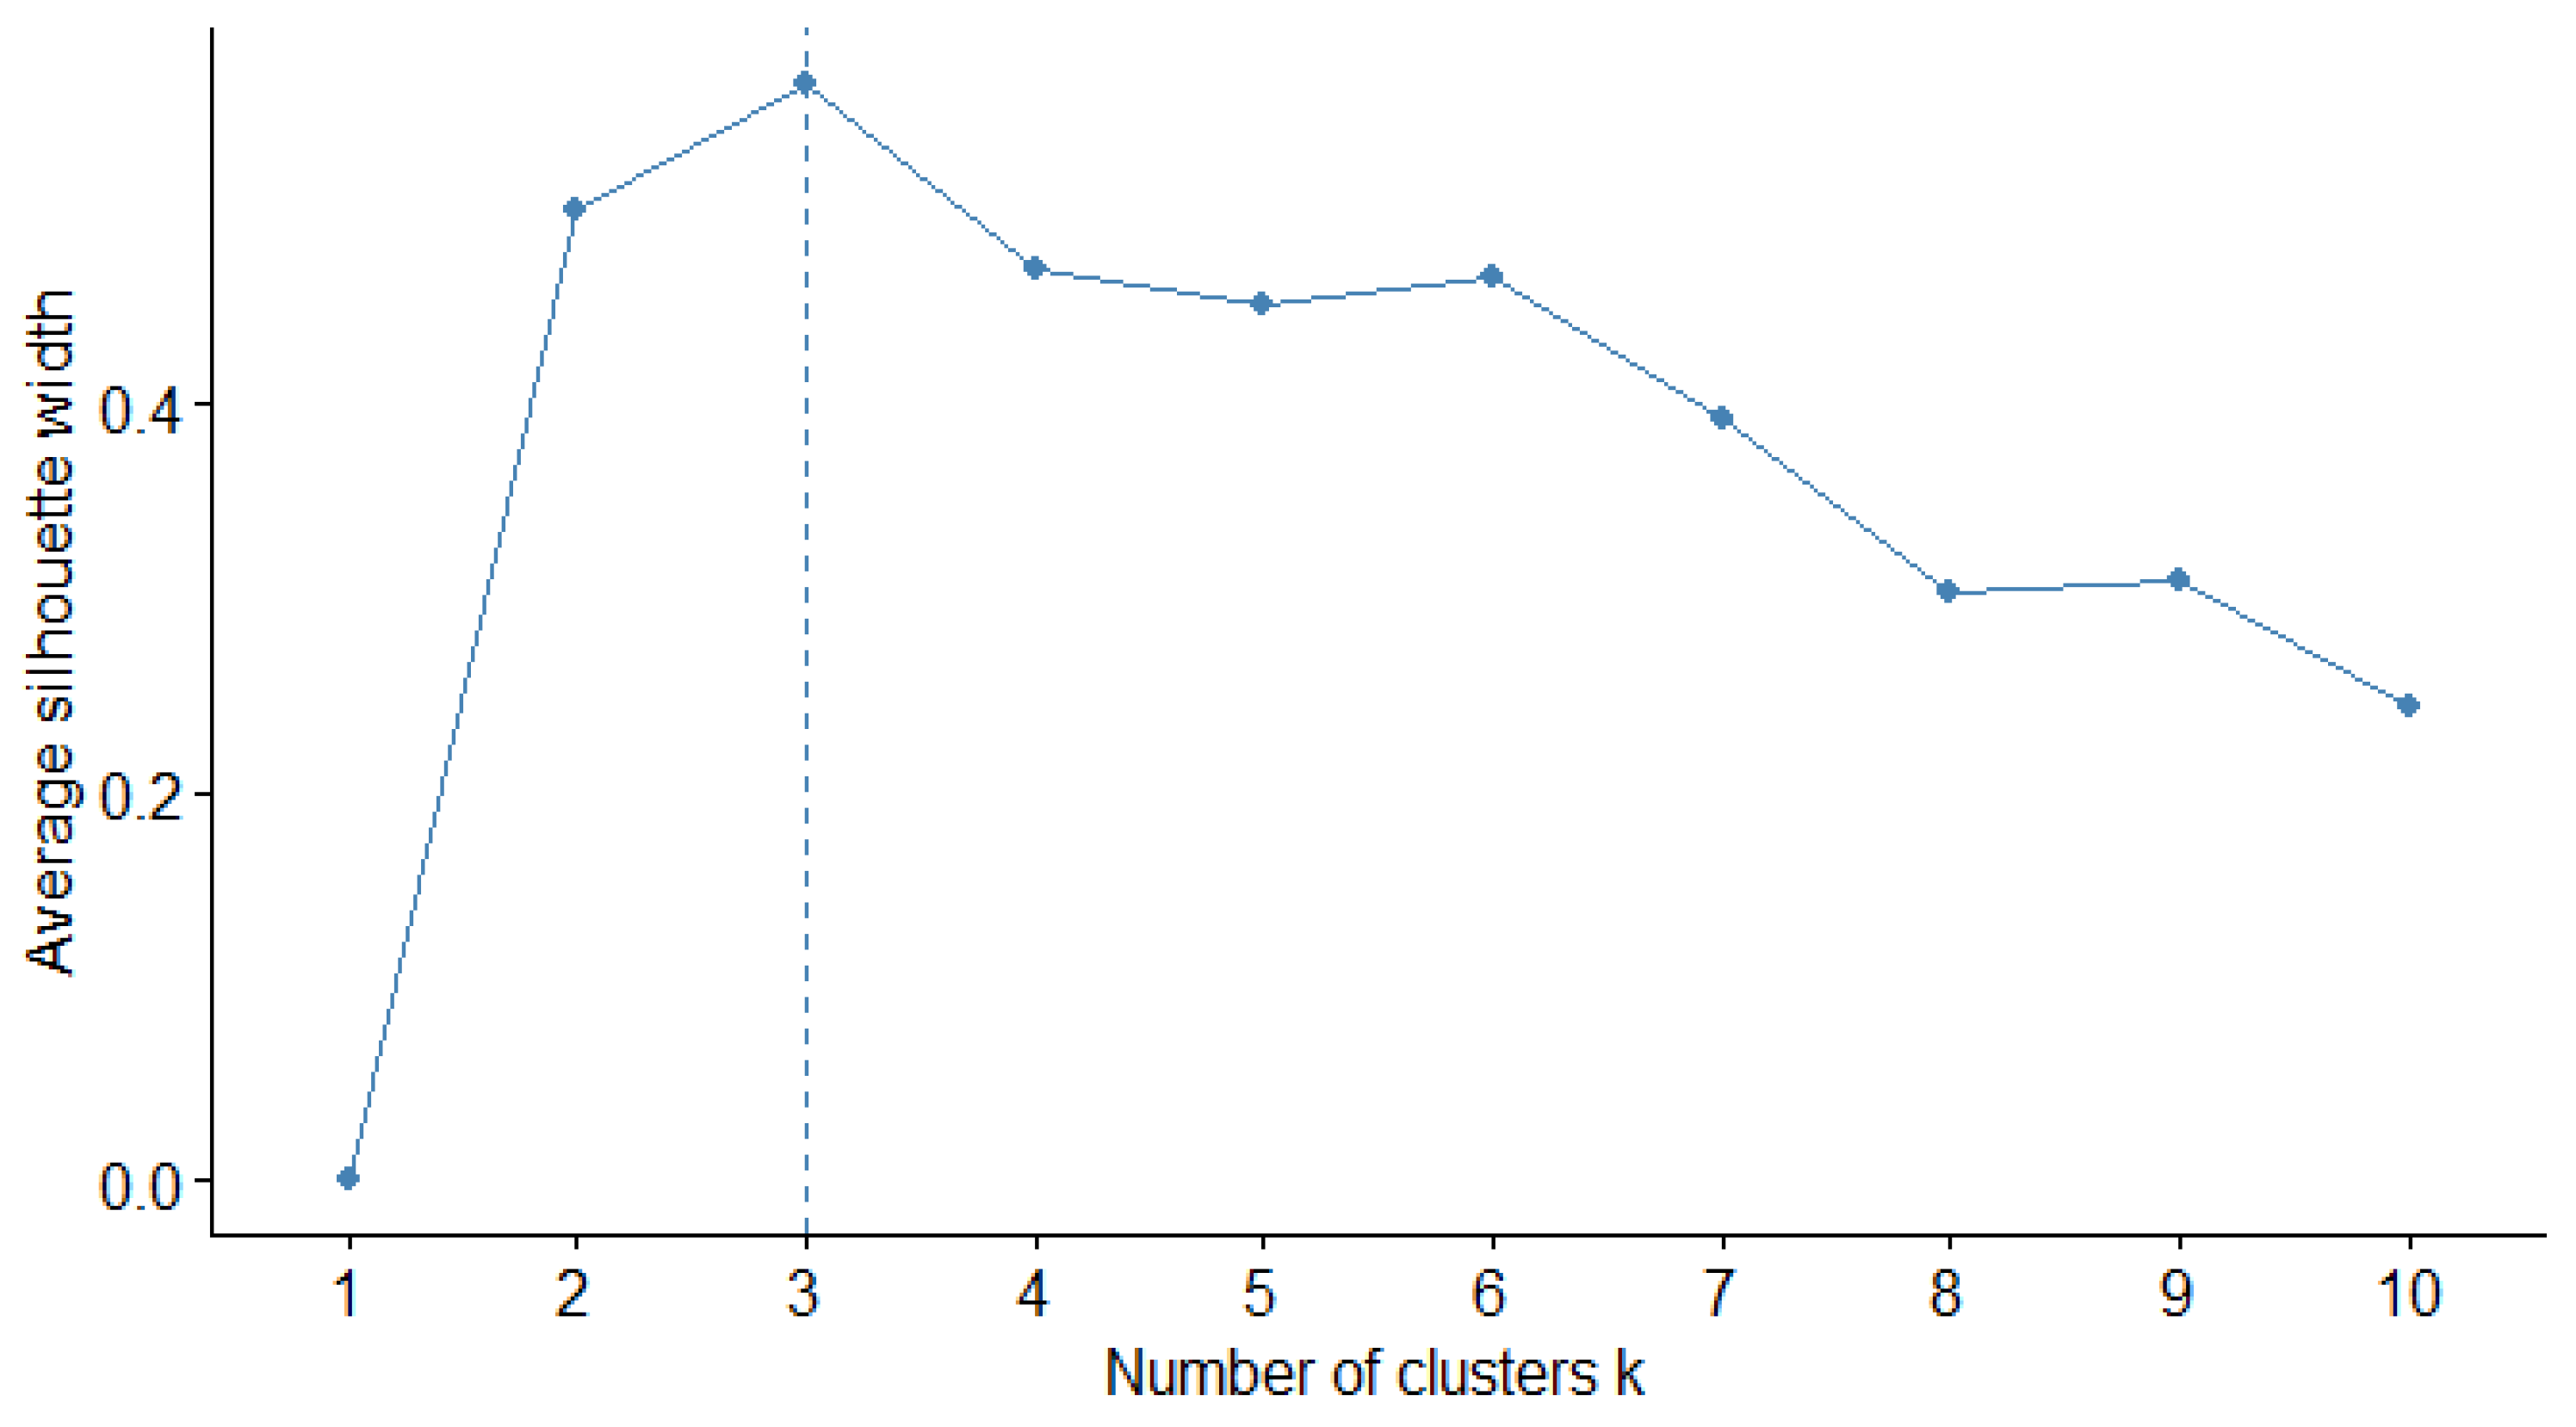
  • Barrier Clustering—Prioritizing
Clustering is a technique used to identify groups with similar attributes, features, and characteristics [32]. In the context of this study, clustering seeks to organize barriers with similar rankings (i.e., defuzzified crisp numbers) into distinct groups. This approach assists decision-makers in more effectively managing crucial barriers by prioritizing the allocation of available resources. Allocating barriers into clusters also helps decision-makers use a separate strategy for each group of barriers based on the impact of those barriers on the overall industry’s resistance toward PtD adoption and implementation. Several algorithms could be used for clustering. The most well-known algorithm types are connectivity, distribution, and centroid models (e.g., the K-means algorithm). The K-means algorithm is used in this study because the assessed barriers do not follow a specific distribution that can be used for clustering [33]. The K-means algorithm is operated based on the notion of similarity that is derived from the closeness of a data point to the centroid of the clusters. K-means is an iterative algorithm that identifies and classifies similar groups of barriers based on criticality. It includes two steps to identify the number of clusters and the barriers that should be included within each cluster. The optimal number of clusters (K) is determined in the first step. The second step is clustering iterations, where each barrier is allocated to the best fit cluster. The 12 PtD barriers were grouped using iterative K values ranging from two to ten clusters. Equation (4) was used to calculate the silhouette method’s similarity measure (S). The value of S ranges from “−1” to “1”, where a value near “1” indicates a well-matched cluster. Accordingly, the K value that produces the highest average silhouette score is the optimal clustering number.
S = b a m a x ( a , b )  
where a represents the mean intra-cluster distance, and b represents the distance between a barrier and the nearest cluster to which the barrier does not belong.
The clustering iterations step includes randomly assigning each barrier to a cluster, computing cluster centroids, assigning the barrier to the closest cluster centroid, and recomputing cluster centroids. It is worth mentioning that the computations and processing of these two steps are performed automatically by encoding the K-means algorithm into the R software Version 4.4. The optimal number of clusters must correspond to the maximum silhouette score [34]. Figure 4 shows that the silhouette score that indicates the optimal number of clusters is 3. Consequently, the 12 PtD barriers were classified into three clustering groups based on their impact on PtD utilization, ranging from the most influential barrier to the least, see Table 3. The first group is considered “highly influential” toward industry resistance to PtD utilization. This cluster includes four identified barriers: B7: lack of PtD knowledge among designers; B11: lack of understanding of PtD among project owners/clients; B5: potential increased costs and time of design work; and B8: absence of PtD training and education for designers. The second group is considered “moderately influential”. It involves five barriers: B9: designers’ fear of liability and lack of insurance coverage; B3: absence of PtD professional development training; B1: lack of PtD regulation and industry standards; B10: absence of motivation and incentives for designers; and B4: absence of PtD education on a college level. The third group is considered to be of “low influential” impact on the overall industry’s resistance to PtD utilization, and it consists of three barriers: B2: absence of contractual clauses to arrange PtD application; B6: project delivery methods not supporting PtD application; and B12: lack of encouragement from clients for PtD implementation.

3. Discussion

This study identified 12 PtD barriers with different levels of influence on PtD utilization in the AEC industry. These barriers were categorized into three groups based on their prevalence within the reviewed articles, from most to least studied. Additionally, they were categorized into three groups based on their level of influence, ranging from high to low, as assessed by survey participants. Industry stakeholders, professional associations, regulatory agencies, and scholars should prioritize addressing the barriers identified as highly influential barriers. By directing efforts toward the high-influence barriers, there is potential to increase the likelihood of PtD utilization in the near future. The barriers clustered as highly influential, based on survey participants, are B7, B11, B5, and B8. However, among these four most influential barriers, only B7 is among the most referenced barriers based on the literature review. B5 and B11 are among the moderately referenced barriers, while B8 is among the least referenced barriers; see Table 4. This finding may indicate a reduced emphasis among scholars on barriers with high influence, specifically the absence of PtD training and education for designers (i.e., B8). The lack of PtD knowledge among designers, B7, which is both a highly influential and extensively studied barrier, stems from the fact that training and education are absent for designers on both professional and educational levels (i.e., B8).
Industry practitioners identified the lack of understanding of the PtD concept among owners and clients (i.e., B11) as a highly influential barrier. This barrier may also stem from the deficiency in PtD knowledge among designers (i.e., B7). Designers with the requisite PtD knowledge and skills have the potential to educate project owners about the added value of PtD. They could play a crucial role in overcoming this barrier. This is particularly evident in the [35] study, which found that owners would utilize PtD if they were aware of it. However, civil engineers who are responsible for various aspects of construction project design, such as structural and geotechnical elements, are rarely exposed to PtD in their education. Previous research found that PtD is rarely included in US civil engineering curricula for both graduate and undergraduate studies [25]. The perceived PtD knowledge gap in the US arises from a lack of comprehensive educational initiatives or training opportunities available to civil and architectural engineers [36]. This highlights the need to develop PtD training programs and professional development initiatives. Designers, especially civil engineers, are well positioned to lead PtD collaborative initiatives due to their regular interactions with owners, architects, and builders. However, they need to acquire the needed PtD knowledge and skills first. Thus, integrating PtD education into college and university curricula can help ensure that future designers are well-equipped with the knowledge and skills needed to prioritize safety in design from the jump.
These educational efforts are essential steps toward enhancing safety practices and encouraging a safety culture within the construction industry. The Civil Engineering Program Criteria Task Committee (CEPCTC), a committee within the American Society of Civil Engineers (ASCE), has proposed updates to the civil engineering program criteria that were approved and will be effective beginning in the academic year of 2024–2025. These updates notably emphasize incorporating safety education as a core component of civil engineers’ professional attitudes and responsibilities [37]. Therefore, it is now more feasible than ever to integrate PtD principles into engineering curricula.
The fourth highly influential barrier based on the survey sample was the increase in project cost and time that may be associated with PtD utilization. The cost increase is unavoidable, as designers will invest their knowledge and time in conducting PtD reviews. Additionally, they will likely require professional liability insurance to manage the risks associated with this service. However, it is crucial to emphasize that any initial safety expenses will be outweighed by the reductions in accidents, injuries, and related costs during the construction phase. Investing in safety provides numerous benefits, including enhancing employee welfare, reducing workflow interruptions, lowering workers’ compensation expenses, and maintaining a positive corporate image [37]. A report by the National Safety Council (NSC) suggested that multiple studies found that each dollar invested in workplace injury prevention can generate a return of 2 USD to 6.20 USD [38]. The initial cost escalation is not a new phenomenon for new initiatives, as demonstrated by experiences with Leadership in Energy and Environmental Design (LEED) certification. For example, it has been suggested that obtaining a gold LEED certification might lead to a 7.43% increase in construction costs. Nevertheless, project owners could realize 31% savings on energy and water expenses throughout the project’s lifecycle [39].
Attention should also be directed toward addressing the moderately influential barriers to PtD adoption and implementation. These moderately influential barriers are determined to be the following five barriers: B9, B3, B1, B10, and B4. It can be seen that professional development and training opportunities on matters related to PtD are highlighted again in this group of barriers. Furthermore, the absence of PtD college education (i.e., B4) is among the least referenced studied barriers. As stated earlier, there is a dire need to develop educational materials for PtD. A strategic approach to increase PtD utilization would involve raising awareness and offering training/education within the design community, then extending these efforts to encompass other essential stakeholders in the construction industry, primarily project owners. Project owners aware of PtD will likely provide incentives for designers to conduct PtD reviews [18], which help overcome the absence of motivation (i.e., B10). In addition, this group of moderate barriers highlighted the need to apply PtD regulations and industry standards [23,24,26]. The lack of regulation and industry standards provides minimal guidelines for designers to embrace and implement PtD. Consequently, incorporating PtD into their practice would become an unnecessary risk. Designers reported that they had been advised by their legal counsel not to be involved in any safety efforts as they are not regulated by law or organized by well-known industry standards [24].
The survey findings suggested that B2, B6, and B12 have a low influence on PtD utilization. The absence of contractual clauses to arrange PtD application (i.e., B2) is a barrier that must be strategically addressed once more progress is made with higher-priority barriers. Recently, the Louisiana Supreme Court reviewed a case in which a contractor’s employee filed a negligence case against the design firm and determined that a design professional did not have a duty of care toward the contractor’s employees following the American Institute of Architects (AIA) contract terms [40]. To overcome these barriers, it is essential to establish clear legal frameworks and industry standards that define the roles and responsibilities of designers when practicing PtD, providing them with confidence and assurance that their efforts to enhance safety would not result in legal repercussions. It is highly recommended that explicit contract language and clauses be incorporated to promote the inclusion of safety measures in the design process. Such provisions can help establish accountability and ensure that PtD principles are followed, contributing to improved worker safety and project outcomes. However, achieving widespread adoption of these contractual changes may require industry-wide advocacy and collaboration to establish best practices and standards for PtD in construction contracts.
These new provisions are specifically needed for design–bid–build contracts, which lead to B6 (i.e., Project delivery methods not supporting PtD application). Design–bid–build, the traditional delivery method, often inhibits collaboration between designers and constructors, therefore limiting PtD applications early in the project development process [22]. In contrast, design–build and construction management at risk project delivery methods allow for collaboration between designers and contractors, facilitating the integration of safety measures in design from the start of project development [24]. This is reasonable because contractors possess safety knowledge through their experience, whereas designers lack the necessary expertise due to the absence of tailored educational materials and professional development opportunities targeting them as the main audience. Once all of these recommendations are followed, it is believed that owners/clients will be highly motivated to apply PtD to their projects, which will help overcome B12 (i.e., lack of encouragement from clients for PtD implementation). Finally, this study did not explore other nations’ efforts and solutions to the identified barriers. Therefore, examining the solutions successfully employed by other countries that have progressed in implementing PtD is crucial.

4. Concluding Remarks

PtD has the potential to reduce the alarming rates of fatal and non-fatal injuries within the construction industry in the US. This study has identified and discussed the most influential barriers to PtD utilization in the US construction industry. There is a dire need to create educational and professional development materials to improve knowledge and the needed skills to implement PtD practice. This approach will significantly improve the understanding of PtD among designers. This study further suggests an interdependent relationship between the lack of PtD knowledge among designers and other barriers, such as inadequate understanding among project owners and concerns about liability, which emphasizes the importance of this approach. This study also emphasizes that certain barriers, including the lack of PtD training and education for designers, as well as the potential escalation in costs and time in design work, are deemed highly influential by industry practitioners yet have garnered relatively less scholarly focus. Hence, the initiatives and recommendations made by scholars to enhance PtD utilization are limited. This study contributes to a better understanding of PtD utilization barriers, which will help in proposing better remedies. Accordingly, construction industry stakeholders should conscientiously incorporate this study’s findings into their endeavors to enhance PtD utilization.

Author Contributions

Conceptualization, all authors; methodology, A.J.A.-B.; software, all authors; validation, all authors; formal analysis, A.J.A.-B.; investigation, A.J.A.-B. and K.B.; resources, all authors; writing—original draft preparation, all authors; writing—review and editing, all authors; visualization, A.J.A.-B.; supervision, A.J.A.-B.; project administration, A.J.A.-B. All authors have read and agreed to the published version of the manuscript.

Funding

This study was funded by the members of the Construction Safety Research Center (CSRC) and the Department of Civil and Architectural Engineering at Lawrence Technological University.

Institutional Review Board Statement

The study was conducted in accordance with the guidelines of the Declaration of Helsinki and approved by the Institutional Review Board of Lawrence Technical University on 1 June 2023.

Informed Consent Statement

Informed consent was obtained from all subjects involved in the study.

Data Availability Statement

Some or all data, models, or codes that support the findings of this study are available from the corresponding author upon reasonable request.

Conflicts of Interest

The authors declare no conflicts of interest.

References

  1. He, C.; McCabe, B.; Jia, G.; Sun, J. Effects of Safety Climate and Safety Behavior on Safety Outcomes between Supervisors and Construction Workers. J. Constr. Eng. Manag. 2020, 146, 04019092. [Google Scholar] [CrossRef]
  2. Chen, H.; Li, H.; Goh, Y. A review of construction safety climate: Definitions, factors, relationship with safety behavior and research agenda. Saf. Sci. 2021, 142, 105391. [Google Scholar] [CrossRef]
  3. Idoro, G.I. Health and safety management efforts as correlates of performance in the Nigerian construction industry. J. Civ. Eng. Manag. 2008, 14, 277–285. [Google Scholar] [CrossRef]
  4. Williams, O.S.; Hamid, R.A.; Misnan, M.S. Accident causal factors on the building Construction Sites: A review. Int. J. Built Environ. Sustain. 2018, 5, 78–92. [Google Scholar] [CrossRef]
  5. Al-Bayati, A.J.; Albert, A.; Ford, G. Construction Safety Culture and Climate: Satisfying the Necessity for an Industry Framework. Pract. Period. Struct. Des. Constr. 2019, 24, 04019028. [Google Scholar] [CrossRef]
  6. Al-Bayati, A.J.; Rener, A.T.; Listello, M.P.; Mohamed, M. PPE non-compliance among construction workers: An assessment of contributing factors utilizing fuzzy theory. J. Saf. Res. 2023, 85, 242–253. [Google Scholar] [CrossRef]
  7. Buniya, M.K.; Othman, I.; Sunindijo, R.Y.; Karakhan, A.A.; Kineber, A.F.; Durdyev, S. Contributions of safety critical success factors and safety program elements to overall project success. Int. J. Occup. Saf. Ergon. 2023, 29, 129–140. [Google Scholar] [CrossRef]
  8. Chen, H.; Chen, C.; Li, H.; Zhang, J.; Yang, Z. A simulation study on the processes of Intra-Group informal interaction affecting workers’ safety behaviors. Int. J. Environ. Res. Public Health 2022, 19, 10048. [Google Scholar] [CrossRef]
  9. Manuele, F. Risk assessment & hierarchies of control. Prof. Saf. J. 2005, 50, 33–39. [Google Scholar]
  10. Lyon, B.K.; Popov, G. Risk Treatment Strategies: Harmonizing the Hierarchy of Controls & Inherently Safer Design Concepts. Prof. Saf. J. 2019, 64, 34–43. [Google Scholar]
  11. Occupational Safety and Health Administration (OSHA). Regulations (Standards—29 CFR), 2023. Available online: https://www.osha.gov/laws-regs/regulations/standardnumber/1926 (accessed on 8 July 2024).
  12. National Institute for Occupational Safety and Health (NIOSH). Hierarchy of Controls; Centers for Disease Control and Prevention (CDC): Atlanta, GA, USA, 2023. Available online: https://www.cdc.gov/niosh/topics/hierarchy/default.html (accessed on 12 November 2023).
  13. Ko, C.H.; Abdulmajeed, H.A. Improving Construction Safety: Lessons Learned from COVID-19 in the United States (Special issue: Advances in Construction Safety Management Practices). Sustainability 2022, 14, 7137. [Google Scholar] [CrossRef]
  14. Karakhan, A.A.; Gambatese, J.A. Safety Innovation and Integration in High-Performance Designs: Benefits, Motivations, and Obstacles. Pract. Period. Struct. Des. Constr. 2017, 22, 04017018. [Google Scholar] [CrossRef]
  15. Haslam, R.A.; Hide, S.A.; Gibb, A.G.F.; Gyi, D.E.; Pavitt, T.; Atkinson, S.; Duff, A.R. Contributing factors in construction accidents. Appl. Ergon. 2005, 36, 401–415. [Google Scholar] [CrossRef] [PubMed]
  16. Behm, M. Linking construction fatalities to the design for construction safety concept. Saf. Sci. 2005, 43, 589–611. [Google Scholar] [CrossRef]
  17. Rajendran, S.; Gambatese, J. Risk and financial impacts of prevention through design solutions. Pract. Period. Struct. Des. Constr. 2013, 18, 67–72. [Google Scholar] [CrossRef]
  18. Karakhan, A.; Gambatese, J. Hazards and risk in construction and the impact of incentives and rewards on safety outcomes. Pract. Period. Struct. Des. Constr. 2018, 23, 04018005. [Google Scholar] [CrossRef]
  19. ISO 45001:2018; Occupational Health and Safety Management Systems—Requirements with Guidance for Use. International Organization for Standardization (ISO): Geneva, Switzerland, 2018. Available online: https://www.iso.org/standard/63787.html (accessed on 15 July 2024).
  20. American National Standards Institute (ANSI); American Society of Safety Professionals (ASSP). Prevention through Design: Guidelines for Addressing Occupational Hazards and Risks in Design and Redesign Processes [ANSI/ASSP Z590.3-2011 (R2016)]; ASSP: Park Ridge, IL, USA, 2016. [Google Scholar]
  21. Karakhan, A.A.; Gambatese, J.A. Integrating Worker Health and Safety into Sustainable Design and Construction: Designer and Constructor Perspectives. J. Constr. Eng. Manag. 2017, 143, 04017069. [Google Scholar] [CrossRef]
  22. PRISMA (Preferred Reporting Items for Systematic Reviews and Meta-Analyses). 2015. Available online: http://www.prisma-statement.org/ (accessed on 12 November 2023).
  23. Gambatese, J.A.; Gibb, A.G.; Brace, C.; Tymvios, N. Motivation for Prevention through Design: Experiential Perspectives and Practice. Pract. Period. Struct. Des. Constr. 2017, 22, 04017017. [Google Scholar] [CrossRef]
  24. Gambatese, J.A.; Toole, T.M.; Abowitz, D.A. Owner Perceptions of Barriers to Prevention through Design Diffusion. J. Constr. Eng. Manag. 2017, 143, 04017016. [Google Scholar] [CrossRef]
  25. Toole, T.M.; Gambatese, J.A.; Abowitz, D.A. Owners’ Role in Facilitating Prevention through Design. J. Prof. Issues Eng. Educ. Pract. 2017, 143, 04016012. [Google Scholar] [CrossRef]
  26. Jin, Z.; Gambatese, J.; Karakhan, A.; Nnaji, C. Analysis of Prevention through Design Studies in Construction: A Subject Review. J. Saf. Res. 2023, 84, 138–154. [Google Scholar] [CrossRef]
  27. Toole, T.M.; Erger, K. Prevention through Design: Promising or Perilous? J. Leg. Aff. Disput. Resolut. Eng. Constr. 2019, 11, 04518023. [Google Scholar] [CrossRef]
  28. Ibrahim, C.K.I.C.; Belayutham, S.; Mohammad, M.Z.; Ismail, S. Development of a Conceptual Designer’s Knowledge, Skills, and Experience Index for Prevention through Design Practice in Construction. J. Constr. Eng. Manag. 2022, 148, 04021199. [Google Scholar] [CrossRef]
  29. Al-Bayati, A.J. Impact of Construction Safety Culture and Construction Safety Climate on Safety Behavior and Safety Motivation. Safety 2021, 7, 41. [Google Scholar] [CrossRef]
  30. Li, D.F.; Hong, F.X. Solving constrained matrix games with payoffs of triangular fuzzy numbers. Comput. Math. Appl. 2012, 64, 432–446. [Google Scholar] [CrossRef]
  31. Emrouznejad, A.; Ho, W. Analytic hierarchy process and fuzzy set theory. In Fuzzy Analytic Hierarchy Process; Chapman and Hall/CRC: Boca Raton, FL, USA, 2017; pp. 1–10. [Google Scholar]
  32. Saxena, A.; Prasad, M.; Gupta, A.; Bharill, N.; Patel, O.P.; Tiwari, A.; Er, M.J.; Ding, W.; Lin, C.-T. A review of clustering techniques and developments. Neurocomputing 2017, 267, 664–681. [Google Scholar] [CrossRef]
  33. Na, S.; Xumin, L.; Yong, G. Research on k-means clustering algorithm: An improved k-means clustering algorithm. In Proceedings of the 2010 Third International Symposium on Intelligent Information Technology and Security Informatics, Jian, China, 2–4 April 2010; IEEE: Piscataway, NJ, USA, 2010; pp. 63–67. [Google Scholar]
  34. Yuan, C.; Yang, H. Research on K-value selection method of K-means clustering algorithm. J 2019, 2, 226–235. [Google Scholar] [CrossRef]
  35. Toole, M. History and Future of PTD. Prevention through Design. 2017. Available online: https://designforconstructionsafety.org/history-and-future-of-ptd/ (accessed on 12 November 2023).
  36. Al-Bayati, A.J.; Jensen, E.; Eiris, R.; Abudayyeh, O. Integrating Prevention Through Design (PtD) Into Engineering Curricula. Proc. Int. Struct. Eng. Constr. 2024, 11, CSA-04. [Google Scholar] [CrossRef]
  37. Al-Bayati, A.J.; Alghamdi, A.; Abydayyeh, O. Improving the Safety Culture and Climate of Smaller Construction Firms: A Necessary Addition to the OSH Intervention Model. J. Civ. Eng. Constr. 2023, 12, 187–196. [Google Scholar] [CrossRef]
  38. National Safety Council (NSC). 2014 Injury Facts; National Safety Council: Itasca, IL, USA, 2014. [Google Scholar]
  39. Uğura, L.O.; Leblebicib, N. An examination of the LEED green building certification system in terms of construction costs. Renew. Sustain. Energy Rev. 2018, 81, 1476–1483. [Google Scholar] [CrossRef]
  40. Bonilla v. Verges Rome Architects. No. 2023-C-00928, Supreme Court of Louisiana. 2024. Available online: https://law.justia.com/cases/louisiana/supreme-court/2024/2023-c-00928.html (accessed on 28 July 2024).
Figure 1. Occupational hazard hierarchy of controls.
Safety 10 00074 g001
Figure 2. Research methodology flowchart.
Safety 10 00074 g002
Figure 3. Visualization SNA network—PtD barriers.
Safety 10 00074 g003
Figure 4. The optimal number of clusters. The dashed line in the figure represents the intersection between the number of clusters and the average silhouette width.
Safety 10 00074 g004
Table 1. The Identified PtD barriers and their proposed categories.
CategoryBarrierReferences
IndustryB1: Lack of PtD regulations and industry standards[14,21,24,25,26]
B2: Absence of contractual clauses to arrange PtD application[21,26,27]
B3: Absence of PtD professional development training[21,23,24,26]
B4: Absence of PtD education on a college level[14,26,28]
Project B5: Potential increased costs and time required for design work[21,23,24,26,27]
B6: Project delivery methods not supporting PtD application[14,28]
DesignerB7: Lack of PtD knowledge among designers[14,21,24,25,26,27,28]
B8: Absence of PtD training and education for designers[14,21]
B9: Designers’ fear of liability and lack of insurance coverage[14,21,23,24,27,28]
B10: Absence of motivation and incentives for designers [14,21,23,24,26]
ClientB11: Lack of understanding of PtD among project owners/clients[24,25,26,28]
B12: Lack of encouragement from clients for PtD implementation[14,26]
Table 2. Average fuzzy scores for PtD barriers.
BarrierAverage Fuzzy Score
B7: Lack of PtD knowledge among designers0.6414
B11: Lack of understanding of PtD among project owners/clients0.6276
B5: Potential increased costs and time required for design work0.6172
B8: Absence of PtD training and education for designers0.6103
B9: Designers’ fear of liability and lack of insurance coverage0.5897
B3: Absence of PtD professional development training0.5793
B1: Lack of PtD regulation and industry standards0.5793
B10: Absence of motivation and incentives for designers 0.5655
B4: Absence of PtD education on a college level0.5586
B2: Absence of contractual clauses to arrange PtD application0.5448
B6: Project delivery methods not supporting PtD application0.5241
B12: Lack of encouragement from clients for PtD implementation0.5069
Table 3. Influential assessment clusters.
BarrierK-ClusterInfluential Level
B7: Lack of PtD knowledge among designers1High
B11: Lack of understanding of PtD among project owners/clients
B5: Potential increased costs and time required for design work
B8: Absence of PtD training and education for designers
B9: Designers’ fear of liability and lack of insurance coverage2Moderate
B3: Absence of PtD professional development training
B1: Lack of PtD regulation and industry standards
B10: Absence of motivation and incentives for designers
B4: Absence of PtD education on a college level
B2: Absence of contractual clauses to arrange PtD application3Low
B6: Project delivery methods not supporting PtD application
B12: Lack of encouragement from clients for PtD implementation
Table 4. The barriers hierarchy based on experts and literature.
BarrierExperts RankingLiterature Focus
B1: Lack of PtD regulation and industry standardsModerateModerate
B2: Absence of contractual clauses to arrange PtD applicationLowLeast
B3: Absence of PtD professional development trainingModerateModerate
B4: Absence of PtD education on a college levelModerateLeast
B5: Potential increased costs and time of design workHighModerate
B6: Project delivery methods not supporting PtD applicationLowLeast
B7: Lack of PtD knowledge among designersHighMost
B8: Absence of PtD training and education for designersHighLeast
B9: Designers’ fear of liability and lack of insurance coverageModerateMost
B10: Absence of motivation and incentives for designersModerateModerate
B11: Lack of understanding of PtD among project owners/clientsHighModerate
B12: Lack of encouragement from clients for PtD implementationLowLeast
Color code: red = high influence/most referenced; yellow = moderate influence/moderate referenced; green: low influence/least referenced.
Disclaimer/Publisher’s Note: The statements, opinions and data contained in all publications are solely those of the individual author(s) and contributor(s) and not of MDPI and/or the editor(s). MDPI and/or the editor(s) disclaim responsibility for any injury to people or property resulting from any ideas, methods, instructions or products referred to in the content.

