
Red Mullet (Mullus barbatus) Collected from North and South Euboean Gulf, Greece: Fishing Location Effect on Nutritive Quality

 ,
,  ,
,  ,
, 

Abstract

1. Introduction
2. Materials and Methods
2.1. Chemicals and Reagents
2.2. Instrumentation
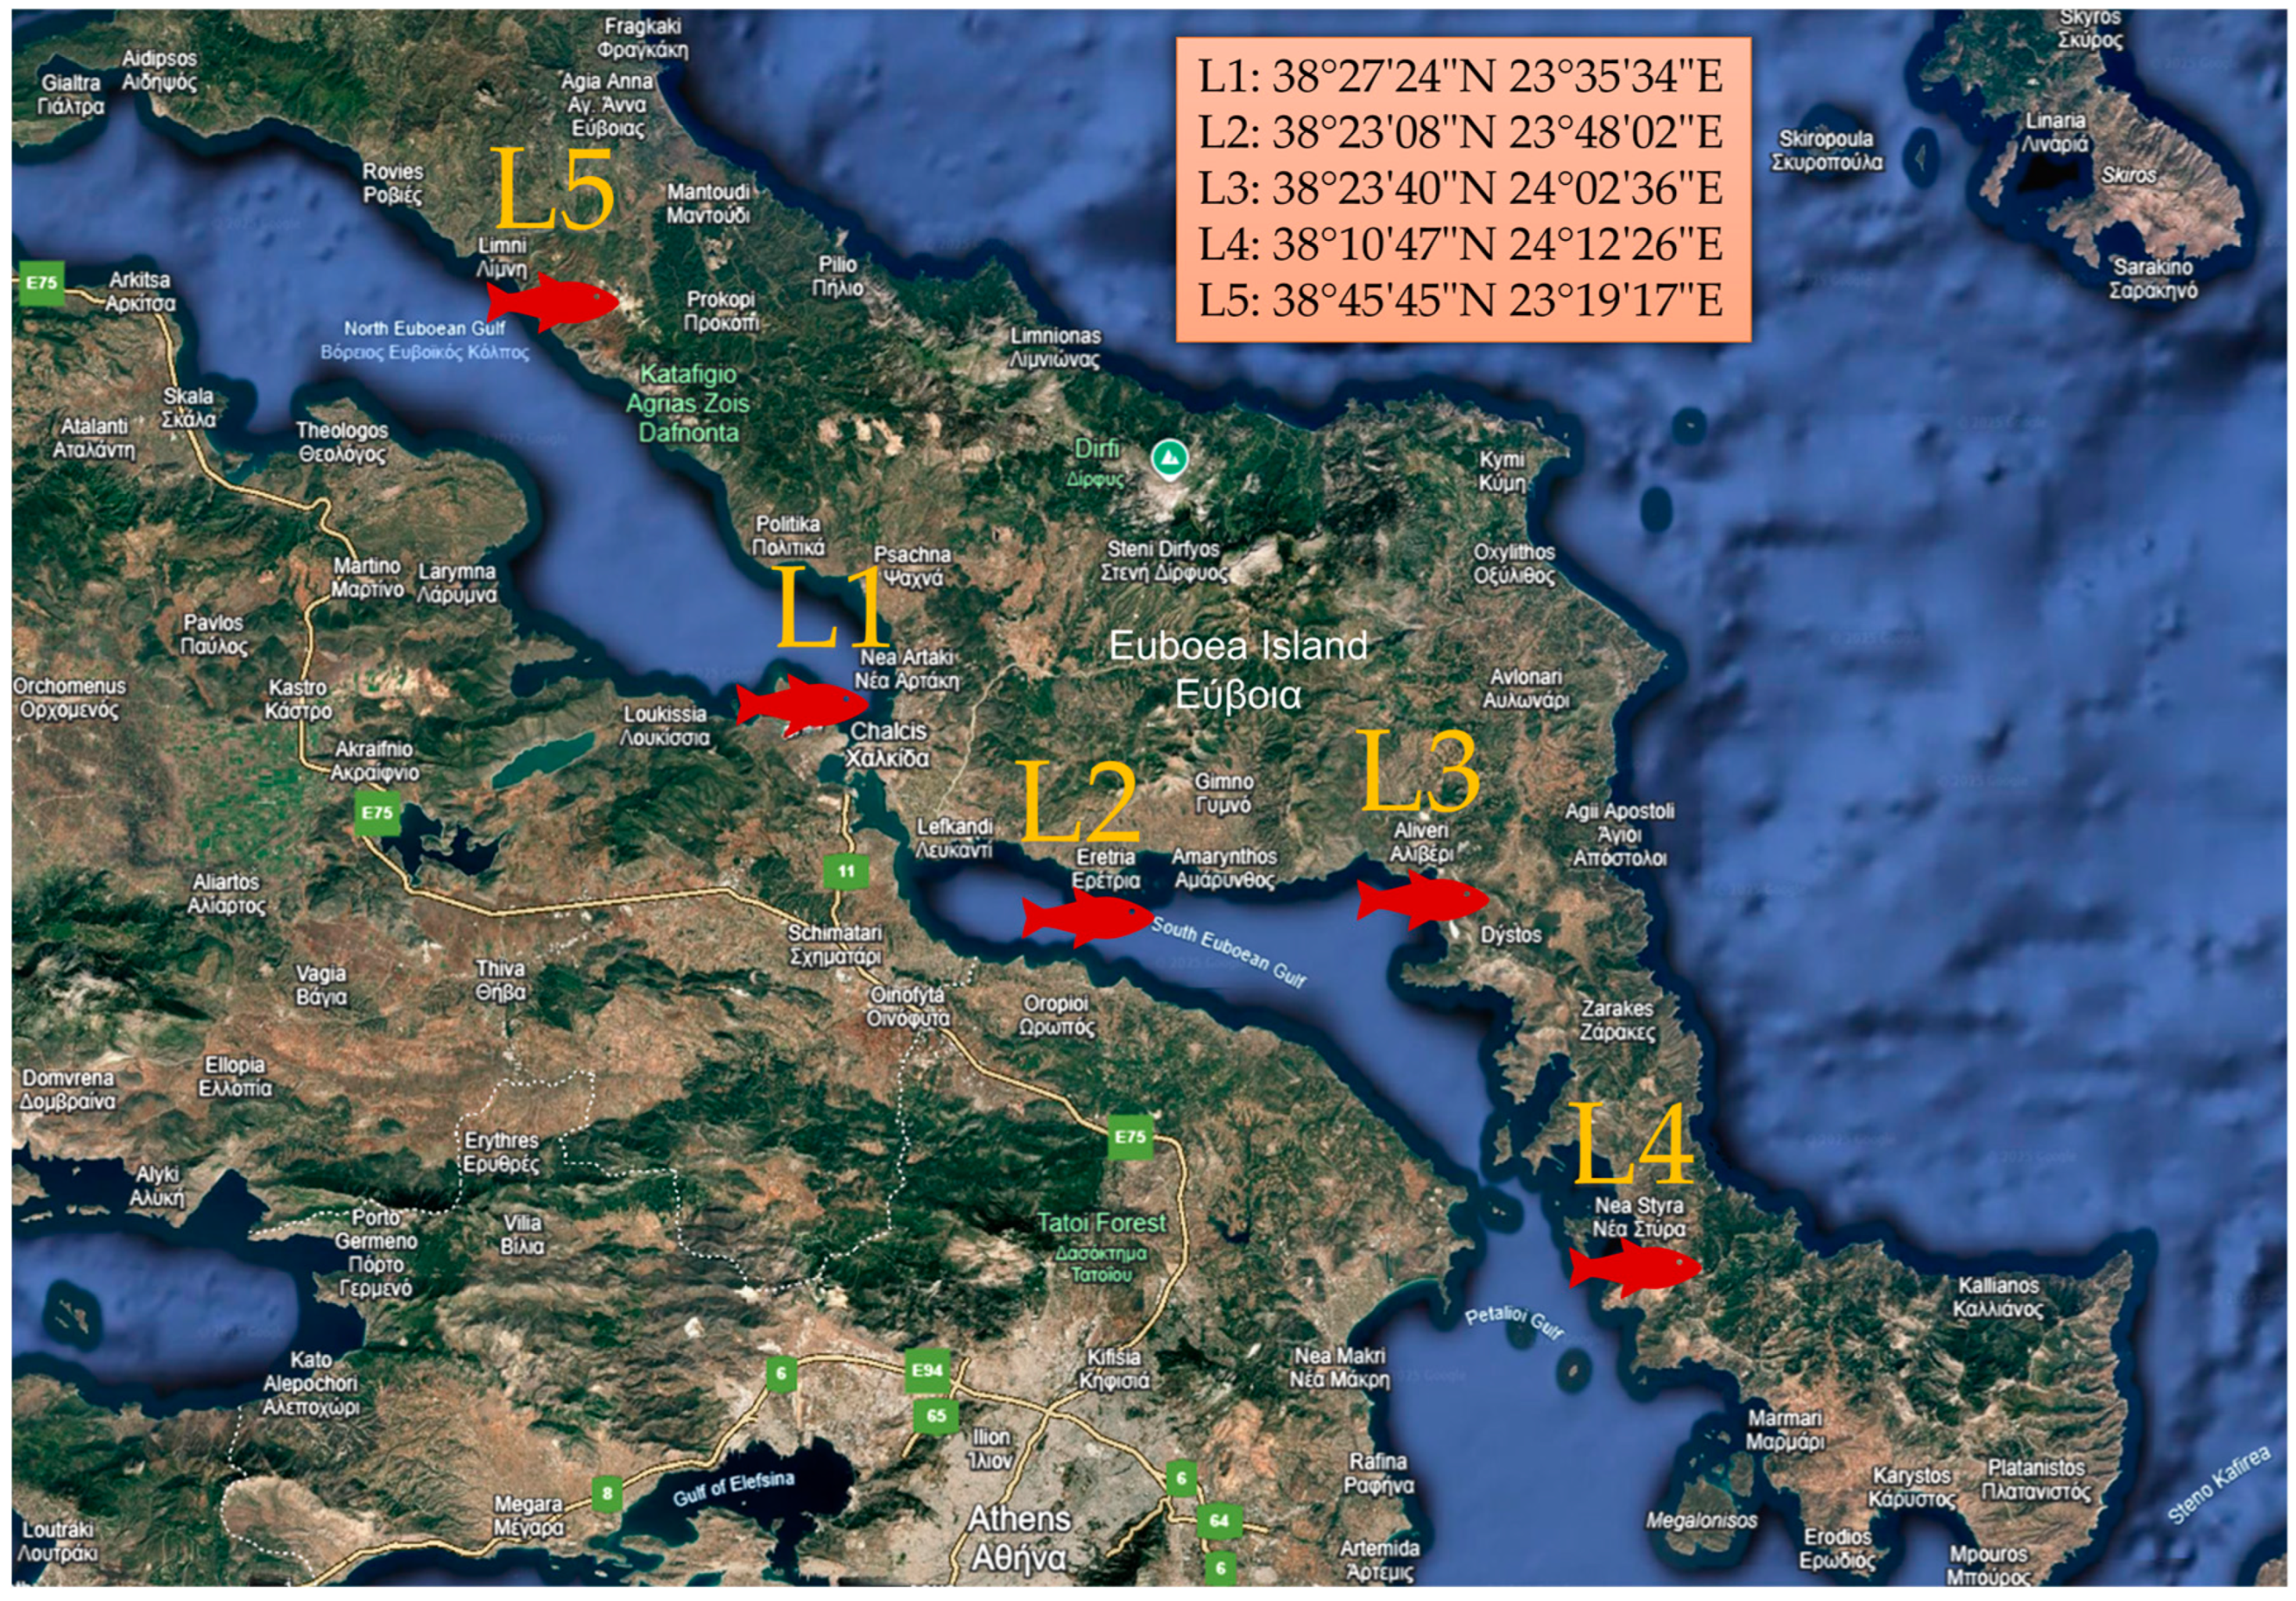
2.3. Sampling and Handling of Red Mullets
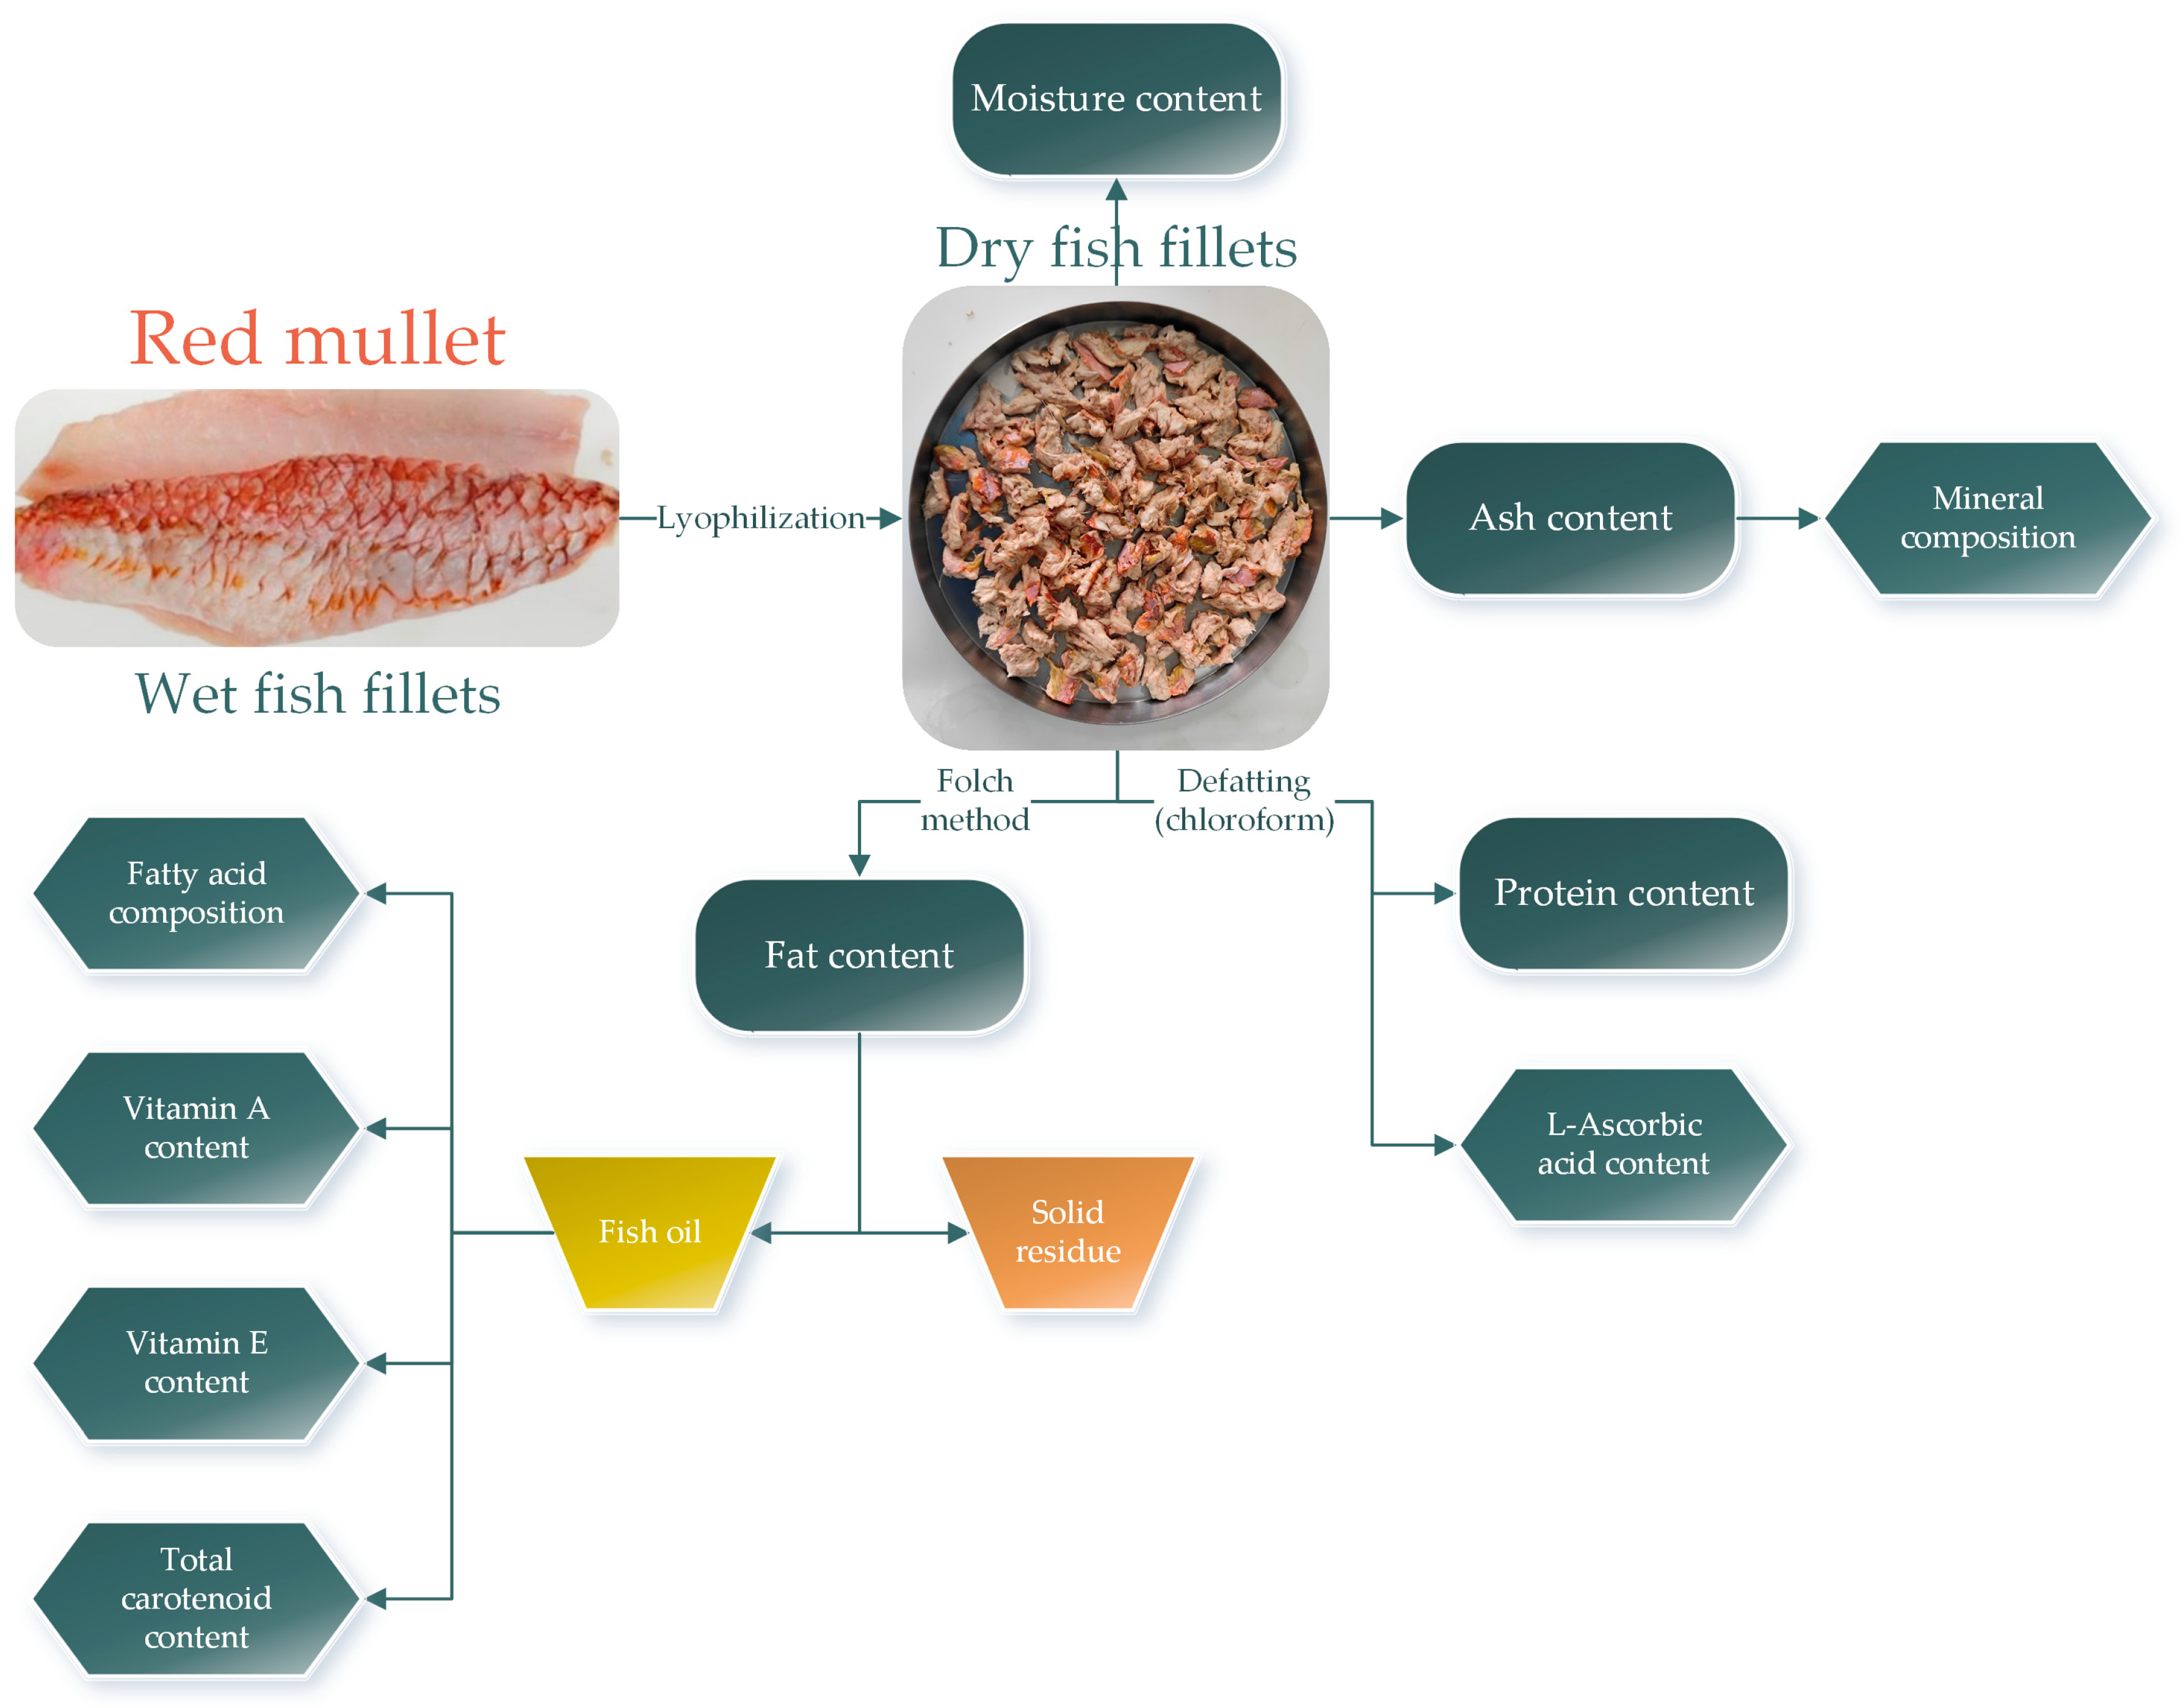
2.4. Proximate Composition of Red Mullet Fillets
2.4.1. Moisture Content
2.4.2. Ash Content
2.4.3. Fat Content
2.4.4. Protein Content
2.4.5. Mineral Composition
2.5. Fatty Acid Composition
2.6. Bioactive Compounds Determination
2.6.1. Vitamin A (Retinol) Content
2.6.2. Vitamin E (Tocopherol) Content
2.6.3. Total Carotenoid Content (TCC) Determination
2.6.4. L-Ascorbic Acid Content
2.7. Statistical Analysis
3. Results and Discussion
3.1. Proximate Composition of Red Mullet
3.2. Mineral Composition in Red Mullet
3.2.1. Essential and Non-Essential Minerals
3.2.2. Essential Trace Minerals
3.2.3. Toxic Minerals
3.2.4. Radioactive Minerals
3.3. Bioactive Compounds Found in Red Mullet
3.4. Fatty Acid Profile
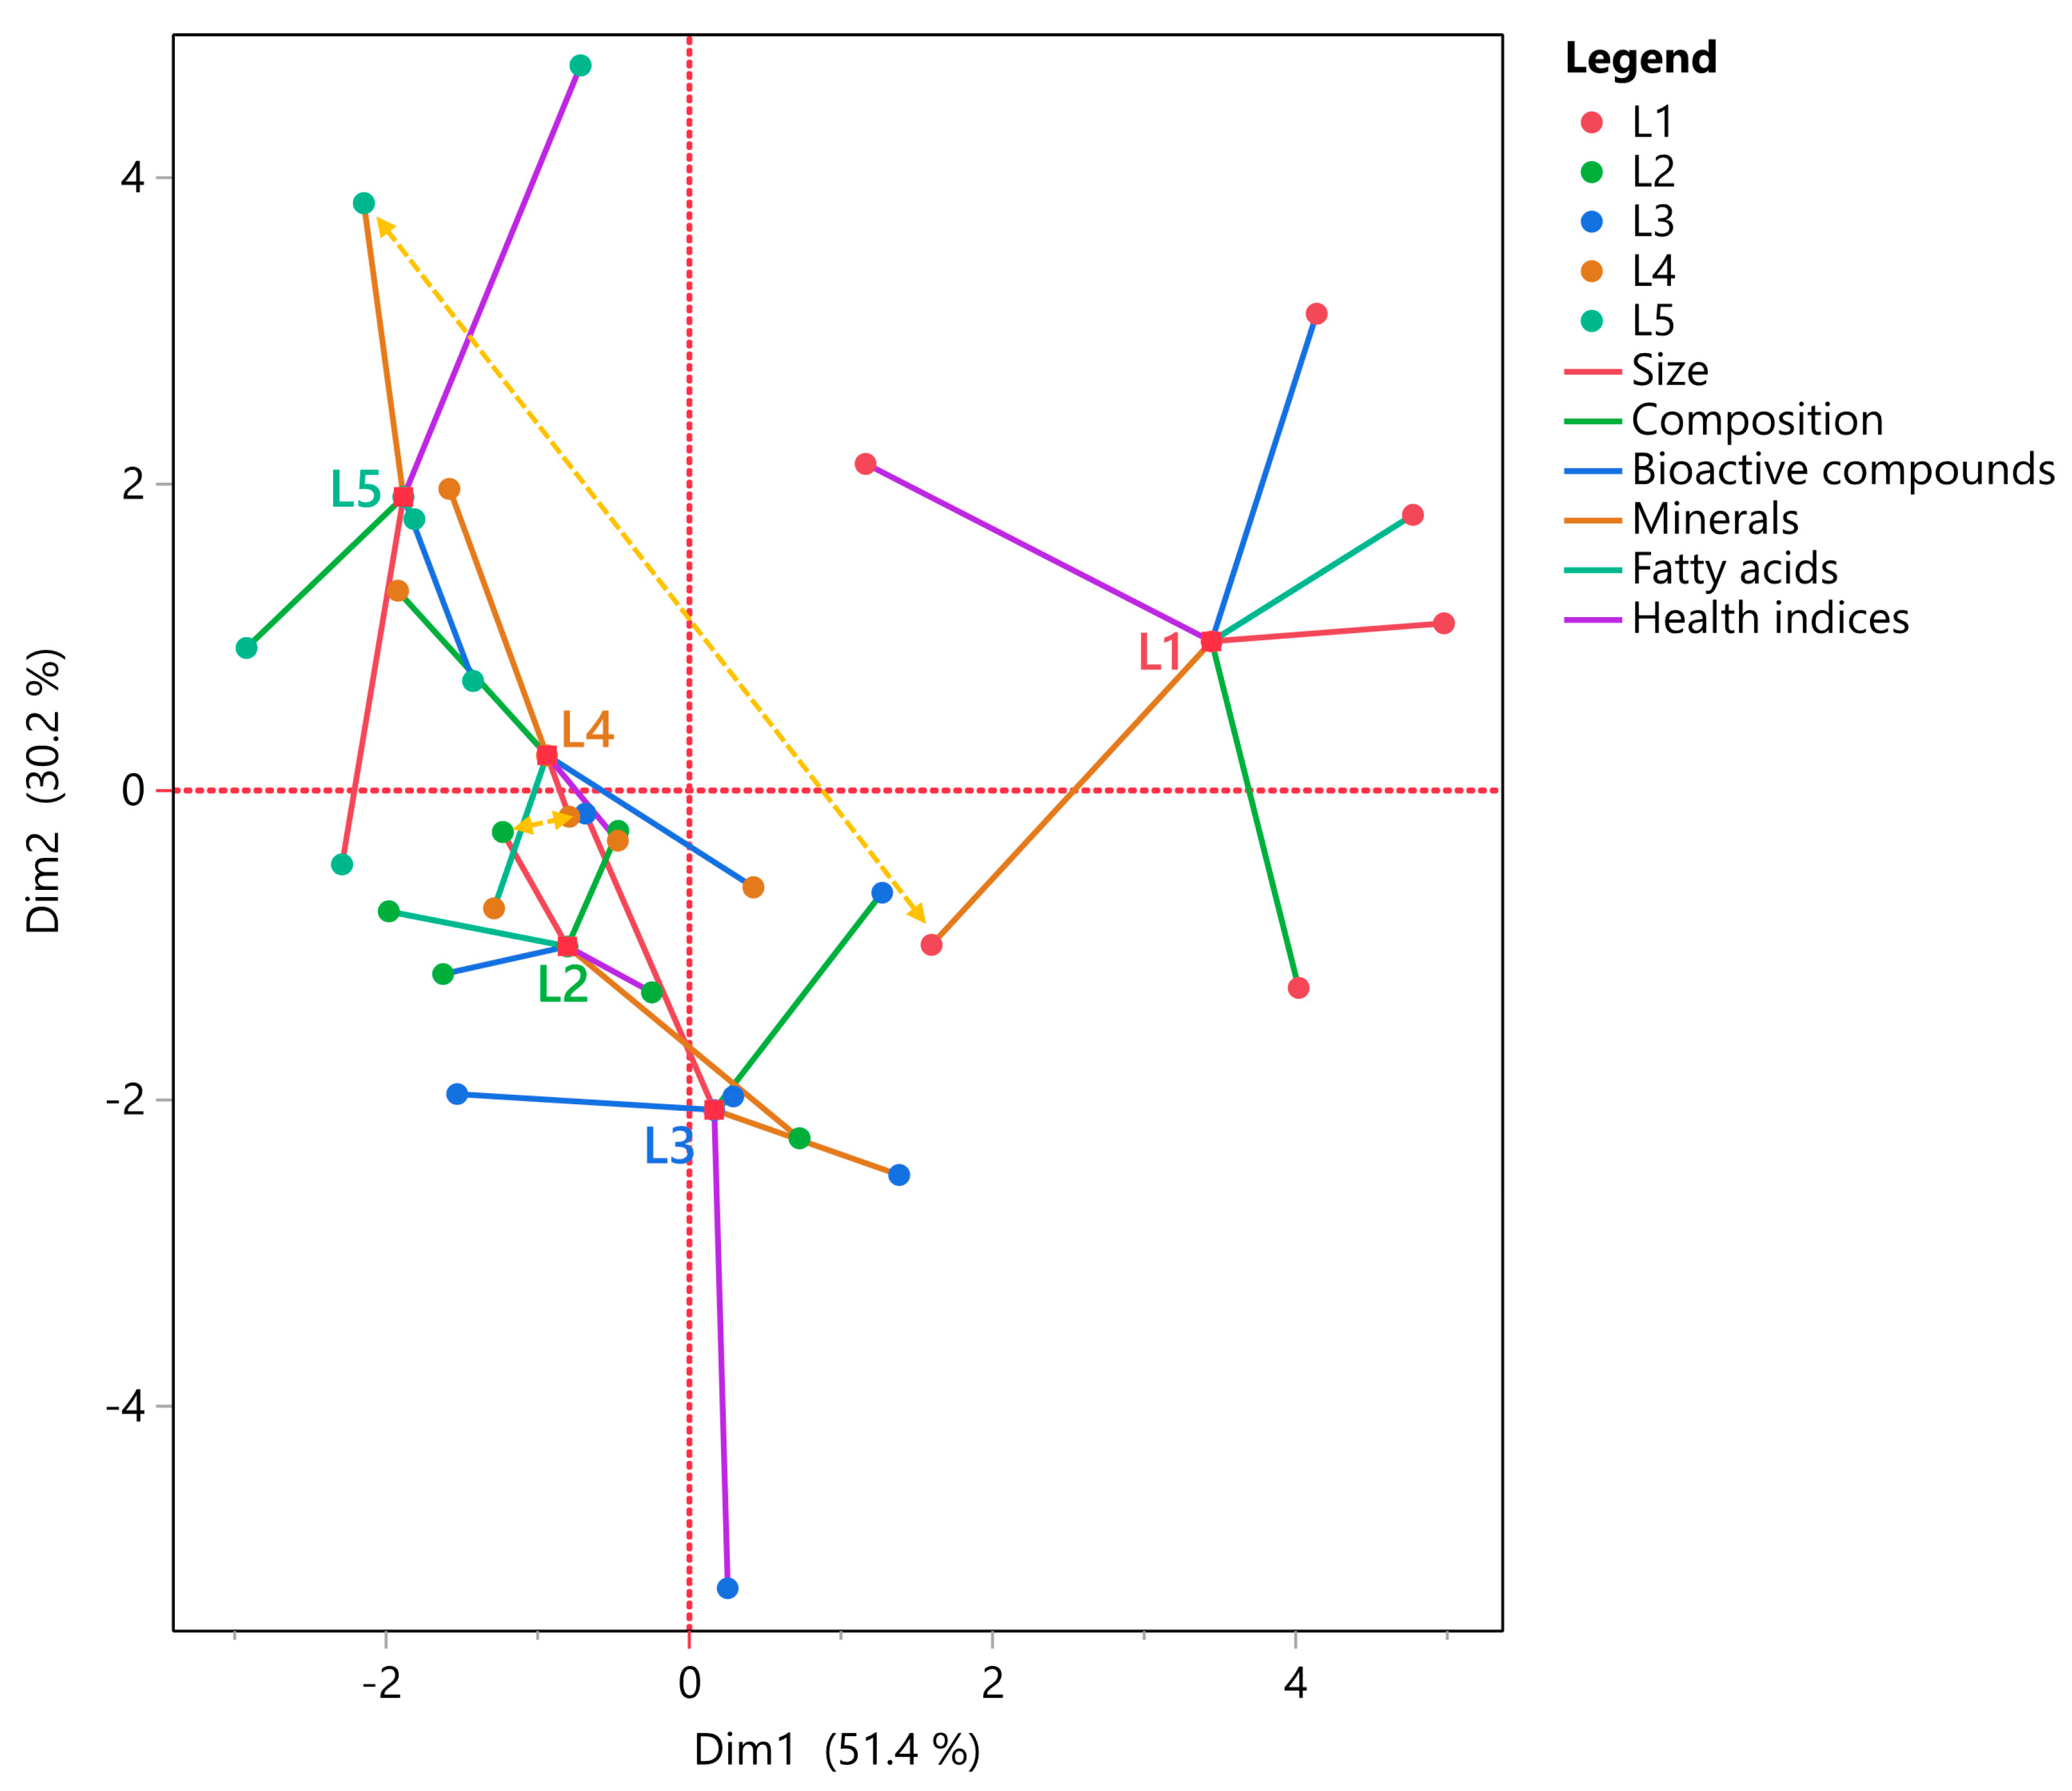
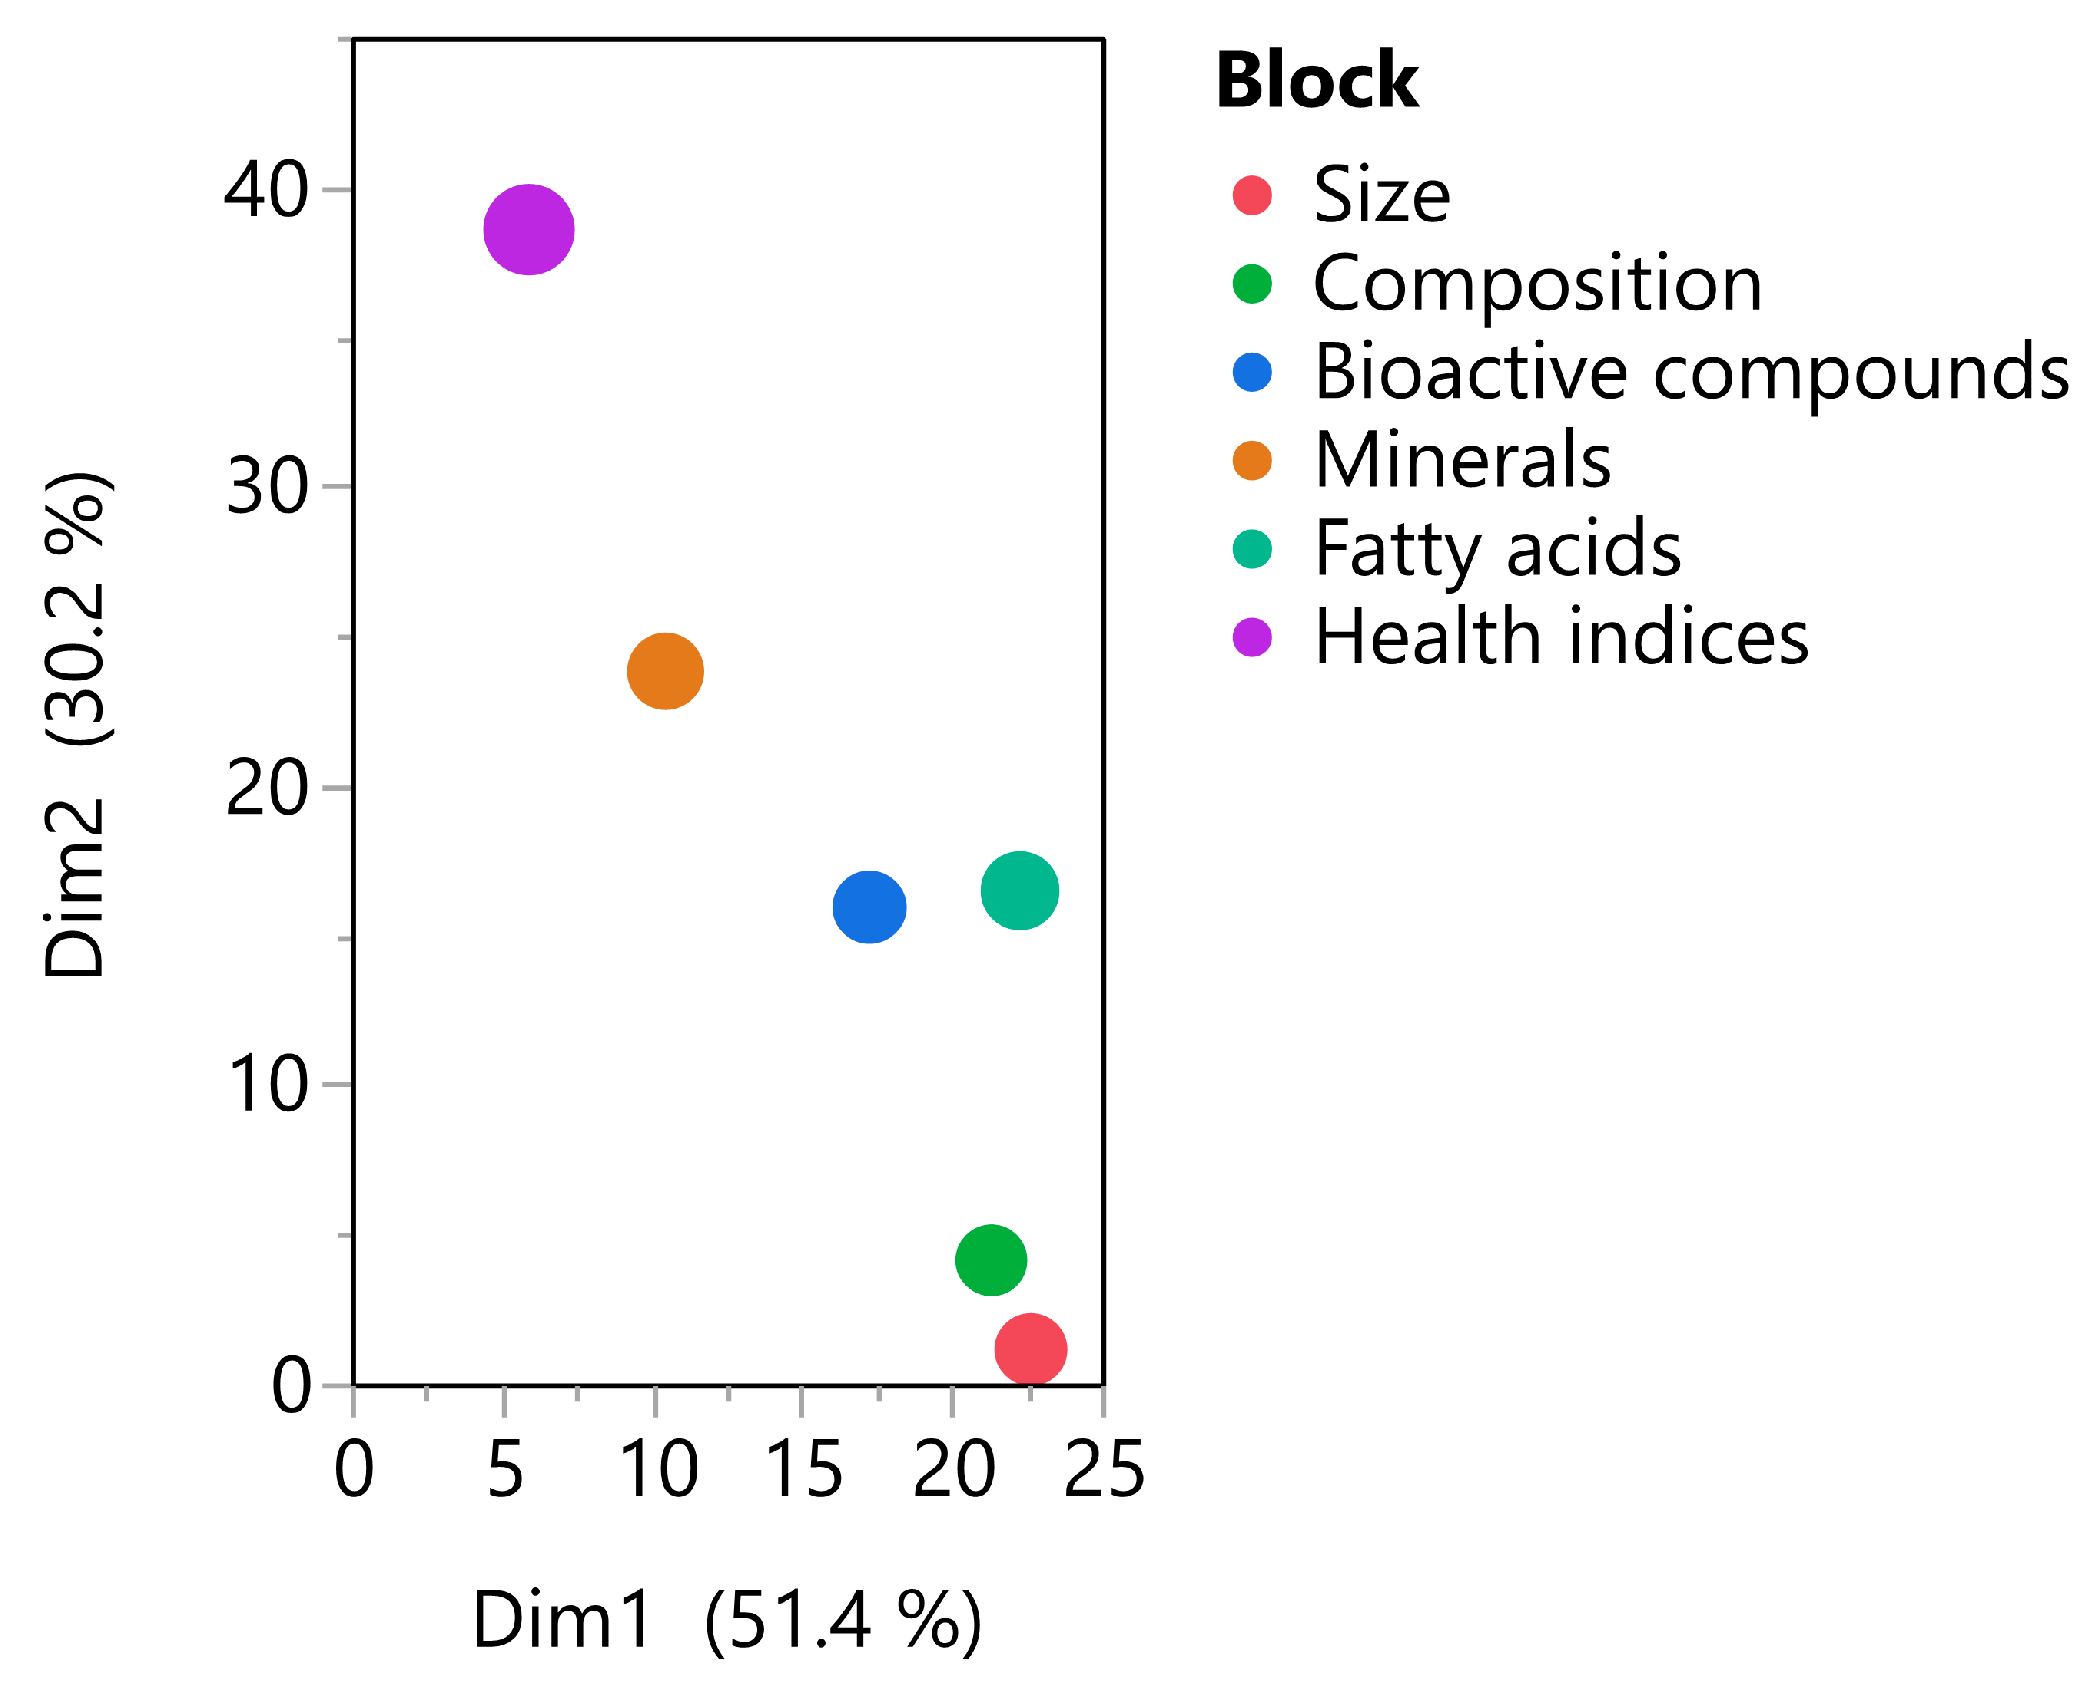
3.5. Correlation Analyzes
4. Conclusions
Author Contributions
Funding
Institutional Review Board Statement
Informed Consent Statement
Data Availability Statement
Conflicts of Interest
Abbreviations
| C8:0 | Caprylic acid | C24:1 ω-9 | Nervonic acid |
| C10:0 | Capric acid | C18:2 ω-6 | Linoleic acid |
| C11:0 | Undecanoic acid | C18:3 ω-6 | γ-Linolenic acid |
| C12:0 | Dodecanoic acid | C18:3 ω-3 | α-Linolenic acid |
| C13:0 | Tridecanoic acid | C20:2 ω-6 | cis-11,14-Eicosadienoic acid |
| C14:0 | Tetradecanoic acid | C20:4 ω-6 | Arachidonic acid |
| C15:0 | Pentadecanoic acid | C20:5 ω-3 (EPA) | cis-5,8,11,14,17-Eicosapentaenoic acid |
| C16:0 | Hexadecanoic acid | C22:6 ω-3 (DHA) | cis-4,7,10,13,16,19-Docosahexaenoic acid |
| C18:0 | Octadecanoic acid | SFAs | Saturated Fatty Acids |
| C20:0 | Eicosanoic acid | MUFAs | Monounsaturated fatty acids |
| C24:0 | Tetracosanoic acid | PUFAs | Polyunsaturated fatty acids |
| C14:1 | Myristoleic acid | UFA | Unsaturated fatty acids |
| C16:1 | Palmitoleic acid | AI | Atherogenic Index |
| C18:1 ω-9 cis | Oleic acid | TI | Thrombogenicity Index |
| C18:1 ω-9 trans | Elaidic acid | HH | Hypocholesterolemic/Hypercholesterolemic ratio |
| C20:1 ω-9 | cis-11-Eicosenoic acid | HPI | Health-Promoting Index |
Appendix A

| Mineral | m/z Ratio 1 | LOD (µg/L) 2 | LOD (µg/100 g) | Recoveries (%) | Precision (%) | Calibration Curve Range (µg/L) |
|---|---|---|---|---|---|---|
| Aluminum (Al) | 27 | 2.42 | 24.2 | 95 | 2.5 | 0.1–10 |
| Arsenic (As) | 75 | 0.52 | 5.20 | 98 | 3 | 0.05–5 |
| Barium (Ba) | 137 | 0.1 | 1.00 | 97 | 2 | 0.01–1 |
| Beryllium (Be) | 9 | 0.05 | 0.500 | 96 | 2.8 | 0.005–0.5 |
| Boron (B) | 11 | 0.045 | 0.450 | 99 | 1.5 | 0.01–1 |
| Cadmium (Cd) | 111 | 0.15 | 1.50 | 97 | 2.5 | 0.01–1 |
| Calcium (Ca) | 44 | 0.2 | 2.00 | 98 | 2 | 0.05–5 |
| Chromium (Cr) | 52 | 0.91 | 9.10 | 96 | 2.5 | 0.1–10 |
| Cobalt (Co) | 59 | 0.1 | 1.00 | 97 | 2 | 0.01–1 |
| Copper (Cu) | 63 | 4.55 | 45.5 | 95 | 3 | 0.1–10 |
| Iron (Fe) | 56 | 4.55 | 45.5 | 96 | 2.5 | 0.1–10 |
| Lead (Pb) | 206 | 0.88 | 8.80 | 95 | 3 | 0.1–10 |
| Lithium (Li) | 7 | 0.05 | 0.500 | 98 | 2 | 0.01–1 |
| Magnesium (Mg) | 24 | 0.2 | 2.00 | 97 | 2.5 | 0.05–5 |
| Manganese (Mn) | 55 | 1.52 | 15.2 | 96 | 2 | 0.1–10 |
| Molybdenum (Mo) | 95 | 0.1 | 1.00 | 97 | 2.5 | 0.01–1 |
| Nickel (Ni) | 60 | 1.52 | 15.2 | 95 | 3 | 0.1–10 |
| Potassium (K) | 39 | 0.2 | 2.00 | 98 | 2 | 0.05–5 |
| Selenium (Se) | 82 | 0.89 | 8.90 | 96 | 2.5 | 0.1–10 |
| Silver (Ag) | 107 | 0.05 | 0.500 | 97 | 2 | 0.01–1 |
| Sodium (Na) | 23 | 0.2 | 2.00 | 98 | 2.5 | 0.05–5 |
| Strontium (Sr) | 88 | 0.1 | 1.00 | 97 | 2 | 0.01–1 |
| Thallium (Tl) | 205 | 0.05 | 0.500 | 96 | 2.5 | 0.005–0.5 |
| Uranium (U) | 238 | 0.1 | 1.00 | 97 | 2 | 0.01–1 |
| Vanadium (V) | 51 | 0.1 | 1.00 | 96 | 2.5 | 0.01–1 |
| Zinc (Zn) | 66 | 0.1 | 1.00 | 98 | 2 | 0.01–1 |
| Parameter | LOD (µg/L) | LOD (µg/100 g) | Recoveries (%) | Calibration Curve Range (mg/L) | Linearity (R2) | Repeatability (%RSD) |
|---|---|---|---|---|---|---|
| Retinol | 0.44 | 2.2 | 95 | 0–5 | 0.998 | 2.5 |
| α-Tocopherol | 4.14 | 4.14 | 97 | 0–1 | 0.996 | 2.8 |
| β-Tocopherol | 3.95 | 3.95 | 96 | 0–1 | 0.995 | 2.7 |
| γ-Tocopherol | 3.59 | 3.59 | 95 | 0–1 | 0.994 | 2.6 |
| δ-Tocopherol | 2.87 | 2.87 | 94 | 0–1 | 0.993 | 2.5 |
| Total Carotenoids | 4.09 | 40.9 | 98 | Extinction coefficient for astaxanthin | 0.999 | 2 |
| L-Ascorbic acid | 6.97 | 13.9 | 99 | 0–100 | 0.997 | 1.5 |
References
- Balami, S.; Sharma, A.; Karn, R. Significance of Nutritional Value of Fish for Human Health. Malays. J. Halal Res. 2019, 2, 32–34. [Google Scholar] [CrossRef]
- Chowdhury, U.K.; Biswas, B.K.; Chowdhury, T.R.; Samanta, G.; Mandal, B.K.; Basu, G.C.; Chanda, C.R.; Lodh, D.; Saha, K.C.; Mukherjee, S.K.; et al. Groundwater Arsenic Contamination in Bangladesh and West Bengal, India. Environ. Health Perspect. 2000, 108, 393–397. [Google Scholar] [CrossRef] [PubMed]
- Joint FAO/WHO/UNU Expert Consultation on Protein and Amino Acid Requirements in Human Nutrition. Protein and Amino Acid Requirements in Human Nutrition: Report of a Joint FAO/WHO/UNU Expert Consultation; World Health Organization: Geneva, Switzerland, 2017. [Google Scholar]
- Gündoğdu, S.; Baylan, M. Analyzing Growth Studies of 4 Mullidae Species Distributed in Mediterranean Sea and Black Sea. Pak. J. Zool. 2016, 48, 435–446. [Google Scholar]
- Cresson, P.; Bouchoucha, M.; Miralles, F.; Elleboode, R.; Mahé, K.; Marusczak, N.; Thebault, H.; Cossa, D. Are Red Mullet Efficient as Bio-Indicators of Mercury Contamination? A Case Study from the French Mediterranean. Mar. Pollut. Bull. 2015, 91, 191–199. [Google Scholar] [CrossRef] [PubMed]
- Durmuş, M.; Kosker, A.R.; Ozogul, Y.; Aydin, M.; UÇar, Y.; Ayas, D.; Ozogul, F. The Effects of Sex and Season on the Metal Levels and Proximate Composition of Red Mullet (Mullus Barbatus Linnaeus 1758) Caught from the Middle Black Sea. Hum. Ecol. Risk Assess. Int. J. 2018, 24, 731–742. [Google Scholar] [CrossRef]
- García-de-Vinuesa, A.; Demestre, M.; Lloret, J. Fatty Acids as Trophic Markers and Indicators of the Quality of Benthic Habitats: The Example of Maerl and Crinoid Beds in the Northwestern Mediterranean. J. Sea Res. 2022, 187, 102254. [Google Scholar] [CrossRef]
- Kosker, A.R. Metal and Fatty Acid Levels of Some Commercially Important Marine Species from the Northeastern Mediterranean: Benefits and Health Risk Estimation. Environ. Monit. Assess. 2020, 192, 358. [Google Scholar] [CrossRef]
- Fitri, N.; Chan, S.X.Y.; Che Lah, N.H.; Jam, F.A.; Misnan, N.M.; Kamal, N.; Sarian, M.N.; Mohd Lazaldin, M.A.; Low, C.F.; Hamezah, H.S.; et al. A Comprehensive Review on the Processing of Dried Fish and the Associated Chemical and Nutritional Changes. Foods 2022, 11, 2938. [Google Scholar] [CrossRef]
- Folch, J.; Lees, M.; Stanley, G.H.S. A Simple Method for the Isolation and Purification of Total Lipides from Animal Tissues. J. Biol. Chem. 1957, 226, 497–509. [Google Scholar] [CrossRef]
- Delima, D.; Trio, P. Method Validation for Protein Quantitation of Fish Muscle Tissues from Lake Taal, Batangas. KIMIKA 2019, 30, 5–16. [Google Scholar] [CrossRef]
- Bradford, M.M. A Rapid and Sensitive Method for the Quantitation of Microgram Quantities of Protein Utilizing the Principle of Protein-Dye Binding. Anal. Biochem. 1976, 72, 248–254. [Google Scholar] [CrossRef] [PubMed]
- Crosby, N.T. Determination of Metals in Foods. A Review. Analyst 1977, 102, 225–268. [Google Scholar] [CrossRef]
- European Union Commission. COMMISSION REGULATION (EC) No 796/2002 of 6 May 2002 Amending Regulation (EEC) No 2568/91 on the Characteristics of Olive Oil and Olive-Pomace Oil and on the Relevant Methods of Analysis and the Additional Notes in the Annex to Council Regulation (EEC) No 2658/87 on the Tariff and Statistical Nomenclature and on the Common Customs Tariff; European Union Commission: Brussels, Belgium, 2002. [Google Scholar]
- Athanasiadis, V.; Kalompatsios, D.; Mantiniotou, M.; Lalas, S.I. Investigation into the Reduction of Palm Oil in Foods by Blended Vegetable Oils through Response Surface Methodology and Oxidative Stability Tests. Antioxidants 2024, 13, 929. [Google Scholar] [CrossRef] [PubMed]
- Ulbricht, T.L.; Southgate, D.A. Coronary Heart Disease: Seven Dietary Factors. Lancet 1991, 338, 985–992. [Google Scholar] [CrossRef] [PubMed]
- Santos-Silva, J.; Bessa, R.; Santos Silva, M. Effect of Genotype, Feeding System and Slaughter Weight on the Quality of Light Lambs II. Fatty Acid Composition of Meat. Livest. Prod. Sci. 2002, 77, 187–194. [Google Scholar] [CrossRef]
- Chen, S.; Bobe, G.; Zimmerman, S.; Hammond, E.G.; Luhman, C.M.; Boylston, T.D.; Freeman, A.E.; Beitz, D.C. Physical and Sensory Properties of Dairy Products from Cows with Various Milk Fatty Acid Compositions. J. Agric. Food Chem. 2004, 52, 3422–3428. [Google Scholar] [CrossRef]
- Palma-Duran, S.A.; Morgan, D.; Combet, E. Quantification of Vitamin A in Edible Oils: Comparison of Portable Device iCheck Chroma3 to High-Performance Liquid Chromatography. Food Anal. Methods 2024, 17, 847–854. [Google Scholar] [CrossRef]
- Sharayei, P.; Azarpazhooh, E.; Zomorodi, S.; Einafshar, S.; Ramaswamy, H.S. Optimization of Ultrasonic-Assisted Extraction of Astaxanthin from Green Tiger (Penaeus Semisulcatus) Shrimp Shell. Ultrason. Sonochem. 2021, 76, 105666. [Google Scholar] [CrossRef]
- Jagota, S.K.; Dani, H.M. A New Colorimetric Technique for the Estimation of Vitamin C Using Folin Phenol Reagent. Anal. Biochem. 1982, 127, 178–182. [Google Scholar] [CrossRef]
- Shephard, S.; Rindorf, A.; Dickey-Collas, M.; Hintzen, N.T.; Farnsworth, K.; Reid, D.G. Assessing the State of Pelagic Fish Communities within an Ecosystem Approach and the European Marine Strategy Framework Directive. ICES J. Mar. Sci. 2014, 71, 1572–1585. [Google Scholar] [CrossRef]
- Karametsidis, G.; Rueda, L.; Bellido, J.M.; Esteban, A.; García, E.; Gil de Sola, L.; Pennino, M.G.; Pérez-Gil, J.L.; Hidalgo, M. The Trade-off between Condition and Growth Shapes Juveniles’ Survival of Harvested Demersal Fish of the Mediterranean Sea. Mar. Environ. Res. 2023, 184, 105844. [Google Scholar] [CrossRef] [PubMed]
- Polat, A.; Kuzu, S.; Ozyurt, G.; Tokur, B. Fatty Acid Composition of Red Mullet (Mullus Barbatus): A Seasonal Differentiation. J. Muscle Foods 2008, 20, 70–78. [Google Scholar] [CrossRef]
- Quality and Quality Changes in Fresh Fish-4. Chemical Composition. Available online: https://www.fao.org/4/v7180e/v7180e05.htm (accessed on 21 December 2024).
- Roncarati, A.; Brambilla, G.; Meluzzi, A.; Iamiceli, A.L.; Fanelli, R.; Moret, I.; Ubaldi, A.; Miniero, R.; Sirri, F.; Melotti, P.; et al. Fatty Acid Profile and Proximate Composition of Fillets from Engraulis Encrasicholus, Mullus Barbatus, Merluccius Merluccius and Sarda Sarda Caught in Tyrrhenian, Adriatic and Ionian Seas. J. Appl. Ichthyol. 2012, 28, 545–552. [Google Scholar] [CrossRef]
- Balzani, P.; Kouba, A.; Tricarico, E.; Kourantidou, M.; Haubrock, P.J. Metal Accumulation in Relation to Size and Body Condition in an All-Alien Species Community. Environ. Sci. Pollut. Res. Int. 2022, 29, 25848–25857. [Google Scholar] [CrossRef]
- Varol, M.; Kaçar, E. Bioaccumulation of Metals in Various Tissues of Fish Species in Relation to Fish Size and Gender and Health Risk Assessment. Curr. Pollut. Rep. 2023, 9, 327–337. [Google Scholar] [CrossRef]
- Carrozzi, V.; Di Lorenzo, M.; Massi, D.; Titone, A.; Ardizzone, G.; Colloca, F. Prey Preferences and Ontogenetic Diet Shift of European Hake Merluccius Merluccius (Linnaeus, 1758) in the Central Mediterranean Sea. Reg. Stud. Mar. Sci. 2019, 25, 100440. [Google Scholar] [CrossRef]
- Kontas, A.; Alyuruk, H.; Bilgin, M.; Uluturhan, E.; Ünlüoğlu, A.; Darilmaz, E.; Altay, O. Metal Bioaccumulation and Potential Health Risk Assessment in Different Tissues of Three Commercial Fish Species (Merluccius Merluccius, Mullus Barbatus, and Pagellus Erythrinus) from Edremit Bay (Aegean Sea), Turkey. Biol. Trace Elem. Res. 2022, 200, 868–880. [Google Scholar] [CrossRef]
- Rainbow, P.S. Trace Metal Concentrations in Aquatic Invertebrates: Why and so What? Environ. Pollut. 2002, 120, 497–507. [Google Scholar] [CrossRef]
- Viarengo, A.; Canesi, L. Mussels as Biological Indicators of Pollution. Aquaculture 1991, 94, 225–243. [Google Scholar] [CrossRef]
- Wong, C.K.; Wong, P.P.K.; Chu, L.M. Heavy Metal Concentrations in Marine Fishes Collected from Fish Culture Sites in Hong Kong. Arch. Environ. Contam. Toxicol. 2001, 40, 60–69. [Google Scholar] [CrossRef]
- Wei, Y.; Zhang, J.; Zhang, D.; Tu, T.; Luo, L. Metal Concentrations in Various Fish Organs of Different Fish Species from Poyang Lake, China. Ecotoxicol. Environ. Saf. 2014, 104, 182–188. [Google Scholar] [CrossRef] [PubMed]
- Pan, B.; Wang, Y.; Li, D.; Wang, T.; Du, L. Tissue-Specific Distribution and Bioaccumulation Pattern of Trace Metals in Fish Species from the Heavily Sediment-Laden Yellow River, China. J. Hazard. Mater. 2022, 425, 128050. [Google Scholar] [CrossRef] [PubMed]
- Panagiotounakou, G. Bioaccumulation of Metals in Mullus Barbatus (Red Mullet) from Thermaic Gulf and Human Health Risk Assessment from Their Consumption. Undergraduate Thesis, University of West Attica, Athens, Greece, February 2024. [Google Scholar] [CrossRef]
- Yılmaz, A.B.; Sangün, M.K.; Yağlıoğlu, D.; Turan, C. Metals (Major, Essential to Non-Essential) Composition of the Different Tissues of Three Demersal Fish Species from İskenderun Bay, Turkey. Food Chem. 2010, 123, 410–415. [Google Scholar] [CrossRef]
- Duarte, F.O.S.; de Paula, F.G.; Prado, C.S.; dos Santos, R.R.; Minafra-Rezende, C.S.; Gebara, C.; Lage, M.E. Better Fatty Acids Profile in Fillets of Nile Tilapia (Oreochromis Niloticus) Supplemented with Fish Oil. Aquaculture 2021, 534, 736241. [Google Scholar] [CrossRef]
- Sofoulaki, K.; Kalantzi, I.; Machias, A.; Mastoraki, M.; Chatzifotis, S.; Mylona, K.; Pergantis, S.A.; Tsapakis, M. Metals and Elements in Sardine and Anchovy: Species Specific Differences and Correlations with Proximate Composition and Size. Sci. Total Environ. 2018, 645, 329–338. [Google Scholar] [CrossRef] [PubMed]
- Paradinas Aranjuelo, J.M.; Conesa, D.; López-Quílez, A.; Esteban, A.; Martín López, L.M.; María Bellido, J.; Grazia Pennino, M. Assessing the Spatiotemporal Persistence of Fish Distributions: A Case Study on Two Red Mullet Species (Mullus Surmuletus and M. Barbatus) in the Western Mediterranean. Mar. Ecol. Prog. Ser. 2020, 644, 173–185. [Google Scholar] [CrossRef]
- Douben, P.E.T. Lead and Cadmium in Stone Loach (Noemacheilus Barbatulus L.) from Three Rivers in Derbyshire. Ecotoxicol. Environ. Saf. 1989, 18, 35–58. [Google Scholar] [CrossRef]
- Adams, S.M. Ecological Role of Lipids in the Health and Success of Fish Populations; Arts, M.T., Wainman, B.C., Eds.; Springer: New York, NY, USA, 1999; pp. 132–160. [Google Scholar]
- Canli, M.; Atli, G. The Relationships between Heavy Metal (Cd, Cr, Cu, Fe, Pb, Zn) Levels and the Size of Six Mediterranean Fish Species. Environ. Pollut. Barking Essex 1987 2003, 121, 129–136. [Google Scholar] [CrossRef]
- Has-Schön, E.; Bogut, I.; Vuković, R.; Galović, D.; Bogut, A.; Horvatić, J. Distribution and Age-Related Bioaccumulation of Lead (Pb), Mercury (Hg), Cadmium (Cd), and Arsenic (As) in Tissues of Common Carp (Cyprinus Carpio) and European Catfish (Sylurus Glanis) from the Buško Blato Reservoir (Bosnia and Herzegovina). Chemosphere 2015, 135, 289–296. [Google Scholar] [CrossRef]
- Institute of Medicine (US) Panel on Micronutrients. Dietary Reference Intakes for Vitamin A, Vitamin K, Arsenic, Boron, Chromium, Copper, Iodine, Iron, Manganese, Molybdenum, Nickel, Silicon, Vanadium, and Zinc; National Academies Press: Washington, DC, USA, 2001. [Google Scholar]
- EFSA Panel on Nutrition, Novel Foods and Food Allergens (NDA); Turck, D.; Bohn, T.; Castenmiller, J.; de Henauw, S.; Hirsch-Ernst, K.-I.; Knutsen, H.K.; Maciuk, A.; Mangelsdorf, I.; McArdle, H.J.; et al. Scientific Opinion on the Tolerable Upper Intake Level for Manganese. EFSA J. 2023, 21, e8413. [Google Scholar] [CrossRef]
- EFSA Panel on Nutrition, Novel Foods and Food Allergens (NDA); Turck, D.; Bohn, T.; Castenmiller, J.; de Henauw, S.; Hirsch-Ernst, K.-I.; Knutsen, H.K.; Maciuk, A.; Mangelsdorf, I.; McArdle, H.J.; et al. Scientific Opinion on the Tolerable Upper Intake Level for Selenium. EFSA J. 2023, 21, e07704. [Google Scholar] [CrossRef] [PubMed]
- Korkmaz, C.; Ay, Ö.; Çolakfakioğlu, C.; Cicik, B.; Erdem, C. Heavy Metal Levels in Muscle Tissues of Solea Solea, Mullus Barbatus, and Sardina Pilchardus Marketed for Consumption in Mersin, Turkey. Water. Air. Soil Pollut. 2017, 228, 315. [Google Scholar] [CrossRef]
- EPA. U.S. Environmental Protection Agency. Chromium Compounds. 2000. Available online: https://www.epa.gov/sites/default/files/2016-09/documents/chromium-compounds.pdf (accessed on 24 December 2024).
- EPA. U.S. Environmental Protection Agency. Manganese Compounds. 2016. Available online: https://www.epa.gov/sites/default/files/2016-10/documents/manganese.pdf (accessed on 24 December 2024).
- EPA. U.S. Environmental Protection Agency. Nickel Compounds. 2000. Available online: https://www.epa.gov/sites/default/files/2016-09/documents/nickle-compounds.pdf (accessed on 24 December 2024).
- EPA. Environmental Protection Agency. Zinc and Compounds. 2005. Available online: https://iris.epa.gov/static/pdfs/0426tr.pdf (accessed on 24 December 2024).
- Fındık, Ö.; Çiçek, E. Metal Concentrations in Two Bioindicator Fish Species, Merlangius Merlangus, Mullus Barbatus, Captured from the West Black Sea Coasts (Bartin) of Turkey. Bull. Environ. Contam. Toxicol. 2011, 87, 399–403. [Google Scholar] [CrossRef]
- Ashoka, S.; Peake, B.M.; Bremner, G.; Hageman, K.J.; Reid, M.R. Comparison of Digestion Methods for ICP-MS Determination of Trace Elements in Fish Tissues. Anal. Chim. Acta 2009, 653, 191–199. [Google Scholar] [CrossRef]
- Giannakopoulou, L.; Neofitou, C. Heavy Metal Concentrations in Mullus Barbatus and Pagellus Erythrinus in Relation to Body Size, Gender, and Seasonality. Environ. Sci. Pollut. Res. 2014, 21, 7140–7153. [Google Scholar] [CrossRef] [PubMed]
- EPA. U.S. Environmental Protection Agency. Arsenic Compounds. 2000. Available online: https://www.epa.gov/sites/production/files/2016-09/documents/arsenic-compounds.pdf (accessed on 24 December 2024).
- EPA. U.S. Environmental Protection Agency. Cadmium Compounds. 2000. Available online: https://www.epa.gov/sites/default/files/2016-09/documents/cadmium-compounds.pdf (accessed on 24 December 2024).
- EFSA Panel on Contaminants in the Food Chain (CONTAM). Scientific Opinion on Lead in Food. EFSA J. 2010, 8, 1570. [Google Scholar] [CrossRef]
- Aissioui, S.; Poirier, L.; Amara, R.; Ramdane, Z. Concentrations of Lead, Cadmium, and Mercury in Mullus Barbatus Barbatus (L.) from the Algerian Coast and Health Risks Associated to Its Consumption. Reg. Stud. Mar. Sci. 2021, 47, 101959. [Google Scholar] [CrossRef]
- Jaishankar, M.; Tseten, T.; Anbalagan, N.; Mathew, B.B.; Beeregowda, K.N. Toxicity, Mechanism and Health Effects of Some Heavy Metals. Interdiscip. Toxicol. 2014, 7, 60–72. [Google Scholar] [CrossRef]
- Polat, A.; Özogul, Y.; Kuley, E.; Özogul, F.; Özyurt, G.; Şimşek, A. Tocopherol Content of Commercial Fish Species as Affected by Microwave Cooking. J. Food Biochem. 2013, 37, 381–387. [Google Scholar] [CrossRef]
- Saldeen, K.; Saldeen, T. Importance of Tocopherols beyond α-Tocopherol: Evidence from Animal and Human Studies. Nutr. Res. 2005, 25, 877–889. [Google Scholar] [CrossRef]
- Di Lena, G.; Nevigato, T.; Rampacci, M.; Casini, I.; Caproni, R.; Orban, E. Proximate Composition and Lipid Profile of Red Mullet (Mullus Barbatus) from Two Sites of the Tyrrhenian and Adriatic Seas (Italy): A Seasonal Differentiation. J. Food Compos. Anal. 2016, 45, 121–129. [Google Scholar] [CrossRef]
- Passi, S.; Cataudella, S.; Di Marco, P.; De Simone, F.; Rastrelli, L. Fatty Acid Composition and Antioxidant Levels in Muscle Tissue of Different Mediterranean Marine Species of Fish and Shellfish. J. Agric. Food Chem. 2002, 50, 7314–7322. [Google Scholar] [CrossRef]
- Micah, A.D.; Wen, B.; Wang, Q.; Zhang, Y.; Yusuf, A.; Thierry, N.N.B.; Tokpanou, O.S.; Onimisi, M.M.; Adeyemi, S.O.; Gao, J.-Z.; et al. Effect of Dietary Astaxanthin on Growth, Body Color, Biochemical Parameters and Transcriptome Profiling of Juvenile Blood Parrotfish (Vieja Melanurus ♀ × Amphilophus Citrinellus ♂). Aquac. Rep. 2022, 24, 101142. [Google Scholar] [CrossRef]
- Fang, W.; Huang, J.; Li, S.; Lu, J. Identification of Pigment Genes (Melanin, Carotenoid and Pteridine) Associated with Skin Color Variant in Red Tilapia Using Transcriptome Analysis. Aquaculture 2022, 547, 737429. [Google Scholar] [CrossRef]
- Doolan, B.J.; Allan, G.L.; Booth, M.A.; Jones, P.L. Effect of Carotenoids and Background Colour on the Skin Pigmentation of Australian Snapper Pagrus Auratus (Bloch & Schneider, 1801). Aquac. Res. 2008, 39, 1423–1433. [Google Scholar] [CrossRef]
- Kaneva, A.M.; Potolitsyna, N.N.; Bojko, E.R. Variability of Values for the Atherogenic Index (ATH Index) in Healthy Men. Iran. J. Public Health 2021, 50, 1282–1284. [Google Scholar] [CrossRef] [PubMed]
- Khalili Tilami, S.; Kouřimská, L. Assessment of the Nutritional Quality of Plant Lipids Using Atherogenicity and Thrombogenicity Indices. Nutrients 2022, 14, 3795. [Google Scholar] [CrossRef]
- Fernandes, C.E.; da Vasconcelos, M.A.S.; de Almeida Ribeiro, M.; Sarubbo, L.A.; Andrade, S.A.C.; de Filho, A.B.M. Nutritional and Lipid Profiles in Marine Fish Species from Brazil. Food Chem. 2014, 160, 67–71. [Google Scholar] [CrossRef]
- El Khediri, S.; Fakhet, W.; Moulahi, T.; Khan, R.; Thaljaoui, A.; Kachouri, A. Improved Node Localization Using K-Means Clustering for Wireless Sensor Networks. Comput. Sci. Rev. 2020, 37, 100284. [Google Scholar] [CrossRef]
| Parameter | L1 | L2 | L3 | L4 | L5 |
|---|---|---|---|---|---|
| Length (cm) | 17.4 ± 0.9 a | 14.2 ± 0.6 b,c | 14.5 ± 0.7 b | 14.4 ± 1 b | 13.5 ± 0.8 c |
| Min–Max (cm) | 15.5–19.3 | 13.2–15.3 | 12.5–15.3 | 13.1–16.2 | 12.1–15.2 |
| Weight (g) | 59.7 ± 10.1 a | 30.8 ± 4.5 b | 33.3 ± 5 b | 33.1 ± 7.5 b | 27.5 ± 5.5 b |
| Min–Max (g) | 43.2–82.3 | 23.2–37.7 | 20.5–39.2 | 22.4–44.8 | 16.7–40 |
| Parameter | L1 | L2 | L3 | L4 | L5 |
|---|---|---|---|---|---|
| Moisture | 74.4 ± 2.7 a | 69.3 ± 2.1 a | 73.2 ± 5.1 a | 70.5 ± 4.7 a | 70 ± 4.1 a |
| Ash | 0.849 ± 0.017 c | 0.969 ± 0.021 b,c | 1.08 ± 0.05 b | 1.38 ± 0.05 a | 1.38 ± 0.07 a |
| Protein | 14.3 ± 0.9 a | 12 ± 0.8 b,c | 12.2 ± 0.7 b,c | 12.8 ± 0.4 a,b | 10.8 ± 0.3 c |
| Fat | 13.2 ± 0.9 c | 14.2 ± 0.3 b,c | 13.3 ± 0.3 c | 16.8 ± 1 a | 15.4 ± 0.3 a,b |
| Mineral | L1 | L2 | L3 | L4 | L5 |
|---|---|---|---|---|---|
| Aluminum (Al) | 86.4 ± 3.5 b | 33.4 ± 0.8 d | 62.2 ± 3.5 c | 96.4 ± 7.1 a,b | 107 ± 8 a |
| Arsenic (As) | 12.6 ± 0.5 c | 6.9 ± 0.3 d | 23.2 ± 1.5 b | 8.33 ± 0.24 d | 33 ± 1.1 a |
| Barium (Ba) | 5.93 ± 0.3 b | 3.12 ± 0.23 c | 3.53 ± 0.08 c | 5.9 ± 0.34 b | 6.95 ± 0.28 a |
| Beryllium (Be) | <LOD | <LOD | <LOD | <LOD | <LOD |
| Boron (B) | 17.7 ± 1 a | 6.4 ± 0.28 b | 18.4 ± 0.5 a | 17.5 ± 1 a | 16.9 ± 0.8 a |
| Cadmium (Cd) | <LOD | <LOD | <LOD | <LOD | <LOD |
| Calcium (Ca) | 18,023 ± 667 d | 24,611 ± 1624 c | 25,444 ± 1018 c | 45,631 ± 1734 a | 36,462 ± 1057 b |
| Chromium (Cr) | <LOD | <LOD | <LOD | <LOD | <LOD |
| Cobalt (Co) | <LOD | <LOD | <LOD | <LOD | <LOD |
| Copper (Cu) | <LOD | <LOD | <LOD | <LOD | <LOD |
| Iron (Fe) | 425 ± 31 d | 534 ± 40 c | 411 ± 24 d | 660 ± 15 b | 782 ± 16 a |
| Lead (Pb) | <LOD | <LOD | <LOD | <LOD | <LOD |
| Lithium (Li) | 102 ± 5 b | 66.7 ± 2.2 c | 36.5 ± 2.3 d | 108 ± 5 b | 145 ± 5 a |
| Magnesium (Mg) | 3324 ± 113 b | 3610 ± 245 b | 3462 ± 145 b | 6045 ± 151 a | 5917 ± 379 a |
| Manganese (Mn) | <LOD | <LOD | <LOD | 20.5 ± 1.1 a | 19.6 ± 0.7 a |
| Molybdenum (Mo) | <LOD | <LOD | 1.34 ± 0.05 b | 1.85 ± 0.06 a | <LOD |
| Nickel (Ni) | <LOD | <LOD | <LOD | <LOD | <LOD |
| Potassium (K) | 485 ± 14 c | 615 ± 22 b | 478 ± 29 c | 837 ± 22 a | 812 ± 27 a |
| Selenium (Se) | <LOD | <LOD | <LOD | <LOD | <LOD |
| Silver (Ag) | <LOD | <LOD | <LOD | <LOD | <LOD |
| Sodium (Na) | 19.5 ± 0.5 c | 20.9 ± 0.7 b,c | 22.9 ± 1.7 b | 36.2 ± 1.3 a | 38.4 ± 1.6 a |
| Strontium (Sr) | 101 ± 6 d | 154 ± 4 c | 145 ± 10 c | 254 ± 12 a | 213 ± 9 b |
| Thallium (Tl) | <LOD | <LOD | <LOD | <LOD | <LOD |
| Uranium (U) | <LOD | <LOD | <LOD | <LOD | <LOD |
| Vanadium (V) | 1.28 ± 0.08 c | <LOD | <LOD | 1.62 ± 0.1 b | 3.09 ± 0.08 a |
| Zinc (Zn) | 213 ± 13 d | 262 ± 5 c | 207 ± 14 d | 340 ± 12 b | 405 ± 16 a |
| Parameter | L1 | L2 | L3 | L4 | L5 |
|---|---|---|---|---|---|
| Vitamin A | 0.436 ± 0.022 a | 0.0793 ± 0.003 d | 0.102 ± 0.002 c,d | 0.181 ± 0.006 b | 0.111 ± 0.006 c |
| δ-Tocopherol | 4.14 ± 0.26 b | 3.95 ± 0.26 b | 3.59 ± 0.15 b | 2.87 ± 0.07 c | 6.09 ± 0.4 a |
| ∑ Tocopherols (Vitamin E) | 4.14 ± 0.26 b | 3.95 ± 0.26 b | 3.59 ± 0.15 b | 2.87 ± 0.07 c | 6.09 ± 0.4 a |
| Total Carotenoids | 4.09 ± 0.15 a | 1.76 ± 0.05 c | 2.28 ± 0.15 b | 2.49 ± 0.14 b | 2.19 ± 0.16 b |
| Ascorbic acid | 6.97 ± 0.36 c | 9.19 ± 0.63 a,b | 10.6 ± 0.5 a | 8.38 ± 0.52 b,c | 9.2 ± 0.66 a,b |
| FAME/Parameter | L1 | L2 | L3 | L4 | L5 |
|---|---|---|---|---|---|
| C8:0 | 0.0894 ± 0.0049 b | 0.11 ± 0.005 a | 0.106 ± 0.006 a | 0.0958 ± 0.006 a,b | 0.0813 ± 0.0056 b |
| C10:0 | 0.111 ± 0.006 a | 0.0327 ± 0.0008 c | 0.0206 ± 0.0007 d | 0.0185 ± 0.0006 d | 0.0419 ± 0.001 b |
| C11:0 | 0.11 ± 0.007 a | 0.0156 ± 0.0008 c | n.d. | n.d. | 0.0321 ± 0.0008 b |
| C12:0 | 0.198 ± 0.005 a | 0.097 ± 0.0057 b | 0.0988 ± 0.0052 b | 0.104 ± 0.002 b | 0.106 ± 0.008 b |
| C13:0 | 0.0451 ± 0.0014 a | 0.0294 ± 0.0009 c | 0.0334 ± 0.0009 b | 0.0318 ± 0.0017 b,c | 0.0459 ± 0.0021 a |
| C14:0 | 2.59 ± 0.18 a | 2.39 ± 0.17 a | 2.61 ± 0.15 a | 2.49 ± 0.13 a | 2.39 ± 0.16 a |
| C15:0 | 1.32 ± 0.09 a | 0.864 ± 0.022 b | 0.981 ± 0.042 b | 0.911 ± 0.031 b | 0.914 ± 0.028 b |
| C16:0 | 24.8 ± 0.6 a | 25.4 ± 0.97 a | 24.9 ± 1.6 a | 25.1 ± 1.7 a | 25.9 ± 1.2 a |
| C18:0 | 2.95 ± 0.22 a | 1.97 ± 0.07 b | 2.18 ± 0.06 b | 2.1 ± 0.09 b | 1.94 ± 0.11 b |
| C20:0 | 0.194 ± 0.015 c | 1.71 ± 0.04 b | 0.0887 ± 0.0059 d | 1.89 ± 0.04 a | 1.81 ± 0.04 a |
| C24:0 | 0.00509 ± 0.00033 a | 0.00529 ± 0.0002 a | n.d. | n.d. | 0.00522 ± 0.00037 a |
| ∑ SFA | 32.4 ± 1.2 a | 32.6 ± 1.3 a | 31 ± 1.9 a | 32.8 ± 2 a | 33.3 ± 1.5 a |
| C14:1 | 0.668 ± 0.031 a | 0.353 ± 0.008 c,d | 0.417 ± 0.013 b | 0.395 ± 0.025 b,c | 0.319 ± 0.007 d |
| C16:1 | 2.73 ± 0.19 a | 1.44 ± 0.03 b,c | 1.62 ± 0.1 b | 1.52 ± 0.09 b | 1.18 ± 0.05 c |
| C18:1 ω-9 cis | 27.5 ± 2 b | 30.9 ± 0.7 a,b | 29.1 ± 1.5 a,b | 30 ± 0.9 a,b | 32.2 ± 2.3 a |
| C18:1 ω-9 trans | 2.64 ± 0.1 a | 2.41 ± 0.06 a | 2.58 ± 0.12 a | 2.51 ± 0.14 a | 2.73 ± 0.2 a |
| C20:1 ω-9 | 0.218 ± 0.009 a | n.d. | n.d. | n.d. | n.d. |
| C24:1 ω-9 | 0.609 ± 0.004 d | 0.861 ± 0.004 c | 0.971 ± 0.003 a | 0.911 ± 0.006 b | 0.536 ± 0.004 e |
| ∑ MUFA | 34.4 ± 2.4 a | 36 ± 0.8 a | 34.7 ± 1.7 a | 35.3 ± 1.2 a | 36.9 ± 2.5 a |
| C18:2 ω-6 | 7.11 ± 0.16 a | 3.72 ± 0.27 b | 4 ± 0.09 b | 3.92 ± 0.25 b | 3.73 ± 0.19 b |
| C18:3 ω-6 | 3.76 ± 0.09 a | 1.89 ± 0.06 d | 2.19 ± 0.08 c | 2.12 ± 0.15 c,d | 2.55 ± 0.07 b |
| C18:3 ω-3 | 7.73 ± 0.35 a | 6.41 ± 0.36 b | 6.8 ± 0.33 b | 6.59 ± 0.13 b | 7.2 ± 0.3 a,b |
| C20:2 ω-6 | 2.45 ± 0.17 a | 0.464 ± 0.021 c | 1.87 ± 0.04 b | 0.562 ± 0.015 c | 0.583 ± 0.015 c |
| C20:4 ω-6 | 1.67 ± 0.08 a | n.d. | 0.668 ± 0.027 b | n.d. | n.d. |
| C20:5 ω-3 (EPA) | 1.22 ± 0.03 a | 0.946 ± 0.031 b | 1.02 ± 0.05 b | 1.03 ± 0.04 b | 0.939 ± 0.024 b |
| C22:6 ω-3 (DHA) | 9.25 ± 0.53 c | 18 ± 1.2 a | 17.7 ± 0.5 a | 17.7 ± 0.5 a | 14.8 ± 0.7 b |
| ∑ PUFA | 33.2 ± 1.4 a,b | 31.4 ± 2 a,b | 34.3 ± 1.1 a | 31.9 ± 1.1 a,b | 29.8 ± 1.3 b |
| ∑ UFA | 67.6 ± 3.8 a | 67.4 ± 2.8 a | 69 ± 2.8 a | 67.2 ± 2.3 a | 66.7 ± 3.8 a |
| ∑ ω-3 | 18.2 ± 0.91 b | 25.3 ± 1.6 a | 25.6 ± 0.9 a | 25.3 ± 0.7 a | 22.9 ± 1 a |
| ∑ ω-6 | 15 ± 0.5 a | 6.1 ± 0.3 c | 8.7 ± 0.2 b | 6.6 ± 0.4 c | 6.9 ± 0.3 c |
| ∑ ω-9 | 31 ± 2.1 a | 34.2 ± 0.7 a | 32.6 ± 1.6 a | 33.4 ± 1.1 a | 35.4 ± 2.5 a |
| ∑ EPA + DHA | 10.5 ± 0.6 c | 18.9 ± 1.3 a | 18.8 ± 0.5 a | 18.7 ± 0.6 a | 15.7 ± 0.7 b |
| ω-3:ω-6 | 1.21 ± 0.02 e | 4.17 ± 0.03 a | 2.93 ± 0.02 d | 3.83 ± 0.14 b | 3.34 ± 0.01 c |
| (SFA + MUFA):PUFA | 2.01 ± 0.02 c | 2.19 ± 0.07 b | 1.92 ± 0.04 c | 2.13 ± 0.03 b | 2.36 ± 0.04 a |
| AI | 0.524 ± 0.009 a | 0.521 ± 0.003 a | 0.514 ± 0.012 a | 0.524 ± 0.016 a | 0.534 ± 0.002 a |
| TI | 0.377 ± 0.007 a | 0.294 ± 0.004 c | 0.293 ± 0.008 c | 0.295 ± 0.011 c | 0.322 ± 0.001 b |
| HH | 2.29 ± 0.06 a | 2.32 ± 0 a | 2.39 ± 0.06 a | 2.32 ± 0.08 a | 2.28 ± 0.02 a |
| HPI | 1.91 ± 0.03 a | 1.92 ± 0.01 a | 1.94 ± 0.04 a | 1.91 ± 0.06 a | 1.87 ± 0.01 a |
| Parameters | Size | Composition | Bioactive Compounds | Minerals | Fatty Acids | Health Indices | Centroid |
|---|---|---|---|---|---|---|---|
| Size | – | 0.753 | 0.821 | 0.297 | 0.857 | 0.244 | 0.825 |
| Composition | – | 0.487 | 0.744 | 0.752 | 0.298 | 0.839 | |
| Bioactive compounds | – | 0.280 | 0.822 | 0.506 | 0.815 | ||
| Minerals | – | 0.488 | 0.585 | 0.708 | |||
| Fatty acids | – | 0.600 | 0.941 | ||||
| Health indices | – | 0.675 | |||||
| Centroid | – |
Disclaimer/Publisher’s Note: The statements, opinions and data contained in all publications are solely those of the individual author(s) and contributor(s) and not of MDPI and/or the editor(s). MDPI and/or the editor(s) disclaim responsibility for any injury to people or property resulting from any ideas, methods, instructions or products referred to in the content. |
© 2025 by the authors. Licensee MDPI, Basel, Switzerland. This article is an open access article distributed under the terms and conditions of the Creative Commons Attribution (CC BY) license (https://creativecommons.org/licenses/by/4.0/).
Share and Cite
Nita, R.-G.; Athanasiadis, V.; Kalompatsios, D.; Mantiniotou, M.; Alibade, A.; Salakidou, C.; Lalas, S.I. Red Mullet (Mullus barbatus) Collected from North and South Euboean Gulf, Greece: Fishing Location Effect on Nutritive Quality. Fishes 2025, 10, 115. https://doi.org/10.3390/fishes10030115
Nita R-G, Athanasiadis V, Kalompatsios D, Mantiniotou M, Alibade A, Salakidou C, Lalas SI. Red Mullet (Mullus barbatus) Collected from North and South Euboean Gulf, Greece: Fishing Location Effect on Nutritive Quality. Fishes. 2025; 10(3):115. https://doi.org/10.3390/fishes10030115
Chicago/Turabian StyleNita, Roxana-Georgiana, Vassilis Athanasiadis, Dimitrios Kalompatsios, Martha Mantiniotou, Aggeliki Alibade, Chrysanthi Salakidou, and Stavros I. Lalas. 2025. "Red Mullet (Mullus barbatus) Collected from North and South Euboean Gulf, Greece: Fishing Location Effect on Nutritive Quality" Fishes 10, no. 3: 115. https://doi.org/10.3390/fishes10030115
APA StyleNita, R.-G., Athanasiadis, V., Kalompatsios, D., Mantiniotou, M., Alibade, A., Salakidou, C., & Lalas, S. I. (2025). Red Mullet (Mullus barbatus) Collected from North and South Euboean Gulf, Greece: Fishing Location Effect on Nutritive Quality. Fishes, 10(3), 115. https://doi.org/10.3390/fishes10030115